

ABSTRACT
Methanobactins (MBs) are small (<1,300-Da) posttranslationally modified copper-binding peptides and represent the extracellular component of a copper acquisition system in some methanotrophs. Interestingly, MBs can bind a range of metal ions, with some being reduced after binding, e.g., Cu2+ reduced to Cu+. Other metal ions, however, are bound but not reduced, e.g., K+. The source of electrons for selective metal ion reduction has been speculated to be water but never empirically shown. Here, using H218O, we show that when MBs from Methylocystis sp. strain SB2 (MB-SB2) and Methylosinus trichosporium OB3b (MB-OB3) were incubated in the presence of either Au3+, Cu2, or Ag+, 18,18O2 and free protons were released. No 18,18O2 production was observed in the presence of either MB-SB2 or MB-OB3b alone, gold alone, copper alone, or silver alone or when K+ or Mo2+ was incubated with MB-SB2. In contrast to MB-OB3b, MB-SB2 binds Fe3+ with an N2S2 coordination and will also reduce Fe3+ to Fe2+. Iron reduction was also found to be coupled to the oxidation of 2H2O and the generation of O2. MB-SB2 will also couple Hg2+, Ni2+, and Co2+ reduction to the oxidation of 2H2O and the generation of O2, but MB-OB3b will not, ostensibly as MB-OB3b binds but does not reduce these metal ions. To determine if the O2 generated during metal ion reduction by MB could be coupled to methane oxidation, 13CH4 oxidation by Methylosinus trichosporium OB3b was monitored under anoxic conditions. The results demonstrate that O2 generation from metal ion reduction by MB-OB3b can support methane oxidation.
IMPORTANCE The discovery that MB will couple the oxidation of H2O to metal ion reduction and the release of O2 suggests that methanotrophs expressing MB may be able to maintain their activity under hypoxic/anoxic conditions through the “self-generation” of dioxygen required for the initial oxidation of methane to methanol. Such an ability may be an important factor in enabling methanotrophs to not only colonize the oxic-anoxic interface where methane concentrations are highest but also tolerate significant temporal fluctuations of this interface. Given that genomic surveys often show evidence of aerobic methanotrophs within anoxic zones, the ability to express MB (and thereby generate dioxygen) may be an important parameter in facilitating their ability to remove methane, a potent greenhouse gas, before it enters the atmosphere.
KEYWORDS: methanobactin, chalkophore, water oxidation, methanotroph, aerobic methane oxidation, gold nanoparticle
INTRODUCTION
Aerobic methane-oxidizing bacteria (methanotrophs) oxidize methane to carbon dioxide via a series of two-electron steps with methanol, formaldehyde, and formate as intermediates (1). The initial oxidation of methane to methanol is an oxygen- and energy-dependent reaction and is catalyzed by either a soluble cytoplasmic methane monooxygenase (sMMO) or a particulate or membrane-associated methane monooxygenase (pMMO) (1–8). The reductant for the initial oxidation of methane is supplied by NADH for the sMMO and by quinols for the pMMO (2, 3, 9–11). Methanol is oxidized to formaldehyde by a calcium- or rare-earth-dependent methanol dehydrogenase using a c-type cytochrome as an electron acceptor (12–17). Formaldehyde is either assimilated or oxidized using either NAD+ or quinone as the electron acceptor (10, 18–20). The final two-electron oxidation of formate to carbon dioxide is catalyzed by the NAD+-linked formate dehydrogenase (21–23). Electrons from NADH, quinol, or cytochrome c are either utilized in biosynthetic reactions or oxidized for energy using either dioxygen (11), nitrate (24), or ferric iron (25) as the terminal electron acceptor.
In methanotrophs capable of expressing both forms of the MMO, expression is regulated by copper (1, 9, 26–28). In addition to the MMOs, a number of genes are regulated by copper (1), and some methanotrophs of the Alphaproteobacteria have novel copper acquisition systems based on the extracellular copper-binding peptide methanobactin (MB) (29–31). MBs are low-molecular-mass (<1,300-Da), high-potential (Em of 483 to 745 mV) ribosomally synthesized posttranslationally modified peptides (RiPPs) and were the first examples of a chalkophore, i.e., a compound excreted by bacteria for the purpose of scavenging copper from the surrounding environment (30, 32). Structurally, MBs are divided into two groups. Both group I and II MBs are characterized by an internal oxazolone group with an associated thioamide and a second N-terminal 5- or 6-membered ring, which in group I MBs is either an oxazolone or a pyrazinedione group with an associated thioamide, while group II MBs have either an imidazoline or a pyrazinedione group with an associated thioamide (30, 32–36). The ring and associated thioamide are derived from an X-Cys dipeptide via a series of partially characterized posttranslational modifications (29, 31, 37). Group I MBs are characterized by an internal disulfide bridge and the copper-bound form of a dicyclic structure (32–34). Group II MBs lack this disulfide bridge, and the copper-bound form has a hairpin-like structure and is characterized by a central sulfonated threonine (30, 36).
In addition to copper ions, MBs will bind many metal ions (38–41) and reduce some but not all metal ions that are bound (38, 42). In MB from Methylosinus trichosporium OB3b (MB-OB3b), metal ions such as copper, silver, and gold are coordinated via an N2S2 ligand set utilizing an N from each ring and the two thioamides, and these metals are reduced after binding (30, 34, 38, 43). Other metal ions such as iron, nickel, and cobalt are coordinated via an N1S1 ligand set using one ring and its associated thioamide and are not reduced (38). Based on coordination, metals were classified as either group A metals coordinated by an N2S2 ligand set or group B metals coordinated by an N1S1 ligand set. In contrast, all of the metals bound by MB from Methylocystis sp. strain SB2 (MB-SB2) are coordinated by an N2S2 ligand set (39, 40, 42, 44; this study).
Since metal ion reduction assays are often carried out in unbuffered reaction mixtures in the absence of an external reductant, water has been proposed, but not shown, to be the electron donor (36). Here, we examine the binding and reduction of oxidized forms of gold (as HAuCl4), copper (as CuCl2), silver (as AgF), iron (as FeCl3), nickel (as NiCl2), mercury (HgCl2), cobalt (as CoCl2), and potassium (as KCl) in the presence and absence of H218O by MB-SB2 as well as the binding and reduction of gold, copper, and silver in the presence of H218O by MB-OB3b.
RESULTS
Spectral and thermodynamic properties of AuCl4− binding by MB-SB2.
UV-visible absorption, fluorescence, and circular dichroism spectra (see Fig. S1 to S3 in the supplemental material) and thermodynamic measurements (Fig. S4 and Table S1) demonstrate that changes following the addition of HAuCl4 to MB-SB2 were complex, with transitions being apparent at 0.25, 0.5, 0.75, 1.0, and 2.0 Au per MB-SB2. As MB-SB2 has only one identified metal-binding motif (i.e., an N2S2 ligand set), we therefore interpret these data to indicate changes in Au coordination, when MB-SB2 transitions from an oligomeric state(s) to a monomer.
The increased fluorescence emission intensity following HAuCl4 addition may be due to disruption of internal quenching between the imidazolone and oxazolone groups and is consistent with the intramolecular exciton transfer previously demonstrated following hydrolysis of the oxazolone group (42) (Fig. S2). The decreased fluorescence at HAuCl4/MB-SB2 ratios of >1.0 suggests direct metal quenching or intra-/interexciton transfer between the oxazolone and imidazolone groups or may be associated with nanoparticle formation, which occurs at Au/MB-SB2 ratios of >1:1.
As Au nanoparticle formation requires Au3+ reduction (45), nanoparticle formation (Fig. S5 and Table S2) by MB-SB2 indicated that MB-SB2 binds and reduces multiple Au3+ molecules to Au0. Such findings accentuated the need to determine the electron source for metal reduction by MBs. To extend these preliminary studies, we examined the reduction of HAuCl4 via MB-SB2 when dissolved in either H216O or H218O.
X-ray photoelectric spectroscopy, kinetics, and chloride determination.
In reaction mixtures containing HAuCl4 and MB-SB2 dissolved in H216O, MB-SB2 was observed to reduce AuCl4− to Au0 plus 4Cl−, as determined by X-ray photoelectric spectroscopy (XPS) and argentometric titrations, respectively (Fig. 1 and Table 1). MB-SB2 reduced up to 19 Au3+ to 19 Au0 with a time-dependent average Au3+-to-Au0 reduction rate of 0.3 ± 0.06 min−1 for those assays where rates could be determined. This time-dependent reduction was the reason why samples were frozen in liquid nitrogen and lyophilized overnight to stop the reaction and dry the samples for analysis. As observed with MB-OB3b (38), Au3+ and Au0 were the only oxidation states detected, indicating a direct three-electron reduction of HAuCl4 (Fig. 1).
FIG 1.
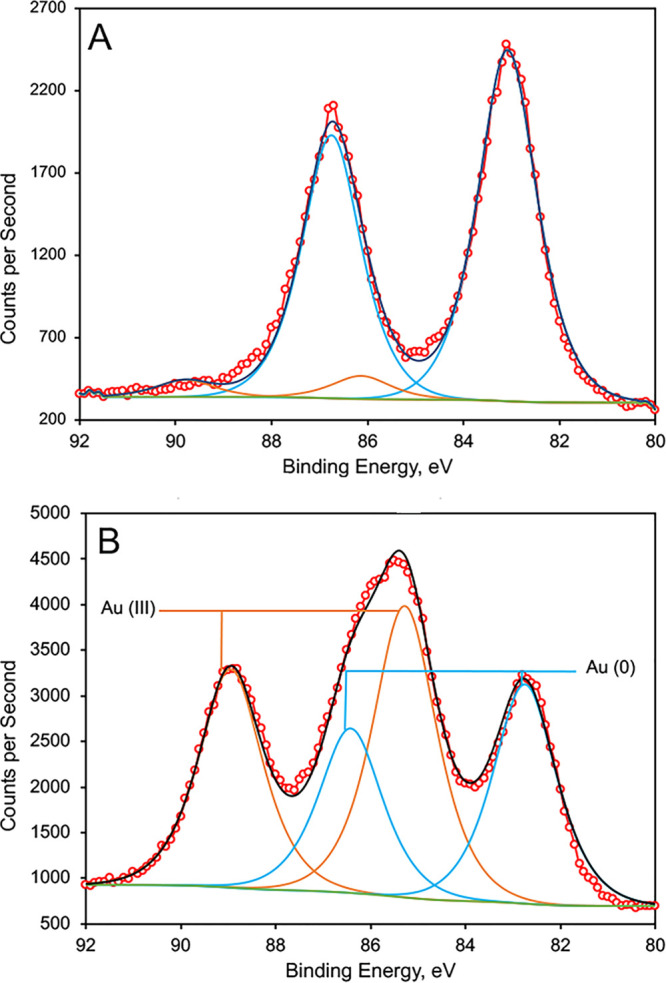
Gold X-ray photoelectric spectra of MS-SB2 at a gold/MB-SB2 molar ratio of 14 to 1 after a 30-min incubation (red circles) (A) and at a gold/MB-SB2 molar ratio of 19 to 1 after a 30-min incubation (B). Experimental results (circles) were fit with CASA XPS software to four Gaussian/Lorentzian curves, using two peaks for Au3+ (orange curves) and two peaks for Au0 (blue curves). Gold 4f core electrons are spin-orbit split as 4f7/2 and 4f5/2, with a splitting of 3.7 eV and area ratio of 4:3, so that only two peaks are independently fit: the 4f7/2 peaks for Au3+ and Au0. The 4f5/2 peaks’ positions and areas are determined by spin-orbit splitting; these parameters and the peak widths are fixed in the fitting program. The background used was of a Shirley type.
TABLE 1.
Distribution of Au as Au3+ and Au0 following incubation of MB-SB2 and HAuCl4a
| HAuCl4/MB-SB2 ratio | Time (min) | % Au3+ | % Au0 | Reduction rate (Au3+ reduced min−1) |
|---|---|---|---|---|
| 0.9 | 30 | 0 | 100 | |
| 2.25 | 30 | 0 | 100 | |
| 9 | 30 | 8 | 92 | 0.27 |
| 14 | 30 | 11 | 89 | 0.41 |
| 19 | 30 | 59 | 41 | 0.26 |
| 9 | 60 | 0 | 100 | |
| 14 | 60 | 0 | 100 | |
| 19 | 60 | 10 | 90 | 0.28 |
| 19 | 360 | 0 | 100 |
Reduction rates were determined from samples where <100% reduction was observed.
Kinetics of AuCl4− binding and reduction.
The time course for the binding of Au3+ to the oxazolone and imidazolone rings in MB-SB2 was measured as the decrease in the absorbances at 341 and 389 nm, respectively, following stopped-flow mixing of MB-SB2 with Au3+ at 4°C (Fig. 2A). Unfortunately, even at 4°C, initial binding rates could be determined only for the oxazolone ring since binding to the imidazolone ring was complete before the mixing of the sample was complete (1.4 ms). In contrast, the rates of binding to the oxazolone ring were low, 12 to 57 s−1, at Au3+/MB-SB2 ratios of <0.3 and increased at Au3+/MB-SB2 ratios of between 0.3 and 1.5 Au3+ per MB-SB2, up to a maximum rate of ∼1,600 s−1, followed by a decline in the rate at molar ratios of >1.5 Au3+ per MB-SB2 (Fig. 2A).
FIG 2.

(A) Kinetics of Au binding by MB-SB2 at 4°C. (A) Rate of HAuCl4 binding to the imidazolone (△) and oxazolone (○) rings of MB-SB2 at 4°C as measured from the absorbance changes at 386 nm and 341 nm, respectively. The rates for Au binding were >2,000 s−1 and were set at 2,000 s−1 in the figure. (B) Emission at 429 nm from SB2-MB following excitation at 341 nm after the addition of 0 (light blue), 0.25 (orange), 0.5 (gray), 0.75 (yellow), or 2.25 (dark blue) HAuCl4 per MB-SB2. a.u., arbitrary units.
Au3+ reduction rates (0.3 ± 0.06 min−1) (Table 1) were much lower than the initial binding rates (>2,000 s−1) (Fig. 2A). The difference may be due to the different rates of binding between the imidazolone and oxazolone groups. Monitoring the fluorescence changes over time at HAuCl4/MB-SB2 ratios of below 1:1 suggested that final Au coordination required several minutes to complete (Fig. 2B). At gold/MB-SB2 ratios of >1.0, an initial disruption of exciton coupling resulted in an increased fluorescence intensity followed by quenching (Fig. 2B). What is pertinent to this discussion is that Au initially binds primarily if not exclusively to the imidazolone group, followed by binding to the oxazolone group and a final reorientation. The time scales for these changes are in keeping with gold reduction rates.
Oxidation of H2O coupled to Au3+ reduction by MB-SB2.
As four Cl− molecules were generated in reaction mixtures for every HAuCl4 molecule reduced to Au0, chlorine was ruled out as a potential electron donor. To determine if H2O was the electron donor, H+ concentrations were monitored during HAuCl4 titrations of MB-SB2. Unfortunately, pH changes associated with the addition of HAuCl4 to unbuffered reaction mixtures made pH changes associated with the binding of AuCl4− difficult to determine (Fig. 3A). To examine if H2O could serve as an electron source for Au3+ reduction, 18,18O2 production was monitored in reaction mixtures containing 97% H218O. No 18,18O2 production was observed in reaction mixtures containing either MB-SB2 alone (Fig. 4A) or HAuCl4 alone (results not shown). However, following HAuCl4 addition to MB-SB2, 18,18O2 was observed, demonstrating the coupling of water oxidation with metal reduction (Fig. 4B and Fig. 5).
FIG 3.

(A) pH changes following the addition of HAuCl4 to aqueous solutions (gray triangles) or an aqueous solution of 40 μM MB-SB2 (yellow circles). (B) pH changes following the addition of CuCl2 to aqueous solutions (gray triangles) or an aqueous solution of 40 μM MB-SB2 (blue circles). (C) pH changes following the addition of KCl to aqueous solutions (gray triangles) or an aqueous solution of 40 μM MB-SB2 (black circles).
FIG 4.

Mass spectra of the headspace gas of a reaction mixture containing 2 mM MB-SB2 in 97% H218O (A) and following the addition of 20 mM HAuCl4 (B), 20 mM CuCl2 (C), 10 mM CuCl2 (D), 20 mM KCl (E), 20 mM AgF (F), 20 mM FeCl3 (G), 20 mM HgCl2 (H), 20 mM NiCl2 (I), and 20 mM CoCl2 (J).
FIG 5.
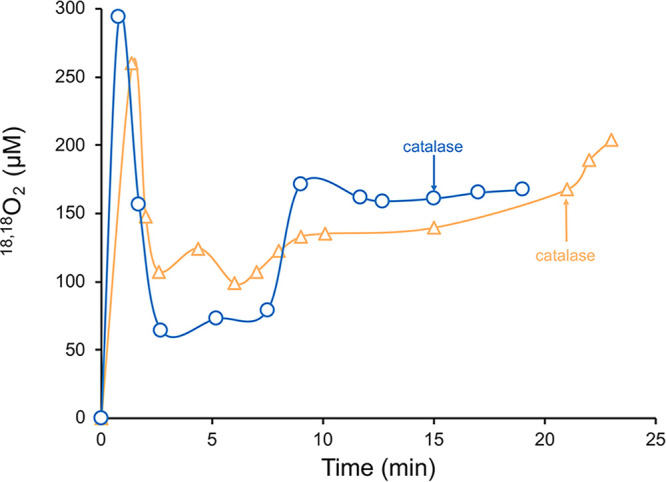
18,18O2 concentration in the headspace of a reaction mixture containing 2 mM MB-SB2 plus 20 mM HAuCl4 (yellow triangles) or 20 mM CuCl2 (light blue circles) in 97% H218O and following the addition of 7.3 mM catalase.
It should be noted that there is seemingly an electron imbalance, with three electrons being required for Au3+ to Au0, while four electrons are released for every two molecules of water oxidized. There are two possibilities to resolve this issue (46): (i) the reduction of four atoms of Au3+ is coupled to the oxidation of six molecules of water, and (ii) the reduction of one atom of Au3+ is coupled to the oxidation of two molecules of water, with the fourth electron being used to reduce dioxygen to superoxide. Assays show that reduced MB-SB2 will reduce dioxygen to superoxide (Table S3). Under the low-pH conditions following HAuCl4 addition to MB-SB2 (Fig. 3), superoxide would be expected to undergo dismutation reactions, generating H2O2 (47). In addition, as observed for MB-OB3b (48), Au–MB-SB2 complexes show superoxide dismutase activity (Table S3). Thus, H2O2 should appear in reaction mixtures if the fourth electron was used to reduce dioxygen. The rate of 18,18O2 production increased by approximately 18% following the addition of catalase, suggesting the production of H2O2 (Fig. 5).
Oxidation of H2O coupled to Cu2+ reduction by MB-SB2.
Although the oxidation of water to dioxygen coupled to Au3+ reduction is chemically interesting, it is not likely biologically relevant. To determine if the oxidation of H2O was specific to Au3+ reduction or a more general property of metal ion reduction by MB-SB2, similar experiments in H218O were carried out with CuCl2 as it is believed that the primary purpose of MB is the collection of copper critical for methanotrophic activity. Previous spectral and thermodynamic studies have shown that MB-SB2 will reduce multiple Cu2+ molecules to Cu+ in the absence of an external reductant, suggesting that water served as the reductant (42). 18,18O2 evolution was observed following the addition of CuCl2 to an H218O solution of MB-SB2 (Fig. 4C). Furthermore, such evolution followed a trend similar to that for HAuCl4, and a substantial pH drop was observed (Fig. 3B to Fig. 5). Perhaps of greater environmental relevance is the finding of substantial (>100 μM) evolution of dioxygen from water oxidation when MB-SB2 bound and reduced copper (Fig. 5).
The ratio of AuCl4− and Cu2+ to MB-SB2 in the experiments described above, as well as other metals showing 18,18O2 production (Fig. 4) described below, was 10:1. To determine the number of electrons needed to be extracted from MB-SB2 before water oxidation occurs, reaction mixtures containing 0.5, 1, 2, 3, 4, and 5 Cu2+ per MB-SB2 in 97% H218O were examined. No 18,18O2 was observed in samples containing 0.5, 1, 2, 3, or 4 Cu2+ per MB-SB2 (results not shown). 18,18O2 was observed in samples containing 5 Cu2+ per MB-SB2, indicating that for the initial water oxidation to occur, five electrons must be extracted from MB-SB2 (Fig. 4D).
K+ was also examined as a metal ion bound by MB-SB2 (Fig. S6A) but not reduced, as no evidence of the formation of metallic K0 was observed (49). No 18,18O2 was observed following the addition of KCl (Fig. 4E), and comparatively minor changes in pH (Fig. 3C) were observed, demonstrating that water oxidation by MB-SB2 after binding a metal ion is contingent upon that metal being reduced. MB-SB2 does not bind Mo2+ (Fig. S6B) and was used as a negative control. As expected, no 18,18O2 was observed in reaction mixtures containing NaMoO4 and MB-SB2 (results not shown).
Oxidation of H2O coupled to Ag+, Hg2+, Fe3, Ni2+, and Co2+ reduction by MB-SB2.
As described above, group A metal ions bound by MB-OB3b are reduced following binding. Ag+ and Hg2+ are group A metals; MB-SB2 bound both metals via an N2S2 coordination (Fig. S6C and D), and 18,18O2 was observed in reaction mixtures containing MB-SB2 and AgF (Fig. 4F) or HgCl2 (Fig. 4G) at levels similar to those observed with gold and copper.
In contrast to MB-OB3b (38), MB-SB2 binds all metal ions tested via an N2S2 coordination (39, 40, 42) (Fig. S6). Also, in contrast to MB-OB3b, MB-SB2 will reduce Fe3+ to Fe2+ at a rate of 1.02 ± 0.09 min−1 as measured via the ferrozine assay (50, 51) (Fig. 6A). In fact, MB-SB2 will dissolve insoluble Fe3+ hydroxides in the light (Fig. S6E, inset) or dark (Fig. 6C). The one-electron ferric iron reduction rate was approximately three times higher than the three-electron gold reduction rate. In reaction mixtures containing MB-SB2 and FeCl3 (Fig. 4H), 18,18O2 was observed at concentrations 1.3- ± 0.1-fold higher than those observed with Au3+ and Cu2+. 18,18O2 was also observed in reaction mixtures containing NiCl2 (Fig. 4I and Fig. S6F) or CoCl2 (Fig. 4H and Fig. S6G) and MB-SB2, although the concentration of 18,18O2 was consistently low with CoCl2.
FIG 6.

(A and B) Iron reductase activities of MB-SB2 (A) and MB-OB3b (B). The absorption change at 562 nm of reaction mixtures containing 1 mM ferrozine plus 10 mM FeCl3, 1 mM ferrozine plus 23.4 μM MB-SB2, 1 mM ferrozine plus 10 mM FeCl3, and either 5.8, 11.6, 17.4, or 23.4 μM MB-SB2 (A) or MB-OB3b (B) was measured. (C) Aqueous 4 M FeCl3 solution and 4 M FeCl3 solution plus 20 mM MB-SB2 4 h after the addition of MB-SB2.
Oxidation of H2O coupled to Au3+, Cu2+, and Ag+ reduction by MB-OB3b.
To determine if water oxidation coupled to metal ion reduction was specific to MB-SB2, a group II MB, or a more general property of MBs, water oxidation was examined in the group I MB from M. trichosporium OB3b (MB-OB3b) (31). Previous studies have shown that MB-OB3b binds and reduces Au3+, Cu2+, and Ag+ to Au0, Cu+, and Ag0, respectively, and binds but does not reduce Fe3+ (Fig. 6B) (38, 43). Thus, 18,18O2 production was monitored in reaction mixtures containing HAuCl4, CuCl2, AgF, and FeCl3 with or without MB-OB3b prepared in 97% H218O. Again, no 18,18O2 production was observed in reaction mixtures containing MB-OB3b either alone (Fig. 7A) or with HAuCl4, CuCl2, or AgF alone (results not shown). However, following HAuCl4 (Fig. 7B), CuCl2 (Fig. 7C), or AgF (Fig. 7D) addition to reaction mixtures containing MB-OB3b, 18,18O2 was observed, although the concentrations of 18,18O2 were <25% of the 18,18O2 concentrations produced in similar reactions with MB-SB2. No 18,18O2 was observed following FeCl3 addition to a reaction mixture containing MB-OB3b.
FIG 7.

Mass spectra of the headspace gas of a reaction mixture containing 2 mM MB-OB3b in 97% H218O (A) and following the addition of 20 mM HAuCl4 (B), 20 mM CuCl2 (C), and 20 mM AgF (D).
Methane oxidation coupled to O2 generated from Cu2+ reduction by MB-OB3b.
To determine if dioxygen generated during metal ion reduction could support methane oxidation by M. trichosporium OB3b, incubations with 13CH4 in the presence and absence of MB-OB3b and Cu2+ were performed under anoxic conditions in an anaerobic glove box. In cell suspensions with no additional amendments of either copper or MB-OB3b, 0.72 ± 0.17 μmol 13CO2 was observed after 3 days (assumed to be driven by the presence of residual dioxygen in the reaction mixtures [Fig. 8]). In cell suspensions amended with 25 μM Cu2+, 0.97 ± 0.03 μmol 13CO2 was observed (a 34% increase, not significantly different from the amount of 13CO2 measured with no amendment [P = 0.06]). If 5 μM MB-OB3b was added instead, 1.47 ± 0.08 μmol 13CO2 was measured (an increase of ∼104%, significantly higher than with no amendment [P = 2.2 × 10⁻³], presumably due to MB-OB3b binding and reducing metals that are part of the growth medium). If both 25 μM Cu and 5 μM MB-OB3b were added, 2.5 ± 0.37 μmol 13CO2 was observed, an increase of ∼250% from that with no amendment (again, significantly different [P = 1.5 × 10⁻³]), indicating that metal ion reduction by MB can support methane oxidation under anoxic conditions (Fig. 8).
FIG 8.
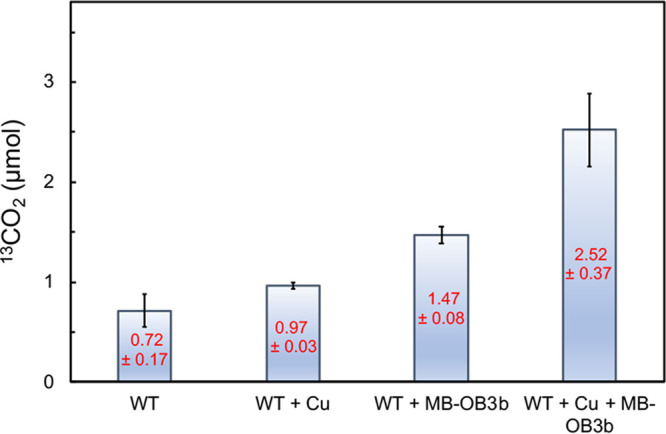
13CO2 production by the M. trichosporium OB3b wild type (WT), the WT plus 25 μM CuCl2, the WT plus 5 μM MB-OB3b, and the WT plus 25 μM CuCl2 and 5 μM MB-OB3b incubated in an anaerobic glove box for 3 days.
DISCUSSION
Metal ion binding by MBs has focused on MB-OB3b, a group I MB (34, 38, 43). MB-OB3b bound group A metal ions such as Cu2+, Au3+, Ag+, and Hg2+ via an N2S2 ligand set. Other metal ions such as Fe3+, Co2+, Cd2+, Mn2+, Ni2+, and Zn2+ showed an N1S1 coordination and were placed in group B. Of the metal ions examined, group A metals were reduced following binding, whereas group B metal ions were not. In this and previous reports (39, 40, 42, 44), MB-SB2, a group II MB, coordinates all metals bound via N2S2 coordination and reduced metals previously placed in groups A and B. With the exception of K+, metal ions bound via an N2S2 coordination are reduced, and here, we show that H2O can serve as an electron donor driving metal ion reduction.
The finding that MB, after binding specific metal ions, can split water to form dioxygen and that this reaction can drive methane oxidation under anoxic conditions suggests that this may be another strategy whereby aerobic methanotrophy can occur in an anoxic environment. That is, it has been shown that methane oxidation via aerobic methanotrophy occurs in anoxic zones of shallow lakes (i.e., at a depth of ∼10 m), with such activity being driven by oxygenic photosynthesis as sunlight could penetrate to this depth (52, 53). In these studies, it was found that methane oxidation rates increased in the light versus the dark, and such activity was abolished when a selective inhibitor of photosynthesis was added. Thus, it appears that methanotrophs can form very effective relationships with oxygenic photosynthetic microbes to scavenge trace amounts of dioxygen and, by so doing, enhance methane removal from these environments.
More germane to the findings here, however, is the discovery that aerobic methanotrophs were also active in deep lake water (∼160 m) where oxygenic photosynthesis is highly unlikely as sunlight cannot penetrate to this depth (54). Such activity, however, could be stimulated by the addition of dioxygen and oxidized metals. Here, it was concluded that methanotrophs may survive anoxic environments by utilizing alternative electron acceptors. Others have shown that aerobic methanotrophs of the Methylobacter genus can be stimulated in anoxic lake waters through the addition of either nitrate or sulfate (55). Indeed, it has been shown that some aerobic methanotrophs can respire nitrate (24) or ferric iron (25). Such a strategy could conserve trace amounts of dioxygen to enable methane oxidation by the MMOs. Alternatively, it has been shown that some methanotrophs will couple methane oxidation to fermentation to putatively conserve dioxygen (56), and such a strategy has been speculated to be responsible for methanotrophic activity in dioxygen-limited lakes (55). Finally, it has been speculated that alternatively or in conjunction, methanotrophs may form syntrophic partnerships with other microbes to facilitate methane oxidation (55) when dioxygen is limiting.
It should be noted, however, that in studies of methane oxidation in anoxic lake water samples, great care was taken to exclude any oxygen intrusion, and any trace amounts of oxygen present were quite small and could not explain the extent of methane oxidation observed. How these microbes then are able to oxidize methane in the absence of dioxygen is still unclear. That is, for the identified methanotrophs to oxidize methane, dioxygen is required for either form of MMO regardless of whether the alternative terminal electron acceptors can be used or an effective microbial partnership(s) can be formed. Thus, either unknown sources of dioxygen exist in these environments or these microbes possess some novel, as-yet-undescribed mechanism of anaerobic methane oxidation, i.e., novel forms of MMO that can utilize oxidized sulfur and nitrogen species in place of dioxygen.
Here, we present an alternative explanation for the presence and activity of aerobic methanotrophs in anoxic environments, particularly alphaproteobacterial methanotrophs. That is, genes for MB biosynthesis have been found only in the genomes of various Methylosinus and Methylocystis species of the Alphaproteobacteria (31). It has been repeatedly shown that these genera prefer high-methane/low-oxygen conditions found at the oxic-anoxic interface in situ (57, 58). Furthermore, they are the predominant methanotrophic genera present in completely anoxic zones of rice paddy soils (59). Thus, it is tempting to speculate that the ability to produce MB enables methanotrophs to colonize methane-rich environments by self-producing dioxygen to ensure that methane oxidation can continue even when ambient concentrations of dioxygen are quite low. Such a strategy is particularly important for methanotrophs that colonize the oxic-anoxic interface in soils because not only are these locations dark (thus excluding the possibility of methanotrophy/phototrophy synergy), this interface also shifts quickly in response to episodic precipitation and drying periods. As such, methanotrophs that colonize this interface must be prepared to tolerate periodic and possibly quite extended anoxic conditions. The ability to produce dioxygen from water would thus enable these microbes to continue to oxidize methane under anoxia, thereby generating ATP, as well as providing intermediates required for carbon assimilation (i.e., formaldehyde). Doing so would enable them to survive extended periods in the absence of oxygen, if not allowing for some continued growth under anoxic conditions.
It should be noted, however, that in the above-mentioned lake studies concluding that aerobic methanotrophy occurs in anoxic environments, gammaproteobacterial methanotrophs appeared to be predominantly responsible for methane oxidation, and to date, no representatives of this group have been shown to have the genes required for MB biosynthesis, although it is clear that at least some can and do secrete a copper-binding compound (60). It may be that these methanotrophs utilize dioxygen created by others via MB production (i.e., some sort of collaboration between gamma- and alphaproteobacteria as concluded between methanotrophs and oxygenic photosynthetic microbes) and/or can generate dioxygen via some unknown mechanism.
Finally, prior to the discovery of dioxygen production via the splitting of water by metal-MB complexes reported here, dioxygen production by biological systems has been observed in only four known pathways: oxygenic photosynthesis (61, 62), detoxification of oxygen radicals (63, 64), (per)chlorate respiration (65), and nitric oxide dismutation by “Candidatus Methylomirabilis oxyferans” of the NC10 phylum (66). The latter two mechanisms may provide some explanation for the significance of MB-mediated water oxidation. That is, it has been shown that dioxygen evolution from (per)chlorate respiration occurs when the intermediate chlorite is dismutated to chloride and dioxygen, and it is speculated that the dioxygen is then used for an antibiotic-producing monooxygenase in Haloferax volcanii (67). Furthermore, “Ca. Methylomirabilis oxyferans” is a methanotroph but respires nitrite rather than dioxygen. Interestingly, dioxygen is critical for its growth as this microbe utilizes the membrane-associated methane monooxygenase for methane oxidation to methanol (66). Stable-isotope studies showed that “Ca. Methylomirabilis oxyferans” dismutates nitric oxide to dinitrogen and dioxygen, the latter of which is used for methane oxidation (the mechanism[s] by which this occurs, however, is still unknown). It may be that MB-expressing aerobic methanotrophs perform a similar feat to ensure that there is adequate dioxygen for continued MMO activity under hypoxic/anoxic conditions.
In conclusion, the discovery of water oxidation by specific metal-methanobactin complexes not only is unusual but also implies a strategy whereby aerobic methanotrophs can survive, if not thrive, under anoxic conditions. As such, MB-driven dioxygen generation may be an important but hitherto unrecognized process whereby methane emissions are regulated.
MATERIALS AND METHODS
Materials.
Anhydrous CuCl2 (Acros Organics, Geel, Belgium), HAuCl4 (Acros Organics, Geel, Belgium), HgCl2 (Acros Organics, Geel, Belgium), AgF (Acros Organics, Geel, Belgium), FeCl3 (Acros Organics, Geel, Belgium), NiCl2 (Acros Organics, Geel, Belgium), CoCl2 (Acros Organics, Geel, Belgium), NaMoO4 (Sigma-Aldrich), and KCl (Sigma-Aldrich) were stored in a desiccator under Ar2. H218O was obtained from Cambridge Isotope Laboratories, Inc. (Andover, MA, USA), and 18,18O2 was obtained from Sigma-Aldrich. Ar2, 16,16O2, and chemically pure (CP)-grade CH4 were obtained from Airgas USA LLC. High-performance liquid chromatography (HPLC)-grade acetonitrile, methanol, and other reagents/chemicals were purchased from Fisher Scientific and used without additional purification. Dianion HP-20 was purchased from Sigma-Aldrich LLC.
Organisms, culture conditions, and isolation of methanobactin.
Methylocystis strain SB2 and M. trichosporium OB3b were cultured in nitrate mineral salts (NMS) medium (68) amended with either 0.2 or 1.0 μM CuSO4 to optimize the production of their methanobactin (MB-SB2). MB-SB2 was purified from the spent medium as previously described (69), with the following exception. The freeze-dried sample from the Dianion HP20 column was resuspended in deionized H2O and loaded onto a 250-mm by 20-mm Targa C18 column (Higgins Analytical, Inc., Mountain View, CA, USA) on an Azura HPLC system (Knauer, Berlin, Germany). MB-SB2 eluted in the 12 to 25% methanol fraction in a methanol-H2O gradient. The purified methanobactin was then freeze-dried as described above.
X-ray photoelectric spectroscopy.
X-ray photoelectric spectroscopy (XPS) was performed as previously described (38, 43), with the following modifications. Samples containing HAuCl4 and HAuCl4 plus MB-SB2 were dried onto highly oriented pyrolytic graphite by freeze-drying. The 1-cm2 graphite substrates were immersed in a solution containing either HAuCl4 or HAuCl4 plus MB-SB2, frozen in liquid nitrogen, and lyophilized overnight. The graphite was then mounted onto an XPS puck and analyzed. Other drying methods were employed, such as drying in air under a stream of He gas with a drying time of 30 min or filtering through a porous alumina filter followed by a 2-min drying time. However, samples produced by these methods showed additional reduction.
As previously observed (38), XPS analysis of Au was complicated by X-ray-induced reduction during the measurement process. Au 4f peak areas were therefore measured as a function of X-ray exposure, the peak areas for a given X-ray dose were determined using the CASA XPS fitting program, and the areas were plotted as a function of time. An exponential fit to the data using the Igor Pro fitting program allowed the determination of the unirradiated sample’s Au3+ and Au0 peak areas.
XPS measurements were carried out on a custom-designed system that incorporated a Specs hemispherical analyzer (Specs Scientific Instruments, Sarasota, FL, USA), an Al X-ray source, and a load lock to allow rapid sample exchanges.
Kinetics of Au3+ binding.
The rates of Au3+ binding to MB-SB2 were determined by measuring the absorption changes at 338 nm and 387 nm using a four-syringe Biologic SFM/4000/S stopped-flow reactor coupled to a MOS-500 spectrophotometer (Biologic Science Instrument SA, Claix, France) at 4°C as previously described (39). In contrast to the absorbance maxima using a Cary 50 spectrometer, the absorbance maximum for the oxazolone was 338 nm and that for the imidazolone ring was 387 nm with this system. Stock solutions of HAuCl4 were prepared in >18 MΩ · cm H2O. The stock solutions for MB-SB2 were prepared by dissolving freeze-dried MB-SB2 in >18 MΩ · cm H2O. Final concentrations of the stock solutions of MB-SB2 were determined after filtration by UV-visible absorption spectroscopy as previously described (39). The path length for the cuvette used in the Biologic SFM/4000/S stopped-flow reactor was 1.5 mm, and the dead time of the system was 1.4 ms. The system was cooled and maintained at 4°C. Reaction mixtures contained 400 μM MB-SB2 and either 40, 100, 200, 240, 280, 320, 360, 400, 600, 700, or 800 μM HAuCl4. Rates obtained for each concentration were averages from either 5 or 7 traces. The rates were determined by fitting the traces to the exponential function in Biokine operational software (Biologic Science Instrument SA). Binding rates were calculated in moles of Au bound per second per mole of MB-SB2 and are reported as the binding number (per second).
Fluorescence changes over time were monitored at 429 nm on a Cary Eclipse instrument (Agilent Technologies, Inc., Santa Clara, CA, USA) following excitation at 341 nm.
Water oxidation.
Saturated solutions of anhydrous CuCl2, HAuCl4, HgCl2, AgF, FeCl3, NiCl2, CoCl2, NaMoO4, and KCl were prepared in a Coy anaerobic chamber (atmosphere of 95% Ar and 5% H2) (Coy Laboratory Products, Ann Arbor, MI, USA). The oxidation of 2H2O to O2 plus 4H+ in reaction mixtures containing a metal ion and either MB-SB2 or MB-OB3b was determined by monitoring the production of 18,18O2, H+, and, in the case of HAuCl4, Cl−. In oxygen evolution experiments, freeze-dried MB-SB2, MB-OB3b, and catalase as well as an anhydrous metal stock solution were prepared in 97% H218O (Sigma-Aldrich, St. Louis, MO, USA) in 0.8-ml brown airtight vials (DWK Life Sciences, Millville, NJ, USA). Reaction mixtures contained 0 or 2 mM MB-SB2 or MB-OB3b and 0 to 20 mM metal ion in a final volume of 100 μl H218O. Reaction mixtures were prepared in 2-ml brown serum vials sealed with Teflon-lined silicone septa. Initial experiments were performed with aluminum foil-wrapped vials, but that practice was discontinued once it was clear that identical results were produced regardless of whether the vials were wrapped or not. The generation of 18,18O2 from H218O was monitored by the direct injection (1 μl or 2 μl) of headspace.
Gas samples were manually injected into an Agilent (Santa Clara, CA, USA) 7890B gas chromatography (GC) system with a 7250 accurate-mass quadrupole time of flight (Q-TOF) GC-mass spectrometry (MS) system and a DB5-ms column. Except for the 18,18O2 injections for standard curves, all injection volumes were 1 μl using gastight Hamilton syringes. Standard curves were generated with 1-μl, 1.5-μl, and 2-μl injections of 97% 18,18O2 (Sigma-Aldrich, St. Louis, MO, USA). The headspace in the vials was sampled before and after the addition of the metals, as was the outside air in the mass spectroscopy instrument, as controls. After the standards and controls were injected, the samples were mixed, and headspace samples were immediately collected, with subsequent samples being taken every 30 to 60 s. After several minutes, collection slowed to 1 sample every 2 to 3 min. The quantization of generated 18,18O2 came from an extracted-ion chromatogram set to 35.9978 Da. A small shift in the MS location of the 18,18O2 was observed on some dates. If a drift in the MS location of 18,18O2 was observed, the identity of the peak was verified with the 97% 18,18O2 standard.
Oxidase, superoxide dismutase, hydrogen peroxide reductase, and iron reductase activities and pH measurements.
Oxidase, superoxide dismutase, and hydrogen peroxide reductase activities were determined as previously described by Choi et al. (48). A ferrozine assay was used to determine iron reductase activity (50, 51).
pH changes during metal titrations were monitored on either a PHM 220 pH meter with a pH2005-7 combined pH electrode (Radiometer Analytical, Villeurbanne, France) or an Oakton Ion 700 pH meter (Cole-Parmer, Vernon Hills, IL, USA).
Free chloride produced from the binding and deduction of HAuCl4 to Au0 was measured via argentometric titration (70). HAuCl4–MB-SB2 solutions were prepared at a molar ratio of 9:1 and incubated for at least 72 h. Following the incubation period, the solution was titrated with a standardized AgNO3 solution, delivered with a ramé-hart 2.0-ml microsyringe. The titration processes were monitored with a custom-made Ag wire working electrode and an Ag/AgCl reference electrode.
Methane oxidation coupled to O2 generated from Cu2+ reduction by MB-OB3b. (i) Sample preparation.
M. trichosporium OB3b was grown on NMS medium (68) at 30°C in a 250-ml sidearm flask sealed with rubber stoppers. Cultures were shaken at 200 rpm under a methane-to-air ratio of 1:2 until the mid-exponential phase (optical density at 600 nm [OD600] of ∼0.3) was reached. Two milliliters of the cell culture was then transferred to 8.5-ml serum vials containing a Teflon-coated magnetic stir bar. Four separate conditions were used: (i) M. trichosporium OB3b with no amendments, (ii) M. trichosporium OB3b plus 25 μM copper (5 μl added from a filter-sterilized [0.22-μm] 10 mM stock solution of CuCl2), (iii) M. trichosporium OB3b plus 5 μM MB-OB3b (10 μl added from a filter-sterilized [0.22-μm] 1 mM stock solution of MB-OB3b), and (iv) M. trichosporium OB3b plus 25 μM copper and 5 μM MB-OB3b. Biological triplicate samples were prepared for all conditions. The vials were then crimp sealed and degassed using prepurified-grade filter-sterilized (0.22-μm) nitrogen gas (N2 [99.998%]) for 20 min at a flow rate of 3.42 ml/s using 22- and 25-gauge needles for N2 gas flow in and out. After degassing, the needles were removed, and the samples were immediately placed in an anaerobic chamber filled with an H2-N2 gas mixture (1:9 mixing ratio). Once in the anaerobic chamber, 1 ml of 13C-labeled methane (13CH4 [99%]) (Sigma-Aldrich, St. Louis, MO) was added using a 10-ml gastight syringe (Hamilton Company, Reno, NV). Vacuum grease was then spread on the top of the sealed septa. The vials were finally covered with aluminum foil and incubated inverted (septum side down) on a magnetic stir plate in the anaerobic chamber for 3 days at 25°C.
(ii) Gas chromatography-mass spectrometry analysis.
GC-MS analyses were performed using an Agilent 7890B gas chromatograph system coupled with an Agilent 5977B single-quadrupole mass spectrometer (Agilent Technologies, Santa Clara, CA, USA). A Carboxen-1010 Plot capillary column (30 m by 0.32 mm) was used for separation (Supelco, Bellefonte, PA). Ten microliters of the headspace gas of each sample was injected manually using a 25-μl gastight syringe (Hamilton Company, Reno, NV). GC system conditions were as follows: He as the carrier gas at a flow rate of 10 ml/min, split injection with a split ratio of 5:1, an inlet temperature of 170°C, and an oven temperature maintained at 145°C throughout the analysis. The mass spectrometry ion source and quadrupole temperatures were 250°C and 200°C, respectively. Under these conditions, 13CH4 and 13CO2 were detected at 2.16 min and 2.86 min, respectively. Data were acquired in selected ion monitoring (SIM) mode, monitoring m/z 17 for 13CH4 and m/z 45 for 13CO2.
ACKNOWLEDGMENTS
This research was supported by the U.S. Department of Energy Office of Science (grant number DE-SC0020174 to J.D.S. and A.A.D.), the National Science Foundation (grant number 1912482 to J.D.S.), the Materials Science and Engineering Center at UW-Eau Claire (M.T.M.), and ISU Bailey Research and Career Development (T.A.B.). The use of ITC and the Biologic SFM/4000 stopped-flow reactor coupled to a MOS-500 spectrophotometer was made possible through a generous gift from the Roy J. Carver Charitable Trust (Muscatine, IA).
We declare that we have no competing interests.
Footnotes
Supplemental material is available online only.
Contributor Information
Alan A. DiSpirito, Email: aland@iastate.edu.
Rebecca E. Parales, University of California, Davis
REFERENCES
- 1.Semrau JD, DiSpirito AA, Yoon S. 2010. Methanotrophs and copper. FEMS Microbiol Rev 34:496–531. 10.1111/j.1574-6976.2010.00212.x. [DOI] [PubMed] [Google Scholar]
- 2.Basu P, Katterle B, Andersson KK, Dalton H. 2003. The membrane-associated form of methane mono-oxygenase from Methylococcus capsulatus (Bath) is a copper/iron protein. Biochem J 369:417–427. 10.1042/bj20020823. [DOI] [PMC free article] [PubMed] [Google Scholar]
- 3.Choi DW, Kunz RC, Boyd ES, Semrau JD, Antholine WE, Han JI, Zahn JA, Boyd JM, de la Mora AM, DiSpirito AA. 2003. The membrane-associated methane monooxygenase (pMMO) and pMMO-NADH:quinone oxidoreductase complex from Methylococcus capsulatus Bath. J Bacteriol 185:5755–5764. 10.1128/JB.185.19.5755-5764.2003. [DOI] [PMC free article] [PubMed] [Google Scholar]
- 4.Elango N, Radhakrishnan R, Froland WA, Wallar BJ, Earhart CA, Lipscomb JD, Ohlendorf DH. 1997. Crystal structure of the hydroxylase component of methane monooxygenase from Methylosinus trichosporium OB3b. Protein Sci 6:556–568. 10.1002/pro.5560060305. [DOI] [PMC free article] [PubMed] [Google Scholar]
- 5.Fox BG, Hendrich MP, Surerus KK, Andersson KK, Froland WA, Lipscomb JD, Münck E. 1993. Mössbauer, EPR, and ENDOR studies of the hydroxylase and reductase components of methane monooxygenase from Methylosinus trichosporium Ob3b. J Am Chem Soc 115:3688–3701. 10.1021/ja00062a039. [DOI] [Google Scholar]
- 6.Lipscomb JD. 1994. Biochemistry of the soluble methane monooxygenase. Annu Rev Microbiol 48:371–399. 10.1146/annurev.mi.48.100194.002103. [DOI] [PubMed] [Google Scholar]
- 7.Colby J, Dalton H. 1978. Resolution of the methane monooxygenase of Methylococcus capsulatus (Bath) into three components. Purification and properties of component C, a flavoprotein. Biochem J 171:461–468. 10.1042/bj1710461. [DOI] [PMC free article] [PubMed] [Google Scholar]
- 8.Lieberman RL, Rosenzweig AC. 2005. Crystal structure of a membrane-bound metalloenzyme that catalyses the biological oxidation of methane. Nature 434:177–182. 10.1038/nature03311. [DOI] [PubMed] [Google Scholar]
- 9.Dalton H, Prior SD, Leak DJ, Stanley SH. 1984. Regulation and control of methane monooxygenase, p 75–82. In Crawford RL, Hanson RS (ed), Microbial growth in C1 compounds. Proceedings of the 4th International Symposium. American Society for Microbiology, Washington, DC. [Google Scholar]
- 10.Zahn JA, Bergmann DJ, Boyd JM, Kunz RC, DiSpirito AA. 2001. Membrane-associated quinoprotein formaldehyde dehydrogenase from Methylococcus capsulatus Bath. J Bacteriol 183:6832–6840. 10.1128/JB.183.23.6832-6840.2001. [DOI] [PMC free article] [PubMed] [Google Scholar]
- 11.DiSpirito AA, Kunz RC, Choi DW, Zahn JA. 2004. Electron flow during methane oxidation in methanotrophs, p 141–169. In Zannoni D (ed), Respiration in archaea and bacteria. Kluwer Scientific, Dordrecht, The Netherlands. [Google Scholar]
- 12.Picone N, Op den Camp HJM. 2019. Role of rare earth elements in methanol oxidation. Curr Opin Chem Biol 49:39–44. 10.1016/j.cbpa.2018.09.019. [DOI] [PubMed] [Google Scholar]
- 13.Anthony C. 1982. The biochemistry of methylotrophs. Academic Press, London, United Kingdom. [Google Scholar]
- 14.Anthony C. 1992. The structure of bacterial quinoprotein dehydrogenases. Int J Biochem 24:29–30. 10.1016/0020-711X(92)90226-Q. [DOI] [PubMed] [Google Scholar]
- 15.Williams PA, Coates L, Mohammed F, Gill R, Erskine PT, Coker A, Wood SP, Anthony C, Cooper JB. 2005. The atomic structure of methanol dehydrogenase from Methylobacterium extorquens. Acta Crystallogr D Biol Crystallogr 61:75–79. 10.1107/S0907444904026964. [DOI] [PubMed] [Google Scholar]
- 16.Read J, Gill R, Dales SL, Cooper JB, Wood SP, Anthony C. 1999. The molecular structure of an unusual cytochrome c2 determined at 2.0 Å; the cytochrome cH from Methylobacterium extorquens. Protein Sci 8:1232–1240. 10.1110/ps.8.6.1232. [DOI] [PMC free article] [PubMed] [Google Scholar]
- 17.DiSpirito AA, Lipscomb JD, Lidstrom ME. 1990. Soluble cytochromes from the marine methanotroph Methylomonas sp. strain A4. J Bacteriol 172:5360–5367. 10.1128/JB.172.9.5360-5367.1990. [DOI] [PMC free article] [PubMed] [Google Scholar]
- 18.Vorholt JA. 2002. Cofactor-dependent pathways of formaldehyde oxidation in methylotrophic bacteria. Arch Microbiol 178:239–249. 10.1007/s00203-002-0450-2. [DOI] [PubMed] [Google Scholar]
- 19.Vorholt JA, Chistoserdova L, Lidstrom ME, Thauer RK. 1998. The NADP-dependent methylene tetrahydromethanopterin dehydrogenase in Methylobacterium extorquens AM1. J Bacteriol 180:5351–5356. 10.1128/JB.180.20.5351-5356.1998. [DOI] [PMC free article] [PubMed] [Google Scholar]
- 20.Vorholt JA, Chistoserdova L, Stolyar SM, Thauer RK, Lidstrom ME. 1999. Distribution of tetrahydromethanopterin-dependent enzymes in methylotrophic bacteria and phylogeny of methenyl tetrahydromethanopterin cyclohydrolases. J Bacteriol 181:5750–5757. 10.1128/JB.181.18.5750-5757.1999. [DOI] [PMC free article] [PubMed] [Google Scholar]
- 21.Jollie DR, Lipscomb JD. 1990. Formate dehydrogenase from Methylosinus trichosporium OB3b. Methods Enzymol 188:331–334. 10.1016/0076-6879(90)88051-b. [DOI] [PubMed] [Google Scholar]
- 22.Jollie DR, Lipscomb JD. 1991. Formate dehydrogenase from Methylosinus trichosporium OB3b. J Biol Chem 266:21853–21863. 10.1016/S0021-9258(18)54716-5. [DOI] [PubMed] [Google Scholar]
- 23.Yoch DC, Chen Y-P, Hardin MG. 1990. Formate dehydrogenase from the methane oxidizer Methylosinus trichosporium OB3b. J Bacteriol 172:4456–4463. 10.1128/JB.172.8.4456-4463.1990. [DOI] [PMC free article] [PubMed] [Google Scholar]
- 24.Kits KD, Klotz MG, Stein LY. 2015. Methane oxidation coupled to nitrate reduction under hypoxia by gammaproteobacterium Methylomonas denitrificans, sp. nov. type strain FJG1. Environ Microbiol 17:3219–3232. 10.1111/1462-2920.12772. [DOI] [PubMed] [Google Scholar]
- 25.Sheng Y, Wang H, Liu Y, Zhu B, Li J, Yang Y, Qin W, Chen L, Wu X, Chistoserdova L, Zhao F. 2020. Methane-dependent mineral reduction by aerobic methanotrophs under hypoxia. Environ Sci Technol Lett 7:606–612. 10.1021/acs.estlett.0c00436. [DOI] [Google Scholar]
- 26.Csaki R, Bodrossy L, Klem J, Murrell JC, Kovacs KL. 2003. Genes involved in the copper-dependent regulation of soluble methane monooxygenase of Methylococcus capsulatus (Bath): cloning, sequencing and mutational analysis. Microbiology 149:1785–1795. 10.1099/mic.0.26061-0. [DOI] [PubMed] [Google Scholar]
- 27.Murrell JC, McDonald IR, Gilbert B. 2000. Regulation of expression of methane monooxygenases by copper ions. Trends Microbiol 8:221–225. 10.1016/S0966-842X(00)01739-X. [DOI] [PubMed] [Google Scholar]
- 28.Prior SD, Dalton H. 1985. Copper stress underlines the fundamental change in intracellular location of the membrane monooxygenase in methane oxidizing organisms: studies in batch and continuous culture. J Gen Microbiol 131:155–163. [Google Scholar]
- 29.DiSpirito AA, Semrau JD, Murrell JC, Gallagher WH, Dennison C, Vuilleumier S. 2016. Methanobactin and the link between copper and bacterial methane oxidation. Microbiol Mol Biol Rev 80:387–409. 10.1128/MMBR.00058-15. [DOI] [PMC free article] [PubMed] [Google Scholar]
- 30.El Ghazouani A, Basle A, Gray J, Graham DW, Firbank SJ, Dennison C. 2012. Variations in methanobactin structure influences copper utilization by methane-oxidizing bacteria. Proc Natl Acad Sci U S A 109:8400–8404. 10.1073/pnas.1112921109. [DOI] [PMC free article] [PubMed] [Google Scholar]
- 31.Semrau JD, DiSpirito AA, Obulisamy PK, Kang-Yun CS. 2020. Methanobactin from methanotrophs: genetics, structure, function and potential applications. FEMS Microbiol Lett 367:fnaa045. 10.1093/femsle/fnaa045. [DOI] [PubMed] [Google Scholar]
- 32.Kim HJ, Graham DW, DiSpirito AA, Alterman MA, Galeva N, Larive CK, Asunskis D, Sherwood PMA. 2004. Methanobactin, a copper-acquisition compound from methane-oxidizing bacteria. Science 305:1612–1615. 10.1126/science.1098322. [DOI] [PubMed] [Google Scholar]
- 33.Behling LA, Hartsel SC, Lewis DE, DiSpirito AA, Choi DW, Masterson LR, Veglia G, Gallagher WH. 2008. NMR, mass spectrometry and chemical evidence reveal a different chemical structure for methanobactin that contains oxazolone rings. J Am Chem Soc 130:12604–12605. 10.1021/ja804747d. [DOI] [PMC free article] [PubMed] [Google Scholar]
- 34.El Ghazouani A, Basle A, Firbank SJ, Knapp CW, Gray J, Graham DW, Dennison C. 2011. Copper-binding properties and structures of methanobactins from Methylosinus trichosporium OB3b. Inorg Chem 50:1378–1391. 10.1021/ic101965j. [DOI] [PubMed] [Google Scholar]
- 35.Kenney GE, Goering AW, Ross MO, DeHart CJ, Thomas PM, Hoffman BM, Kelleher NL, Rosenzweig AC. 2016. Characterization of methanobactin from Methylosinus sp. SW4. J Am Chem Soc 138:11124–11127. 10.1021/jacs.6b06821. [DOI] [PMC free article] [PubMed] [Google Scholar]
- 36.Krentz BD, Mulheron HJ, Semrau JD, DiSpirito AA, Bandow NL, Haft DH, Vuilleumier S, Murrell JC, McEllistrem MT, Hartsel SC, Gallagher WH. 2010. A comparison of methanobactins from Methylosinus trichosporium OB3b and Methylocystis strain SB2 predicts methanobactins are synthesized from diverse peptide precursors modified to create a common core for binding and reducing copper ions. Biochemistry 49:10117–10130. 10.1021/bi1014375. [DOI] [PMC free article] [PubMed] [Google Scholar]
- 37.Gu W, Baral BS, DiSpirito AA, Semrau JD. 2017. An aminotransferase is responsible for the deamination of the N-terminal leucine and required for formation of oxazolone ring A in methanobactin of Methylosinus trichosporium OB3b. Appl Environ Microbiol 83:e02619-16. 10.1128/AEM.02619-16. [DOI] [PMC free article] [PubMed] [Google Scholar]
- 38.Choi DW, Do YS, Zea CJ, McEllistrem MT, Lee SW, Semrau JD, Pohl NL, Kisting CJ, Scardino LL, Hartsel SC, Boyd ES, Geesey GG, Riedel TP, Shafe PH, Kranski KA, Tritsch JR, Antholine WE, DiSpirito AA. 2006. Spectral and thermodynamic properties of Ag(I), Au(III), Cd(II), Co(II), Fe(III), Hg(II), Mn(II), Ni(II), Pb(II), U(IV), and Zn(II) binding by methanobactin from Methylosinus trichosporium OB3b. J Inorg Biochem 100:2150–2161. 10.1016/j.jinorgbio.2006.08.017. [DOI] [PubMed] [Google Scholar]
- 39.Baral BS, Bandow NL, Vorobev A, Freemeier BC, Bergman BH, Herdendorf T, Fuentes N, Ellias L, Turpin E, Semrau JD, DiSpirito AA. 2014. Mercury binding by methanobactin from Methylocystis strain SB2. J Inorg Biochem 141:161–169. 10.1016/j.jinorgbio.2014.09.004. [DOI] [PubMed] [Google Scholar]
- 40.Bandow NL. 2014. Isolation and binding properties of methanobactin from the facultative methanotroph Methylocystis strain SB2. PhD thesis. Iowa State University, Ames, IA. [DOI] [PubMed] [Google Scholar]
- 41.Lu X, Gu W, Zhao L, Farhan Ul Haque M, DiSpirito AA, Semrau JD, Gu B. 2017. Methylmercury uptake and degradation by methanotrophs. Sci Adv 3:e1700041. 10.1126/sciadv.1700041. [DOI] [PMC free article] [PubMed] [Google Scholar]
- 42.Bandow N, Gilles VS, Freesmeier B, Semrau JD, Krentz B, Gallagher W, McEllistrem MT, Hartse SC, Cho DW, Hargrove MS, Heard TM, Chesner LM, Braunreiter KM, Cao BV, Gavitt MM, Hoopes JZ, Johnson JM, Polster EM, Schoenick BD, Umlauf AM, DiSpirito AA. 2012. Spectral and copper binding properties of methanobactin from the facultative methanotroph Methylocystis strain SB2. J Inorg Biochem 110:72–82. 10.1016/j.jinorgbio.2012.02.002. [DOI] [PubMed] [Google Scholar]
- 43.Choi DW, Zea CJ, Do YS, Semrau JD, Antholine WE, Hargrove MS, Pohl NL, Boyd ES, Geesey GG, Hartsel SC, Shafe PH, McEllistrem MT, Kisting CJ, Campbell D, Rao V, de la Mora AM, DiSpirito AA. 2006. Spectral, kinetic, and thermodynamic properties of Cu(I) and Cu(II) binding by methanobactin from Methylosinus trichosporium OB3b. Biochemistry 45:1442–1453. 10.1021/bi051815t. [DOI] [PubMed] [Google Scholar]
- 44.Baral BS. 2017. Methanobactin: metal binding properties, physiological function and biosynthesis. PhD thesis. Iowa State University, Ames, IA. [Google Scholar]
- 45.Zhao P, Li N, Astruc D. 2013. State of the art in gold nanoparticle synthesis. Coord Chem Rev 257:638–665. 10.1016/j.ccr.2012.09.002. [DOI] [Google Scholar]
- 46.Chatwood LL, Müller J, Gross JD, Wagner G, Lippard SJ. 2004. NMR structure of the flavin domain from soluble methane monooxygenase reductase from Methylococcus capsulatus (Bath). Biochemistry 43:11983–11991. 10.1021/bi049066n. [DOI] [PubMed] [Google Scholar]
- 47.Hayyan M, Hashim MA, AlNashef IM. 2016. Superoxide ion: generation and chemical implications. Chem Rev 116:3029–3065. 10.1021/acs.chemrev.5b00407. [DOI] [PubMed] [Google Scholar]
- 48.Choi DW, Semrau JD, Antholine WE, Hartsel SC, Anderson RC, Carey JN, Dreis AM, Kenseth EM, Renstrom JM, Scardino LL, Van Gorden GS, Volkert AA, Wingad AD, Yanzer PJ, McEllistrem MT, de la Mora AM, DiSpirito AA. 2008. Oxidase, superoxide dismutase, and hydrogen peroxide reductase activities of methanobactin from types I and II methanotrophs. J Inorg Biochem 102:1571–1580. 10.1016/j.jinorgbio.2008.02.003. [DOI] [PubMed] [Google Scholar]
- 49.Latimer WM, Hildebrand JH. 1940. Reference book of inorganic chemistry. The Macmillan Co, New York, NY. [Google Scholar]
- 50.Carter P. 1971. Spectrometric determination of serum iron at the submicrogram level with a new reagent (ferrozine). Anal Biochem 40:450–458. 10.1016/0003-2697(71)90405-2. [DOI] [PubMed] [Google Scholar]
- 51.Moody MD, Dailey HA. 1983. Aerobic ferrisiderophore reductase assay and activity stain for native polyacrylamide gels. Anal Biochem 134:235–239. 10.1016/0003-2697(83)90290-7. [DOI] [PubMed] [Google Scholar]
- 52.Milucka J, Kirf M, Lu L, Krupke A, Lam P, Littmann S, Kuypers MMM, Schubert CJ. 2015. Methane oxidation coupled to oxygenic photosynthesis in anoxic waters. ISME J 9:1991–2002. 10.1038/ismej.2015.12. [DOI] [PMC free article] [PubMed] [Google Scholar]
- 53.Oswald K, Milucka J, Brand A, Littmann S, Wehrli B, Kuypers MMM, Schubert CJ. 2015. Light-dependent aerobic methane oxidation reduces methane emissions from seasonally stratified lakes. PLoS One 10:e0132574. 10.1371/journal.pone.0132574. [DOI] [PMC free article] [PubMed] [Google Scholar]
- 54.Oswald K, Jegge C, Tischer J, Berg J, Brand A, Miracle MR, Soria X, Vicente E, Lehmann M, Zopfi J, Schubert CJ. 2016. Methanotrophy under versatile conditions in water column of the ferruginous meromictic lake La Crus (Spain). Front Microbiol 7:1762. 10.3389/fmicb.2016.01762. [DOI] [PMC free article] [PubMed] [Google Scholar]
- 55.van Grinsven S, Sinninghe Damste JS, Harrison J, Villanueva L. 2020. Impact of electron acceptor availability on methane-influenced microorganisms in an enrichment culture obtained from a stratified lake. Front Microbiol 11:715. 10.3389/fmicb.2020.00715. [DOI] [PMC free article] [PubMed] [Google Scholar]
- 56.Gilman A, Fu Y, Hendershott M, Chu F, Puri AW, Smith AL, Pesesky M, Lieberman R, Beck DAC, Lidstrom ME. 2017. Oxygen-limited metabolism in the methanotroph Methylomicrobium buryatense 5GB1C. PeerJ 5:e3945. 10.7717/peerj.3945. [DOI] [PMC free article] [PubMed] [Google Scholar]
- 57.Amaral JA, Knowles R. 1995. Growth of methanotrophs in methane and oxygen counter gradients. FEMS Microbiol Lett 126:215–220. 10.1111/j.1574-6968.1995.tb07421.x. [DOI] [Google Scholar]
- 58.Henckel T, Roslev P, Conrad R. 2000. Effects of O2 and CH4 on presence and activity of the indigenous methanotrophic community in rice field soil. Environ Microbiol 2:666–679. 10.1046/j.1462-2920.2000.00149.x. [DOI] [PubMed] [Google Scholar]
- 59.Lee HJ, Jeong SE, Kim PJ, Madsen EL, Jeon CO. 2015. High resolution depth distribution of bacteria, archaea, methanotrophs, and methanogens in the bulk and rhizosphere soils of a flooded rice paddy. Front Microbiol 6:639. 10.3389/fmicb.2015.00639. [DOI] [PMC free article] [PubMed] [Google Scholar]
- 60.Choi DW, Bandow NL, McEllistrem MT, Semrau JD, Antholine WE, Hartsel SC, Gallagher W, Zea CJ, Pohl NL, Zahn JA, DiSpirito AA. 2010. Spectral and thermodynamic properties of methanobactin from gamma-proteobacterial methane oxidizing bacteria: a case for copper competition on a molecular level. J Inorg Biochem 104:1240–1247. 10.1016/j.jinorgbio.2010.08.002. [DOI] [PubMed] [Google Scholar]
- 61.Mandal M, Kawashima K, Saito K, Ishikita H. 2020. Redox potential of the oxygen-evolving complex in electron transfer cascade of photosystem II. J Phys Chem Lett 11:249–255. 10.1021/acs.jpclett.9b02831. [DOI] [PubMed] [Google Scholar]
- 62.Vass I, Styring S. 1991. pH-dependent charge equilibria between tyrosine-D and the S states in photosystem II. Estimation of relative midpoint redox potentials. Biochemistry 30:830–839. 10.1021/bi00217a037. [DOI] [PubMed] [Google Scholar]
- 63.Nicholls P, Fita I, Loewen PC. 2000. Enzymology and structure of catalases. Adv Inorg Chem 51:51–106. 10.1016/S0898-8838(00)51001-0. [DOI] [Google Scholar]
- 64.Apel K, Hirt H. 2004. Reactive oxygen species: metabolism, oxidative stress, and signal transduction. Annu Rev Plant Biol 55:373–399. 10.1146/annurev.arplant.55.031903.141701. [DOI] [PubMed] [Google Scholar]
- 65.Youngblut MD, Tsai C-L, Clark IC, Carlson HK, Maglaqui AP, Gau-Pan PS, Redford SA, Wong A, Tainer JA, Coates JD. 2016. Perchlorate reductase is distinguished by active site aromatic gate residues. J Biol Chem 291:9190–9202. 10.1074/jbc.M116.714618. [DOI] [PMC free article] [PubMed] [Google Scholar]
- 66.Ettwig KF, Butler MK, Le Paslier D, Pelletier E, Mangenot S, Kuypers MMM, Schreiber F, Dutilh BE, Zedelius J, de Beer D, Gloerich J, Wessels HJCT, van Alen T, Luesken F, Wu ML, van de Pas-Schoonen KT, Op den Camp HJM, Janssen-Megens EM, Francoijs K-J, Stunnenberg H, Weissenbach J, Jetten MSM, Strous M. 2010. Nitrite-driven anaerobic methane oxidation by oxygenic bacteria. Nature 464:543–548. 10.1038/nature08883. [DOI] [PubMed] [Google Scholar]
- 67.Bab-Dinitz E, Shmuely H, Maupin-Furlow J, Eichler J, Shaanan B. 2006. Haloferax volcanii PitA: an example of functional interaction between Pfam chlorite dismutase and antibiotic biosynthesis monooxygenase families? Bioinformatics 22:671–675. 10.1093/bioinformatics/btk043. [DOI] [PubMed] [Google Scholar]
- 68.Whittenbury R, Phillips KC, Wilkinson JF. 1970. Enrichment, isolation and some properties of methane-utilizing bacteria. J Gen Microbiol 61:205–218. 10.1099/00221287-61-2-205. [DOI] [PubMed] [Google Scholar]
- 69.Bandow NL, Gallagher WH, Behling L, Choi DW, Semrau JD, Hartsel SC, Gilles VS, DiSpirito AA. 2011. Isolation of methanobactin from the spent media of methane-oxidizing bacteria. Methods Enzymol 495:259–269. 10.1016/B978-0-12-386905-0.00017-6. [DOI] [PubMed] [Google Scholar]
- 70.Harris DC. 2007. Quantitative chemical analysis, 7th ed. WH Freeman and Company, New York, NY. [Google Scholar]
Associated Data
This section collects any data citations, data availability statements, or supplementary materials included in this article.
Supplementary Materials
supplemental text, Fig. S1 to S6, Tables S1 to S3. Download AEM00286-21_Supp_1_seq2.pdf, PDF file, 3.5 MB (3.5MB, pdf)