

ABSTRACT
Nitric oxide (NO) is an important signaling molecule in eukaryotic and prokaryotic cells. A previous study revealed an NO synthase-independent NO production metabolic cycle in which the three nitrogen oxides, nitrate (NO3−), nitrite (NO2−), and NO, were generated in the actinobacterium Streptomyces coelicolor A3(2). NO was suggested to act as a signaling molecule, functioning as a hormone that regulates secondary metabolism. Here, we demonstrate the NO-mediated regulation of the production of the blue-pigmented antibiotic actinorhodin (ACT), via the heme-based DevS/R two-component system (TCS). Intracellular NO controls the stabilization or inactivation of DevS, depending on the NO concentration. An electrophoretic mobility shift assay and chromatin immunoprecipitation-quantitative PCR analysis revealed the direct binding between DevR and the promoter region of actII-ORF4, resulting in gene expression. Our results indicate that NO regulates the DevS/R TCS, thereby strictly controlling the secondary metabolism of S. coelicolor A3(2).
IMPORTANCE Diverse organisms, such as mammals, plants, and bacteria, utilize NO via well-known signal transduction mechanisms. Many useful secondary metabolite-producing bacteria of the Streptomyces genus had been also suggested for the metabolism regulated by endogenously produced NO; however, the regulatory mechanisms remain to be elucidated. In this study, we demonstrated the molecular mechanism by which endogenously produced NO regulates antibiotic production via the DevS/R TCS in S. coelicolor A3(2). NO serves as both a stabilizer and a repressor in the regulation of antibiotic production. This report shows the mechanism by which Streptomyces utilizes endogenously produced NO to modulate its normal life cycle. Moreover, this study implies that studying NO signaling in actinobacteria can help in the development of both clinical strategies against pathogenic actinomycetes and the actinobacterial industries.
KEYWORDS: nitric oxide, signal transduction, secondary metabolism, actinobacteria
INTRODUCTION
Nitric oxide (NO), a freely diffusible neutral gas, is an important chemically reactive molecule that effectively functions as a signaling agent in eukaryotic and prokaryotic cells. Cells produce nitric oxide synthase (NOS) to catalyze the oxygenation of l-arginine to generate NO, which regulates various normal cellular metabolic events through interactions with specific protein receptors, such as guanylyl cyclase (1). Furthermore, NO plays important roles in defenses against oxidative stress (2), biofilm formation (3), nitration of tryptophan (4), repair of UV irradiation damage (5), and increasing resistance to antibiotics (6).
Streptomyces spp. are Gram-positive filamentous bacteria found in soil worldwide and are extremely important for human beings. These bacteria produce many commercially available secondary metabolites, including antibiotic (7), anticancer (8), immunosuppressive (9), and antiparasite (10) agents. Streptomyces spp. have an elaborate life cycle that includes sporulation, a vegetative or substrate state, and aerial mycelial growth resembling that of fungi. The biosynthesis of secondary metabolites is closely linked to the process of cell differentiation and starts during the transition into the aerial mycelium (11, 12). The secondary metabolism of Streptomyces is triggered and coregulated by several types of bacterial hormones (13–16) or endogenous low-molecular-weight molecules that act as second messengers (17, 18); these molecules have been identified as organic compounds. However, studies suggest that NO is also involved in several normal physiological processes in most actinobacteria (19, 20), regardless of the absence of a gene encoding the NOS homolog. Our recent study suggested an NOS-independent NO production metabolic cycle in Streptomyces coelicolor A3(2) in which the three nitrogen oxides, nitrate (NO3−), nitrite (NO2−), and NO, were generated, and two enzymes, nitric oxide dioxygenase, flavohemoglobin (Fhb), and membrane-bound nitrate reductase (Nar), and three Nar paralogues (Nar1, Nar2, and Nar3) were involved in the cycle (21). We showed that NO production is controlled by a two-component system (TCS) comprising a heme-containing NO sensor protein, DevS, and a cognate response regulator, DevR (DevS/R TCS) (21). We suggested that DevS senses NO elevation during cell growth, resulting in the inactivation of its autophosphorylation activity (21), and that DevR is phosphorylated via DevS in an intracellular NO level-dependent manner, resulting in the transcriptional activation of both its own gene and the nar2 gene cluster (21, 22). This serves as a strict autoregulation system for cellular NO homeostasis.
Mutant S. coelicolor significantly decreasing NO-producing ability showed a significant reduction in antibiotic production and precocious sporulation (21). Both phenotypes were complemented by the application of an NO generator, strongly indicating that the NO produced via the nitrogen oxide cycle acted as a signal promoting the life cycle sustainability of the bacteria (21). Production of endogenous NO through conserved genes has been demonstrated in actinobacteria; however, the mechanism underlying NO signaling remains unclear. It is important to study and understand the NO-dependent mechanisms in actinobacteria, as these may have industrial implications. Here, we investigated the NO signaling cycle via the DevS/R TCS in S. coelicolor A3(2), which is involved in controlling the production of the blue-pigmented antibiotic actinorhodin (ACT).
RESULTS
NO affects ACT synthesis in S. coelicolor.
We found that the nar mutant (Δnar) showed a significant decrease in the production of ACT compared with the M145 strain (wild type) during culture (Fig. 1A). The expression levels of the actII-ORF4 gene, encoding a pathway-specific transcriptional factor for ACT synthesis genes (23), were analyzed by quantitative PCR (qPCR), showing a decrease in the transcript levels of the actII-ORF4 gene during cultures in the Δnar strain (Fig. 1B). As the Δnar strain is a mutant with declining NO-producing ability (21), we verified the effect of NO on ACT production and the expression levels of the actII-ORF4 gene. To investigate the direct effects of NO on ACT production, we used two different NO generators, NO2− and NOC (NOC5 or NOC18). After cultivation for 72 h on YEME-gln solid medium, the M145 strain exposed to NO generators showed a decrease in ACT production and the transcription of the actII-ORF4 gene. In contrast, the Δnar strain increased both production and transcription by NO generators (Fig. 1C and D). These results suggest that NO produced via the nitrogen oxide cycle positively and negatively affects ACT synthesis in S. coelicolor.
FIG 1.

Nitric oxide affects actinorhodin synthesis in Streptomyces coelicolor. (A) M145 (white bars) and Δnar (black bars) strains were cultured for the indicated time periods. Mean values and standard deviations from three independent experiments are shown. Differences were analyzed using Student's t test. **, P < 0.01; *, P < 0.05. (B) M145 (white bars) and Δnar (black bars) strains were cultivated for the indicated time periods. Total RNA was extracted and subjected to qPCR analysis to verify the expression of the actII-ORF4 gene. Mean values and standard deviations from three independent experiments are shown. Differences were analyzed using Student's t test. ***, P < 0.001; **, P < 0.01. (C) Both M145 and Δnar strains were grown for 72 h and treated with 100 μM NO2− (black bar) and 10 μM NOC18 (gray bar). The control is shown with a white bar. After further incubation for 48 h at 30°C, actinorhodin (ACT) was extracted. Mean values and standard deviations from three independent experiments are shown. Differences were analyzed using Dunnett′s test. *, P < 0.05. (D) Strains cultivated for 72 h were exposed to 100 μM NO2− (black bars) and 1 μM NOC5 (gray bars). Controls are shown with white bars. After further incubation for 1 h (NO2−) or 30 min (NOC5) at 30°C, total RNA was extracted from each strain and subjected to qPCR analysis to verify the expression level of the actII-ORF4 gene. Mean values and standard deviations from three independent experiments are shown. Differences were analyzed using Dunnett′s test. *, P < 0.05.
NO regulates ACT synthesis via the DevS/R TCS in S. coelicolor.
A previous study showed the involvement of DevS/R TCS in ACT synthesis (24), and our study revealed that the autophosphorylation activity of DevS was inactivated by high concentrations of NO (21). Therefore, these results imply a link between DevS/R TCS and NO for ACT production. We examined ACT production activity in both devS and devR mutants (ΔdevR), which showed a decrease in ACT production under these conditions (Fig. 2A). We further investigated the time-dependent expression level of actII-ORF4 with qPCR in M145 and ΔdevR strains. The ΔdevR strain maintained a low level of actII-ORF4 expression (Fig. 2B). Moreover, NO generators showed little change in both ACT production and actII-ORF4 expression in the ΔdevR strain (Fig. 2C and D). Taken together with the results shown in Fig. 1, NO regulates ACT synthesis in bacteria by controlling the expression of the actII-ORF4 gene via the DevS/R TCS.
FIG 2.

Nitric oxide regulates actinorhodin (ACT) synthesis via the DevS/R TCS in Streptomyces coelicolor. (A) ΔdevS and ΔdevR strains were cultivated for 168 h. Differences were analyzed using Student's t test. ***, P < 0.001; **, P < 0.01. (B) M145 strain (white bars) and ΔdevR strain (black bars) were cultivated for the indicated time periods. Total RNA was extracted and subjected to qPCR analysis to verify the expression of the actII-ORF4 gene. Mean values and standard deviations from three independent experiments are shown. After cultivation, ACT production was determined. Mean values and standard deviations from three independent experiments are shown. *, P < 0.05, as determined by Student's t test. (C) The ΔdevR strain was grown for 72 h and treated with 100 μM NO2− (black bar) and 10 μM NOC18 (gray bar). After further incubation for 72 h at 30°C, ACT was extracted. The control is shown with a white bar (Control). Mean values and standard deviations from three independent experiments are shown. Differences were analyzed using Dunnett′s test. ns, not significant. (D) The ΔdevR strain cultivated for 72 h was exposed to 100 μM NO2− (black bars) and 1 μM NOC5 (gray bars). After further incubation for 1 h (NO2−) or 30 min (NOC5) at 30°C, total RNA was extracted from each strain and subjected to qPCR analysis to verify the expression level of the actII-ORF4 gene. Controls are shown with white bars (Control). Mean values and standard deviations from three independent experiments are shown. Differences were analyzed using Dunnett′s test. ns, not significant.
DevR binds to promoter region of actII-ORF4 gene in vitro.
Since DevR is a transcriptional regulator, we tested whether DevR directly regulates the expression of the actII-ORF4 gene with an electrophoretic mobility shift assay (EMSA) using recombinant DevR and a Cy5-labeled 100-bp upstream region of the actII-ORF4 gene. A recombinant DevR protein was overexpressed in Escherichia coli and purified to homogeneity by affinity chromatography (see Materials and Methods). As shown in Fig. 3, a retardation of the actII-ORF4 gene promoter region (actII-ORF4p) fragments by DevR was observed in a protein concentration-dependent manner, while the retardation by the DevR activity was not observed when the addition of excess amounts of unlabeled probes was used. Moreover, the retardation was observed when the addition of excess amounts of an irrelevant oligonucleotide was used (Fig. 3). This result indicates that DevR specifically binds to the actII-ORF4p gene and regulates its expression levels in S. coelicolor.
FIG 3.

DevR binds the promoter region of the actII-ORF4 gene in vitro. Electrophoretic mobility shift assay (EMSA) was performed on DNA fragments harboring the predicted binding site upstream of the actII-ORF4 gene. A 100-fold amount of unlabeled probe was used as competitor DNA, and a 100-fold amount of the control unlabeled oligonucleotide was used as nonspecific DNA.
Interaction of DevR with actII-ORF4p in vivo is regulated in an NO concentration-dependent manner.
To verify whether DevR interacts with actII-ORF4p in vivo in an NO concentration-dependent manner, we performed chromatin immunoprecipitation and qPCR (ChIP-qPCR). We used both the M145 strain and the Δnar strain harboring a 3×FLAG-tagged DevR expression vector (M145/devR-FLAG and Δnar devR-FLAG). DevR significantly interacted with actII-ORF4p under midculture conditions in M145/devR-FLAG (72 and 96 h) but decreased after 120 h of culture (Fig. 4A). On the other hand, DevR showed little interaction with actII-ORF4p in Δnar devR-FLAG during culture (Fig. 4A). These results indicate that DevR directly upregulates the transcription of the actII-ORF4 gene in response to intracellular NO levels in vivo. We compared the interaction levels with endogenous NO levels using the transcription of the hmpA gene encoding Fhb, reflective of intracellular NO concentrations. As shown in Fig. 4B, the interactions of DevR with actII-ORF4p were coupled with an increase in NO concentrations in the M145 strain. On the other hand, a mutant with declining NO-producing ability showed lower levels of interaction during culture (Fig. 4B). These results indicate that endogenous NO regulates the interaction between DevR and actII-ORF4p, implying that NO activates or inactivates the in vivo autophosphorylation activity of DevS. The interaction significantly decreased following exposure to 100 μM NO2− and 1 μM NOC5 in M145/devR-FLAG but increased when exposed to the same concentrations of NO generators in Δnar devR-FLAG (Fig. 4C). These conflicting results between the M145 and Δnar strains suggest that the intracellular NO concentrations are different. Since the M145 strain produces a sufficient amount of cellular NO, the external NO would cause excessive NO levels to inhibit the activity of DevS (21). This is consistent with the results of ACT production and the expression of the actII-ORF4 gene (Fig. 1C and D).
FIG 4.

DevS/R two-component system (TCS) directly regulates the expression level of the actII-ORF4 gene in an NO concentration-dependent manner in Streptomyces coelicolor. (A) Experiments were performed using the M145 and Δnar strains expressing 3×FLAG-tagged DevR protein, M145/devR-FLAG (black bars), and Δnar/devR-FLAG (dark gray bars), with M145 (white bars) and Δnar (light gray bars) strains as controls. DNA fragments were extracted using chromatin immunoprecipitation (ChIP) and subjected to qPCR analysis for the verification of the expression of actII-ORF4p. Mean values and standard deviations from three independent experiments are shown. Differences were analyzed using Student's t test. ***, P < 0.001; *, P < 0.05. (B) M145 (white bars) and Δnar (black bars) strains were grown for the indicated time periods. Total RNA was extracted and subjected to qPCR analysis to verify the expression of the hmpA gene. Mean values and standard deviations from three independent experiments are shown. Differences were analyzed using Student's t test. ***, P < 0.001; **, P < 0.01; *, P < 0.05. (C) Indicated strains cultivated for 120 h were exposed to 100 μM NO2− (black bars) and 1 μM NOC5 (gray bars). After further incubation for 1 h (NO2−) or 30 min (NOC5) at 30°C, DNA fragments were extracted using ChIP and subjected to qPCR analysis to verify the expression of actII-ORF4p. Controls are shown with white bars. Mean values and standard deviations from three independent experiments are shown. Differences were analyzed using Dunnett′s test. *, P < 0.05.
DevR is phosphorylated in response to NO concentrations in vivo.
Since phosphorylation is important for the DNA-binding activity of DevR (22), we further investigated the in vivo phosphorylation of DevR using Phos-tag/EMSA. We found three different phosphorylated DevR bands, suggesting that DevR contains multiple phosphorylation sites (Fig. 5A). The M. tuberculosis DevR homolog, DosR, possesses three phosphorylation sites, Asp54, Thr198, and Thr205 (25, 26). Two residues, Asp66 and Thr221, were found in S. coelicolor DevR (Fig. 5B), suggesting that DevR forms three states: phosphorylated DevR (DevR-1P and DevR-2P) and nonphosphorylated DevR. DevR-2P in M145/devR-FLAG appeared between 48 and 120 h of cultivation, and then DevR-1P or nonphosphorylated DevR was detected instead of DevR-2P (144 to 168 h), while we found only a small signal in Δnar devR-FLAG (Fig. 5A). These results suggest that endogenous NO regulates DevR phosphorylation in vivo.
FIG 5.

NO regulates DevR phosphorylation in Streptomyces coelicolor. (A) Phos-tag gel electrophoresis and Western blotting were performed using the M145/devR-FLAG (left) and Δnar/devR-FLAG (right) supernatants containing 5 μg of total protein. Monoclonal antibodies specific for 3×FLAG were used to detect DevR. The supernatant of the M145 or Δnar strain was included as a control. Below the panel is a similar gel run with the same samples as those used in the Phos-tag/Western blotting but stained with Coomassie brilliant blue to detect proteins, which acted as a further loading control for the experiment. (B) Alignment of the amino acid sequence of DevR (SCO0204) with DevR homolog DosR (Rv3133c) in Mycobacterium tuberculosis using ClustalW. The putative sites of phosphorylation are highlighted by red letters. (C) Strains cultivated for 120 h were exposed to 100 μM NO2− (black bars) and 1 μM NOC5 (gray bars). Controls are shown with white bars. After further incubation for 1 h (NO2−) or 30 min (NOC5) at 30°C, total RNA was extracted from each strain and subjected to qPCR analysis to verify the expression level of the devR gene. Mean values and standard deviations from three independent experiments are shown. Differences were analyzed using Dunnett′s test. *, P < 0.05.
In Δnar devR-FLAG, DevR-2P was detected despite a significant decrease in endogenous NO levels, which suggested that NO is not essential for phosphorylation. However, DevR was little produced in Δnar devR-FLAG. We verified the expression of the devR gene when exposed to NO generators, and the expression levels in the Δnar strain were increased when exposed to NO generators (Fig. 5C). Since devR gene expression is promoted by DevR via the phosphotransfer activity of DevS (22), this result suggests that NO is important for the DevS activity. However, the NO-dependent devR gene expression mechanism via DevS activity is unclear. In addition, the expression levels of devR in the M145 strain were decreased (Fig. 5C), which is consistent with the results shown in Fig. 1C and D.
NO is an important regulator of ACT production.
To evaluate the significance of NO-dependent secondary metabolism via DevS/R TCS, we prepared two mutants: the deletion variant of the gene encoding WblA, known as a possible negative regulator for ACT synthesis (ΔwblA), and the devR wblA double deletion mutant (ΔdevR ΔwblA). While we confirmed that the ΔwblA strain overproduced ACT predictably, this overproduction was significantly repressed by the disruption of the devR gene in the ΔwblA strain (Fig. 6A). Disruption of the devR gene significantly reduced ACT synthesis during culture (Fig. 6B). These results indicate that the role of DevS/R TCS as a positive regulator is important for ACT production and suggest that the regulation based on NO signaling is important for secondary metabolism under these conditions in S. coelicolor.
FIG 6.
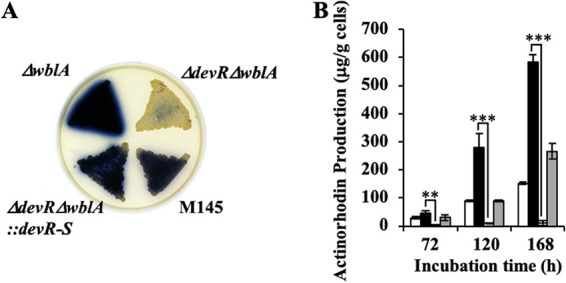
The DevS/R two-component system (TCS) is important for actinorhodin (ACT) synthesis in Streptomyces coelicolor. (A) Spores were inoculated onto YEME-gln solid medium with a toothpick, and then strains were cultivated for 72 h at 30°C. (B) The M145 strain (white bars), ΔwblA strain (black bars), ΔdevR ΔwblA strain (light gray bars), and ΔdevR ΔwblA::devRS strain (dark gray bars) were used. Strains were cultivated for the indicated time periods, and the ACT produced was extracted. Mean values and standard deviations from three independent experiments are shown. Differences were analyzed using Student's t test. ***, P < 0.001; **, P < 0.01.
DISCUSSION
This study proposes that endogenously produced NO regulates ACT production via the DevS/R TCS in S. coelicolor (Fig. 7). NO is an integral signaling molecule in most organisms. However, despite its importance, NO is a highly cytotoxic gas that inactivates intracellular molecules via oxidation and nitrosylation. Although recent studies have revealed the mechanism underlying endogenous NO production and several NO-mediated metabolic regulations in bacteria, these are transient adaptive responses to environmental changes caused by external nitrosative stress, such as NO3− and NO2− (27–30). To the best of our knowledge, this is the first report to demonstrate the NO-dependent regulation mechanism underlying the sustainability of the normal life cycle in bacteria, similar to higher organisms.
FIG 7.

Proposed model of actinorhodin (ACT) production mechanism by nitric oxide (NO) signaling in Streptomyces coelicolor. Nitrate reductase (Nar) and NO dioxygenase flavohemoglobin (Fhb) are involved in NO2− and NO production, respectively, thereby forming a nitrogen oxide pathway. NO directly regulates ACT synthesis via the DevS/R two-component system (TCS). Intracellular NO activates or inactivates the phosphorylation activity of DevR, and both NO and DevR positively and negatively regulate the expression of the actII-ORF4 gene. An NO sensing mechanism would be a mechanism similar to that of DosS-T in Mycobacterium tuberculosis.
We showed that intracellular NO regulates the phosphorylation state of DevR (Fig. 5). The M145 strain exposed to NO generators showed a decrease in the transcripts of genes under the control of DevR (Fig. 1D and 5C). In contrast, the Δnar strain exposed to NO generators showed a positive effect on the expression of target genes of DevR (Fig. 1D and 5C). The result in the M145 strain is consistent with previous results showing that DevS senses NO elevation in cells, and the autophosphorylation activity is inhibited (21). The M. tuberculosis DevS homolog DosS utilizes oxidation of its heme ferric by O2 as a mechanism for altering phosphorylation activity. Moreover, NO then binds to the ferrous ion of DosS, followed by a lock of the phosphorylated state of DosS, maintaining active signaling (31). These observations explain the NO-independent phosphorylation of DevR and suggest that DevR shows stable phosphorylation via DevS activity in response to intracellular NO levels, similar to the lock mechanism of DosS-T/R TCS activity. Thus, NO would work as both a repressor and stabilizer to control DevS/R TCS activity in S. coelicolor. In addition, the three intracellular NO-dependent states of DevR may induce different conformational changes, affecting the transcriptional activity or the target genes themselves. The endogenous NO-dependent mechanism of DevR phosphorylation should be elucidated in future studies.
It was implied that DevS, which plays a prominent role in central metabolic processes, simultaneously regulates both the cellular NO level (NO homeostatic regulation) and the production of secondary metabolites (NO signaling) based on a unique function in response to NO (21). Although both previous studies and the current study suggested that NO inactivates DevS activity, there is no report that intracellular NO inactivates the autophosphorylation of histidine kinase. Two possible repression mechanisms underlie this autophosphorylation activity in the presence of high NO levels. First, although the oxidization of the heme ferrous to ferric by high levels of NO is unlikely, this may be caused by nitroxyl, the one-electron reduced form of NO, or NO derivatives (32). Second, NO nitrosylates cysteine residues (33) and nitrates the tryptophan residues of DevS (4). However, the proposed repression mechanism related to autophosphorylation activity needs to be validated in future studies.
We demonstrated the importance of NO as a central regulator of ACT synthesis under these conditions (Fig. 6). The double mutant of devR and wblA further suggested that the positive effect of DevR on ACT production was under WblA-negative regulation, implying a coordinated ACT production system through both DevS-DevR and WblA. The Wbl family contains four invariant cysteine residues interacting with the [4Fe-4S] cluster, and the activation of Wbl proteins is thought to be in response to NO and O2 exposure followed by the oxidation of the [4Fe-4S] cluster (34–36). Since the direct involvement of Wbl proteins and NO in vivo has not been demonstrated, further studies on the link between DevS/R TCS and Wbl proteins could lead to the elucidation of the NO signaling system via Wbl proteins.
Understanding the specific regulatory systems in members of the Streptomyces genus, prolific producers of secondary metabolites, is imperative to efficiently improve fermentation industry outcomes. In this study, we demonstrated the intracellular NO-dependent antibiotic (ACT) production mechanism and the advantages of the NO-dependent mechanism in S. coelicolor. We have previously demonstrated endogenous nitrite production in Streptomyces (37), suggesting that the NO-dependent metabolic regulation mechanisms are widely conserved in this genus. Although the mechanism underlying the regulatory effect of NO on antibiotic production remains unclear, this finding may provide new insights into actinobacterial industries.
In the pathogenic bacterium M. tuberculosis, DosS or T/R TCS regulates the expression of approximately 50 regulons involved in dormancy, thereby maintaining a stable infection state for a long time in the host in a nonreplicative metabolically quiescent state, termed persistence (38). Thus, the NO-sensing system via DosS or T/R TCS has been focused on as a therapeutic target for tuberculosis prevention. Understanding the NO-dependent pathogenesis via DosS or T/R TCS in the host would be necessary to improve strategies against the global incidence of tuberculosis. Further studies evaluating the relationship between NO and DevS/R TCS are warranted to develop clinical strategies against M. tuberculosis infection.
Decades of biochemistry and bioinformatic studies have suggested a plausible role of NO signaling in the metabolic regulation of actinobacteria. This study suggests that the endogenously produced NO acts as a signaling molecule or hormone via the NO-specific sensor protein and that a potentially conserved function of NO is widespread among actinobacteria. Regulation of NO signaling and homeostasis in accordance with various systems continues to be an important subject in the cell biology of actinobacteria and most organisms. Therefore, the study presented here provides an important perspective on NO biology.
MATERIALS AND METHODS
Bacterial strains, plasmids, and culture conditions.
The method was performed according to the protocols established in our previous study (21). The strains used in this study are listed in Table 1. These strains were cultivated at 30°C in mannitol soya flour agar (MS solid medium [2% soya flour, 2% mannitol, and 2% agar]) for sporulation. YEME-gln (glutamine) solid medium (0.3% yeast extract, 0.3% malt extract, 0.5% Bacto-peptone, 50 mM l-glutamine [pH 7.2], 1% glucose, and 2% agar) was used for the development of vegetative cells. The detailed culture conditions are described in each figure legend. NO easily diffuses and affects all strains incubated in the same incubator. To eliminate this effect, all nar gene deletion mutants were incubated in a separate incubator. The temperature of each incubator was measured using the same thermometer. Escherichia coli DH5α (TaKaRa) was used as the host for routine cloning experiments. Media, culture conditions, and DNA manipulations for Streptomyces were performed as described in chapters 2, 10, and 19 of Practical Streptomyces Genetics by Kieser et al. (39) and for E. coli was performed as described by Green and Sambrook (40). The media and culture conditions employed for the strains used for gene disruption followed the REDIRECT PCR targeting method (41). The cosmids and plasmids were demethylated using E. coli HST04 (TaKaRa). The plasmids and cosmids were kindly provided by H. Takano, Nihon University, Japan. The primers used in this study are listed in Table 2.
TABLE 1.
Strains used in this study
| Streptomyces coelicolor A3(2) strain | Genotype and/or characteristics | Reference or source |
|---|---|---|
| M145 (wild type) | Lacks native plasmid, SCP1, and SCP2 | 21 |
| Δnar | M145 SCO6535::hyg/SCO0216::scar/SCO4947::scar (removing narGG2G3) | 21 |
| ΔdevS | M145 SCO0203::aac(3)IV(removing devS) | 21 |
| ΔdevS::devR-S | M145 SCO0203::aac(3)IV/pKU460-SCO0204-0203 (complementation of devS) | 21 |
| ΔdevR | M145 SCO0204::aac(3)IV (removing devS) | 21 |
| ΔdevR::devR-S | M145 SCO0204::aac(3)IV/pKU460-SCO0204-0203 (complementation of devR) | 21 |
| ΔwblA | M145 SCO3579::aac(3)IV (removing wblA) | This study |
| ΔdevR ΔwblA | M145 SCO0204::aac(3)IV/SCO3579::aadA (removing devR and wblA) | This study |
| ΔdevR ΔwblA::devR-S | M145 SCO0204::aac(3)IV/SCO3579::aadA/pKU460-devR-S (complementation of devR) | This study |
| M145/devR-FLAG | M145 pKU460-DevR-FLAG (complementation of devR-FLAG) | This study |
| ΔnarGG2G3/devR-FLAG | M145 SCO6535::hyg/SCO0216::scar/SCO4947::scar pKU460-DevR-FLAG (complementation of devR-FLAG) | This study |
TABLE 2.
Synthetic oligonucleotides used in this study
| Primer name | 5′→3′ sequence | Purpose |
|---|---|---|
| actII-ORF4 F | AAAGGAATATCGCGCACCTGGAAG | qPCR |
| actII-ORF4 R | GTTCCGGAATCATCGGCCCTATTC | qPCR |
| hrdB F | GCATGCTCTTCCTGGACCTCAT | qPCR |
| hrdB R | TGGAGAACTTGTAGCCCTTGGTGTA | qPCR |
| hmpA F | AACAGTCCGTTCCCGTGGT | qPCR |
| hmpA R | CGAAGAGCTTGCGGTAGAACAG | qPCR |
| devR F | ACGACGAACCGGACATCACC | qPCR |
| devR R | CGTCGTCGAAGGAGGTCAGC | qPCR |
| actII-ORF4 promoter region F | GGACCCAGCCGTATCAGGAA | qPCR and EMSA |
| actII-ORF4 promoter region R | GTCTCCTGGGGGGCGACAATA | qPCR and EMSA |
| comp devR/S F | GAATTCCGAGGACGCGCCGTGGAGG | Complementation |
| comp devR/S R | AAGCTTCGGACCGGCCGCCTTCC | Complementation |
| comp devR-FLAG F | GAATTCCGAGGACGCCGTCGACG | Complementation |
| comp devR-FLAG R | AAGCTTTCACTTGTCATCGTCATCCTTGTAATCGATGTCATGATCTTTATAATCTCCGTCATGGTCTTTGTAGTCGGTTCTGGCCTTCGGTGCGCATC | Complementation |
| ΔwblA F | TGGGGGAGCCTCGATTCGGGAGAGGACGGCGCCGGTATGATTCCGGGGATCCGTCGACC | Disruption |
| ΔwblA R | GGCGCCTGATCCGGGCCCCTGGTCCGGCCTCGGGGCTCATATAGGCTGGAGCTGCTTC | Disruption |
Construction of mutants and complementation.
The following protocols were performed as described in our previous study (21). The open reading frames in the chromosomes were replaced with drug resistance cassettes using the REDIRECT PCR targeting method (41). Each drug resistance cassette, flanked by flippase recognition target (FRT) sites, was amplified by PCR using PrimeSTAR GXL DNA polymerase (TaKaRa). The target gene-disrupted version of the mutant cosmids was obtained with the λRed system by introducing the amplified cassettes into E. coli BW25113/pIJ790 (41) harboring the appropriate cosmid (Table 2). The resulting construct was confirmed by PCR and introduced into E. coli HST04 (TaKaRa) to obtain a nonmethylating cosmid. Each mutated cosmid was introduced into S. coelicolor A3(2) M145 or its derivatives via protoplast transformation. Drug-resistant recombinants (Table 1) were screened, and successful recombination was confirmed by PCR using appropriate primer sets and a complementation study. The integration plasmid, pKU460-devS-R, used for genetic complementation of knockout mutants, was prepared as previously described (21). The integration plasmid pKU460-devR-FLAG, used for genetic complementation of the M145 strain, was prepared in the following manner: the gene region devR-FLAG (SCO0204), containing the upstream region (300 bp), was amplified by PCR using the primer sets listed in Table 2. The devR-FLAG fragments were cloned into the EcoRI and HindIII sites of pKU460 (42), and the resulting plasmid was introduced into both M145 and Δnar strains.
Quantitative determination of ACT.
Spores were inoculated onto YEME-gln solid medium at an interval of 2 cm (a total of nine spots) with a toothpick. After culturing at 30°C, the cells were collected and washed twice with 1 ml of 0.1 M hydrochloric acid (HCl). To extract ACT, 300 μl of 1 M potassium hydroxide (KOH) was added, and the cells were vortexed for 15 min. After vortexing, the cells were centrifuged at 15,000 × g for 5 min, and the absorbance of the supernatant was measured at 640 nm. A molecular extinction coefficient of ε640 = 25,320 M−1 ⋅ cm−1 was used to determine ACT production. ACT production following supplementation with NO2− and NOC18 was determined by the addition of 1 ml of sodium nitrite (NaNO2) or 500 μl of NOC18 to cells after cultivation at 30°C for 72 h. The concentrations of NaNO2 and NOC18 are described in the figure legends. After further cultivation at 30°C for 72 h, ACT production was determined using the above-mentioned method.
Isolation of total RNA and quantitative PCR analysis.
Spores were inoculated onto YEME-gln solid medium at an interval of 2 cm (a total of nine spots) with a toothpick. The strains were cultivated for the indicated time periods, and total RNA was isolated using the ReliaPrep RNA cell miniprep system (Promega). cDNA was generated using a ReverTra Ace qPCR RT master mix with genomic DNA remover (TOYOBO) and used as the template for qPCR. The primers used for qPCR are listed in Table 2. qPCR was performed on a Thermal Cycler Dice real-time system (TaKaRa). The PCR mixture (total 20 μl) contained 0.1 μg of generated cDNA, 10 pmol of an appropriate primer set (Table 2), and Thunderbird SYBR qPCR mix (TOYOBO). The data were normalized to the expression level of the hrdB gene, a housekeeping gene in S. coelicolor (43).
Overexpression and purification of recombinant proteins in E. coli.
The following protocols were performed as described in our previous study (21). The gene region of devR was amplified from the genomic DNA of S. coelicolor A3(2) M145 strain with primeSTAR GXL DNA polymerase, using the primer sets listed in Table 2. The resulting devR fragments were treated with NdeI and EcoRI and cloned into the corresponding sites of pET28b. The resultant DevR overexpression construct was then transformed into E. coli Rosetta-gami 2(DE3). The resulting transgenic organisms were cultivated in LB medium supplemented with 50 μg/ml kanamycin at 37°C until the optical density at 600 nm (OD600) reached 0.6. To induce the overexpression of DevR protein, isopropyl β-d-1-thiogalactopyranoside (IPTG) was added at a final concentration of 200 μM, followed by cultivation for 24 h at 16°C. Each cell was collected by centrifugation at 8,000 × g for 5 min. The cell pellet was resuspended in Tris buffer (20 mM Tris-HCl [pH 8.0], containing 300 mM NaCl, 20 mM imidazole, and 10% glycerol) and lysed by freeze-thawing. After centrifugation at 24,000 rpm for 45 min, the cell extract was collected and passed through a nickel-nitrilotriacetic acid (Ni-NTA) agarose column (Qiagen) and washed with Tris buffer containing 50 mM imidazole. The target protein was eluted with Tris buffer containing 500 mM imidazole.
EMSA.
EMSA was performed in the following manner according to the protocols described by Sumi et al. (44). The 100-bp upstream region of the actII-ORF4 gene was amplified from S. coelicolor A3(2) M145 genomic DNA by PCR using primer sets (Table 2). Ten nanograms of Cy5-labeled probe was mixed with 0 to 0.2 nmol recombinant DevR and then incubated for 30 min at 30°C in reaction buffer containing binding buffer (10 mM Tris-HCl [pH 7.2], 10% glycerol, 50 mM NaCl, and 1 mM EDTA) and 1 mM dithiothreitol. The specific DNA-protein complexes were separated from the free probe by electrophoresis on a native 6% polyacrylamide gel. For the competition assay, a 100-fold amount of unlabeled probe was used as competitor DNA, and a 100-fold amount of the control unlabeled oligonucleotide was used as nonspecific DNA. The DNA signals were visualized using an ATTO illuminator.
Chromatin immunoprecipitation and qPCR.
ChIP-qPCR was performed in the following manner according to the protocols of Hanaoka and Tanaka (45). Spores were inoculated onto YEME-gln solid medium at an interval of 2 cm (a total of nine spots) with a toothpick. Before cell collection, DNA-protein cross-linking was performed using a final concentration of 1% formaldehyde at room temperature (22 to 25°C) for 15 min with occasional shaking. Crosslinking was terminated by adding glycine at a final concentration of 125 mM at room temperature for 5 min. After cross-linking, the cells were washed three times with 5 ml of cold TBS buffer (150 mM sodium chloride [NaCl] and 20 mM Tris-HCl, pH 7.4) and collected with a toothpick. The collected cells were lysed using Multi-beads Shocker (Yasui Kikai), followed by the addition of 200 μl of lysis buffer (1 mM EDTA, 0.1% sodium deoxycholate, 50 mM HEPES-KOH, pH 7.5, 40 mM NaCl, and 1% Triton X-100) at 4°C. The protein concentration in the cell homogenate was measured using a Pierce bicinchoninic acid (BCA) protein assay kit (Thermo). The concentration of proteins in cell extracts was adjusted to 0.4 mg/ml with 500 μl of cold lysis buffer. To remove any nonspecific binding of DNA to resin, 20 μl of protein G Sepharose Fast Flow (GE Healthcare) equilibrated with lysis buffer was added to the solution, and the mixture was rotated at 4°C for 1 h. After the beads were removed by centrifugation at 15,000 × g for 1 min at 4°C, the lysate was treated with 5 μg of anti-FLAG antibody (Sigma-Aldrich) and rotated overnight at 4°C (16 h). After the antigen-antibody reaction, 20 μl of equilibrated beads with lysis buffer was added, and the reaction mixture was rotated at 4°C for 1 h. The beads were collected by centrifugation at 15,000 × g for 1 min and washed with 1 ml lysis buffer by rotation at room temperature for 5 min. The beads were collected by centrifugation at 15,000 × g for 1 min at 4°C. The washing steps were sequentially repeated using 1 ml of wash buffer 1 (lysis buffer containing 500 mM NaCl), 1 ml of wash buffer 2 (10 mM Tris-HCl, pH 8.0, 250 mM lithium chloride [LiCl], 0.5% NP-40, 0.5% sodium deoxycholate, and 1 mM EDTA), and 1 ml of TE buffer (10 mM Tris-HCl, pH 8.0 and 1 mM EDTA). Next, the washed beads were incubated with 100 μl of TE buffer containing 20 μg of RNase A (Nacalai Tesque) at 37°C for 30 min. The incubated beads were washed with 1 ml of TE buffer, followed by the removal of TE buffer by centrifugation at 15,000 × g for 1 min at 4°C. DNA-protein complexes were eluted in 250 μl of IP elution solution (0.1 M sodium bicarbonate [NaHCO3] and 1% SDS) at room temperature for 15 min with occasional vortexing. The supernatant was collected by centrifugation at 15,000 × g for 1 min at 4°C, and the same method was repeated. After elution, 20 μl of 5 M NaCl was added to the pooled elute, and the mixture was incubated at 65°C for 5 h to terminate cross-linking. One-tenth of the volume of the whole-cell extract was subjected to reversion to obtain input DNA quantity. After ethanol precipitation and washing with cold 70% ethanol, the pellet was dissolved in 100 μl of TE buffer, followed by treatment with 100 μl of 2× proteinase K buffer (20 mM Tris, pH 7.8, 10 mM EDTA, and 1% SDS) containing 1 μl of 20 mg/ml proteinase K at 50°C for 30 min. Following incubation, the mixture was extracted twice using phenol-chloroform-isoamyl alcohol. The ethanol-precipitated DNA was finally dissolved in 10 μl of TE buffer and subjected to qPCR analysis. qPCR was performed on a Thermal Cycler Dice real-time system (TaKaRa), and the reactions were performed using Thunderbird SYBR qPCR mix (TOYOBO). For quantification, standard curves were prepared using several dilutions (1 to 1 × 10⁻⁵) of S. coelicolor genomic DNA, and the percentage recovery was calculated for each immunoprecipitated DNA relative to the input DNA.
Phos-tag gel electrophoretic mobility shift assay.
Phos-tag EMSA was performed at 30 mA/gel at room temperature. The gel comprised 7 ml of a separating gel (8% [wt/vol] acrylamide, 0.35% [wt/vol] N,N-methylenebisacrylamide, 0.10% [wt/vol] SDS, 375 mM Tris-HCl [pH 8.8], 280 μM manganese chloride [MnCl2], and 140 μM Phos-tag acrylamide [Fujifilm Wako]) and 2 ml of a stacking gel (4.0% [wt/vol] polyacrylamide, 0.1% [wt/vol] SDS, and 125 mM Tris-HCl [pH 6.8]). The electrophoresis running buffer (pH 8.4) comprised 25 mM Tris and 192 mM glycine containing 0.1% (wt/vol) SDS. Sample proteins (5 μg) were resolved in SDS-PAGE loading buffer (125 mM Tris-HCl [pH 6.8], 4% [wt/vol] SDS, 10% [vol/vol] 2-mercaptoethanol, 10% [vol/vol] sucrose, and 0.01% [wt/vol] bromophenol blue). The sample solutions were boiled for 15 min at approximately 60°C before gel loading. To improve the transcription efficiency, the SDS-PAGE gel was immersed in transfer buffer (25 mM Tris base, 192 mM glycine, and 20% methanol) containing 10 mM EDTA and permeabilized slowly for 10 min, repeated six times to remove Mn2+. After the SDS-PAGE gel was equilibrated with transfer buffer without EDTA, proteins were visualized by Western blotting using monoclonal anti-FLAG M2 antibody produced in mouse (Sigma).
ACKNOWLEDGMENTS
S.H. and Y.S. planned the studies. S.H. prepared the manuscript. S.H., S.I., S.Y., and Y.S. designed and performed the experiments.
Contributor Information
Yasuyuki Sasaki, Email: y1sasaki@nodai.ac.jp.
Rebecca E. Parales, University of California, Davis
REFERENCES
- 1.Ignarro LJ. 2002. Nitric oxide as a unique signaling molecule in the vascular system: a historical overview. J Physiol Pharmacol 53:503–514. [PubMed] [Google Scholar]
- 2.Gusarov I, Nudler E. 2005. NO-mediated cytoprotection: instant adaptation to oxidative stress in bacteria. Proc Natl Acad Sci U S A 102:13855–13860. 10.1073/pnas.0504307102. [DOI] [PMC free article] [PubMed] [Google Scholar]
- 3.Williams DE, Boon EM. 2019. Towards understanding the molecular basis of nitric oxide-regulated group behaviors in pathogenic bacteria. J Innate Immun 11:205–215. 10.1159/000494740. [DOI] [PMC free article] [PubMed] [Google Scholar]
- 4.Alkhalaf LM, Ryan KS. 2015. Biosynthetic manipulation of tryptophan in bacteria: pathways and mechanisms. Chem Biol 22:317–328. 10.1016/j.chembiol.2015.02.005. [DOI] [PubMed] [Google Scholar]
- 5.Patel BA, Moreau M, Widom J, Chen H, Yin L, Hua Y, Crane BR. 2009. Endogenous nitric oxide regulates the recovery of the radiation-resistant bacterium Deinococcus radiodurans from exposure to UV light. Proc Natl Acad Sci U S A 106:18183–18188. 10.1073/pnas.0907262106. [DOI] [PMC free article] [PubMed] [Google Scholar]
- 6.Gusarov I, Shatalin K, Starodubtseva M, Nudler E. 2009. Endogenous nitric oxide protects bacteria against a wide spectrum of antibiotics. Science 325:1380–1384. 10.1126/science.1175439. [DOI] [PMC free article] [PubMed] [Google Scholar]
- 7.Liu G, Chater KF, Chandra G, Niu G, Tan H. 2013. Molecular regulation of antibiotic biosynthesis in Streptomyces. Microbiol Mol Biol Rev 77:112–143. 10.1128/MMBR.00054-12. [DOI] [PMC free article] [PubMed] [Google Scholar]
- 8.Noomnual S, Thasana N, Sungkeeree P, Mongkolsuk S, Loprasert S. 2016. Streptanoate, a new anticancer butanoate from Streptomyces sp. DC3. J Antibiot 69:124–127. 10.1038/ja.2015.95. [DOI] [PubMed] [Google Scholar]
- 9.Kino T, Hatanaka H, Hashimoto M, Nishiyama M, Goto T, Okuhara M, Kohsaka M, Aoki H, Imanaka H. 1987. FK-506, a novel immunosuppressant isolated from a Streptomyces. I. Fermentation, isolation, and physico-chemical and biological characteristics. J Antibiot 40:1249–1255. 10.7164/antibiotics.40.1249. [DOI] [PubMed] [Google Scholar]
- 10.Ikeda H, Omura S. 1995. Control of avermectin biosynthesis in Streptomyces avermitilis for the selective production of a useful component. J Antibiot 48:549–562. 10.7164/antibiotics.48.549. [DOI] [PubMed] [Google Scholar]
- 11.McCormick JR, Flärdh K. 2012. Signals and regulators that govern Streptomyces development. FEMS Microbiol Rev 36:206–231. 10.1111/j.1574-6976.2011.00317.x. [DOI] [PMC free article] [PubMed] [Google Scholar]
- 12.Chandra G, Chater KF. 2014. Developmental biology of Streptomyces from the perspective of 100 actinobacterial genome sequences. FEMS Microbiol Rev 38:345–379. 10.1111/1574-6976.12047. [DOI] [PMC free article] [PubMed] [Google Scholar]
- 13.Nishida H, Ohnishi Y, Beppu T, Horinouchi S. 2007. Evolution of gamma-butyrolactone synthases and receptors in Streptomyces. Environ Microbiol 9:1986–1994. 10.1111/j.1462-2920.2007.01314.x. [DOI] [PubMed] [Google Scholar]
- 14.Kitani S, Miyamoto KT, Takamatsu S, Herawati E, Iguchi H, Nishitomi K, Uchida M, Nagamitsu T, Omura S, Ikeda H, Nihira T. 2011. Avenolide, a Streptomyces hormone controlling antibiotic production in Streptomyces avermitilis. Proc Natl Acad Sci U S A 108:16410–16415. 10.1073/pnas.1113908108. [DOI] [PMC free article] [PubMed] [Google Scholar]
- 15.Horinouchi S. 2002. A microbial hormone, A-factor, as a master switch for morphological differentiation and secondary metabolism in Streptomyces griseus. Front Biosci 7:d2045–d2057. [DOI] [PubMed] [Google Scholar]
- 16.Yamada Y, Sugamura K, Kondo K, Yanagimoto M, Okada H. 1987. The structure of inducing factors for virginiamycin production in Streptomyces virginiae. J Antibiot 40:496–504. 10.7164/antibiotics.40.496. [DOI] [PubMed] [Google Scholar]
- 17.Süsstrunk U, Pidoux J, Taubert S, Ullmann A, Thompson CJ. 1998. Pleiotropic effects of cAMP on germination, antibiotic biosynthesis and morphological development in Streptomyces coelicolor. Mol Microbiol 30:33–46. 10.1046/j.1365-2958.1998.01033.x. [DOI] [PubMed] [Google Scholar]
- 18.Tschowri N, Schumacher MA, Schlimpert S, Chinnam NB, Findlay KC, Brennan RG, Buttner MJ. 2014. Tetrameric c-di-GMP mediates effective transcription factor dimerization to control Streptomyces development. Cell 158:1136–1147. 10.1016/j.cell.2014.07.022. [DOI] [PMC free article] [PubMed] [Google Scholar]
- 19.Khalil ZG, Cruz-Morales P, Licona-Cassani C, Marcellin E, Capon RJ. 2019. Inter-kingdom beach warfare: microbial chemical communication activates natural chemical defences. ISME J 13:147–158. 10.1038/s41396-018-0265-z. [DOI] [PMC free article] [PubMed] [Google Scholar]
- 20.Nishimura T, Teramoto H, Inui M, Yukawa H. 2014. Corynebacterium glutamicum ArnR controls expression of nitrate reductase operon narKGHJI and nitric oxide (NO)-detoxifying enzyme gene hmp in an NO-responsive manner. J Bacteriol 196:60–69. 10.1128/JB.01004-13. [DOI] [PMC free article] [PubMed] [Google Scholar]
- 21.Sasaki Y, Oguchi H, Kobayashi T, Kusama S, Sugiura R, Moriya K, Hirata T, Yukioka Y, Takaya N, Yajima S, Ito S, Okada K, Ohsawa K, Ikeda H, Takano H, Ueda K, Shoun H. 2016. Nitrogen oxide cycle regulates nitric oxide levels and bacterial cell signaling. Sci Rep 6:22038. 10.1038/srep22038. [DOI] [PMC free article] [PubMed] [Google Scholar]
- 22.Urem M, van Rossum T, Bucca G, Moolenaar GF, Laing E, Świątek-Połatyńska MA, Willemse J, Tenconi E, Rigali S, Goosen N, Smith CP, van Wezel GP. 2016. OsdR of Streptomyces coelicolor and the dormancy regulator DevR of Mycobacterium tuberculosis control overlapping regulons. mSystems 1:e00014-16. 10.1128/mSystems.00014-16. [DOI] [PMC free article] [PubMed] [Google Scholar]
- 23.Gramajo HC, Takano E, Bibb MJ. 1993. Stationary-phase production of the antibiotic actinorhodin in Streptomyces coelicolor A3(2) is transcriptionally regulated. Mol Microbiol 7:837–845. 10.1111/j.1365-2958.1993.tb01174.x. [DOI] [PubMed] [Google Scholar]
- 24.Wang W, Shu D, Chen L, Jiang W, Lu Y. 2009. Cross-talk between an orphan response regulator and a noncognate histidine kinase in Streptomyces coelicolor. FEMS Microbiol Lett 294:150–156. 10.1111/j.1574-6968.2009.01563.x. [DOI] [PubMed] [Google Scholar]
- 25.Chao JD, Papavinasasundaram KG, Zheng X, Chávez-Steenbock A, Wang X, Lee GQ, Av-Gay Y. 2010. Convergence of Ser/Thr and two-component signaling to coordinate expression of the dormancy regulon in Mycobacterium tuberculosis. J Biol Chem 285:29239–29246. 10.1074/jbc.M110.132894. [DOI] [PMC free article] [PubMed] [Google Scholar]
- 26.Saini DK, Malhotra V, Dey D, Pant N, Das TK, Tyagi JS. 2004. DevR-DevS is a bona fide two-component system of Mycobacterium tuberculosis that is hypoxia-responsive in the absence of the DNA-binding domain of DevR. Microbiology 150:865–875. 10.1099/mic.0.26218-0. [DOI] [PubMed] [Google Scholar]
- 27.Corker H, Poole RK. 2003. Nitric oxide formation by Escherichia coli. Dependence on nitrite reductase, the NO-sensing regulator Fnr, and flavohemoglobin Hmp. J Biol Chem 278:31584–31592. 10.1074/jbc.M303282200. [DOI] [PubMed] [Google Scholar]
- 28.Renner ED, Becker GE. 1970. Production of nitric oxide and nitrous oxide during denitrification by Corynebacterium nephridii. J Bacteriol 101:821–826. 10.1128/JB.101.3.821-826.1970. [DOI] [PMC free article] [PubMed] [Google Scholar]
- 29.Silva WM, Carvalho RD, Soares SC, Bastos IF, Folador EL, Souza GH, Le Loir Y, Miyoshi A, Silva A, Azevedo V. 2014. Label-free proteomic analysis to confirm the predicted proteome of Corynebacterium pseudotuberculosis under nitrosative stress mediated by nitric oxide. BMC Genomics 15:1065. 10.1186/1471-2164-15-1065. [DOI] [PMC free article] [PubMed] [Google Scholar]
- 30.Bodenmiller DM, Spiro S. 2006. The yjeB (nsrR) gene of Escherichia coli encodes a nitric oxide-sensitive transcriptional regulator. J Bacteriol 188:874–881. 10.1128/JB.188.3.874-881.2006. [DOI] [PMC free article] [PubMed] [Google Scholar]
- 31.Kumar A, Toledo JC, Patel RP, Lancaster JR, Steyn AJ. 2007. Mycobacterium tuberculosis DosS is a redox sensor and DosT is a hypoxia sensor. Proc Natl Acad Sci U S A 104:11568–11573. 10.1073/pnas.0705054104. [DOI] [PMC free article] [PubMed] [Google Scholar]
- 32.Evangelista AM, Kohr MJ, Murphy E. 2013. S-nitrosylation: specificity, occupancy, and interaction with other post-translational modifications. Antioxid Redox Signal 19:1209–1219. 10.1089/ars.2012.5056. [DOI] [PMC free article] [PubMed] [Google Scholar]
- 33.Sun J, Druhan LJ, Zweier JL. 2008. Dose dependent effects of reactive oxygen and nitrogen species on the function of neuronal nitric oxide synthase. Arch Biochem Biophys 471:126–133. 10.1016/j.abb.2008.01.003. [DOI] [PMC free article] [PubMed] [Google Scholar]
- 34.Bush MJ. 2018. The actinobacterial WhiB-like (Wbl) family of transcription factors. Mol Microbiol 110:663–676. 10.1111/mmi.14117. [DOI] [PMC free article] [PubMed] [Google Scholar]
- 35.Crack JC, Smith LJ, Stapleton MR, Peck J, Watmough NJ, Buttner MJ, Buxton RS, Green J, Oganesyan VS, Thomson AJ, Le Brun NE. 2011. Mechanistic insight into the nitrosylation of the [4Fe-4S] cluster of WhiB-like proteins. J Am Chem Soc 133:1112–1121. 10.1021/ja109581t. [DOI] [PMC free article] [PubMed] [Google Scholar]
- 36.Singh A, Guidry L, Narasimhulu KV, Mai D, Trombley J, Redding KE, Giles GI, Lancaster JR, Steyn AJ. 2007. Mycobacterium tuberculosis WhiB3 responds to O2 and nitric oxide via its [4Fe-4S] cluster and is essential for nutrient starvation survival. Proc Natl Acad Sci U S A 104:11562–11567. 10.1073/pnas.0700490104. [DOI] [PMC free article] [PubMed] [Google Scholar]
- 37.Sasaki Y, Takaya N, Morita A, Nakamura A, Shoun H. 2014. Nitrite formation from organic nitrogen by Streptomyces antibioticus supporting bacterial cell growth and possible involvement of nitric oxide as an intermediate. Biosci Biotechnol Biochem 78:1603–1610. 10.1080/09168451.2014.932665. [DOI] [PubMed] [Google Scholar]
- 38.Hayden TP, Vineel PR, Sani V, Krishna CC, Adrie JCS. 2018. Host-pathogen redox dynamics modulate Mycobacterium tuberculosis pathogenesis. Pathog Dis 76:fty036. 10.1093/femspd/ffy036. [DOI] [PMC free article] [PubMed] [Google Scholar]
- 39.Kieser T, Bibb MJ, Buttner MJ, Chater KF, Hopwood DA. 2000. Practical Streptomyces genetics. The John Innes Foundation, Norwich, CT. [Google Scholar]
- 40.Green M, Sambrook J. 2012. Molecular cloning: a laboratory manual, 4th ed. Cold Spring Harbor Laboratory Press, Cold Spring Harbor, NY. [Google Scholar]
- 41.Gust B, Challis GL, Fowler K, Kieser T, Chater KF. 2003. PCR-targeted Streptomyces gene replacement identifies a protein domain needed for biosynthesis of the sesquiterpene soil odor geosmin. Proc Natl Acad Sci U S A 100:1541–1546. 10.1073/pnas.0337542100. [DOI] [PMC free article] [PubMed] [Google Scholar]
- 42.Komatsu M, Uchiyama T, Omura S, Cane DE, Ikeda H. 2010. Genome-minimized Streptomyces host for the heterologous expression of secondary metabolism. Proc Natl Acad Sci U S A 107:2646–2651. 10.1073/pnas.0914833107. [DOI] [PMC free article] [PubMed] [Google Scholar]
- 43.Aigle B, Wietzorrek A, Takano E, Bibb MJ. 2000. A single amino acid substitution in region 1.2 of the principal sigma factor of Streptomyces coelicolor A3(2) results in pleiotropic loss of antibiotic production. Mol Microbiol 37:995–1004. 10.1046/j.1365-2958.2000.02022.x. [DOI] [PubMed] [Google Scholar]
- 44.Sumi S, Suzuki Y, Matsuki T, Yamamoto T, Tsuruta Y, Mise K, Kawamura T, Ito Y, Shimada Y, Watanabe E, Watanabe S, Toriyabe M, Takano Shiratori H, Ueda K, Takano H. 2019. Light-inducible carotenoid production controlled by a MarR-type regulator in Corynebacterium glutamicum. Sci Rep 9:13136. 10.1038/s41598-019-49384-7. [DOI] [PMC free article] [PubMed] [Google Scholar]
- 45.Hanaoka M, Tanaka K. 2008. Dynamics of RpaB-promoter interaction during high light stress, revealed by chromatin immunoprecipitation (ChIP) analysis in Synechococcus elongatus PCC 7942. Plant J 56:327–335. 10.1111/j.1365-313X.2008.03600.x. [DOI] [PubMed] [Google Scholar]