

Abstract
Zymoseptoria tritici, the causal agent of Septoria tritici blotch, is a fungal wheat pathogen that causes significant global yield losses. Within Z. tritici populations, quantitative differences in virulence among different isolates are commonly observed; however, the genetic components that underpin these differences remain elusive. In this study, intraspecific comparative transcriptomic analysis was used to identify candidate genes that contribute to differences in virulence on the wheat cultivar WW2449. This led to the identification of a multicopy gene that was not expressed in the high‐virulence isolate when compared to the medium‐ and low‐virulence isolates. Further investigation suggested this gene resides in a 7.9‐kb transposon. Subsequent long‐read sequencing of the isolates used in the transcriptomic analysis confirmed that this gene did reside in an active Class II transposon, which is composed of four genes named REP9‐1 to ‐4. Silencing and overexpression of REP9‐1 in two distinct genetic backgrounds demonstrated that its expression alone reduces the number of pycnidia produced by Z. tritici during infection. The REP9‐1 gene identified within a Class II transposon is the first discovery of a gene in a transposable element that influences the virulence of Z. tritici. This discovery adds further complexity to genetic loci that contribute to quantitative virulence in this important pathogen.
Keywords: effector, quantitative virulence, transcriptomics, transposon, wheat, Zymoseptoria tritici
The expression of the gene REP9‐1, which resides in an active Class II transposon, negatively regulates the rate of pycnidia appearance in planta of the wheat pathogen Zymoseptoria tritici.
1. INTRODUCTION
The fungal wheat pathogen Zymoseptoria tritici is the causal agent of Septoria tritici blotch (STB). STB is one of the most devastating wheat diseases in Europe and is responsible for significant yield losses globally (O’Driscoll et al., 2014). While 22 qualitative “large effect” STB resistance genes have been mapped in bread wheat, no commercial wheat lines are fully resistant to all Z. tritici isolates (Brown et al., 2015; Yang et al., 2018). In addition to these named STB genes, there are over 160 “minor effect” quantitative trait loci (QTLs) associated with STB resistance (Brown et al., 2015). While genetic resistance is used in the field, foliar‐applied fungicide remains the primary method used to control the disease (Fones & Gurr, 2015; Torriani et al., 2015). However, fungicide resistance has been reported in nearly all areas where Z. tritici is a significant disease (Brunner et al., 2008; Estep et al., 2015; McDonald, Renkin, et al., 2019). This emerging resistance poses a significant threat to future wheat yields.
Z. tritici is a latent necrotroph, highly pathogenic on wheat leaves (Rudd et al., 2015; Sánchez‐Vallet et al., 2015). To initiate infection, spores of Z. tritici germinate on the surface of the leaf and the growing hyphae enter through stomata (Orton et al., 2011; Rudd et al., 2015). Z. tritici has a long, symptomless latent period that ranges from 8 to 14 days, depending on specific wheat cultivar–Z. tritici isolate combinations and other environmental factors (Keon et al., 2005, 2007; Rudd et al., 2015). After this symptomless stage, the mesophyll of infected leaves rapidly collapses, which manifests as large necrotic lesions. The fungus then sporulates, forming asexual fruiting structures called pycnidia (Orton et al., 2011). These pycnidia mature and the asexual spores, known as pycnidiospores, ooze out onto the leaf surface and are subsequently splash dispersed up the canopy, furthering the field epidemic (Suffert et al., 2011).
The disease symptoms caused by Z. tritici infection have primarily been described as a quantitative trait and significant effort has gone into automated tools that can quantify the extent of leaf necrosis or formation of pycnidia (Karisto et al., 2018; Stewart et al., 2017; Stewart & McDonald, 2014). In this work we define virulence genes as those that affect the extent or severity of disease symptoms (Agrios, 2005). In plant pathology, the term “aggressiveness” is often used instead of virulence to indicate the severity of disease symptoms (Bos & Parlevliet, 1995; Thomas & Elkinton, 2004). However, most studies on Z. tritici have adopted the term “virulence,” which more closely aligns with how the term is defined in other disease systems outside of plant pathology (Stewart et al., 2017). Despite the characterization of STB as a quantitative disease, recent studies have identified genes that qualitatively impact the STB disease outcome (Lee et al., 2014; Marshall et al., 2011; Zhong et al., 2017). AvrStb6 is the first avirulence (Avr) gene cloned in Z. tritici and its expression leads to an avirulent phenotype on Stb6‐containing wheat lines (Kema et al., 2018; Zhong et al., 2017). However, more studies have demonstrated or identified genes that have a quantitative effect on virulence. For example, in a large QTL study one locus, later identified as the gene Avr3D1, was shown to quantitatively influence both lesion size and pycnidia formation (Meile et al., 2018; Stewart et al., 2017). Avr3D1 is unique because it interacts in a gene‐for‐gene manner with wheat cultivars that contain the Stb7 resistance gene, but its expression and recognition do not abolish pathogen infection (Meile et al., 2018). Similarly, Poppe et al. (2015) identified three quantitative virulence‐related genes in an interspecific resequencing study. In this study, the deletion mutants ΔZt80707 and ΔZt103264 showed reduced pycnidia formation on infected wheat leaves compared to the wild‐type (WT) Z. tritici isolate IPO323, while ΔZt89160 strains showed a hypervirulent phenotype with enhanced pycnidia formation during infection (Poppe et al., 2015). Together, these studies demonstrate that while single genes of large (qualitative) effect exist in the pathogen’s genome, genes of smaller (quantitative) effect make significant contributions to disease development. When scaled to the field level, these small effect genes can play large roles in the speed and intensity of epidemic development and have a significant impact on yield.
The extended duration of the symptomless period of Z. tritici is unique in comparison to other necrotrophic wheat pathogens. Therefore, this latent period was the focus of several RNA‐sequencing (RNA‐Seq) studies that sought to characterize putative virulence genes expressed during this stage (Haueisen et al., 2019; Kellner et al., 2014; Palma‐Guerrero et al., 2017; Rudd et al., 2015). Transcriptomic data from these studies suggest that Z. tritici actively reprogrammes its gene expression when transitioning from the latent to necrotic stages of infection. While these studies have provided significant insight into the complex changes Z. tritici undergoes during infection, only one study has specifically addressed quantitative differences in virulence between isolates infecting the same wheat cultivar (Palma‐Guerrero et al., 2017). We sought to build upon our understanding of the genes underpinning virulence in Z. tritici, by assessing the transcriptome of three isolates with different levels of virulence on a single wheat cultivar. The transcriptomic profiles of these three isolates were compared in order to identify candidate genes that could be responsible for different degrees of virulence.
2. RESULTS
2.1. Three Australian Z. tritici isolates differ in virulence on wheat cultivar WW2449
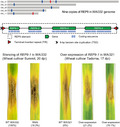
In a previous screen on wheat, Z. tritici isolates WAI332, WAI323, and WAI321 showed different degrees of virulence on the wheat cultivar WW2449 (McDonald et al., 2016). This study relied on a visual scoring of disease severity from 1 to 5; however, newer tools developed within the community enabled more precise measurements of the differences in virulence between these three isolates (Karisto et al., 2018). To expand upon this result, the third leaves on WW2449 were infiltrated with each isolate and the disease was assessed at 14 to 21 days postinoculation (dpi). Consistent with the previous study, all three isolates caused necrotic lesions on WW2449 leaves; however, there were measurable differences in the number of pycnidia each isolate produced. At 21 dpi, abundant pycnidia were visible on WW2449 leaves infected with WAI321 followed by fewer pycnidia in leaves infected with WAI323 (Figure 1a). In contrast, pycnidia were almost absent on WAI332‐infected leaves (Figure 1a). For clarity, we refer to these isolates by their virulence on WW2449 throughout the rest of the manuscript (WAI321, high virulence; WAI323, medium virulence; WAI332, low virulence).
FIGURE 1.

Three Australian Zymoseptoria tritici isolates showing different degrees of virulence on the wheat cultivar WW2449. (a) The third leaves of the wheat cultivar WW2449 (infiltrated with Z. tritici isolates WAI321, WAI323, and WAI332) harvested at 21 days postinoculation (dpi). (b) The number of pycnidia produced on WW2449 leaves inoculated with WAI321, WAI323, and WAI332 counted at 16 dpi. Each infection assay was repeated twice and at least nine leaves were collected per isolate in each experiment. (c) Pycnidia density (pycnidia per cm2 lesion) calculated based on the number of pycnidia and the area of necrotic lesions. All data in (b) and (c) passed the D’Agostino–Pearson normality test (omnibus K2 test); analysis of variance was conducted with the post hoc Tukey multiple comparisons test. Each dot represents an individual leaf sample; numbers on top represent the mean of each group; bars indicate ±SD; *p < .05, **p < .01, ***p < .001, ****p < .0001
Consistent with the previous visual assessment of pycnidia number, automated image analysis revealed that the high‐virulence isolate WAI321 developed significantly more pycnidia per leaf, with an average of 21.2 pycnidia per infiltrated leaf. This is compared to an average of 5.2 pycnidia per infiltrated leaf for the medium‐virulence isolate WAI323 (Figure 1b). Almost half of the low‐virulence isolate WAI332‐infected leaves showed no pycnidia with an average of only 2.5 pycnidia per leaf (Figure 1b). Pycnidia density (pycnidia per cm2 necrotic lesion) was also assessed, where the same trend was observed (Figure 1c). No differences in total necrotic area between the three isolates was observed. These data confirm these isolates exhibit quantitative differences in their virulence, defined here as the ability to form pycnidia on the cultivar WW2449.
2.2. The three isolates have distinct transcriptomic profiles during infection
To identify genes facilitating pycnidia development in planta, RNA was extracted from infected WW2449 leaves before symptom development (9 dpi) and at the onset of the switch to necrotic growth (14 dpi) and sequenced. The total aligned reads were then counted, normalized, and subsequently used to construct a multidimensional scaling plot (MDS) to compare global transcript expression between samples (Figure 2a). This analysis showed tight clustering of the biological replicates, indicating suitable consistency between replicates and a clear separation of the different isolates from each other (Figure 2a). This suggests that each isolate has a distinct transcriptomic profile during infection on the cultivar WW2449. The MDS plot also revealed a clear separation in total transcript expression between 9 and 14 dpi for the more virulent isolates, WAI321 and WAI323. In contrast, there was little variation in gene expression between the two time points for the weakly virulent WAI332 isolate (Figure 2a).
FIGURE 2.

Isolate‐specific transcriptome analysis. (a) Multidimensional scaling (MDS) analysis using all normalized expression counts of the three isolates during infection on WW2449. The distance between each dot (sample label) indicates similarity. Dimension 1 (dim1) separates the isolates, whereas dimension 2 (dim2) roughly separates the days postinoculation (dpi). (b) Venn diagram showing the overlap of differentially expressed genes (DEGs) in WAI321–WAI332, WAI321–WAI323, and WAI323–WAI332 comparisons. DEG lists were generated using the criteria false discovery rate (FDR) < .05, p < .05 and |log2fold‐change (FC)| ≥ 1. (c) Heatmap (with cluster dendrogram) showing the expression profiles of the 153 WAI321‐specific DEGs associated with the three Zymoseptoria tritici isolates. Colour legend indicates log10(CPM + 0.01), with red indicating higher counts‐per‐million (CPM) values and blue CPM values as they approach zero
To focus the downstream analyses on differences between the isolates, three sets of differentially expressed genes (DEGs) were identified based on pairwise comparisons (p < .05, false discovery rate [FDR] < .05, |log2fold‐change (FC)| ≥ 1). Due to the tight clustering of total gene expression in the low‐virulence isolate WAI332 at both 9 and 14 dpi, we chose to analyse differential gene expression between the isolates only. Therefore, samples from different time points were treated in silico as replicates for this statistical analysis. The numbers of overlapping DEGs between pairwise comparisons are shown in Figure 2b. Overall, The WAI323/WAI332 (medium/low virulence) comparison showed the largest number of DEGs (1,967 DEGs, 13.06% of all annotated genes), while the WAI321/WAI332 (high/low virulence) comparison showed 1,259 DEGs (8.36% of all annotated genes; Figure 2b). In contrast, the WAI321/WAI323 pair showed only 498 DEGs (3.31% of all annotated genes), less than a quarter of the total DEGs from the other pairwise comparisons. These results suggest that the more virulent isolates WAI321 and WAI323 have more similar gene expression profiles during infection on WW2449 when compared to the low‐virulence isolate WAI332 (Figure 2b).
2.3. Identification of new virulence‐related gene candidates in the DEGs
Based on the above phenotyping and RNA‐Seq analysis, we chose to focus on the DEGs specific to the high‐virulence isolate, WAI321. Taking the intersection of the WAI321/WAI332 and WAI321/WAI323 DEGs, 153 DEGs were shared between these two groups (Figure 2b; Table S1). The expression patterns of these 153 DEGs for all samples are shown in Figure 2c. Strikingly, the majority of these genes were down‐regulated in the high‐virulence isolate WAI321 when compared to WAI332/WAI323 (Figure 2c; Table S1). This suggested that the virulence of isolate WAI321 may be driven by the down‐regulation of certain genes during infection.
To further resolve this list, we used EffectorP to identify putative effector candidates (Sperschneider et al., 2016, 2018). This limited the number of differentially expressed effector candidates to only 28 genes (Table 1). We hypothesized that these 28 differentially expressed effector candidates may contribute to the virulence of WAI321 and are responsible for this isolate’s increased ability to sporulate on cultivar WW2449. Table 1 shows the 28 differentially expressed effector candidates in comparisons of WAI321 with WAI323 and WAI332 (sorted by gene ID). All the genes in this table are on core chromosomes (Chr01–13) and most of them encode small hypothetical/unnamed proteins containing more than two cysteines. Of the 28 DEGs, 24 were down‐regulated and only 4 were up‐regulated in WAI321 during infection when compared to the other two isolates.
TABLE 1.
The 28 overlapping differentially expressed genes in comparisons of WAI321 with WAI323 and WAI332, and EffectorP (v1 and v2) predictions (sorted by gene ID)
| Name | Description | Length (amino acids) | No. of cysteines | No. of BLAST hits | Probability (EffectorP_v1) | Probability (EffectorP_v2) | |
|---|---|---|---|---|---|---|---|
| Down‐regulated in WAI321 | Chr01.828 (REP9‐1, 9 copies) | Unnamed protein product | 193 | 6 | 3 | .947 | .578 |
| Chr01.876 | Unnamed protein product | 195 | 0 | 10 | .978 | .619 | |
| Chr03.1269 | Zn2‐Cys6 binuclear cluster domain containing protein | 181 | 4 | 10 | .933 | .812 | |
| Chr04.792 | Hypothetical protein TI39_contig4365g00001 | 89 | 9 | 1 | 1 | .952 | |
| Chr08.156 | Amino acid permease inda1 | 182 | 0 | 10 | .738 | .731 | |
| Chr08.203 | —NA— | 75 | 3 | 0 | .999 | .903 | |
| Chr08.204 | —NA— | 100 | 3 | 0 | .987 | .619 | |
| Chr08.371 | Unnamed protein product | 159 | 0 | 10 | .943 | .665 | |
| Chr08.847 | —NA— | 57 | 6 | 0 | 1 | .841 | |
| Chr09.342 | —NA— | 183 | 3 | 0 | .901 | .797 | |
| Chr09.385 | Hypothetical protein MYCGRDRAFT_95759 | 207 | 3 | 7 | .976 | .758 | |
| Chr10.642 | Glutathione‐dependent formaldehyde activating family | 259 | 10 | 10 | .739 | .601 | |
| Chr10.705 | C6 transcription factor | 148 | 6 | 10 | .995 | .582 | |
| Chr11.12 | Unnamed protein product | 198 | 0 | 10 | .976 | .670 | |
| Chr11.455 | Hit family 1 | 135 | 2 | 10 | .970 | .697 | |
| Chr13.76 | —NA— | 127 | 4 | 0 | .974 | .602 | |
| Up‐regulated in WAI321 | Chr01.1049 | Unnamed protein product | 89 | 6 | 1 | .986 | .747 |
| Chr02.843 | Unnamed protein product | 214 | 2 | 10 | .691 | .868 | |
| Chr06.411 | HSP20‐like chaperone | 235 | 1 | 10 | .572 | .551 | |
| Chr10.494 | —NA— | 83 | 9 | 0 | 1 | .959 |
Upon further inspection of this list, one gene, Chr01.828, was found to be identical to eight other genes found in different locations throughout the genome (named Chr01.1012, Chr01.1158, Chr03.150, Chr04.1008, Chr09.51, Chr09.795, Chr11.123, and Chr11.560; these additional eight genes are not shown in Table 1). The Chr01.828 gene has nine identical copies in the WAI332 genome and is predicted to encode a 193‐amino acid protein that contains six cysteines. This gene was not expressed at detectable levels in WAI321 (high virulence) and only moderately expressed in both WAI323 and WAI332 (Figure S1; Table S1).
2.4. A multicopy differentially expressed gene resides in a Class II transposon
The high number of copies of Chr01.828 indicated that this gene might be a part of a transposon within the genome of WAI332. In close proximity to this gene were three other genes, Chr01.829, Chr01.830, and Chr01.831. Local BLASTn searches of the WAI332 genome assembly revealed that these three genes were colocalized with Chr01.828 at all nine locations in the WAI332 genome. This region plus several hundred base pairs on either side of the genes was extracted and aligned. This alignment revealed distinct breakpoints that defined the boundaries of the high‐identity region (c.96.3% pairwise identity). In total, this region spanned 7.9 kb and included four predicted genes. This 7.9‐kb region was designated ZtREP9 (hereafter called REP9; Figure 3a), to reflect the nine copies found on five different chromosomes in the genome of WAI332. A self‐alignment of the REP9 region revealed terminal inverted repeats (TIRs; Figure 3b), typical of Class II transposons (Wicker et al., 2007). The differentially expressed effector candidate gene (Chr01.828) is the first gene in this region and was subsequently named REP9‐1 (Figure 3a).
FIGURE 3.

The REP9 element in Zymoseptoria tritici. (a) Schematic drawing showing the genes, coding sequences, terminal inverted repeats (TIRs), and target site duplication (TSD) of the REP9 element. REP9 is 7.9 kb in size and consists of four genes, REP9‐1, REP9‐2, REP9‐3, and REP9‐4. (b) The alignment of the 5′ and 3′ ends of the REP9 element showing the 43‐bp TIRs. (c, d, e, f) In vitro expression levels of REP9‐1, REP9‐2, REP9‐3, and REP9‐4 in the three wild‐type Z. tritici strains. Bars indicate ±SEM
To further investigate these four genes we conducted an expression experiment in vitro, to test if the expression pattern of these genes was similar to the patterns observed in planta from the RNA‐Seq experiment. In the REP9 element all genes, excluding REP9‐1, were expressed in vitro in all three isolates (Figure 3c–f). However, during infection, REP9‐2 was not expressed in any isolate (Figure S1a; Table S2). REP9‐3 and REP9‐4 were expressed in all the three isolates during infection (Figure S1b,c; Table S2). REP9‐1 was not expressed at detectable levels in the high‐virulence isolate WAI321 under in vitro conditions or in planta (Figures 3c and S1d; Table S2). In comparison, REP9‐1 was expressed in both WAI332 and WAI323 under both conditions (Figures 3c and S1d; Table S1).
In order to explore the possibility that REP9 was a transposon, the four proteins encoded by the genes within REP9 were subjected to NCBI BLASTp (nr database) and PHYRE2 in silico structural prediction. All four are hypothetical proteins based on the BLASTp results. Notably, REP9‐1 showed only four hits and REP9‐3 showed no significant hits when excluding the Zymoseptoria genus from the BLASTp database (Table S3). Both REP9‐1 and REP9‐2 contain the DUF3716 domain of unknown function, and BLASTp hits to many other fungal species that have genes encoding this domain were found (Table S3). REP9‐4 was the only gene that showed low similarity with other functionally annotated proteins. This included low amino acid similarity to an integrase core domain‐containing protein (Table S3). PHYRE2 intensive modelling suggested that REP9‐4 has high structural similarity (confidence score > 98%) to viral integrases/transposases that have available structure information (Supp. “Supp‐REP9_PHYRE2_report.pdf” Dataset online). PHYRE2 analysis of REP9‐1, REP9‐2, and REP9‐3 did not identify any high‐confidence structural similarities. BLASTn results of the full REP9 sequence on the available genomes in the JGI Mycocosm database indicated that REP9 is only present in the Zymoseptoria genus (Table S4).
To further investigate REP9‐4’s structural similarities with known integrases/transposases, all known transposons available in RepBase were downloaded and BLASTp was used to identify any similar proteins (minimum query coverage, 90 amino acids; pairwise amino acid identity > 20%). We also constructed local BLASTn databases for the four sister species of Z. tritici, whose genomes are also available (Feurtey et al., 2020). The full REP9 transposon was found in all four sister species; however, the four genes found in Z. tritici were pseudogenes in all sister species due to repeat‐induced point mutation (RIP). RIP is a fungal‐specific process that is hypothesized to have evolved to stop transposons from proliferating within a genome. RIP is generally recognized by signature C‐to‐T and G‐to‐A transitions observed in repetitive sequences (Selker, 2002). Using a consensus alignment approach, the REP9‐4 sequences from each of the sister species were de‐RIPed so the full gene could be translated and used for phylogenetic analysis. In total we identified 32 sequences with significant similarity to the REP9‐4 RVE domain (integrase catalytic core sequence); these included transposases from the Copia (Class I), Polinton (Class II), and IS3EU (Class II) transposon superfamilies (Figure S2). To investigate the evolutionary relationships between REP9‐4 and the transposase superfamilies listed above, we constructed a maximum‐likelihood (ML) phylogenetic tree (Figure 4). This tree indicates that the integrase domain from REP9‐4 is most closely related to transposases found within the IS3EU transposon superfamily, a poorly characterized superfamily that has only been published in the transposon database RepBase (Bao et al., 2015; Kojima, 2019).
FIGURE 4.
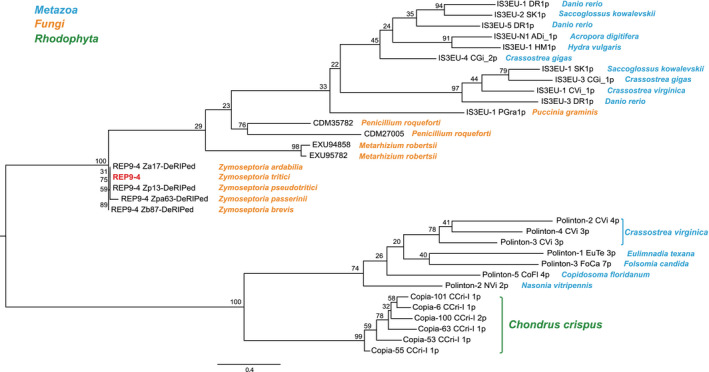
Phylogenetic analysis of REP9‐4. Maximum‐likelihood (ML) phylogenetic tree of the conserved RVE domain. Numbers next to each branch represent bootstrap support values (%) from 1,000 bootstrap replicates. The scale bar at the bottom is distance in substitutions/site. Species names are listed next to either the NCBI accession number or the transposon name in RepBase. These names are coloured according to the legend located at the top left
To determine the existence and the copy number of REP9 in isolates WAI321 and WAI323, these genomes were de novo assembled using long‐read data. Local BLASTn results suggested that the genome sequence of the high‐virulence isolate WAI321 contains 11 copies, while the genome sequence of the medium‐virulence isolate WAI323 contains 16 copies of REP9 (Figure S3a). This indicated that this transposon may still be active within Z. tritici. In total, we identified 36 REP9 copies in the three long‐read assemblies generated for this study. Of those 36 copies, 33 showed 6‐bp target site duplications (TSDs) at their integration sites (Figure S3a,b), another feature of Class II transposons (Wicker et al., 2007). Aside from the conserved size, 6 bp, there was no clear consensus sequence for the TSDs (Figure S3b).
2.5. REP9‐1 copy number is not correlated with gene expression
The de novo assemblies of all three isolates provided the opportunity to examine whether REP9 copy number could be correlated with REP9‐1 gene expression. Sequence conservation of REP9 (7.9 kb) was highest in the low‐virulence isolate, WAI332. In this isolate, eight of the nine REP9 copies were identical and the final copy contained a 5‐bp indel and six single‐nucleotide polymorphisms (SNPs). These indels and SNPs only affected the coding sequence (CDS) of the REP9‐2 protein. In WAI332, all nine identical REP9‐1 copies encode the full‐length (193‐amino acid) protein. In comparison, the medium‐virulence isolate WAI323 possessed 16 unique REP9 copies (Figure S3), eight of which encoded the full‐length REP9‐1 protein (Figure S4a). Despite having a similar number of gene copies, WAI323 expressed REP9‐1 at significantly lower levels compared to WAI332 in vitro. In planta, the expression of WAI323 REP9‐1 was also lower than that of WAI332 at 9 dpi but not at 14 dpi. In the high‐virulence isolate WAI321 there were 11 unique REP9 copies (Figure S3), but only two copies encoded a full‐length REP9‐1 protein (Figure S4b). Despite WAI321 having two full‐length copies of the REP9‐1 gene, this gene was not expressed at detectable levels during in vitro or in planta growth (Figures 3c and S1d). We observed two SNPs in the promoter region of these REP9‐1 copies (Figure S4c). Notably, the SNPs of the REP9‐1 sequences (as well as other SNPs in the REP9 element) in WAI323 and WAI321 were mainly C‐to‐T and G‐to‐A mutations, an indication that these regions were affected by RIP (Figure S4e,f). REP9‐1 and REP9‐4 were differentially expressed in planta between WAI321 and both lower virulence isolates. Homology searches did not uncover a potential function for REP9‐1. Therefore, we focused the functional analysis on REP9‐1 using both the low‐virulence and high‐virulence isolates, WAI332 and WAI321, as two independent genetic backgrounds.
2.6. REP9‐1 negatively impacts the asexual reproduction of Z. tritici during infection
To investigate the functional role of REP9‐1, independent of the other three genes within REP9, we conducted two separate experiments in the genetic backgrounds of WAI332 (low virulence) and WAI321 (high virulence). In the low‐virulence isolate WAI332, we sought to reduce the expression of REP9‐1 using RNAi. REP9‐1‐silenced transformants were generated by randomly integrating a 158‐bp sequence (antisense to exon 2 of REP9‐1) in WAI332. In parallel, we performed a REP9‐1 overexpression (OE) experiment in the high‐virulence isolate WAI321, in which the REP9‐1 gene with its native (NA) promoter from WAI332 was knocked into the sdi1 locus. Previous publications show that knock‐ins at this locus do not affect the virulence of Z. tritici (Kilaru et al., 2015).
For the RNAi silencing construct, we confirmed 33 out of 52 resistant colonies contained the RNAi cassette(s) in their genomes. Fourteen of these 33 mutants were chosen for quantitative PCR (qPCR) analysis and only one mutant (designated WAI332‐RNAi‐CDS2‐50) showed low REP9‐1 expression (18.3%) when compared to the WT WAI332 (Figures 5a and S5a). A mutant WAI332‐RNAi‐CDS2‐10 with 91.0% REP9‐1 expression was included as a transformation control (Figure S5a). For the OE experiment in the WAI321 background, 36 out of 134 resistant colonies were confirmed to have the REP9‐1‐expressing cassette integrated into the sdi1 locus via PCR screening. Eleven of the 36 isolates were subjected to qPCR analysis. Two REP9‐1‐expressing mutants, WAI321‐OE‐NA116 (21.2% REP9‐1 expression compared to WT WAI332) and WAI321‐OE‐NA119 (70.1% REP9‐1 expression), were used for subsequent infiltration assays (Figures 5a and S5a). A low‐REP9‐1 expression mutant, WAI321‐OE‐NA79 (10.4%), was also included as a transformation control (Figure S5a). Notably, for the OE mutants, the expression of REP9‐1 induced the expression of the other three genes in the REP9 element in vitro; in contrast, the in vitro expression of REP9‐2, REP9‐3, and REP9‐4 was not affected in the REP9‐1 RNAi‐silenced transformants (Figure S5b–d).
FIGURE 5.

REP9‐1 expression levels in the mutants and the results of the infection assay. (a) The in vitro expression level of REP9‐1 in both RNAi and overexpression (OE) mutants. The REP9‐1 silencing mutant WAI332‐RNAi‐CDS2‐50 in the WAI332 background showed 18.3% expression of REP9‐1 compared to the wild‐type (WT) WAI332 (left panel). The two mutants expressing REP9‐1, WAI321‐OE‐NA116 and WAI321‐OE‐NA119, in the WAI321 background showed 21.2% and 70.1% expression of REP9‐1 (compared to the WT WAI332). Bars indicate ±SEM. (b) The number of pycnidia produced by WTs and mutants on infected WW2449 leaves. The silencing mutant WAI332‐RNAi‐CDS2‐50 showed an increase in the number of pycnidia produced on the infected leaves compared to the WT WAI332. The two overexpression (OE) mutants WAI321‐OE‐NA116 and WAI321‐OE‐NA119 showed a decrease in the number of pycnidia compared to the WT WAI321. Each infection assay was repeated three times and at least nine leaves were collected for each isolate in each experiment. (c) Pycnidia density (pycnidia per cm2 lesion) of the WTs and mutants calculated based on the number of pycnidia and the area of necrotic lesions. (d) Pycnidia density produced by the WT WAI332 and the silencing mutant WAI332‐RNAi‐CDS2‐50 on the wheat cultivar Summit at 20 days postinoculation (dpi). Each infection assay was repeated twice and at least 16 leaves were collected for each isolate in each experiment. (e) Pycnidia density produced by WT WAI321 and the two OE mutants WAI321‐OE‐NA116 and WAI321‐OE‐NA119 on the wheat cultivar Tadorna. Each infection assay was repeated three times and at least 16 leaves were collected for each isolate in each experiment. All data in (b), (c), (d), and (e) passed the D’Agostino–Pearson normality test (omnibus K2 test); analysis of variance was conducted with the post hoc Tukey multiple comparisons test. Each dot represents an individual leaf sample; numbers on top represent the mean of each group; bars indicate ±SD; *p < .05, **p < .01, ***p < .001, ****p < .0001
First, both the WTs and mutants were tested on the cultivar WW2449. Silencing of REP9‐1 in the low‐virulence isolate WAI332 led to a significant increase in the isolate’s ability to sporulate on WW2449 (Figure 5b,c). Conversely, OE of REP9‐1 in the high‐virulence isolate WAI321 led to a decrease in the mutants’ ability to produce pycnidia during infection on WW2449 (Figure 5b,c). The two OE mutants expressed REP9‐1 at different levels, whereby higher expression of REP9‐1 relative to the WT WAI321 was associated with fewer pycnidia (and lower pycnidia density) produced by the mutants on infiltrated leaves (Figure 5b,c). These results suggest that expression of REP9‐1 negatively impacts in planta pycnidia production in two distinct genetic backgrounds.
To check whether this change in virulence in the transformants was cultivar‐specific, two additional susceptible cultivars (Summit and Millewa) were used to test the RNAi mutant’s ability to sporulate in comparison to the WT WAI332. While WAI332 is only weakly pathogenic on WW2449 and Millewa, it is highly pathogenic on the cultivar Summit (McDonald et al., 2016). Consistent with the trend observed on WW2449, the silencing mutant WAI332‐RNAi‐CDS2‐50 showed significantly higher pycnidia density on Summit and Millewa when compared to the WT WAI332 (Figures 5d and S6a). To test this lack of cultivar specificity in the WAI321 (high virulence) background, two additional wheat cultivars (Tadorna and Hereward) highly susceptible to this isolate were tested with the OE mutants and WAI321. Consistent with the results of the RNAi experiment, the OE of REP9‐1 in the high‐virulence isolate (WAI321) resulted in reduced pycnidia formation in the mutants during infection on Tadorna and Hereward when compared to the WT WAI321 (Figures 5e and S6b). Notably, the higher the REP9‐1 expression level in the mutant, the lower the pycnidia density on infected leaves (Figure 5e). The transformation controls showed the same phenotype as their corresponding WTs in the infection assays (Figure S7a–e). These results confirmed that the changes in pycnidia production in response to REP9‐1 expression were not cultivar‐specific.
To determine if REP9‐1 has any nonvirulence‐related function, the mutants were subjected to in vitro growth and stress assays. Results suggested that the in vitro growth of the mutants was similar to that of their corresponding WTs in yeast sucrose broth (YSB) medium (Figure 6a) and no differences in growth were observed between the mutants and their respective WT isolates in the stress assays (Figure S8). An in planta fungal biomass assay was conducted using these isolates. The RNAi mutant showed similar growth to WT WAI332 during the first 2 weeks of infection on WW2449, yet showed a slight increase in biomass at 17 dpi (Figure 6b). The OE mutants showed reduced biomass during infection compared to the WT WAI321 at 17 dpi (Figure 6b). These results suggest that the phenotypic alterations in the mutants were specific to in planta conditions.
FIGURE 6.

In vitro growth assay and in planta biomass assay for the Zymoseptoria tritici wild types (WTs) and mutants. (a) Three independent in vitro growth assays (in yeast sucrose broth medium) were conducted using the Z. tritici WTs and mutants. The growth rates (r) of the mutants were similar to those of their corresponding WTs, whereas the two different genetic backgrounds showed significantly different growth rates (Mann–Whitney U test). Numbers on top represent the mean of each group; bars indicate ±SD. (b) Fungal biomass was estimated by quantitative PCR. Values represent the amount of fungal DNA (ng) in 10 ng of total DNA (plant and fungal DNA). The overexpression (OE) mutants showed reduced in planta growth during infection compared to the WT WAI321. Bars indicate ±SD
Collectively, these data demonstrate that the expression of REP9‐1 negatively affects the virulence of Z. tritici, with higher expressing strains producing a lower number of pycnidia per cm2 lesion on infected leaves.
3. DISCUSSION
Here we describe the discovery of a gene named REP9‐1, which, when expressed, negatively impacts the number of pycnidia produced during in planta infection by the fungal wheat pathogen Z. tritici. This gene is located within a 7.9‐kb Class II transposon that shows evidence of active transposition and contributes to the virulence of Z. tritici. This work demonstrates how expression of a gene within a transposon can affect asexual reproduction of an important wheat pathogen.
3.1. REP9‐1 resides within a Class II transposon conserved within the Zymoseptoria genus
REP9‐1 resides in REP9, an active transposable element (TE) consisting of four genes. The functional roles of the REP9‐2 to REP9‐4 genes in this element were not investigated in this study. However, based on the currently available information, we conclude that REP9‐4 is the transposase/integrase in REP9. Phylogenetic analysis of the integrase domain of REP9‐4 showed that it is most closely related to the DDD/E transposases in the IS3EU DNA transposon superfamily (Kojima, 2019). We identified conserved TIRs and 6‐bp TSDs at most locations of REP9 in the three long‐read genome assemblies generated for this study, which is also consistent with the IS3EU features. Together, these data support the classification of REP9 as a distant member of the IS3EU transposon superfamily. However, the described IS3EU transposons encode only two proteins, while REP9 consists of four proteins (Kojima, 2019).
The existence of REP9 (the whole element or fragments) in all currently available long‐read sequenced Z. tritici and close relatives’ genomes indicates that the invasion of this element predates speciation within the Zymoseptoria genus (Feurtey et al., 2020). A BLASTn search of the JGI Mycocosm database did not result in any other significant hits, indicating that REP9 may be restricted to the genus. BLASTp of the NCBI nr database did reveal four hits for REP9‐1 in four fungal genome assemblies, Coniochaeta ligniaria NRRL 30616, Coniochaeta sp. 2T2.1, Fusarium sp. NRRL 52700, and Trichoderma gamsii A5MH. However, all four hits were also found in the REP9‐2 BLASTp hit list, indicating that these hits were probably due to the presence of the DUF3716 domain present in both of these proteins. The significant number of BLAST hits for REP9‐4 indicate that further long‐read assemblies of other close relatives may reveal a wider distribution of the IS3EU transposon superfamily in fungi. Repetitive sequences, especially highly identical multicopy transposons, are often not included in the output contig/scaffolds from short‐read de novo assemblers because these reads cannot be uniquely placed in the assembly. This has been clearly shown in Zymoseptoria spp., whereby isolates that are resequenced with long‐read data have a longer total assembly size compared to assemblies of the same isolate made with short‐read data only (Badet et al., 2020; Feurtey et al., 2020). Thus far, we consider REP9 a novel Class II DNA transposon within the Zymoseptoria genus that is most closely related to the IS3EU superfamily.
TEs are thought to contribute to genome evolution through their mobility and tendency to capture nearby DNA or interrupt important coding genes (Bourque et al., 2018). Some TEs, including a few endogenous retroviruses (ERVs), can encode functional proteins that confer direct adverse fitness effects on their host genomes (Bourque et al., 2018). For example, the Env proteins from ERV can be cytotoxic when overexpressed (Perron et al., 2001). While there were no observed toxic effects of REP9‐1 expression in vitro, high REP9‐1 expression significantly reduced an isolate’s ability to produce pycnidia in planta. We hypothesize that under field conditions, high REP9‐1 expression could negatively impact the fitness of an isolate by reducing the number of pycnidia, and therefore asexual spores, to splash‐disperse up the leaf canopy during the epidemic phase of the disease. This hypothesis is supported by recent experimental evidence from single and mixed infections of Z. tritici that showed that an isolate’s ability to produce asexual spores during a single infection was a good predictor of how competitive this isolate would be in a mixed infection on the same cultivar (Barrett et al., 2021). The negative fitness effect REP9‐1 expression imposes could be plastic/transient, as transposition of REP9 to a new location within the genome could rapidly alter REP9‐1 expression in asexual progeny. For the experiments conducted for this work, the expression of REP9‐1 was extremely stable in both the WT and transformation mutants across several independent experiments. However, as discussed above, REP9 was found in different genomic locations in the three WT isolates, which indicates that active transposition is still occurring in field isolates.
TEs have also been shown to be a rich source of regulatory elements that include transcription factor binding sites and the production of noncoding RNAs (Chuong et al., 2017). The regulatory effects of TEs have been observed in cis where the expression of a TE can also influence the expression of nearby genes (Bourque et al., 2018; Chuong et al., 2017). For example, a recent study showed that insertion of TEs directly adjacent to a quantitative avirulence factor, Avr3D1, probably reduced the expression of this gene in the high‐virulence Z. tritici strain 3D7 (Fouché et al., 2019). Notably, in the same study, the authors also observed that TEs and genes with the most similar expression patterns were not near each other in the genome, which suggested that TEs can also modulate gene expression in trans (Fouché et al., 2019). In the knock‐in experiments conducted here, the sdi1 locus is not near any of the genes that are known to influence pycnidia production; thus, we hypothesize that REP9‐1 could regulate the expression of other genes responsible for pycnidia production in trans (Tiley et al., 2019).
3.2. REP9‐1 expression affects the formation of pycnidia in a quantitative manner
Previous work in Z. tritici clearly established that necrosis and pycnidia formation were controlled by separate genetic loci (Stewart et al., 2017). While both traits are crucial for facilitating infection, the ability to sporulate on a cultivar greatly facilitates more widespread and severe field epidemics (Parlevliet, 1979; Suffert et al., 2011). The asexual infection cycles of a pathogen are a significant determinant of the total damage it can cause in the field and pycnidiospores are considered the main inoculum source of Z. tritici during the STB epidemic period (Parlevliet, 1979; Suffert et al., 2011). During one growing season Z. tritici can undergo five or six rounds of asexual reproduction and field experiments have shown that there is selection for more virulent isolates in a single growing season (Karisto et al., 2018; Suffert et al., 2015). Thus, the genes that affect the sporulation ability of Z. tritici will have a major impact on the rate and severity of an STB epidemic. In this study, the expression of REP9‐1 showed a negative correlation with pycnidia density on infected leaves. Our results suggest that REP9‐1 has a quantitative role in influencing the virulence of Z. tritici regardless of the host genotype.
Thus far only one other gene in Z. tritici, Zt89160, has been shown to negatively influence pycnidia formation in planta. Specifically, the ΔZt89160 strains showed enhanced pycnidia formation during infection, and it was proposed that this gene could play a role in the regulation of virulence‐related genes (Poppe et al., 2015). However, unlike REP9‐1, Zt89160 has a conserved regulator of chromosome condensation 1 domain, which in other organisms has been linked to a number of nuclear processes (Poppe et al., 2015). REP9‐1 has a domain of unknown function (DUF3716) and no signal peptide, which makes speculation about its putative function extremely difficult. While REP9‐1 was identified as a potential effector candidate, this is probably a false positive as EffectorP is intended for predicted proteins with signal peptides (Sperschneider et al., 2018). Alterations of REP9‐1 expression did not lead to any visible morphological change of Z. tritici under in vitro conditions, which is similar to Zt89160 and other virulence‐related genes (Meile et al., 2018; Poppe et al., 2015). In addition, the in vitro growth rate of the mutants was unaffected compared to their corresponding WTs. Yet, for the genetically modified WAI321 strains, REP9‐1 OE resulted in reduced in planta growth during infection on WW2449, which indicates that the impact of REP9‐1 is specific to in planta conditions. Further functional work is required to dissect whether REP9‐1 regulates pycnidia development through direct interaction with the regulatory proteins/promoters of pycnidiation genes or alternatively through RNA‐based regulatory pathways. Additional mechanistic work with a green fluorescent protein (GFP)‐expressing strain could also further our understanding of how REP9‐1 influences pycnidia formation in planta. For example, does REP9‐1 expression simply slow the overall growth of the fungus in planta, leading to a delay in pycnidia development? Or does the expression of REP9‐1 actually lead to abnormal or arrested pycnidia development inside the leaf?
It has been previously proposed that three major factors affect the pycnidia production of Z. tritici on infected wheat leaves: nutrients, the fitness of the pathogen, and host responses (Stewart & McDonald, 2014), of which the latter two are not mutually exclusive. In our study, the available nutrients should not be the limiting factor for pycnidia formation as all Z. tritici strains (WTs and mutants) used were able to cause necrosis on WW2449 leaves. As discussed above, REP9‐1 may have an impact on the in planta development/growth of Z. tritici and/or it may be recognized by wheat via yet unknown mechanisms, leading to a quantitative resistance response against the pathogen. Interestingly, many of the coding regions of REP9 in Z. tritici and its close relatives showed clear evidence of RIP. In the sister species there were no remaining active copies of the REP9 transposon. This could be an indication that REP9 is under negative selection within Zymoseptoria spp. This fits with the hypothesis that genes that have a negative effect on the number of offspring produced, observed here as reduced pycnidia number, would be selected against in large populations.
In conclusion, here we report the first discovery of a multicopy gene, REP9‐1, that resides in a TE, REP9. The REP9‐1 gene negatively regulates the rate of pycnidia appearance in planta of the wheat pathogen Z. tritici, adding further complexity to genetic loci that contribute to the virulence of this important pathogen.
4. EXPERIMENTAL PROCEDURES
4.1. Z. tritici strains and fungal genome sequencing, assembly, and annotation
The three Australian Z. tritici isolates WAI321, WAI323, and WAI332 were collected in wheat fields in Victoria (2012), Tasmania (2011), and New South Wales (1979), respectively (McDonald et al., 2016). For long‐term storage, fungal isolates were maintained in 30% glycerol at −80 °C. Z. tritici cultures were grown on yeast sucrose agar (YSA; 10 g/L yeast extract, 10 g/L sucrose, 1.5% agar) at 20 °C under a 12/12‐hr light/dark cycle for 3 days. Blastospores were scraped from the surface of agar plates and genomic DNA (gDNA) was extracted according to the methods described in McDonald, Taranto, et al. (2019) and on protocols.io (http://dx.doi.org/10.17504/protocols.io.k6qczdw). For isolate WAI332, two independent 15–20‐kb genomic P6 SMRT cell libraries were made at the Ramaciotti Centre for Genomics (UNSW Sydney, Australia). These libraries were sequenced on 13 SMRT cells using the P6‐C4 chemistry on a Pacbio RSII instrument (Pacific Biosciences). The genome was assembled de novo using Canu v. 1.5 with “minReadLength = 2000” and “genomeSize” set to 41 Mb (Koren et al., 2017). Assembled contigs were further corrected using the SMRT Analysis package v. 2.3.0. First the raw Pacbio reads were mapped to the de novo assembly with blaser with the following settings: ‐‐seed = 1, ‐‐minAccuracy = 0.75, ‐‐minLength = 500, ‐‐forQuiver, ‐‐algorithmOptions = '‐minMatch 12 ‐bestn 1 ‐minPctIdentity 65.0', ‐‐hitPolicy = randombest (Chaisson & Tesler, 2012). The resulting bam file was used as input for Quiver to call a new consensus sequence with the following settings: makeVcf = True, makeBed = True, enableMapQVFilter = T, minConfidence = 40, minCoverage = 10, diploidMode = False (Vaser et al., 2017). For isolates WAI321 and WAI323, gDNA was extracted as above. DNA sequencing libraries were constructed with Oxford Nanopore’s 1D SQK‐LSK108 kit and sequenced on R9.4.1 flow cells. Raw nanopore reads were base‐called using Albacore v. 2.1.3. Base‐called reads were assembled in Canu v. 1.6 with “minReadLength = 3,000” and “genomeSize = 40 Mb.” Assemblies were polished with Nanopolish v. 0.9.0 (Loman et al., 2015) followed by short‐read correction with Pilon v. 1.22 (Walker et al., 2014). Previous in vitro Illumina RNA‐Seq data generated in our laboratory were used for gene prediction via CodingQuarry v. 2.0 (Testa et al., 2015). The genome of WAI332 has 15,059 predicted gene models. A list of the three assemblies and basic genome quality statistics are provided in Table S5. The contigs in these three genome assemblies were named based on synteny alignments to the reference isolate IPO323 assembly.
4.2. Plant infection and RNA‐sequencing
Z. tritici blastospores were collected as described above, counted in a haemocytometer, and diluted to a concentration of 106 spores/ml in 0.02% Tween 20. This suspension was sprayed onto the third leaves of 3‐week‐old wheat seedlings (cultivar WW2449). The inoculated plants were kept in the dark at high humidity for 48 hr inside sealed black plastic boxes at 22 °C. After this incubation period, the plants were kept in a controlled environment chamber with a 16/8‐hr day/night cycle (20 °C day and 12 °C night). The infected leaf samples and a Tween 20‐only negative control were collected at 9 and 14 dpi. Each biological replicate was composed of four leaves from four different infected plants. In total, four biological replicates were collected for each treatment at both time points. Harvested leaves were frozen immediately after being cut from the plant in liquid nitrogen and all samples were stored at −80 °C until RNA extraction. Total RNA was extracted with the Quick‐RNA Fungal/Bacterial Miniprep Kit (R2014; Zymo Research) with an on‐column DNase treatment (DNASE70‐1SET; Sigma‐Aldrich). The extracted RNA was checked by gel electrophoresis and quantified with both a NanoDrop ND‐1000 (Thermo Fisher Scientific) and a Qubit 2.0 Fluorometer (Invitrogen). High‐quality RNA was submitted for sequencing at the Ramiciotti Centre for Genomics (UNSW, Sydney, Australia). Here, libraries were generated using the Illumina TruSeq Stranded mRNA‐Seq kit. Three libraries were pooled per NextSeq500 75‐bp SR run. In total, 30 mRNA libraries were sequenced across 10 NextSeq500 runs. Samples were randomly distributed across sequencing runs, ensuring that individual isolates were never sequenced together with their biological replicate from either time point.
4.3. Transcriptome mapping and differential gene expression analysis
Trimmomatic v. 0.33 (Bolger et al., 2014) was used to remove adapters and trim low‐quality bases in the raw Illumina reads with ‐phred33 ILLUMINACLIP: TruSeq3‐SE.fa:2:30:10 LEADING:10 TRAILING:10 SLIDINGWINDOW:4:15 MINLEN:50. FASTQC was used before and after trimming for quality control. The splice‐aware aligner STAR v. 2.5.3 (Dobin et al., 2013) was used to align the filtered reads to the WAI332 reference genome. The default settings of STAR were used except for minimum and maximum intron sizes (‐alignIntronMin10; ‐alignIntronMax1000). Mapped reads that overlapped with annotated transcripts were quantified using Stringtie v. 1.3.3 (‐‐rf ‐e ‐B ‐G) and the corresponding read counts information was extracted by the Python script (prepDE.py) provided by Stringtie (Pertea et al., 2015). The edgeR (Robinson et al., 2010) package in R was then used for the DEG analysis. Read counts for each transcript were normalized using the TMM method implemented in the edgeR package and three sets of DEGs were identified between each two of the three isolates. One sample (WAI321_14dpi_rep4) was discarded as it did not group appropriately with the other replicates. Top DEGs were subjected to analyses using NCBI, EffectorP (Sperschneider et al., 2016, 2018), and PHYRE2 (Kelley et al., 2015). The DEG clustering analysis was performed using pheatmap (Kolde, 2015) in R.
4.4. Phylogenetic relationships
A BLASTp database was generated using all the transposon sequences (as of 2020‐09‐25) on RepBase (Bao et al., 2015) and the REP9‐4 protein sequence was used as the query in a BLAST search against the database. Sequences (coverage) longer than 90 amino acids with a pairwise identity of over 20% with REP9‐4 were selected for the sequence alignment. The four functionally annotated BLASTp hits from NCBI and the REP9‐4 (De‐RIPed version) from the other Zymoseptoria species were also included in the alignment. For the de‐RIPing of REP9‐4 proteins, we first extracted the REP9‐4 sequences with the highest pairwise identity with Z. tritici REP9‐4 from the other Zymoseptoria species and manually changed the G‐to‐A and C‐to‐T SNPs. The de‐RIPed sequences were then translated into protein sequences.
InterProScan (Quevillon et al., 2005) was used to identify the conserved domain(s) in the BLAST hits. The sequences around the conserved RVE domain region were extracted and aligned with Muscle v. 3.8.425 (Edgar, 2004). The final trimmed alignment length was 205 amino acids. This alignment was used to construct an ML phylogenetic tree. RaxML v. 8.2.11 (Stamatakis, 2014) was used to find the highest‐scoring ML tree using the “–f a ‐x 1” algorithm (rapid bootstrap analysis and searching for the best ML tree), the general time reversible AA substitution (GTR) model with a gamma distribution to account for variation in mutation rates at different sites and 1,000 bootstrap replicates. The random seed used for this search was 3.
4.5. Generation of RNAi and REP9‐1 expression constructs
All primers used in this study are listed in Table S6. To generate the plasmid for targeted gene integration, two flanking regions (c.1 kb in size) for homologous recombination were amplified from Z. tritici WAI332 gDNA with primers 5flk_F_ovh, 5flk_R, 3flk_F_Hyg_ovh, and 3flk_R_ovh. The primers amplify the sdi1 locus described by Kilaru et al. (2015) between the Mycgr3G74146 and Mycgr3G45644 genes in IPO323 (Goodwin et al., 2011). The hygromycin resistance gene (Hyg), used as a selectable marker, was amplified from pGpD‐eGFP (Sexton & Howlett, 2001) using primers PtrpC‐Hyg‐5‐F and PtrpC‐Hyg‐3‐R. The REP9‐1 sequence with promoter and overhangs was amplified from WAI332 gDNA using primers R9‐1_5ovh_F and R9‐1_Hyg_3ovh_R. The four fragments were assembled into the vector plasmid and extracted as previously described (Khan et al., 2020) using the yeast (Saccharomyces cerevisiae) homologous recombination system (Raymond et al., 1999). The extracted plasmids were transformed into Escherichia coli and screened by colony PCR (for the Hyg fragment) and restriction analysis (SmaI digestion). The resulting plasmid was transformed into WAI321 via Agrobacterium tumefaciens‐mediated transformation according to Protocol Exchange (2008) (https://doi.org/10.1038/nprot.2008.83). Gene insertion into the correct locus was confirmed by PCR using primers HY‐primer‐F and R9‐1_Insertion‐check_3R.
An antisense CDS of REP9‐1 (158‐bp REP9‐1 CDS2 reverse complement sequence) with overhangs was amplified from cDNA using primers R9‐1_CDS2rc‐ovh‐F and R9‐1_CDS2rc‐ovh‐R. This fragment was introduced into the vector pBARGPE1‐LIC via Gibson assembly (New England Biolabs) according to Lin et al. (2018). The assembled RNAi plasmid was checked by sequencing using primers pBAR_insert_Check_F and pBAR_insert_Check_R. The resulting plasmid was transformed into WAI332 via polyethylene glycol‐mediated protoplast transformation, as previously described (Solomon et al., 2003). The transformants were selected on minimal medium (with ammonium tartrate as the only nitrogen source) containing 2 µl/ml phase‐extracted glufosinate ammonium aqueous. Gene insertion was confirmed by PCR using primers GPE1‐F and TtrpC‐seq‐R. Takara ExTaq was used for all PCRs.
4.6. RNA isolation and real‐time quantitative PCR
For each sample, 107 Z. tritici spores were inoculated in 50 ml YSB and grown for 60 hr at 20 °C under shaking at 140 rpm. Z. tritici cultures were harvested by centrifugation for 5 min at 3,724 × g. After centrifugation the supernatant was discarded and the samples were immediately frozen in liquid nitrogen and stored at −80 °C. Total RNA was isolated using the Quick‐RNA Fungal/Bacterial extraction kit (Zymo Research). Possible DNA contamination was removed using the TURBO DNA‐free Kit (Thermo Fisher Scientific). cDNA was synthesized from 0.2 μg RNA using the SuperScript IV First‐Strand Synthesis System (Thermo Fisher Scientific). qPCR was performed as previously described (Lin et al., 2018) using primers R9‐1_qpcr_F, R9‐1_qpcr_R, R9‐2_qpcr_F, R9‐2_qpcr_R, R9‐3_qpcr_F, R9‐3_qpcr_R, R9‐4_qpcr_F, R9‐4_qpcr_R, Actin_qpcr_F, and Actin_qpcr_R. The expression of REP9‐1 in WT WAI332 was set as 1. Relative expression of REP9‐1 to REP9‐4 was calculated by normalizing against the expression of A ctin (endogenous control).
4.7. Pathogenicity assays and quantification of disease
Z. tritici isolates were grown for 4 days on YSA as described above. Blastospores were counted in a haemocytometer and diluted to a concentration of 106 spores/ml. Pathogenicity was assessed by infiltrating spore suspensions into the third leaves of 3‐week‐old wheat seedlings as described previously (Yang et al., 2018). The inoculated plants were then kept in controlled environment chambers with the same conditions as described above. To measure the total necrotic area and count the number of pycnidia per lesion (pycnidia density), the cut leaves were mounted on paper sheets, scanned with a flatbed scanner at 1,200 dots per inch (EPSON), and analysed using automated image analysis (Karisto et al., 2018). Leaves were generally harvested 3–5 days after pycnidia first appeared depending on the disease development and senescence on a given cultivar. Due to senescence seen on WW2449 leaves after 17 dpi, infiltrated leaves were assessed at 15 to 17 dpi. Differences in pycnidia number and pycnidia density were tested using one‐way analysis of variance with the post hoc Tukey honestly significant difference test for comparing multiple treatments.
4.8. In planta biomass assay and in vitro growth assay
The fungal biomass (amount of fungal DNA) in infected WW2449 leaves was measured by qPCR according to Zhong et al. (2017), with a few minor adjustments. Z. tritici spore suspensions were infiltrated into wheat cultivar WW2449 and the regions around the watermarks were marked for cutting. In this assay, newly grown leaves were cut to keep the infiltrated leaves green during the course of collection (i.e., before disease symptoms were visible). The infiltrated leaves (four replicate leaves for each strain, around 4 cm in length) were collected at 8, 10, 12, 14, and 17 dpi and subjected to gDNA extraction by the QIAGEN plant DNA extraction kit. The gDNA concentration of all samples was adjusted to 10 ng/µl and gDNA was used for qPCR with primers Zt‐TRP‐qpcr‐F and Zt‐TRP‐qpcr‐R. The qPCR data were analysed via the standard curve method using QuantStudio software.
The in vitro growth assay was adapted from Möller et al. (2018). Briefly, 107 Z. tritici spores were inoculated in 50 ml YSB and grown for 6 days under shaking at 140 rpm at 20 °C under a 12/12‐hr day/night cycle. Each sample was grown in biological triplicate. Growth was analysed by measuring the optical density at 600 nm; samples were diluted 1:5, 1:10, or 1:20 depending on the concentration to obtain accurate measurements. The R package Growthcurver was used to model growth curves for each isolate (Sprouffske & Wagner, 2016). The Mann–Whitney U test was used to test for significant differences in growth rates (r) between strains.
4.9. Stress and development assay
To test if there were any differences in growth under stress, blastospores from 3‐day‐old cultures of both WTs WAI332 and WAI321 and all mutants (3 µl of 106 spores/ml and three 1:10 serial dilutions) were inoculated on YSA plates and YSA supplemented with H2O2 (2 and 4 mM), NaCl (0.5 and 1 M), or sorbitol (1 and 1.5 M) and incubated for 6 days at 20 °C.
Supporting information
FIGURE S1 The in planta expression of the genes in the REP9 element in WAI321, WAI323, and WAI332. (a) Mapped RNA reads visualized in IGV. The red box highlights the REP9‐1 gene. The black dotted‐line box highlights the entire 7.9‐kb REP9 element. (b, c, d) The in planta expression of the (b) REP9‐3, (c) REP9‐4, and (d) REP9‐1 genes in the three Zymoseptoria tritici isolates at 9 and 14 days post‐inoculation (dpi). The relative expression values were calculated by dividing the normalized counts‐per‐million (CPM) value of the target gene by the normalized CPM value of Actin in each sample. One dot indicates one sample. Numbers on top represent the mean of each group
FIGURE S2 Multiple sequence alignment of the conserved RVE domain region sequences of REP9‐4 and the BLASTp hits from NCBI and RepBase
FIGURE S3 The REP9 element and the ancestral insertion site in Zymoseptoria tritici. (a) Schematic drawing showing the locations of REP9 in the three Australian Zymoseptoria tritici genomes. The sequences in the dashed boxes show the terminal inverted repeats (TIRs) and target site duplications (TSDs) in the REP9 element. (b) Sequence logo of the REP9 integration site sequences (36 sequences) in the three Z. tritici isolates. The height of each letter is proportional to the frequency of the base
FIGURE S4 The alignments of REP9‐1 amino acid sequences and coding sequences (CDSs) from WAI321 and WAI323 and the SNPs in the REP9‐1 promoter region in WAI321. (a, b) Amino acid sequence alignment of REP9‐1 in WAI323 (a) and WAI321 (b) using WAI332 REP9‐1 as the reference sequence. In WAI323, 8 of the 16 copies encode the full‐length REP9‐1 protein, while in WAI321, 2 out of 11 the copies encode the full‐length REP9‐1 protein. Highlighted sites indicate mutated amino acids. (c) Two copies of the WAI321 REP9‐1 CDS were identical to the WAI332 REP9‐1 CDS; however, these two copies had single‐nucleotide polymorphisms (SNPs) (black lines in the grey blocks) in the promoter region. Arrows indicate the SNPs that may have an impact on REP9‐1 expression. (d, e) Alignment of the REP9‐1 CDSs from WAI323 (d) and WAI321 (e). Coloured bars other than grey indicate SNPs (red A, green T, blue C, yellow G)
FIGURE S5 In vitro expression levels of the four REP9 genes (a) REP9‐1, (b) REP9‐2, (c) REP9‐3, and (d) REP9‐4 in the three wild‐type (WT) and five mutant Zymoseptoria tritici strains used in this study. Gene expression was measured in biological triplicate, bars indicate ±SEM
FIGURE S6 Millewa and Hereward infection assay. (a) Pycnidia density (pycnidia per cm2 lesion) produced by the wild‐type (WT) WAI332 and silencing mutant WAI332‐RNAi‐CDS2‐50 on the wheat cultivar Millewa at 22 days post‐inoculation (dpi). At least eight leaves were collected for each isolate in the experiment. (b) Pycnidia density produced by WT WAI321 and the two overexpression (OE) mutants WAI321‐OE‐NA116 and WAI321‐OE‐NA119 on the wheat cultivar Hereward at 21 dpi. At least 11 leaves were collected for each isolate in the experiment. All data in (a) and (b) passed the D’Agostino–Pearson normality test (omnibus K2 test); analysis of variance was conducted with the post hoc Tukey multiple comparisons test. Each dot represents an individual leaf sample; numbers on top represent the mean of each group; bars indicate ±SD; ***p < .001. These two experiments have not been repeated
FIGURE S7 Infection assays of the transformation controls. (a, b) The (a) number and (b) density of pycnidia produced by wild‐type (WT) WAI332 and the REP9‐1 RNAi‐silenced transformants on infected WW2449 leaves. The WAI332‐RNAi‐CDS2‐10 isolate (transformation control) showed no significant change in the number/density of pycnidia produced on the infected leaves compared to the WT WAI332. At least nine leaves were collected for each isolate. The WAI332‐RNAi‐CDS2‐10 infection assay has not been repeated. (c, d) The (c) number and (d) density of pycnidia produced by WT WAI321 and the REP9‐1 overexpression (OE) transformants on infected WW2449 leaves. The WAI321‐OE‐NA79 isolate (transformation control) showed no significant change in the number/density of pycnidia produced on the infected leaves compared to the WT WAI321. At least 14 leaves were collected for each isolate. The WAI321‐OE‐NA79 infection assay has not been repeated. (e) Pycnidia density produced by WT WAI321 and the REP9‐1 OE transformants on the wheat cultivar Tadorna. The transformation control showed no significant change in the pycnidia density produced on the infected leaves compared to the WT WAI321. Each infection assay was repeated three times and at least 11 leaves were collected for each isolate in each experiment. All data in (a), (b), (c), (d), and (e) passed the D’Agostino–Pearson normality test (omnibus K2 test); analysis of variance was conducted with the post hoc Tukey multiple comparisons test. Each dot represents an individual leaf sample; numbers on top represent the mean of each group; bars indicate ±SD; *p < .05, **p < .01, ***p < .001, ****p < .0001
FIGURE S8 In vitro stress assays for the Zymoseptoria tritici wild types (WTs) and mutants. Blastospores from 3‐day‐old cultures (3 µl of 106 spores/ml and three 1:10 serial dilutions) were inoculated on the solid medium plates. All plates were incubated for 6 days at 20 °C. The growth of the mutants showed no difference compared to the corresponding WTs
TABLE S1 The expression (log2(FC)) and Blast2GO annotation of the 153 WAI321‐specific differentially expressed genes
TABLE S2 In planta expression levels (CPM) of the four genes in the REP9 element
TABLE S3 NCBI BLASTp results for the proteins encoded by the genes in the REP9 element
TABLE S4 JGI (Mycocosm database) BLASTn results for the REP9 element
TABLE S5 Summary of genome assembly statistics in this study
TABLE S6 Primers used in this study
ACKNOWLEDGEMENTS
All authors wish to acknowledge the plant service team at the Australian Plant Phenomics Facility, which is supported under the National Collaborative Research Infrastructure Strategy of the Australian Government. C.W. acknowledges the support of the Australian National University–China Scholarship Council joint scholarship. M.C.M. is supported by the Australian National University, Grains and Research Development Corporation and NSW Department of Primary Industries co‐investment DAN00203 as part of the Grains, Agronomy and Pathology Partnership. We also thank two anonymous reviewers whose comments have significantly improved this manuscript.
Wang C, Milgate AW, Solomon PS, McDonald MC. The identification of a transposon affecting the asexual reproduction of the wheat pathogen Zymoseptoria tritici . Mol Plant Pathol. 2021;22:800–816. 10.1111/mpp.13064
Contributor Information
Peter S. Solomon, Email: peter.solomon@anu.edu.au.
Megan C. McDonald, Email: m.c.mcdonald@bham.ac.uk.
DATA AVAILABILITY STATEMENT
All raw RNA‐Seq and genome sequencing data and associated assemblies are deposited under NCBI project PRJNA604047. CodingQuarry gene predictions for isolate WAI332, REP9‐4 RVE protein alignment, and the PHYRE2 structural predictions are provided on GitHub (https://github.com/SolomonLab/REP9‐1_Supplementary_Info).
REFERENCES
- Agrios, G. (2005) Plant Pathology. Burlington, MA, USA: Elsevier Academic Press. [Google Scholar]
- Badet, T. , Oggenfuss, U. , Abraham, L. , McDonald, B.A. & Croll, D. (2020) A 19‐isolate reference‐quality global pangenome for the fungal wheat pathogen Zymoseptoria tritici . BMC Biology, 18, 12. [DOI] [PMC free article] [PubMed] [Google Scholar]
- Bao, W. , Kojima, K.K. & Kohany, O. (2015) Repbase Update, a database of repetitive elements in eukaryotic genomes. Mobile DNA, 6, 1–6. [DOI] [PMC free article] [PubMed] [Google Scholar]
- Barrett, L.G. , Zala, M. , Mikaberidze, A. , Alassimone, J. , Ahmad, M. , McDonald, B.A. et al. (2021) Mixed infections alter transmission potential in a fungal plant pathogen. Environmental Microbiology. 10.1111/1462-2920.15417 [DOI] [PMC free article] [PubMed] [Google Scholar]
- Bolger, A.M. , Lohse, M. & Usadel, B. (2014) Trimmomatic: a flexible trimmer for Illumina sequence data. Bioinformatics, 30, 2114–2120. [DOI] [PMC free article] [PubMed] [Google Scholar]
- Bos, L. & Parlevliet, J.E. (1995) Concepts and terminology on plant/pest relationships: toward consensus in plant pathology and crop protection. Annual Review of Phytopathology, 33, 69–102. [DOI] [PubMed] [Google Scholar]
- Bourque, G. , Burns, K.H. , Gehring, M. , Gorbunova, V. , Seluanov, A. , Hammell, M. et al. (2018) Ten things you should know about transposable elements. Genome Biology, 19, 199. [DOI] [PMC free article] [PubMed] [Google Scholar]
- Brown, J.K.M. , Chartrain, L. , Lasserre‐Zuber, P. & Saintenac, C. (2015) Genetics of resistance to Zymoseptoria tritici and applications to wheat breeding. Fungal Genetics and Biology, 79, 33–41. [DOI] [PMC free article] [PubMed] [Google Scholar]
- Brunner, P.C. , Stefanato, F.L. & McDonald, B.A. (2008) Evolution of the CYP51 gene in Mycosphaerella graminicola: evidence for intragenic recombination and selective replacement. Molecular Plant Pathology, 9, 305–316. [DOI] [PMC free article] [PubMed] [Google Scholar]
- Chaisson, M.J. & Tesler, G. (2012) Mapping single molecule sequencing reads using basic local alignment with successive refinement (BLASR): application and theory. BMC Bioinformatics, 13, 238. [DOI] [PMC free article] [PubMed] [Google Scholar]
- Chuong, E.B. , Elde, N.C. & Feschotte, C. (2017) Regulatory activities of transposable elements: from conflicts to benefits. Nature Reviews Genetics, 18, 71–86. [DOI] [PMC free article] [PubMed] [Google Scholar]
- Dobin, A. , Davis, C.A. , Schlesinger, F. , Drenkow, J. , Zaleski, C. , Jha, S. et al. (2013) STAR: ultrafast universal RNA‐seq aligner. Bioinformatics, 29, 15–21. [DOI] [PMC free article] [PubMed] [Google Scholar]
- Edgar, R.C. (2004) MUSCLE: Multiple sequence alignment with high accuracy and high throughput. Nucleic Acids Research, 32, 1792–1797. [DOI] [PMC free article] [PubMed] [Google Scholar]
- Estep, L.K. , Torriani, S.F.F. , Zala, M. , Anderson, N.P. , Flowers, M.D. , McDonald, B.A. et al. (2015) Emergence and early evolution of fungicide resistance in North American populations of Zymoseptoria tritici . Plant Pathology, 64, 961–971. [Google Scholar]
- Feurtey, A. , Lorrain, C. , Croll, D. , Eschenbrenner, C. , Freitag, M. , Habig, M. et al. (2020) Genome compartmentalization predates species divergence in the plant pathogen genus Zymoseptoria . BMC Genomics, 21, 588. [DOI] [PMC free article] [PubMed] [Google Scholar]
- Fones, H. & Gurr, S. (2015) The impact of Septoria tritici blotch disease on wheat: an EU perspective. Fungal Genetics and Biology, 79, 3–7. [DOI] [PMC free article] [PubMed] [Google Scholar]
- Fouché, S. , Badet, T. , Oggenfuss, U. , Plissonneau, C. , Francisco, C.S. & Croll, D. (2019) Stress‐driven transposable element de‐repression dynamics and virulence evolution in a fungal pathogen. Molecular Biology and Evolution, 37, 221–239. [DOI] [PubMed] [Google Scholar]
- Goodwin, S.B. , Ben M'Barek, S. , Dhillon, B. , Wittenberg, A.H.J. , Crane, C.F. , Hane, J.K. et al. (2011) Finished genome of the fungal wheat pathogen Mycosphaerella graminicola reveals dispensome structure, chromosome plasticity, and stealth pathogenesis. PLoS Genetics, 7, e1002070. [DOI] [PMC free article] [PubMed] [Google Scholar]
- Haueisen, J. , Möller, M. , Eschenbrenner, C.J. , Grandaubert, J. , Seybold, H. , Adamiak, H. et al. (2019) Highly flexible infection programs in a specialized wheat pathogen. Ecology and Evolution, 9, 275–294. [DOI] [PMC free article] [PubMed] [Google Scholar]
- Karisto, P. , Hund, A. , Yu, K. , Anderegg, J. , Walter, A. , Mascher, F. et al. (2018) Ranking quantitative resistance to Septoria tritici blotch in elite wheat cultivars using automated image analysis. Phytopathology, 108, 568–581. [DOI] [PubMed] [Google Scholar]
- Kelley, L.A. , Mezulis, S. , Yates, C.M. , Wass, M.N. & Sternberg, M.J.E. (2015) The Phyre2 web portal for protein modeling, prediction and analysis. Nature Protocols, 10, 845–858. [DOI] [PMC free article] [PubMed] [Google Scholar]
- Kellner, R. , Bhattacharyya, A. , Poppe, S. , Hsu, T.Y. , Brem, R.B. & Stukenbrock, E.H. (2014) Expression profiling of the wheat pathogen Zymoseptoria tritici reveals genomic patterns of transcription and host‐specific regulatory programs. Genome Biology and Evolution, 6, 1353–1365. [DOI] [PMC free article] [PubMed] [Google Scholar]
- Kema, G.H.J. , Mirzadi Gohari, A. , Aouini, L. , Gibriel, H.A.Y. , Ware, S.B. , van den Bosch, F. et al. (2018) Stress and sexual reproduction affect the dynamics of the wheat pathogen effector AvrStb6 and strobilurin resistance. Nature Genetics, 50, 375–380. [DOI] [PubMed] [Google Scholar]
- Keon, J. , Antoniw, J. , Carzaniga, R. , Deller, S. , Ward, J.L. , Baker, J.M. et al. (2007) Transcriptional adaptation of Mycosphaerella graminicola to programmed cell death (PCD) of its susceptible wheat host. Molecular Plant‐Microbe Interactions, 20, 178–193. [DOI] [PubMed] [Google Scholar]
- Keon, J. , Rudd, J.J. , Antoniw, J. , Skinner, W. , Hargreaves, J. & Hammond‐Kosack, K. (2005) Metabolic and stress adaptation by Mycosphaerella graminicola during sporulation in its host revealed through microarray transcription profiling. Molecular Plant Pathology, 6, 527–540. [DOI] [PubMed] [Google Scholar]
- Khan, H. , McDonald, M.C. , Willams, S.J. & Solomon, P. (2020) Assessing the efficacy of CRISPR/Cas9 genome editing in the wheat pathogen Parastagonspora nodorum . Fungal Biology and Biotechnology, 7, 4. [DOI] [PMC free article] [PubMed] [Google Scholar]
- Kilaru, S. , Schuster, M. , Latz, M. , Das Gupta, S. , Steinberg, N. , Fones, H. et al. (2015) A gene locus for targeted ectopic gene integration in Zymoseptoria tritici . Fungal Genetics and Biology, 79, 118–124. [DOI] [PMC free article] [PubMed] [Google Scholar]
- Kojima, K.K. (2019) Structural and sequence diversity of eukaryotic transposable elements. Genes & Genetic Systems, 94, 233–252. [DOI] [PubMed] [Google Scholar]
- Kolde, R. (2015) pheatmap: pretty heatmaps. R Package. version 1.0.8, 1–7. [Google Scholar]
- Koren, S. , Walenz, B.P. , Berlin, K. , Miller, J.R. , Bergman, N.H. & Phillippy, A.M. (2017) Canu: Scalable and accurate long‐read assembly via adaptive κ‐mer weighting and repeat separation. Genome Research, 27, 722–736. [DOI] [PMC free article] [PubMed] [Google Scholar]
- Lee, W.‐S. , Rudd, J.J. , Hammond‐Kosack, K.E. & Kanyuka, K. (2014) Mycosphaerella graminicola LysM effector‐mediated stealth pathogenesis subverts recognition through both CERK1 and CEBiP homologues in wheat. Molecular Plant‐Microbe Interactions, 27, 236–243. [DOI] [PubMed] [Google Scholar]
- Lin, S.Y. , Chooi, Y.H. & Solomon, P.S. (2018) The global regulator of pathogenesis PnCon7 positively regulates Tox3 effector gene expression through direct interaction in the wheat pathogen Parastagonospora nodorum . Molecular Microbiology, 109, 78–90. [DOI] [PubMed] [Google Scholar]
- Loman, N.J. , Quick, J. & Simpson, J.T. (2015) A complete bacterial genome assembled de novo using only Nanopore sequencing data. Nature Methods, 12, 733–735. [DOI] [PubMed] [Google Scholar]
- Marshall, R. , Kombrink, A. , Motteram, J. , Loza‐Reyes, E. , Lucas, J. , Hammond‐Kosack, K.E. et al. (2011) Analysis of two in planta expressed LysM effector homologs from the fungus Mycosphaerella graminicola reveals novel functional properties and varying contributions to virulence on wheat. Plant Physiology, 156, 756–769. [DOI] [PMC free article] [PubMed] [Google Scholar]
- McDonald, M.C. , McGinness, L. , Hane, J.K. , Williams, A.H. , Milgate, A. & Solomon, P.S. (2016) Utilizing gene tree variation to identify candidate effector genes in Zymoseptoria tritici . G3: Genes, Genomes, Genetics, 6, 779–791. [DOI] [PMC free article] [PubMed] [Google Scholar]
- McDonald, M.C. , Renkin, M. , Spackman, M. , Orchard, B. , Croll, D. , Solomon, P.S. et al. (2019) Rapid parallel evolution of azole fungicide resistance in Australian populations of the wheat pathogen Zymoseptoria tritici . Applied and Environmental Microbiology, 85, e01908‐18. [DOI] [PMC free article] [PubMed] [Google Scholar]
- McDonald, M.C. , Taranto, A.P. , Hill, E. , Schwessinger, B. , Liu, Z. , Simpfendorfer, S. , et al. (2019) Transposon‐mediated horizontal transfer of the host‐specific virulence protein ToxA between three fungal wheat pathogens. mBio, 10, e01515‐19. [DOI] [PMC free article] [PubMed] [Google Scholar]
- Meile, L. , Croll, D. , Brunner, P.C. , Plissonneau, C. , Hartmann, F.E. , McDonald, B.A. et al. (2018) A fungal avirulence factor encoded in a highly plastic genomic region triggers partial resistance to Septoria tritici blotch. New Phytologist, 219, 1048–1061. [DOI] [PMC free article] [PubMed] [Google Scholar]
- Möller, M. , Habig, M. , Freitag, M. & Stukenbrock, E.H. (2018) Extraordinary genome instability and widespread chromosome rearrangements during vegetative growth. Genetics, 210, 517–529. [DOI] [PMC free article] [PubMed] [Google Scholar]
- O’Driscoll, A. , Kildea, S. , Doohan, F. , Spink, J. & Mullins, E. (2014) The wheat–Septoria conflict: a new front opening up? Trends in Plant Science, 19, 602–610. [DOI] [PubMed] [Google Scholar]
- Orton, E.S. , Deller, S. & Brown, J.K.M.M. (2011) Mycosphaerella graminicola: from genomics to disease control. Molecular Plant Pathology, 12, 413–424. [DOI] [PMC free article] [PubMed] [Google Scholar]
- Palma‐Guerrero, J. , Ma, X. , Torriani, S.F.F. , Zala, M. , Francisco, C.S. , Hartmann, F.E. et al. (2017) Comparative transcriptome analyses in Zymoseptoria tritici reveal significant differences in gene expression among strains during plant infection. Molecular Plant‐Microbe Interactions, 30, 231–244. [DOI] [PubMed] [Google Scholar]
- Parlevliet, J.E. (1979) Components of resistance that reduce the rate of epidemic development. Annual Review of Phytopathology, 17, 203–222. [Google Scholar]
- Perron, H. , Jouvin‐Marche, E. , Michel, M. , Ounanian‐Paraz, A. , Camelo, S. , Dumon, A. et al. (2001) Multiple sclerosis retrovirus particles and recombinant envelope trigger an abnormal immune response in vitro, by inducing polyclonal Vβ16 T‐lymphocyte activation. Virology, 287, 321–332. [DOI] [PubMed] [Google Scholar]
- Pertea, M. , Pertea, G.M. , Antonescu, C.M. , Chang, T.‐C. , Mendell, J.T. & Salzberg, S.L. (2015) StringTie enables improved reconstruction of a transcriptome from RNA‐seq reads. Nature Biotechnology, 33, 290–295. [DOI] [PMC free article] [PubMed] [Google Scholar]
- Poppe, S. , Dorsheimer, L. , Happel, P. & Stukenbrock, E.H. (2015) Rapidly evolving genes are key players in host specialization and virulence of the fungal wheat pathogen Zymoseptoria tritici (Mycosphaerella graminicola) . PLoS Pathogens, 11, e1005055. [DOI] [PMC free article] [PubMed] [Google Scholar]
- Quevillon, E. , Silventoinen, V. , Pillai, S. , Harte, N. , Mulder, N. , Apweiler, R. et al. (2005) InterProScan: protein domains identifier. Nucleic Acids Research, 33, W116–W120. [DOI] [PMC free article] [PubMed] [Google Scholar]
- Raymond, C.K. , Pownder, T.A. & Sexson, S.L. (1999) General method for plasmid construction using homologous recombination. BioTechniques, 26, 134–141. [DOI] [PubMed] [Google Scholar]
- Robinson, M.D. , McCarthy, D.J. & Smyth, G.K. (2010) edgeR: a Bioconductor package for differential expression analysis of digital gene expression data. Bioinformatics, 26, 139–140. [DOI] [PMC free article] [PubMed] [Google Scholar]
- Rudd, J.J. , Kanyuka, K. , Hassani‐Pak, K. , Derbyshire, M. , Andongabo, A. , Devonshire, J. et al. (2015) Transcriptome and metabolite profiling of the infection cycle of Zymoseptoria tritici on wheat reveals a biphasic interaction with plant immunity involving differential pathogen chromosomal contributions and a variation on the hemibiotrophic lifestyle definition. Plant Physiology, 167, 1158–1185. [DOI] [PMC free article] [PubMed] [Google Scholar]
- Sánchez‐Vallet, A. , McDonald, M.C. , Solomon, P.S. & McDonald, B.A. (2015) Is Zymoseptoria tritici a hemibiotroph? Fungal Genetics and Biology, 79, 29–32. [DOI] [PubMed] [Google Scholar]
- Selker, E.U. (2002) Repeat‐induced gene silencing in fungi. Advances in Genetics, 46, 439–450. [DOI] [PubMed] [Google Scholar]
- Sexton, A.C. & Howlett, B.J. (2001) Green fluorescent protein as a reporter in the Brassica–Leptosphaeria maculans interaction. Physiological and Molecular Plant Pathology, 58, 13–21. [Google Scholar]
- Solomon, P.S. , Thomas, S.W. , Spanu, P. , Oliver, R.P. (2003) The utilisation of di/tripeptides by Stagonospora nodorum is dispensable for wheat infection. Physiological and Molecular Plant Pathology, 63 , 191–199. [Google Scholar]
- Sperschneider, J. , Dodds, P.N. , Gardiner, D.M. , Singh, K.B. & Taylor, J.M. (2018) Improved prediction of fungal effector proteins from secretomes with EffectorP 2.0. Molecular Plant Pathology, 19, 2094–2110. [DOI] [PMC free article] [PubMed] [Google Scholar]
- Sperschneider, J. , Gardiner, D.M. , Dodds, P.N. , Tini, F. , Covarelli, L. , Singh, K.B. et al. (2016) EffectorP: Predicting fungal effector proteins from secretomes using machine learning. New Phytologist, 210, 743–761. [DOI] [PubMed] [Google Scholar]
- Sprouffske, K. & Wagner, A. (2016) Growthcurver: an R package for obtaining interpretable metrics from microbial growth curves. BMC Bioinformatics, 17, 172. [DOI] [PMC free article] [PubMed] [Google Scholar]
- Stamatakis, A. (2014) RAxML version 8: a tool for phylogenetic analysis and post‐analysis of large phylogenies. Bioinformatics, 30, 1312–1313. [DOI] [PMC free article] [PubMed] [Google Scholar]
- Stewart, E.L. , Croll, D. , Lendenmann, M.H. , Sanchez‐Vallet, A. , Hartmann, F.E. , Palma‐Guerrero, J. et al. (2017) Quantitative trait locus mapping reveals complex genetic architecture of quantitative virulence in the wheat pathogen Zymoseptoria tritici . Molecular Plant Pathology, 19, 201–216. [DOI] [PMC free article] [PubMed] [Google Scholar]
- Stewart, E.L. & McDonald, B.A. (2014) Measuring quantitative virulence in the wheat pathogen Zymoseptoria tritici using high‐throughput automated image analysis. Phytopathology, 104, 985–992. [DOI] [PubMed] [Google Scholar]
- Suffert, F. , Ravigné, V. & Sachec, I. (2015) Seasonal changes drive short‐term selection for fitness traits in the wheat pathogen Zymoseptoria tritici . Applied and Environmental Microbiology, 81, 6367–6379. [DOI] [PMC free article] [PubMed] [Google Scholar]
- Suffert, F. , Sache, I. & Lannou, C. (2011) Early stages of Septoria tritici blotch epidemics of winter wheat: build‐up, overseasoning, and release of primary inoculum. Plant Pathology, 60, 166–177. [Google Scholar]
- Testa, A.C. , Hane, J.K. , Ellwood, S.R. & Oliver, R.P. (2015) CodingQuarry: highly accurate hidden Markov model gene prediction in fungal genomes using RNA‐seq transcripts. BMC Genomics, 16, 170. [DOI] [PMC free article] [PubMed] [Google Scholar]
- Thomas, S.R. & Elkinton, J.S. (2004) Pathogenicity and virulence. Journal of Invertebrate Pathology, 85, 146–151. [DOI] [PubMed] [Google Scholar]
- Tiley, A.M.M. , White, H.J. , Foster, G.D. & Bailey, A.M. (2019) The ZtvelB gene is required for vegetative growth and sporulation in the wheat pathogen Zymoseptoria tritici . Frontiers in Microbiology, 10, 2210. [DOI] [PMC free article] [PubMed] [Google Scholar]
- Torriani, S.F.F. , Melichar, J.P.E. , Mills, C. , Pain, N. , Sierotzki, H. & Courbot, M. (2015) Zymoseptoria tritici: A major threat to wheat production, integrated approaches to control. Fungal Genetics and Biology, 79, 8–12. [DOI] [PubMed] [Google Scholar]
- Vaser, R. , Sović, I. , Nagarajan, N. & Šikić, M. (2017) Fast and accurate de novo genome assembly from long uncorrected reads. Genome Research, 27, 737–746. [DOI] [PMC free article] [PubMed] [Google Scholar]
- Walker, B.J. , Abeel, T. , Shea, T. , Priest, M. , Abouelliel, A. , Sakthikumar, S. et al. (2014) Pilon: An integrated tool for comprehensive microbial variant detection and genome assembly improvement. PLoS One, 9, e112963. [DOI] [PMC free article] [PubMed] [Google Scholar]
- Wicker, T. , Sabot, F. , Hua‐Van, A. , Bennetzen, J.L. , Capy, P. , Chalhoub, B. et al. (2007) A unified classification system for eukaryotic transposable elements. Nature Reviews Genetics, 8, 973–982. [DOI] [PubMed] [Google Scholar]
- Yang, N. , McDonald, M.C. , Solomon, P.S. & Milgate, A.W. (2018) Genetic mapping of Stb19, a new resistance gene to Zymoseptoria tritici in wheat. Theoretical and Applied Genetics, 131, 2765–2773. [DOI] [PubMed] [Google Scholar]
- Zhong, Z. , Marcel, T.C. , Hartmann, F.E. , Ma, X. , Plissonneau, C. , Zala, M. et al. (2017) A small secreted protein in Zymoseptoria tritici is responsible for avirulence on wheat cultivars carrying the Stb6 resistance gene. New Phytologist, 214, 619–631. [DOI] [PubMed] [Google Scholar]
Associated Data
This section collects any data citations, data availability statements, or supplementary materials included in this article.
Supplementary Materials
FIGURE S1 The in planta expression of the genes in the REP9 element in WAI321, WAI323, and WAI332. (a) Mapped RNA reads visualized in IGV. The red box highlights the REP9‐1 gene. The black dotted‐line box highlights the entire 7.9‐kb REP9 element. (b, c, d) The in planta expression of the (b) REP9‐3, (c) REP9‐4, and (d) REP9‐1 genes in the three Zymoseptoria tritici isolates at 9 and 14 days post‐inoculation (dpi). The relative expression values were calculated by dividing the normalized counts‐per‐million (CPM) value of the target gene by the normalized CPM value of Actin in each sample. One dot indicates one sample. Numbers on top represent the mean of each group
FIGURE S2 Multiple sequence alignment of the conserved RVE domain region sequences of REP9‐4 and the BLASTp hits from NCBI and RepBase
FIGURE S3 The REP9 element and the ancestral insertion site in Zymoseptoria tritici. (a) Schematic drawing showing the locations of REP9 in the three Australian Zymoseptoria tritici genomes. The sequences in the dashed boxes show the terminal inverted repeats (TIRs) and target site duplications (TSDs) in the REP9 element. (b) Sequence logo of the REP9 integration site sequences (36 sequences) in the three Z. tritici isolates. The height of each letter is proportional to the frequency of the base
FIGURE S4 The alignments of REP9‐1 amino acid sequences and coding sequences (CDSs) from WAI321 and WAI323 and the SNPs in the REP9‐1 promoter region in WAI321. (a, b) Amino acid sequence alignment of REP9‐1 in WAI323 (a) and WAI321 (b) using WAI332 REP9‐1 as the reference sequence. In WAI323, 8 of the 16 copies encode the full‐length REP9‐1 protein, while in WAI321, 2 out of 11 the copies encode the full‐length REP9‐1 protein. Highlighted sites indicate mutated amino acids. (c) Two copies of the WAI321 REP9‐1 CDS were identical to the WAI332 REP9‐1 CDS; however, these two copies had single‐nucleotide polymorphisms (SNPs) (black lines in the grey blocks) in the promoter region. Arrows indicate the SNPs that may have an impact on REP9‐1 expression. (d, e) Alignment of the REP9‐1 CDSs from WAI323 (d) and WAI321 (e). Coloured bars other than grey indicate SNPs (red A, green T, blue C, yellow G)
FIGURE S5 In vitro expression levels of the four REP9 genes (a) REP9‐1, (b) REP9‐2, (c) REP9‐3, and (d) REP9‐4 in the three wild‐type (WT) and five mutant Zymoseptoria tritici strains used in this study. Gene expression was measured in biological triplicate, bars indicate ±SEM
FIGURE S6 Millewa and Hereward infection assay. (a) Pycnidia density (pycnidia per cm2 lesion) produced by the wild‐type (WT) WAI332 and silencing mutant WAI332‐RNAi‐CDS2‐50 on the wheat cultivar Millewa at 22 days post‐inoculation (dpi). At least eight leaves were collected for each isolate in the experiment. (b) Pycnidia density produced by WT WAI321 and the two overexpression (OE) mutants WAI321‐OE‐NA116 and WAI321‐OE‐NA119 on the wheat cultivar Hereward at 21 dpi. At least 11 leaves were collected for each isolate in the experiment. All data in (a) and (b) passed the D’Agostino–Pearson normality test (omnibus K2 test); analysis of variance was conducted with the post hoc Tukey multiple comparisons test. Each dot represents an individual leaf sample; numbers on top represent the mean of each group; bars indicate ±SD; ***p < .001. These two experiments have not been repeated
FIGURE S7 Infection assays of the transformation controls. (a, b) The (a) number and (b) density of pycnidia produced by wild‐type (WT) WAI332 and the REP9‐1 RNAi‐silenced transformants on infected WW2449 leaves. The WAI332‐RNAi‐CDS2‐10 isolate (transformation control) showed no significant change in the number/density of pycnidia produced on the infected leaves compared to the WT WAI332. At least nine leaves were collected for each isolate. The WAI332‐RNAi‐CDS2‐10 infection assay has not been repeated. (c, d) The (c) number and (d) density of pycnidia produced by WT WAI321 and the REP9‐1 overexpression (OE) transformants on infected WW2449 leaves. The WAI321‐OE‐NA79 isolate (transformation control) showed no significant change in the number/density of pycnidia produced on the infected leaves compared to the WT WAI321. At least 14 leaves were collected for each isolate. The WAI321‐OE‐NA79 infection assay has not been repeated. (e) Pycnidia density produced by WT WAI321 and the REP9‐1 OE transformants on the wheat cultivar Tadorna. The transformation control showed no significant change in the pycnidia density produced on the infected leaves compared to the WT WAI321. Each infection assay was repeated three times and at least 11 leaves were collected for each isolate in each experiment. All data in (a), (b), (c), (d), and (e) passed the D’Agostino–Pearson normality test (omnibus K2 test); analysis of variance was conducted with the post hoc Tukey multiple comparisons test. Each dot represents an individual leaf sample; numbers on top represent the mean of each group; bars indicate ±SD; *p < .05, **p < .01, ***p < .001, ****p < .0001
FIGURE S8 In vitro stress assays for the Zymoseptoria tritici wild types (WTs) and mutants. Blastospores from 3‐day‐old cultures (3 µl of 106 spores/ml and three 1:10 serial dilutions) were inoculated on the solid medium plates. All plates were incubated for 6 days at 20 °C. The growth of the mutants showed no difference compared to the corresponding WTs
TABLE S1 The expression (log2(FC)) and Blast2GO annotation of the 153 WAI321‐specific differentially expressed genes
TABLE S2 In planta expression levels (CPM) of the four genes in the REP9 element
TABLE S3 NCBI BLASTp results for the proteins encoded by the genes in the REP9 element
TABLE S4 JGI (Mycocosm database) BLASTn results for the REP9 element
TABLE S5 Summary of genome assembly statistics in this study
TABLE S6 Primers used in this study
Data Availability Statement
All raw RNA‐Seq and genome sequencing data and associated assemblies are deposited under NCBI project PRJNA604047. CodingQuarry gene predictions for isolate WAI332, REP9‐4 RVE protein alignment, and the PHYRE2 structural predictions are provided on GitHub (https://github.com/SolomonLab/REP9‐1_Supplementary_Info).