PURPOSE
Plasma circulating tumor DNA (ctDNA) analysis is routine for genotyping of advanced non–small-cell lung cancer (NSCLC); however, early response assessment using plasma ctDNA has yet to be well characterized.
MATERIALS AND METHODS
Patients with advanced EGFR-mutant NSCLC across three phase I NCI osimertinib combination trials were analyzed in this study, and an institutional cohort of patients with KRAS-, EGFR-, and BRAF-mutant advanced NSCLC receiving systemic treatment was used for validation. Plasma was collected before treatment initiation and serially before each cycle of therapy, and key driver mutations in ctDNA were characterized by droplet digital polymerase chain reaction. Timing of plasma versus imaging response was compared in a separate cohort of patients with EGFR-mutant NSCLC treated with osimertinib. Across cohorts, we also studied ctDNA variability before treatment start.
RESULTS
In the NCI cohort, 14/16 (87.5%) patients exhibited ≥ 90% decrease in mutation abundance by the first on-treatment timepoint (20-28 days from treatment start) with minimal subsequent change. Similarly, 47/56 (83.9%) patients with any decrease in the institutional cohort demonstrated ≥ 90% decrease in mutation abundance by the first follow-up draw (7-30 days from treatment start). All 16 patients in the imaging cohort with radiographic partial response showed best plasma response within one cycle, preceding best radiographic response by a median of 24 weeks (range: 3-147 weeks). Variability in ctDNA levels before treatment start was observed.
CONCLUSION
Plasma ctDNA response is an early phenomenon, with the majority of change detectable within the first cycle of therapy. These kinetics may offer an opportunity for early insight into treatment effect before standard imaging timepoints.
INTRODUCTION
Plasma circulating tumor DNA (ctDNA) assays are routinely used in the clinical care of patients with advanced non–small-cell lung cancer (NSCLC) both at diagnosis to identify targetable driver mutations and at the time of progression to assess for mechanisms of acquired resistance.1-4 Beyond these clinical applications in NSCLC, plasma ctDNA analysis has also been widely studied as a liquid biopsy tool in minimal residual disease detection after definitive therapy, as well as in cancer screening.5-9 With a reported half-life between 16 minutes to 2.5 hours, the natural kinetics of plasma ctDNA make for a compelling biomarker of early response.10 For example, dramatic decreases of activating EGFR mutations have been observed as early as 2 days after initiation of EGFR tyrosine kinase inhibitor therapy.11 Emerging evidence has demonstrated an association between reduced plasma ctDNA variant levels and improved treatment efficacy and clinical outcomes,3,12-19 and this ability to capture real-time responses could provide an indication of therapeutic effect more nimbly than radiographic evaluation of tumor response.
CONTEXT
Key Objective
Plasma circulating tumor DNA (ctDNA) analysis may represent a novel tool for response assessment in advance of standard imaging timepoints; however, the early kinetics of plasma ctDNA following treatment initiation for advanced non–small-cell lung cancer (NSCLC) has yet to be comprehensively described.
Knowledge Generated
We analyzed changes in plasma ctDNA levels of key KRAS, EGFR, and BRAF driver mutations in patients with advanced NSCLC starting diverse systemic therapy regimens, finding that the vast majority of decreases in mutation abundance occur within the first cycle of treatment. We identify the potential for marked variation, primarily increases, in mutation concentration in the period before treatment start.
Relevance
Plasma ctDNA response is an early phenomenon, and the optimal initial assessment may be during or at the end of the first cycle of therapy, rather than in concert with standard imaging timepoints. Baseline plasma samples should be ideally drawn on the treatment start date.
Despite the breadth of its potential applications in cancer care, the early kinetics of ctDNA response to treatment for NSCLC has yet to be comprehensively described, with many analyses first evaluating plasma ctDNA changes at 6 weeks on-treatment or greater, corresponding to standard imaging timepoints. The increasing prevalence of ctDNA testing as part of patient care and clinical trial analyses has given rise to pertinent questions surrounding plasma ctDNA kinetics and how these changes correspond with therapeutic effect, particularly in light of significant discrepancies in the timing of specimen collection and modes of variant analysis in the literature. We hypothesized that plasma ctDNA response of key NSCLC driver mutations regularly precedes the earliest standard timepoints of radiographic imaging to monitor solid tumor response. Our study aims to characterize the timing and magnitude of early plasma ctDNA changes of EGFR, BRAF, and KRAS driver mutations among patients with advanced NSCLC receiving systemic therapy.
MATERIALS AND METHODS
Patients and Samples
NCI Cohort.
Serial plasma samples from baseline and the first three cycles (cycles ranged between 21 and 28 days) were collected from a cohort of 38 patients with NSCLC enrolled to the dose-escalation phase of three multi-institutional trials within the NCI Experimental Therapeutics Clinical Trials Network (ETCTN). All patients had previously treated EGFR-mutant NSCLC and were treated with osimertinib in combination with either necitumumab (NCI-9898, ClinicalTrials.gov identifier:NCT02496663), navitoclax (NCI-9903, ClinicalTrials.gov identifier:NCT02520778), or sapanisertib (NCI-9910, ClinicalTrials.gov identifier:NCT02503722).
Institutional Cohort.
For validation, we studied an institutional clinical cohort of patients with advanced NSCLC treated with systemic therapy at the Dana-Farber Cancer Institute (DFCI). Serial plasma samples from the pre-treatment screening draw at enrollment, pre-treatment baseline draw at cycle 1, and first two on-treatment follow-up draws were collected. The analysis was limited to 79 patients known to harbor a driver mutation in KRAS, EGFR, or BRAF.
Imaging Cohort.
For comparison with prospective imaging assessments, we collected serial plasma samples from 43 patients with advanced EGFR-mutant NSCLC treated at DFCI on a clinical trial of osimertinib in the subsequent-line setting, which has been reported previously.3,20 Imaging was performed approximately every 6 weeks.
All patients provided written informed consent, and the studies were conducted according to the Declaration of Helsinki.
Sample Processing and ddPCR Analysis
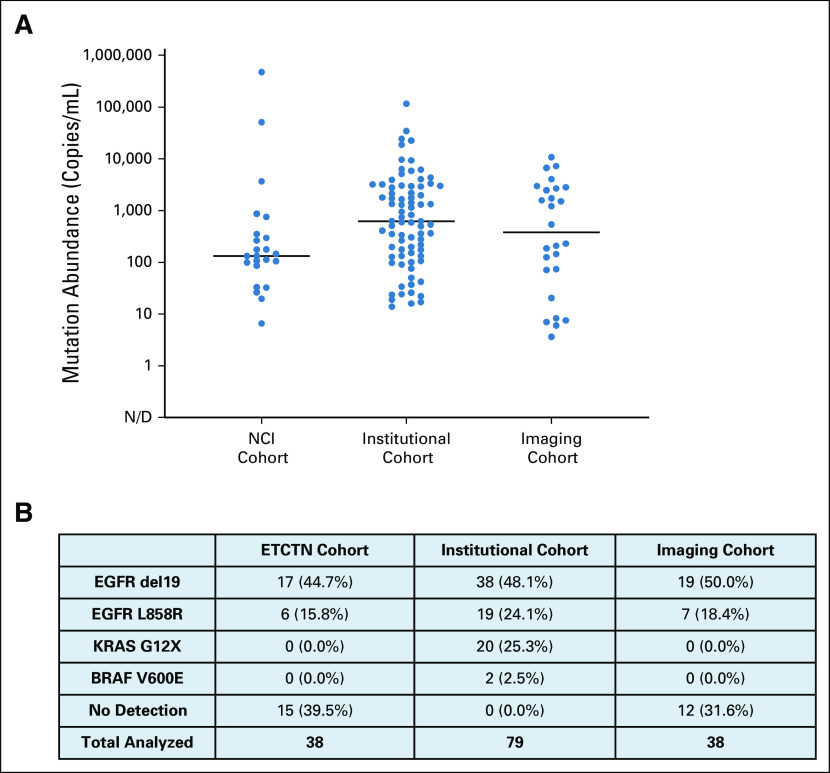
All plasma was collected with patient consent before each treatment on an IRB-approved protocol. Cell-free plasma was isolated from whole blood and stored on site at −80°C as previously described.14 Specimens collected at participating outside institutions for the NCI cohort were processed on site and shipped frozen. For all available plasma specimens, circulating nucleic acids were isolated from 2 mL of banked plasma, and relevant driver mutations were quantified by droplet digital polymerase chain reaction (ddPCR) as previously described.14 Mutation abundance was reported as mutant driver copies per mL of cell-free plasma (Appendix Fig A1).
Plasma Response Analysis
All 117 patients with available data from the NCI and institutional cohorts were considered for plasma response analysis. Eligibility included detection of the relevant driver mutation by ddPCR at pre-treatment baseline (cycle 1) in addition to availability of two subsequent plasma draws (NCI: at cycles 2 and 3; institutional: within 30 days and ≥ 31 days). Plasma ctDNA change was defined as the percent change in mutation abundance between consecutive timepoints after starting therapy, relative to levels detected at baseline before starting therapy. As such, all eligible subjects had metrics for initial ctDNA change between baseline and cycle 2, and subsequent ctDNA change between cycle 2 and cycle 3. Additional ddPCR data at cycle 4 were evaluated, if available. Plasma response was defined as any observed decrease in driver mutation abundance, taking as reference the baseline shed. Total plasma response was defined as the magnitude of plasma response at the nadir timepoint; time from treatment start to this nadir timepoint was termed the time to best plasma response, similar to conventional radiographic response nomenclature. The percentage of total plasma response observed at a given interval was calculated as the difference in mutation abundance between relevant consecutive timepoints taken as a percentage of the total plasma response, as defined above.
Pre-Treatment ctDNA Variability Analysis
All 122 patients with available data from the institutional and imaging cohorts were considered for pre-treatment ctDNA variability analysis. Eligibility included detection of the relevant driver mutation by ddPCR at baseline in addition to availability of a pre-treatment screening draw and a subsequent pre-treatment baseline draw closest to treatment initiation. Pre-treatment plasma ctDNA change was defined as the percent change in mutation abundance between screening and baseline draws relative to levels detected at screening.
RESULTS
Kinetics of Early Plasma Response in the NCI Cohort
We first studied serial plasma collected from the dose-escalation cohorts of three phase I trials within the NCI ETCTN in which patients with advanced EGFR-mutant NSCLC received osimertinib-based combination therapies. Of 38 patients considered for plasma response analysis, 15 had no detection of the reported EGFR driver mutation at baseline and seven had missing samples, leaving 16 eligible patients (Fig 1). Among these, 14/16 (87.5%) patients showed evidence of plasma response at any timepoint compared with baseline (Fig 2A and 2B and Appendix Fig A2A). All 14 of these patients achieved ≥ 90% of their total plasma response by cycle 2, between 20 and 28 days from treatment start. Eight (88.9%) of the nine patients who demonstrated a complete plasma response to nondetectable levels of ctDNA shed achieved clearance by cycle 2, and seven of these continued with no subsequent detection at both cycle 3 and 4. Across the NCI cohort, median plasma ctDNA change during the initial interval was found to be significantly greater than the median change observed during the subsequent interval between cycle 2 and cycle 3 (Z = −3.550, P < .001 Wilcoxon-Pratt signed-rank test). Plasma ctDNA values for 11 patients with available data at cycle 4 (range: 61-86 days after treatment start) additionally suggest little subsequent change in driver shed between cycle 3 and cycle 4 (median: 0.0% ctDNA change).
FIG 1.
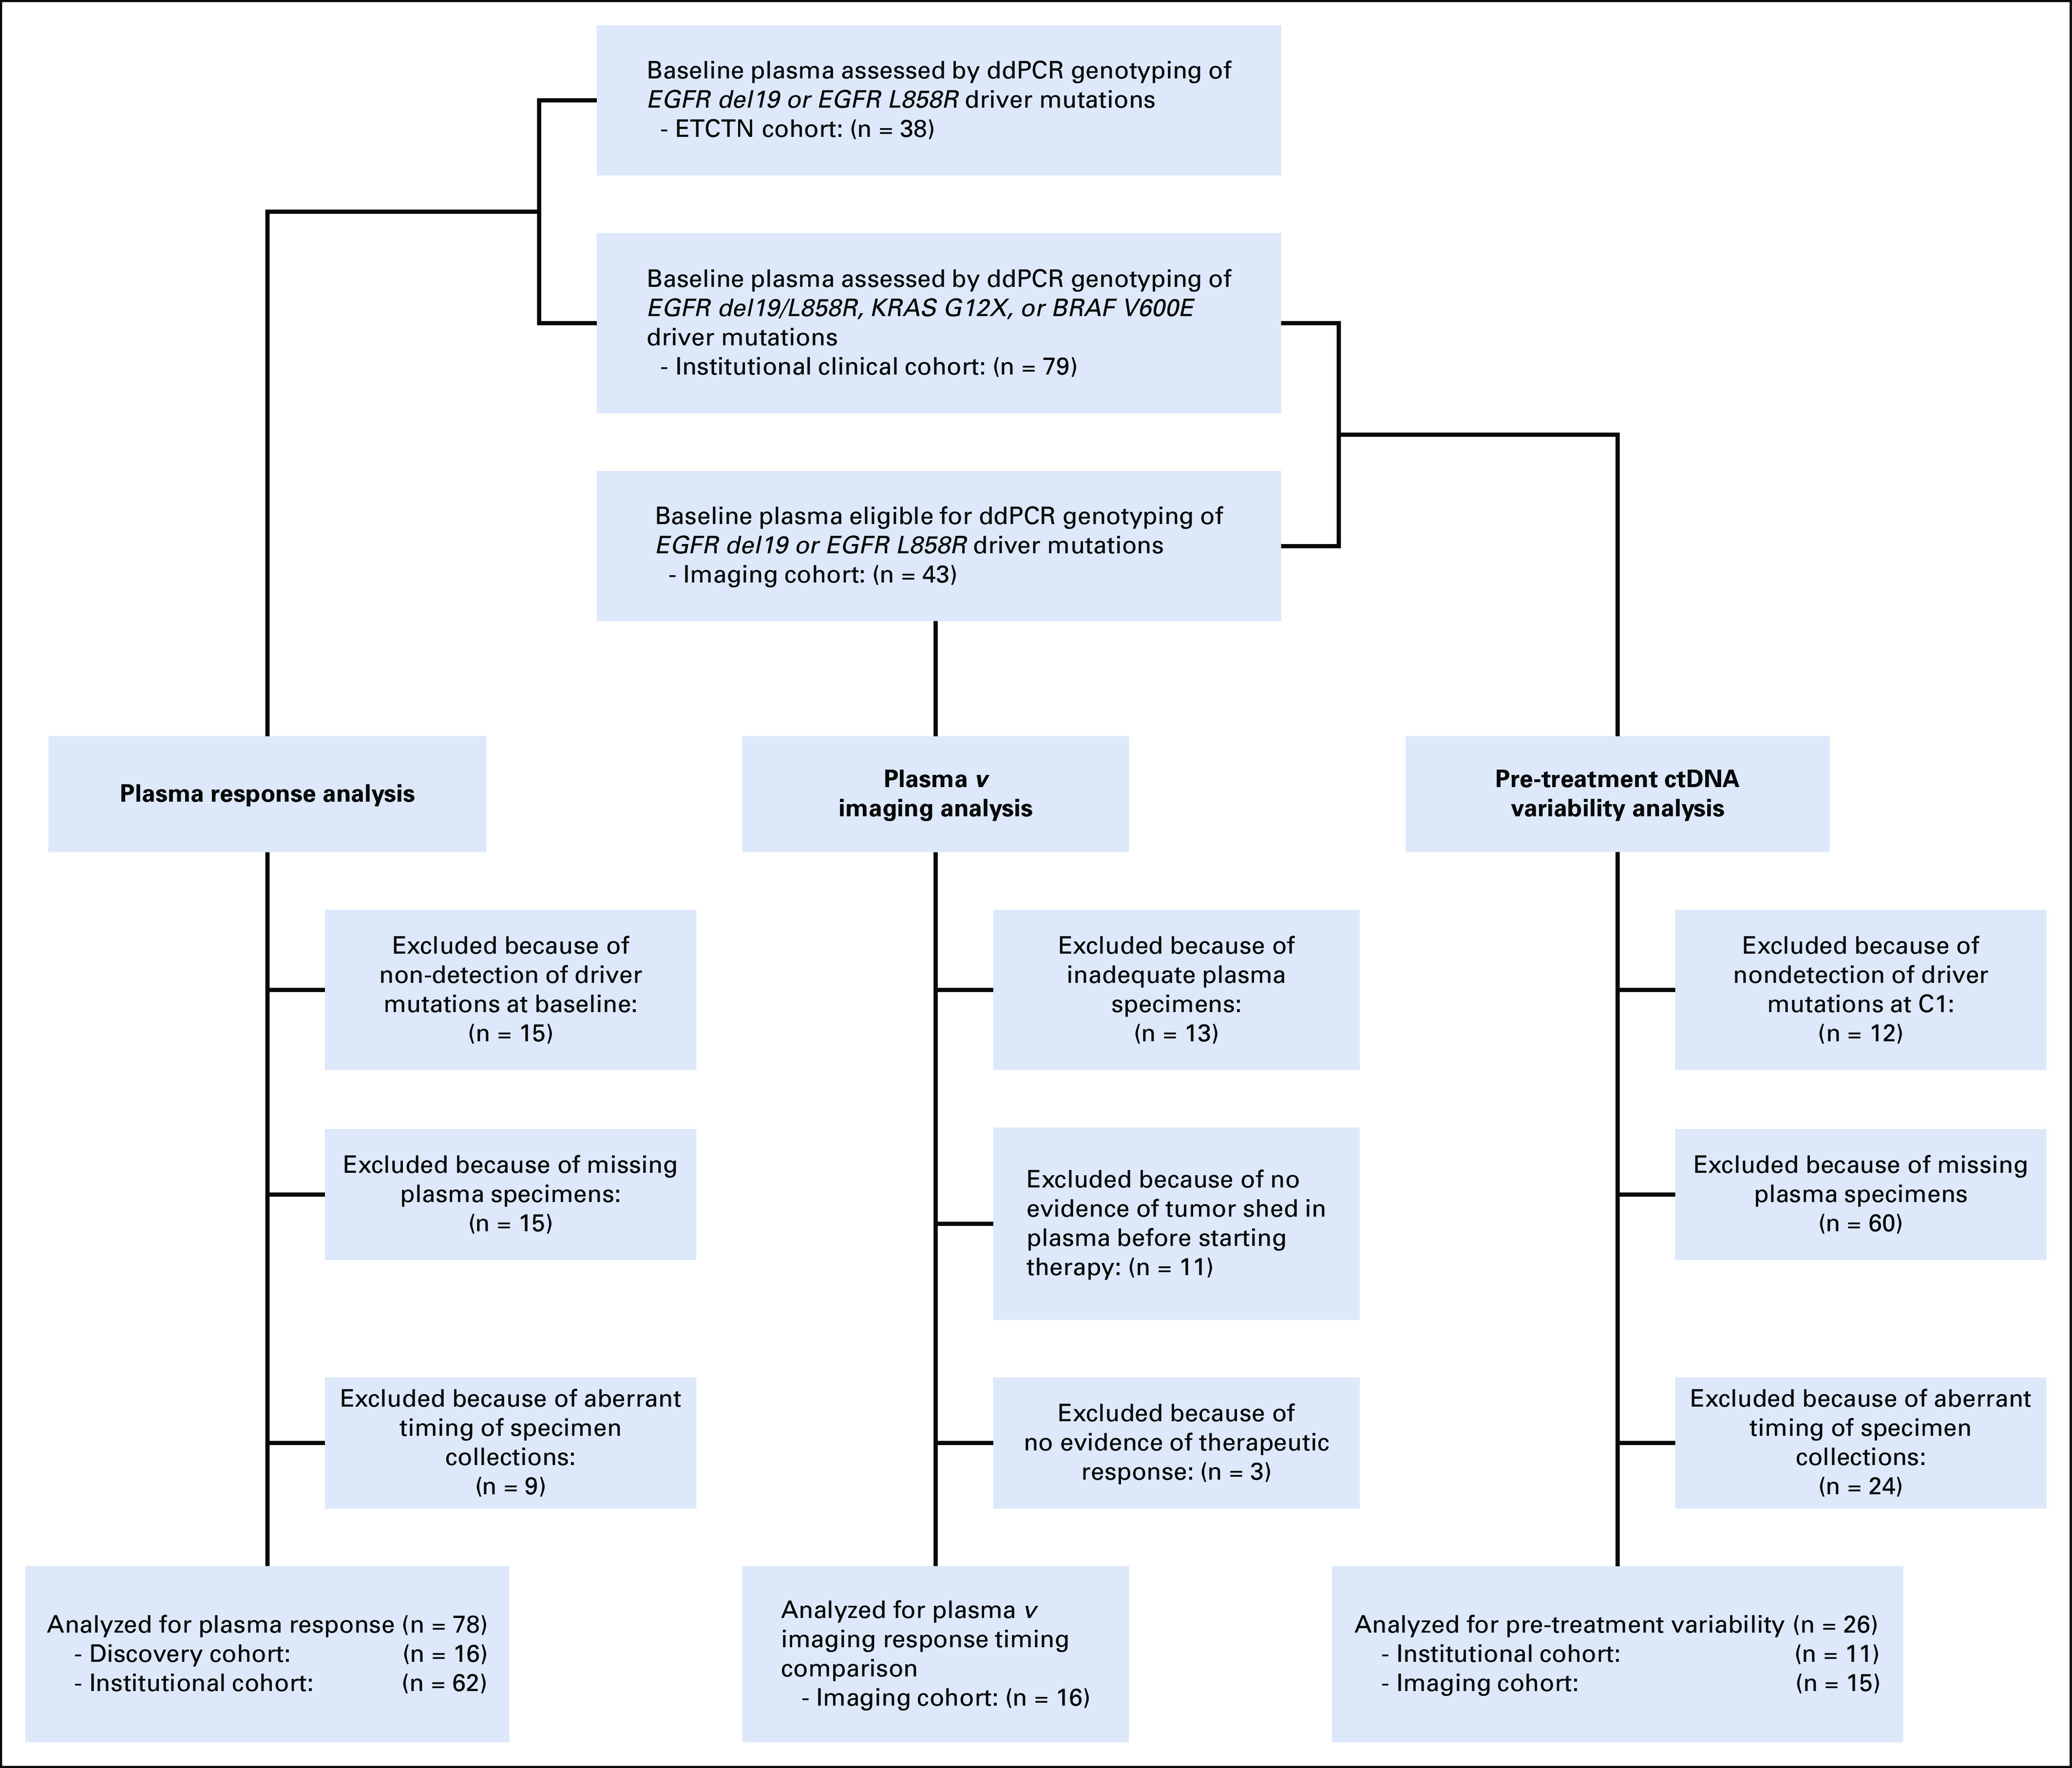
CONSORT diagram for plasma ctDNA analysis. A total of 38 patients from the NCI cohort, 79 patients from the institutional clinical cohort, and 43 patients from the imaging cohort were eligible for plasma ctDNA analysis. Of these, 78 patients were eligible for plasma response analysis, 16 patients were eligible for plasma response versus best radiographic response, and 26 patients were eligible for pre-treatment ctDNA variability analysis. ctDNA, circulating tumor DNA; ddPCR, droplet digital polymerase chain reaction.
FIG 2.
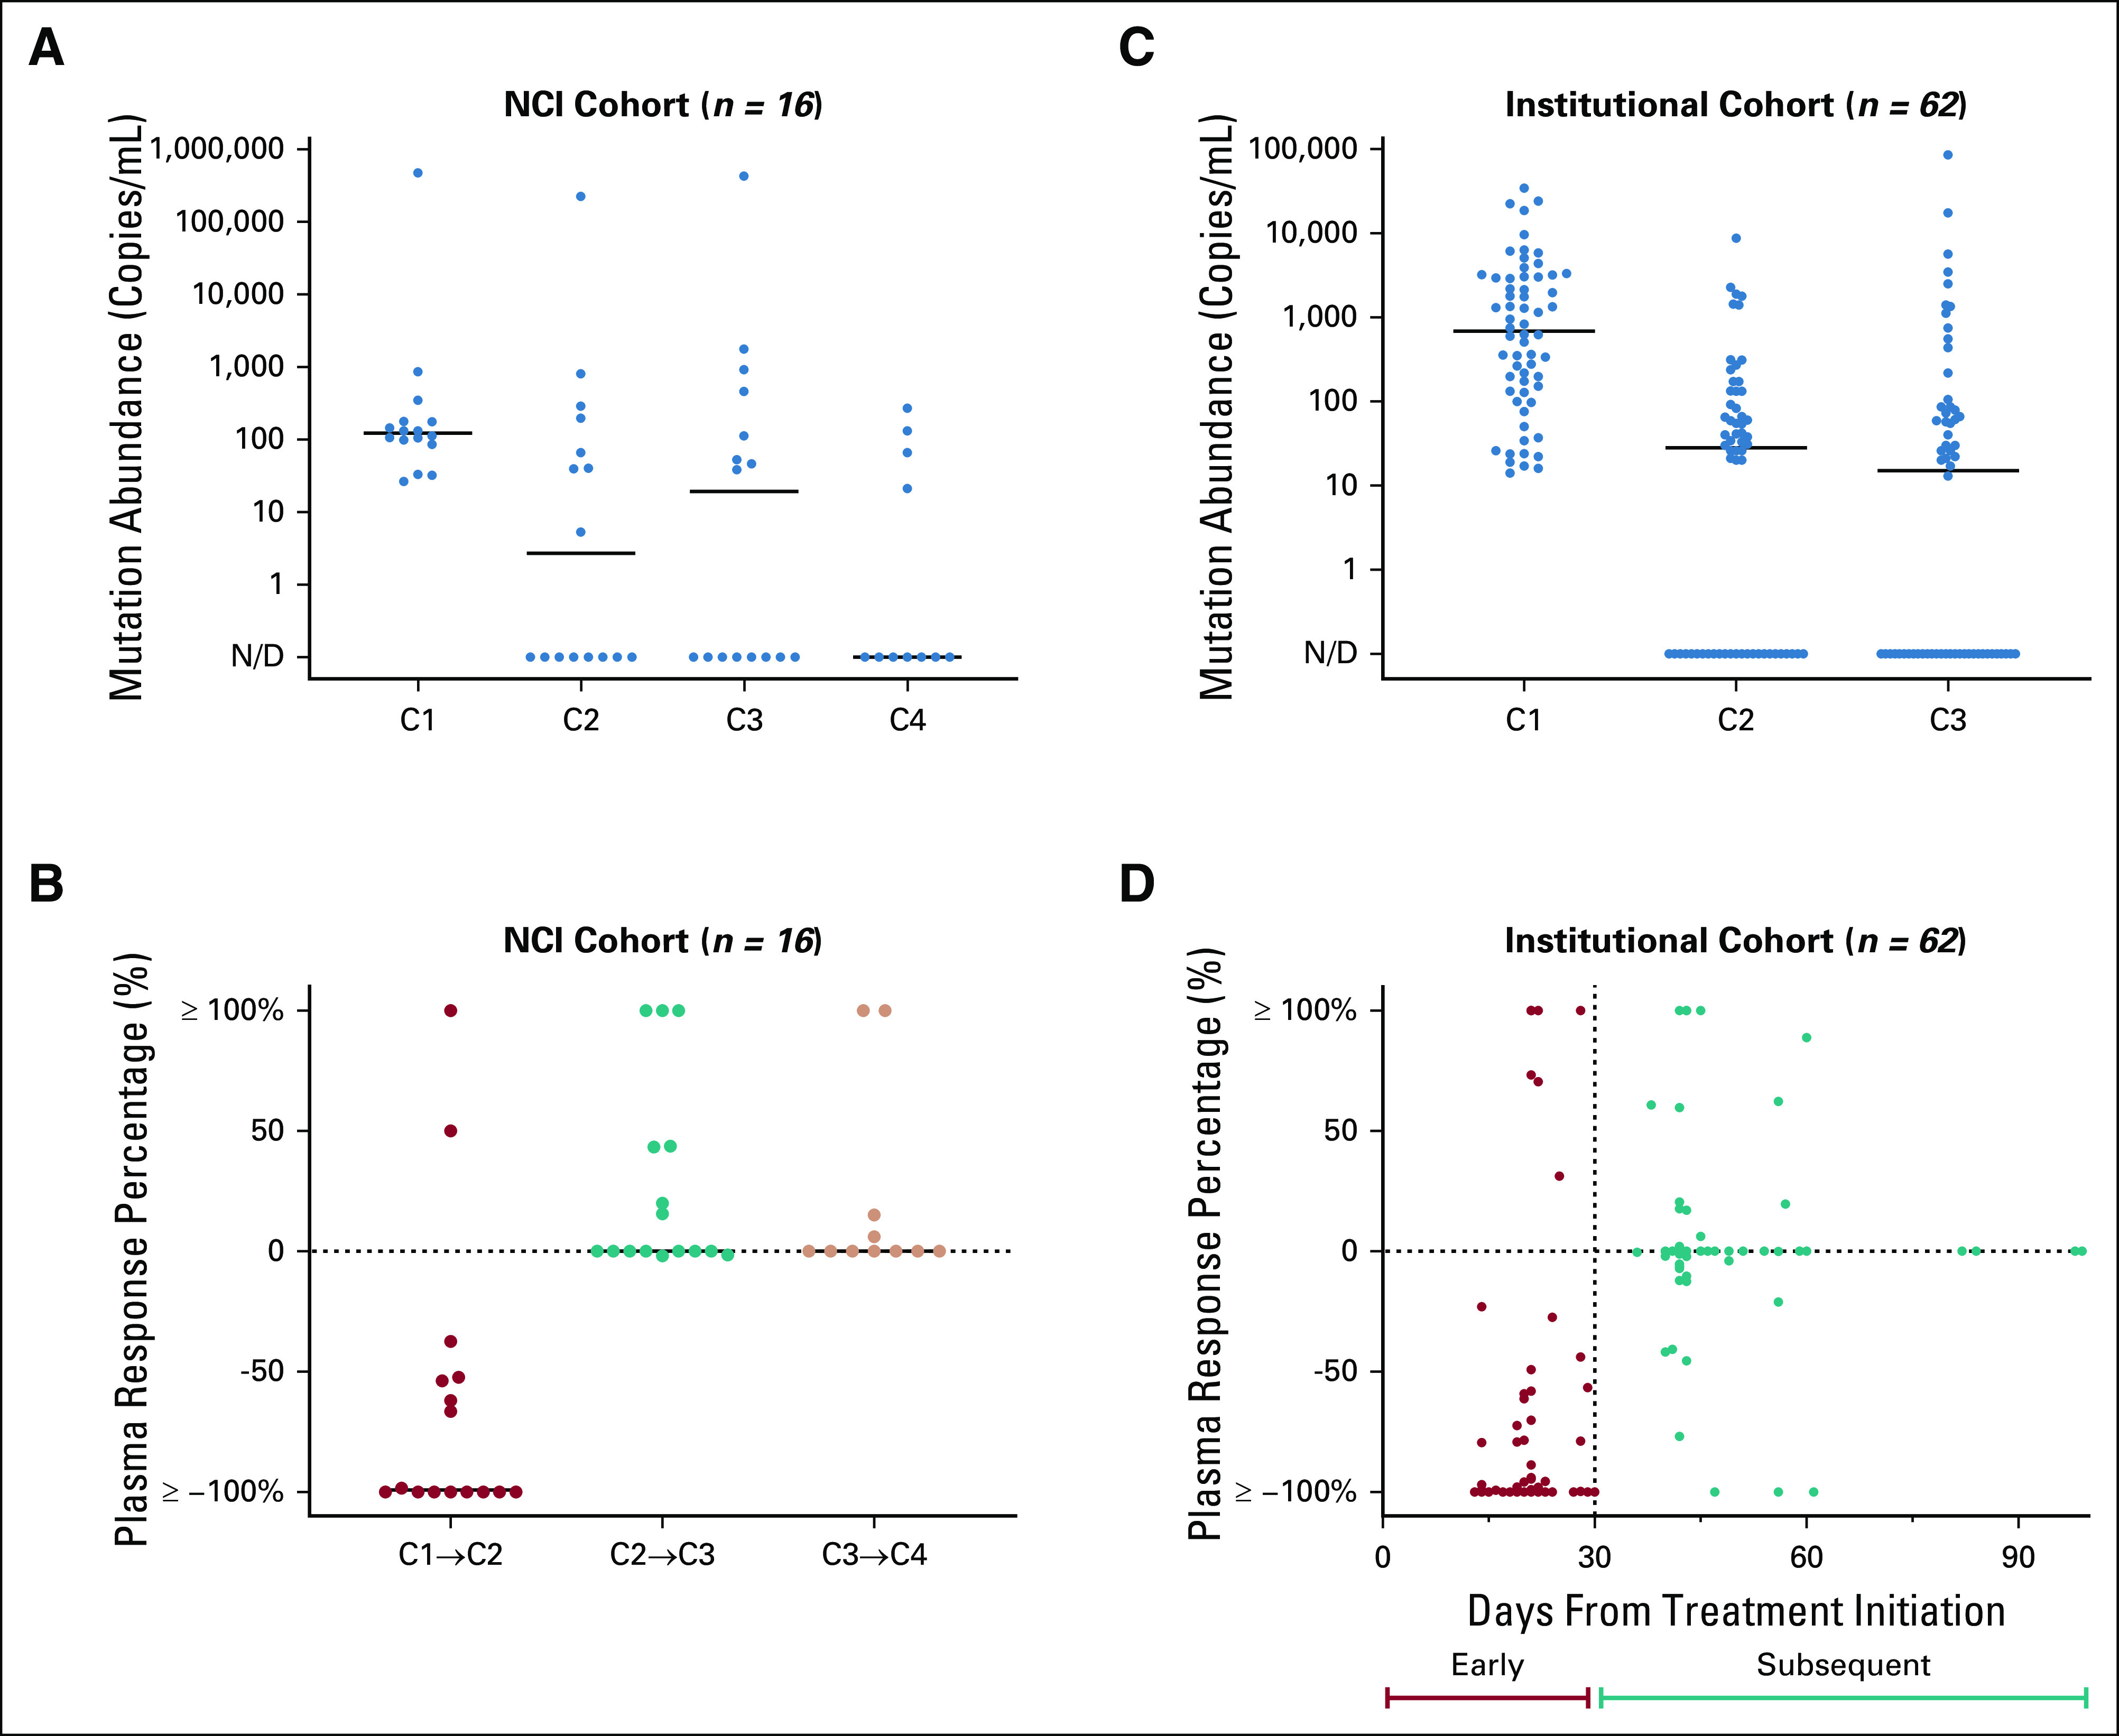
Relative change of driver mutation shed detected in plasma ctDNA. Dot plots comparing change in mutation abundance (copies/mL) of key driver mutations EGFR del19 or L858R, KRAS G12X, or BRAF V600E across consecutive intervals following treatment initiation for the NCI (A) and institutional (C) cohorts. The majority of responses are seen during the initial interval between cycle 1 and 2 for the NCI cohort (B) and between the baseline draw to the first follow-up draw for the institutional clinical cohort (D). ctDNA, circulating tumor DNA, N/D, not defined.
Kinetics of Early Plasma Response in the Institutional Cohort
To validate these kinetic findings, we studied plasma from an institutional cohort of patients with EGFR-, KRAS-, or BRAF-mutant advanced NSCLC initiating systemic therapy, including standard and investigational targeted therapy, cytotoxic chemotherapy, and/or immune checkpoint blockade. Of 79 total patients who were considered for plasma response analysis, 8 had missing plasma specimens and 9 had an inappropriately timed draw, leaving 62 patients eligible for subsequent analysis (Fig 1). Among 56/62 (90.3%) patients who demonstrated any plasma response, 47/56 (83.9%) demonstrated ≥ 90% of their total plasma response by the first follow-up timepoint between 7 and 30 days from treatment start. Complete plasma responses were seen in 35 patients, of which 25 (71.4%) cases were detected by the first follow-up timepoint, as early as 13 days following treatment initiation (Fig 2C and 2D and Appendix Fig A2B). As with the NCI cohort, median plasma ctDNA change observed for the institutional cohort within the initial interval between the baseline and first follow-up draw was found to be significantly greater than the median change observed during the subsequent interval between the first and second follow-up draws (Z = −5.164, P < .001; Wilcoxon-Pratt signed-rank test). Altogether, across both NCI and institutional cohorts, the median time to complete ctDNA clearance for patients who achieved it was 23.5 days (IQR, 21.0-31.3).
Best Radiographic Response Versus Best Plasma Response in the Imaging Cohort
To compare the kinetics of plasma response to the kinetics of radiographic response, we studied 43 patients with EGFR-mutant NSCLC treated on a prospective trial of osimertinib. Of 19 patients with plasma samples available and evidence of ctDNA shed, 16 exhibited a reduction of plasma ctDNA levels and a reduction of tumor diameter measured on therapy. Median time to best plasma response was one cycle (21 days, range: 7-84 days) compared with eight cycles (169 days, range: 41-1,050 days) for median time to best radiographic response (Fig 3). Median time between 90% of plasma response and first radiographic partial response on was one cycle (28 days, range: 22-121 days). Thirteen of 16 patients had a partial response on imaging, and their best plasma response (70%-100% decrease) preceded best response on imaging by a median of 24 weeks (range: 3-147 weeks).
FIG 3.
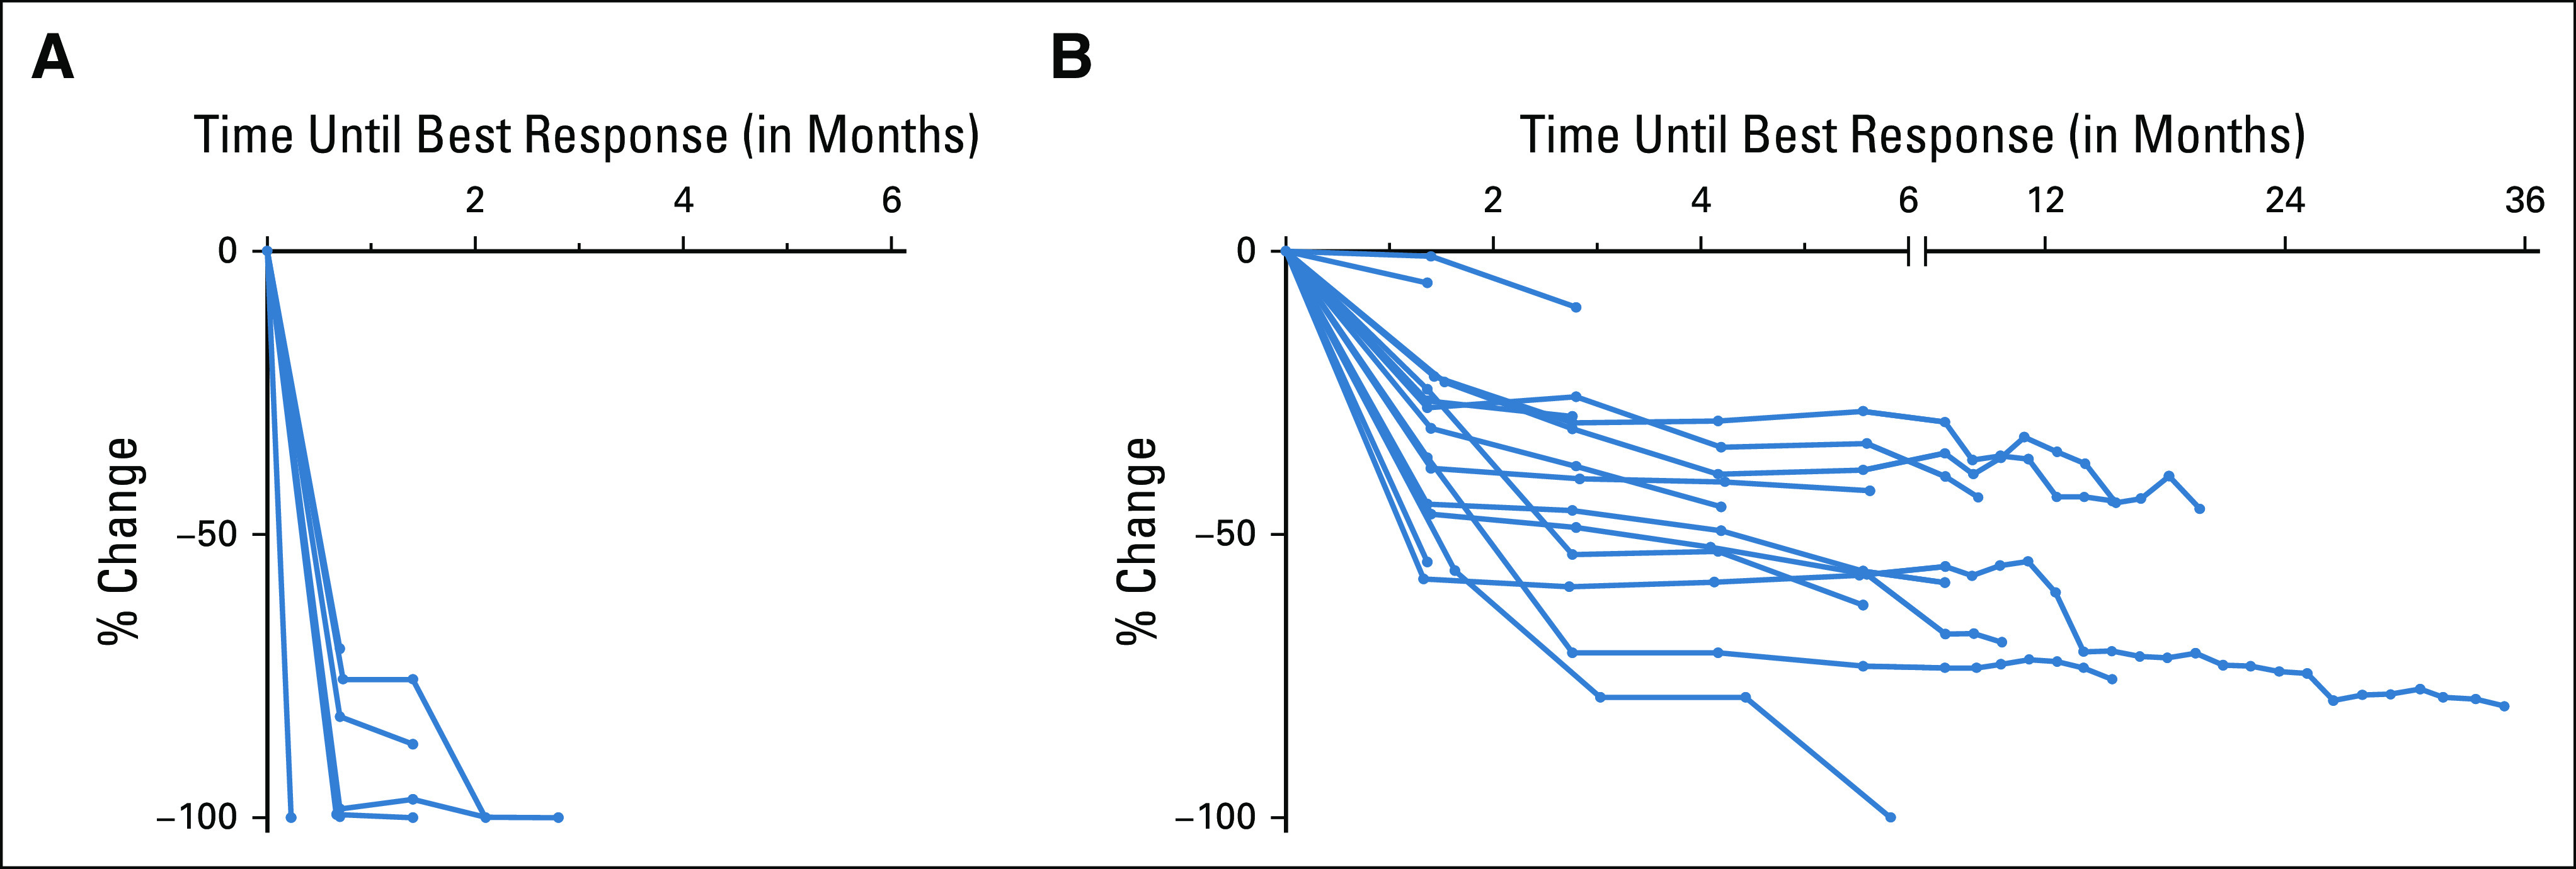
Best plasma response versus best radiographic response. (A) Percent change in copies/mL of the EGFR driver mutation in plasma until best response is achieved. Best plasma response was defined as the first undetectable timepoint (N = 12) or the nadir timepoint with a subsequent increase at the next draw (N = 4). (B) Percent change in imaging until best response is achieved. Note that additional data following best response in plasma and on imaging were captured but not shown here.
Variability in ctDNA Levels Before Treatment Start
Meaningful assessment of plasma response in part depends on accurate measurement of pre-treatment baseline levels of ctDNA shed. Twenty-six patients with detectable driver mutations (EGFR or KRAS) in baseline plasma ctDNA and availability of two pre-treatment draws within 30 days were analyzed, with a median of 9.5 days between draws (range: 1-28 days, IQR: 6.25-15.5 days). 10/26 (38.5%) of patients demonstrated > 20% increase between pre-treatment draws, with a median change of +264.0 (range: + 2 to + 5,681, IQR: + 112.4 to + 1,096.9) copies/mL. 6/26 (23.1%) demonstrated > 20% decrease, with a median change of −220.3 (range: −64,284 to −79, IQR: −8,827.5 to −107.9) copies/mL. The remaining 10/26 (38.5%) had values within ±20%, with median change of + 9.5 (range: −68.3 to +749, IQR: −0.6 to +251.0) copies/mL (Fig 4). Limited clinical annotation prevented comprehensive identification of factors, which might explain substantial decreases in ctDNA levels identified in several cases; however, for the patient with the largest numeric decrease (68,649-4,356 copies/mL), palliative radiotherapy to a large field was administered for symptomatic bone metastases during the 21-day interval between draws.
FIG 4.
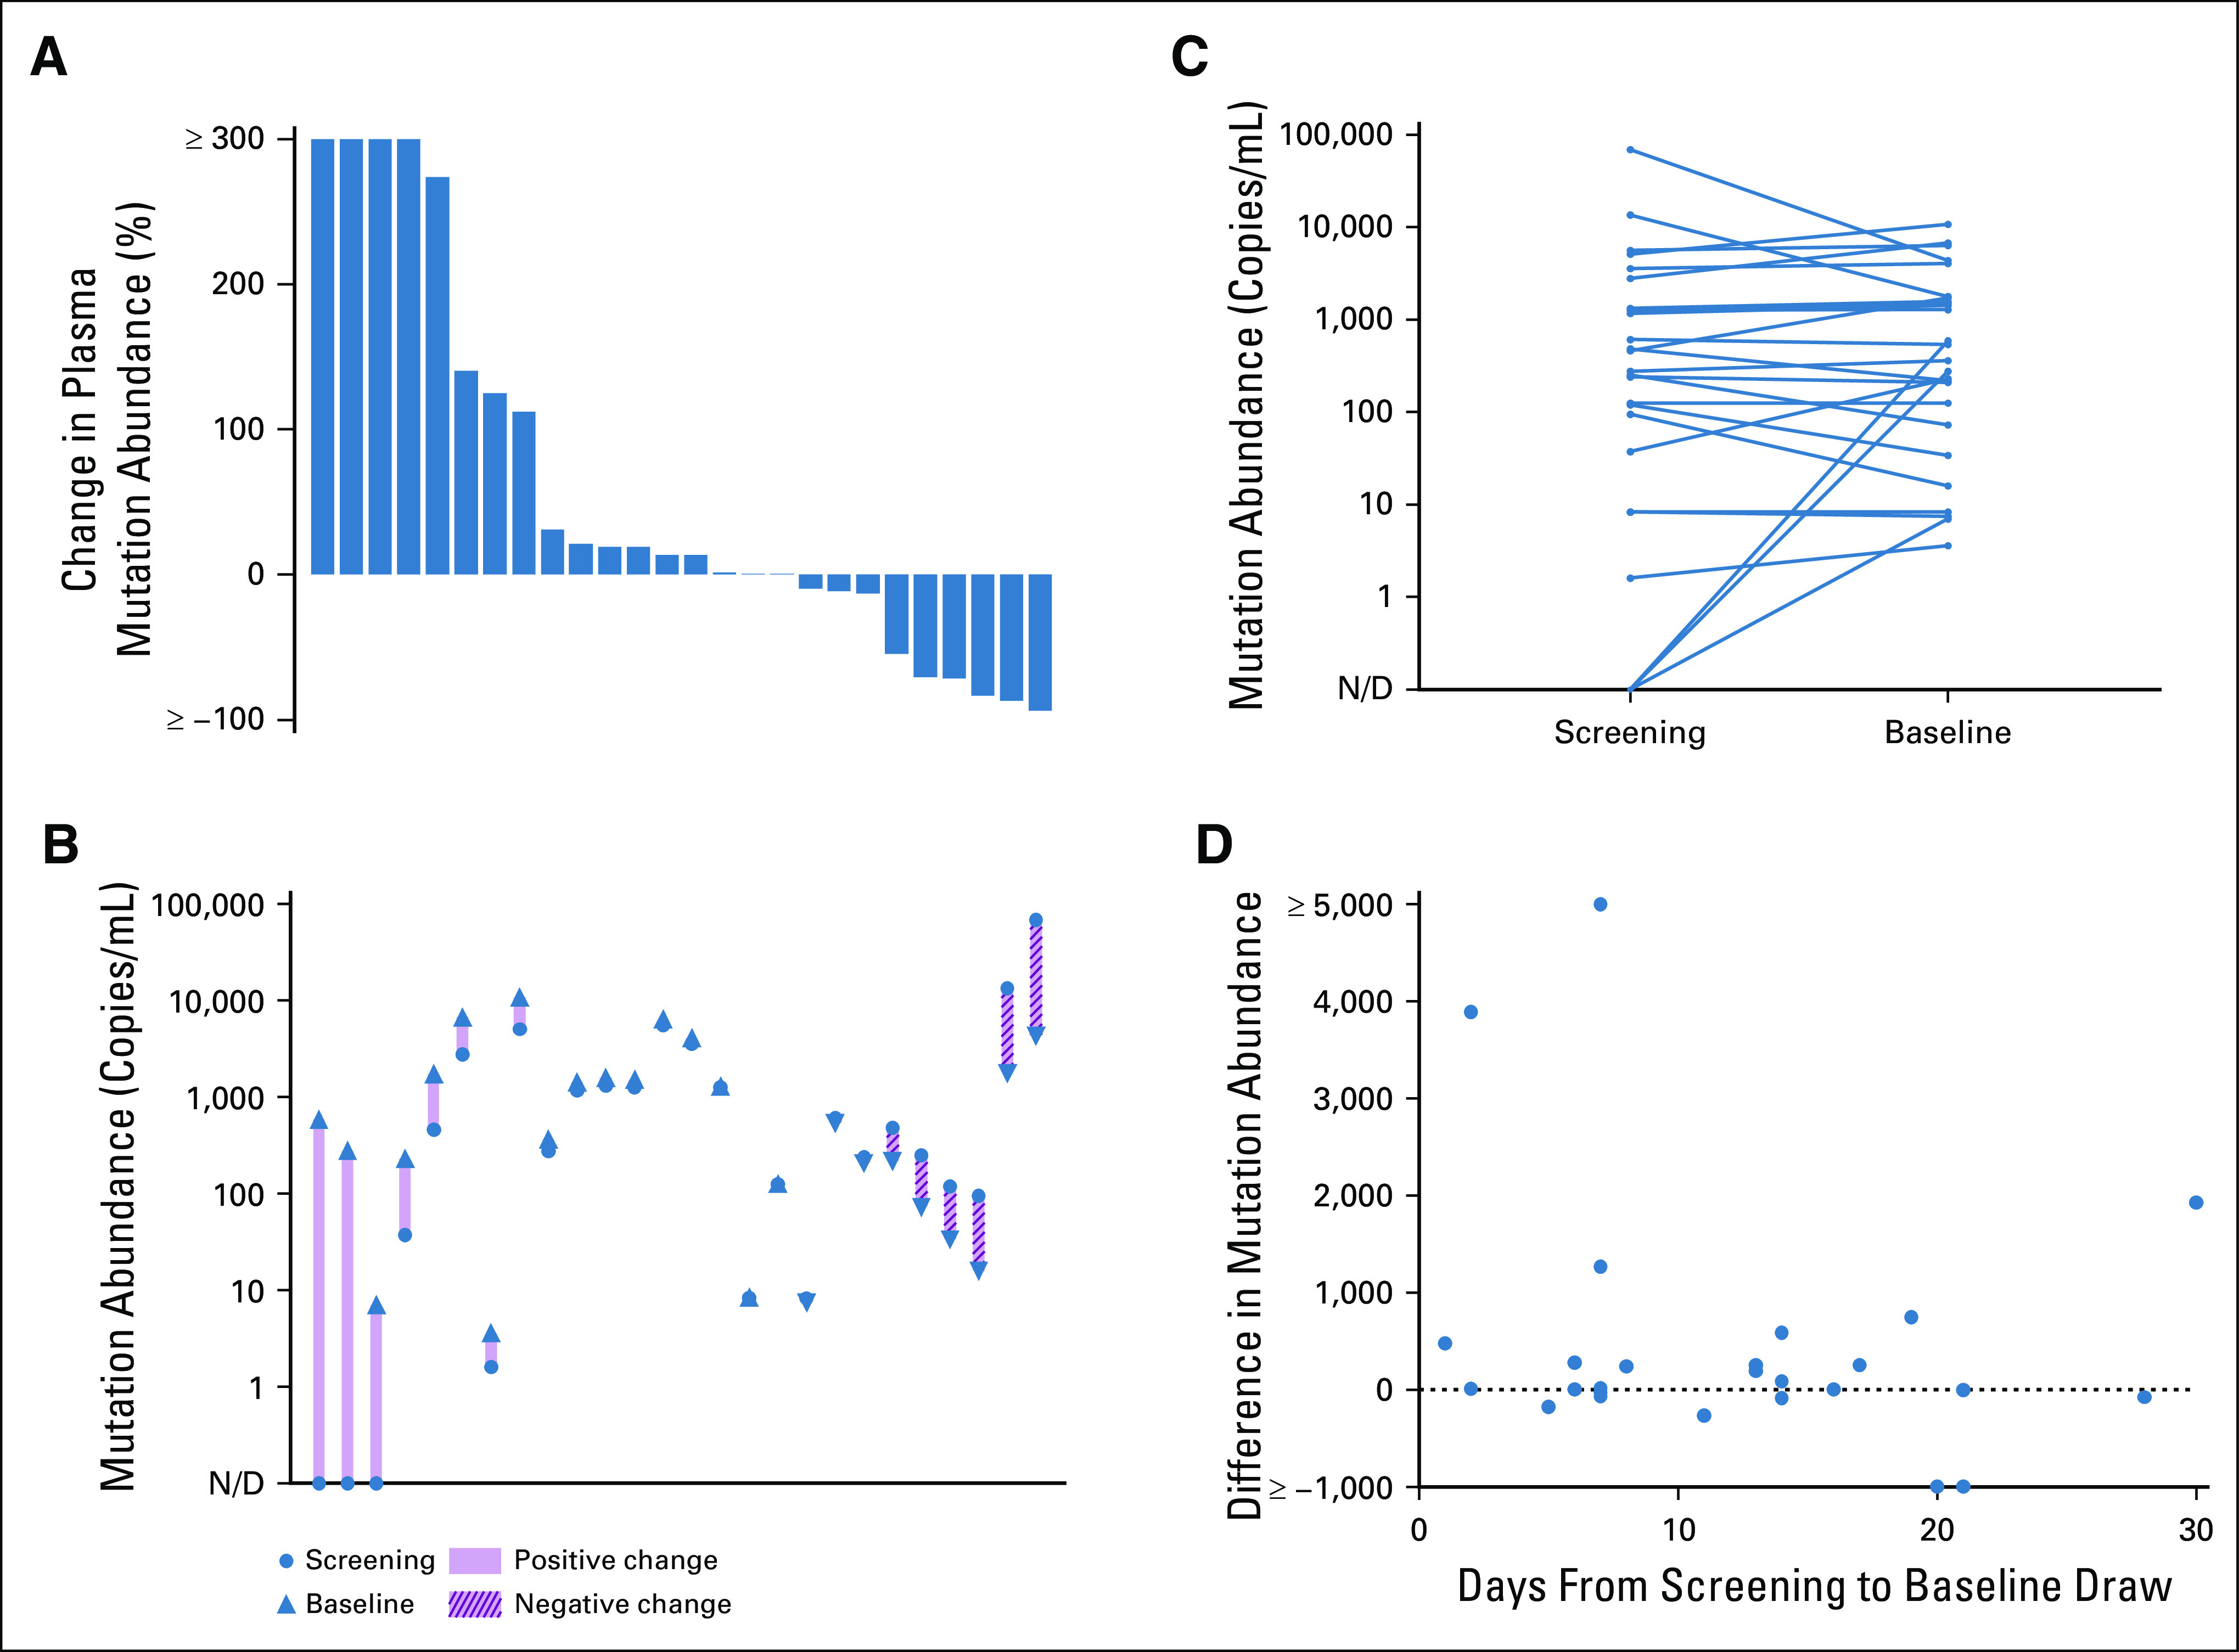
Pre-treatment variability of baseline driver mutation shed detected in plasma ctDNA. (A) Waterfall plot depicting percent change in plasma mutation abundance of key driver mutations between subsequent pre-treatment draws within a 30-day window among 26 patients enrolled to institutional clinical and imaging cohorts and (B and C) corresponding mutation abundance levels. (D) Baseline variability across duration of time between paired pre-treatment draws. ctDNA, circulating tumor DNA; N/D, not defined.
DISCUSSION
Using serial analysis of key KRAS, EGFR, and BRAF driver mutations, we find that plasma ctDNA response among patients with advanced NSCLC receiving systemic therapy is an early phenomenon and that the vast majority can be seen within the first cycle of therapy. Decreases in mutation abundance were observed as early as 7 days following treatment initiation and the median time to nadir among patients who achieved complete clearance was 23.5 days (IQR, 21.0-31.3). Our findings suggest that plasma ctDNA changes in response to treatment initiation often occur well before the earliest standard imaging timepoints, and that early ctDNA analysis has the potential to fill this gap as an early marker of drug effect. Furthermore, we identify the potential for marked variation, primarily increases, in mutation concentration in the period before treatment start.
Our findings have practical implications toward the development of both clinical protocols to study plasma response as part of trial analysis and plasma response assessment as part of clinical care. First, baseline plasma samples should be ideally drawn on the treatment start date (C1D1) rather than during the screening or pre-treatment period. Second, a plasma response specimen should be collected early on therapy after a few weeks, such as at a toxicity assessment or with cycle 2 of therapy, rather than waiting until a standard imaging timepoint (eg, at 6 or 8 weeks). By contrast, ongoing collection of plasma with later cycles of therapy may not meaningfully inform initial response assessment since little additional plasma response was seen beyond cycle 2 in our study, although samples could be otherwise useful to monitor for emergence of resistance.
However, there remain some practical questions that are not yet answered by available data. For example, what is the best unit of measurement for assessing response in plasma ctDNA? In this paper, we studied the absolute concentration of each driver mutation (copies/mL), whereas others have reported results using the relative concentration of driver mutations as a proportion of wild-type DNA (ie, allelic fraction [AF]). Although the latter is more commonly reported in the literature because it can accommodate calculations across various assay platforms, AFs as a metric of shed could be more vulnerable to unaccounted fluctuations in wild-type DNA levels because of factors such as WBC lysis. In addition to this, what is the minimum detectable level of ctDNA content in the baseline draw needed to meaningfully assess a plasma response and predict a clinical response? Although significant technological and computational efforts have been made to enhance the sensitivity of ctDNA analysis, accurate assessments of plasma response and its clinical implications are likely to become more challenging approaching the lower limit of detection.
Through establishing best practices for ctDNA-based response assessment in our patients with a known driver mutation, we ultimately envision it could become an important tool to guide treatment decision making in clinical cancer care for patients with advanced NSCLC more broadly, enabling medical oncologists to dynamically match patients to the optimal therapeutic approach. To test this, our group is leading an ongoing prospective clinical trial in first-line advanced NSCLC where plasma response informs intensification of pembrolizumab monotherapy to pembrolizumab plus doublet chemotherapy (ClinicalTrials.gov identifier:NCT04166487). If found to be feasible, such response-adapted strategies could be intuitive in other cancer types as well. Furthermore, we envision that plasma response could eventually be used to support clinical trial analysis. For example, plasma response could augment assessment of efficacy in clinical trial analyses, especially in patients without measurable disease or who stop early because of toxicity. Such trial analyses would need to account for the limitations of each assay platform particularly in light of the fact that not all patients have detectable shed from plasma, although one could envision future trials selecting for measurable disease in ctDNA rather than on imaging.
To better understand the utility of plasma response analysis, more trial-level analyses are needed across multiple diseases and therapies. Our analysis is inherently limited in its focus on cohorts of advanced NSCLC with detectable genotypes and an enrichment for EGFR-mutant lung cancer treated with targeted therapy, as well as limited correlation to clinical outcomes. Only through analysis across treatment types will broadly applicable criteria be clarified. The Friends of Cancer Research has launched a collaborative effort across multiple pharma sponsors called ctMoniTR aiming to first study lung cancer and then broaden to other cancer types.21 Building off the principles we establish here, we hope that such a precompetitive effort can finally establish the evidence base needed to use plasma ctDNA response in drug development and patient care.
APPENDIX
FIG A1.
Baseline driver mutation abundance detectable in plasma ctDNA. (A) Dotplot of baseline pre-treatment shed of key driver mutations EGFR del19 or L858R, KRAS G12X, or BRAF V600E across all cohorts evaluated in this study. (B) Corresponding frequency table of driver genotype as determined through ddPCR analysis of plasma ctDNA. ctDNA, circulating tumor DNA; ddPCR, droplet digital polymerase chain reaction, N/D, not defined.
FIG A2.
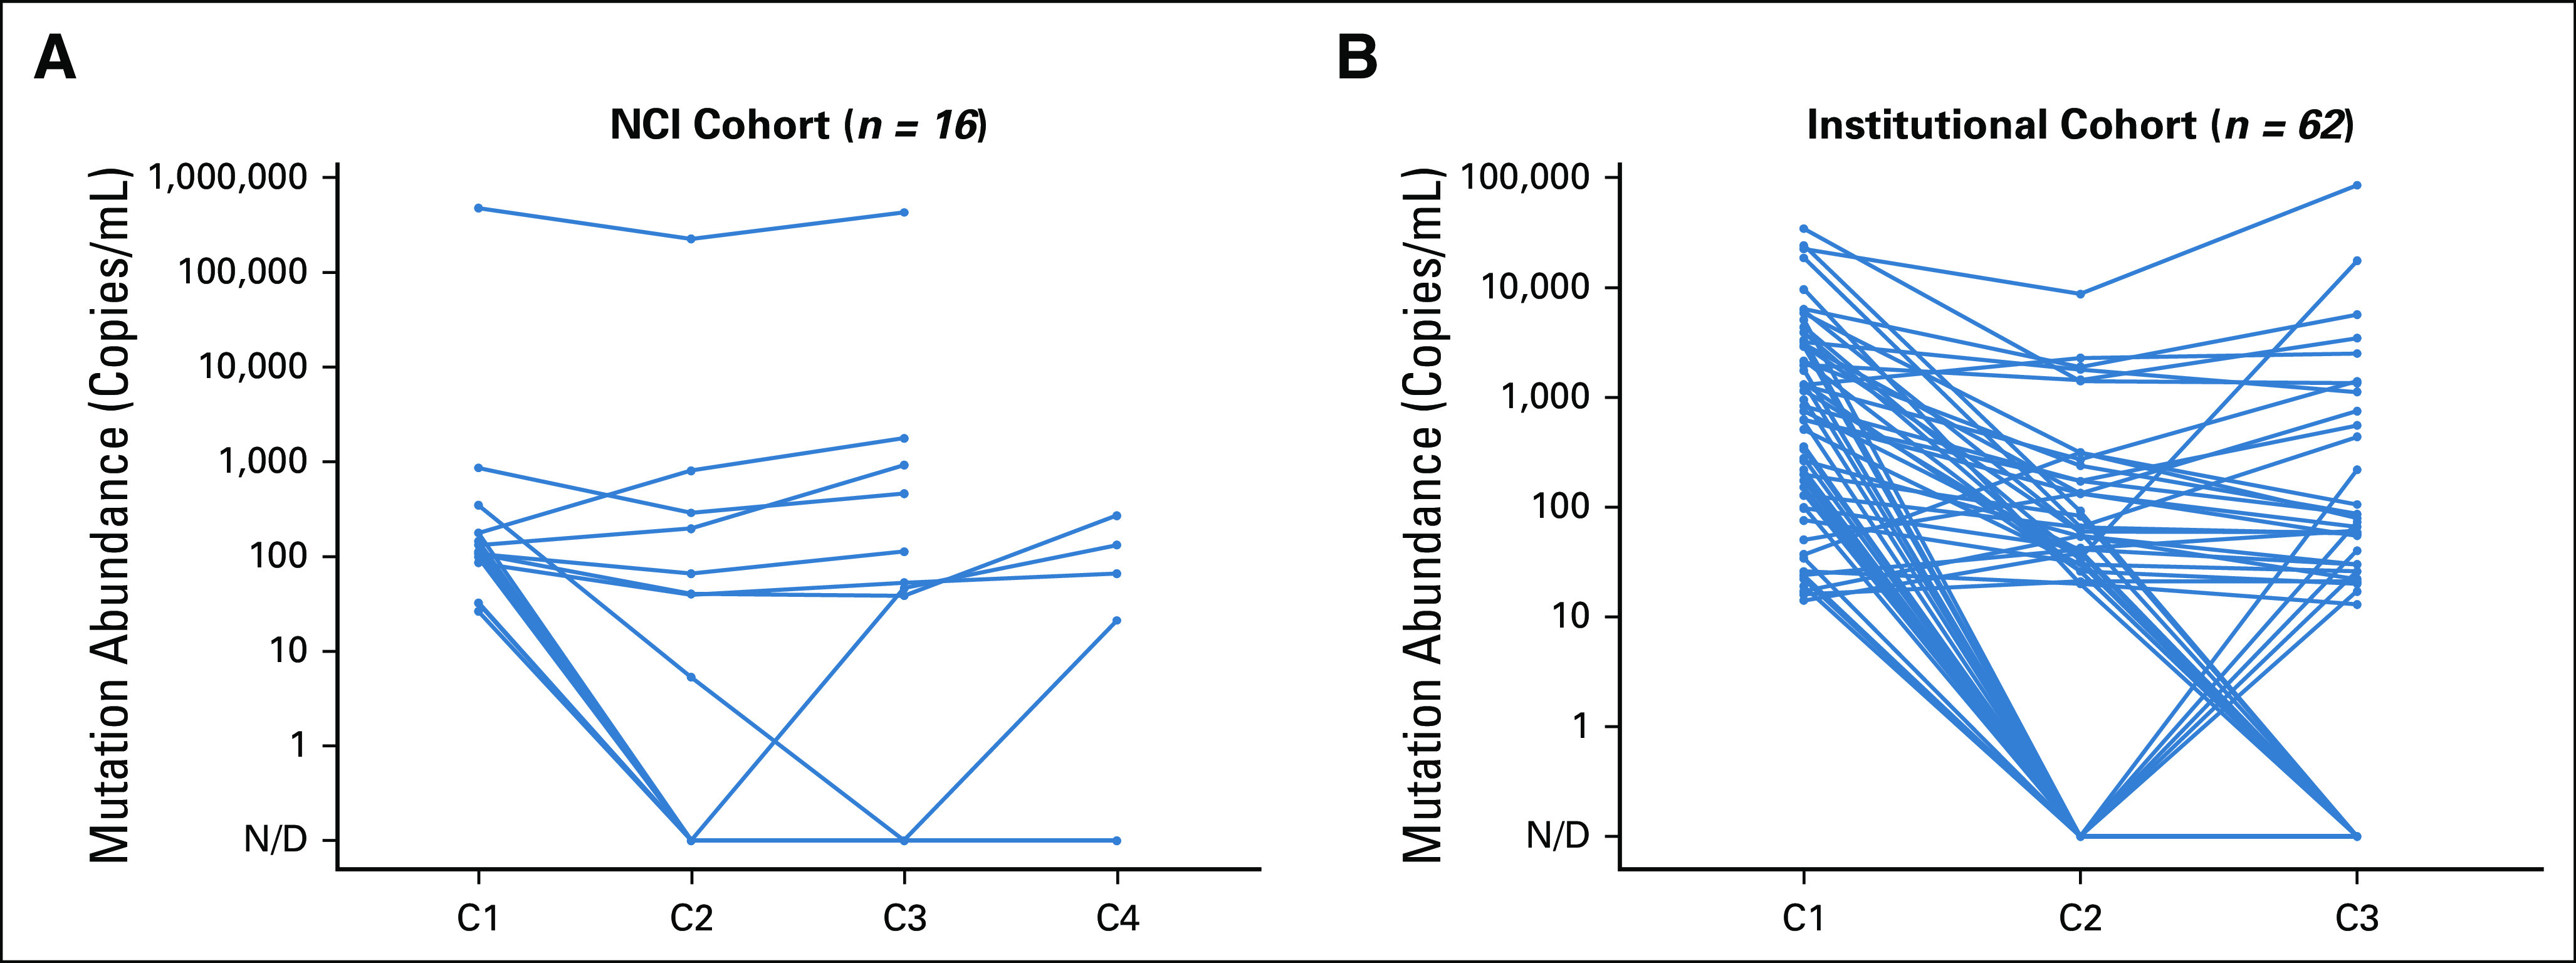
Response kinetics of driver mutation ctDNA abundance. Patient-level plasma levels (copies/mL) of EGFR del19 or L858R, KRAS G12X, or BRAF V600E following treatment initiation for the NCI (A) and institutional (B) cohorts. ctDNA, circulating tumor DNA, N/D, not defined.
Footnotes
M.L.C. and C.J.L. contributed equally to this work. G.R.O. and C.P.P. are cosenior authors.
AUTHOR CONTRIBUTIONS
Conception and design: Michael L. Cheng, Christie J. Lau, Geoffrey R. Oxnard, Cloud P. Paweletz
Financial support: Cloud P. Paweletz
Provision of study materials or patients: Jonathan W. Riess, Penelope A. Bradbury, Pasi A. Jänne, Geoffrey R. Oxnard
Collection and assembly of data: Michael L. Cheng, Christie J. Lau, Marina Milan, Julianna G. Supplee, Jonathan W. Riess
Data analysis and interpretation: Michael L. Cheng, Christie J. Lau, Jonathan W. Riess, Penelope A. Bradbury, Pasi A. Jänne, Geoffrey R. Oxnard, Cloud P. Paweletz
Manuscript writing: All authors
Final approval of manuscript: All authors
Accountable for all aspects of the work: All authors
AUTHORS' DISCLOSURES OF POTENTIAL CONFLICTS OF INTEREST
The following represents disclosure information provided by authors of this manuscript. All relationships are considered compensated unless otherwise noted. Relationships are self-held unless noted. I = Immediate Family Member, Inst = My Institution. Relationships may not relate to the subject matter of this manuscript. For more information about ASCO's conflict of interest policy, please refer to www.asco.org/rwc or ascopubs.org/po/author-center.
Open Payments is a public database containing information reported by companies about payments made to US-licensed physicians (Open Payments).
Michael L. Cheng
Honoraria: The Lynx Group, WebMD, Potomac Center for Medical Education
Consulting or Advisory Role: AstraZeneca, Inivata, Boehringer Ingelheim
Research Funding: Palleon Pharmaceuticals
Travel, Accommodations, Expenses: Daiichi Sankyo, AstraZeneca, Genzyme
Jonathan W. Riess
Consulting or Advisory Role: Medtronic, Boehringer Ingelheim, Novartis, Blueprint Medicines, Genentech, EcoR1 Capital, Teladoc
Research Funding: Merck, AstraZeneca/MedImmune, Spectrum Pharmaceuticals, Boehringer Ingelheim, Novartis, Revolution Medicines
Penelope A. Bradbury
Honoraria: Lilly, Abbvie, Merck
Consulting or Advisory Role: Abbvie, Boehringer Ingelheim
Pasi A. Jänne
Stock and Other Ownership Interests: Gatekeeper Pharmaceuticals, Loxo Oncology
Consulting or Advisory Role: Pfizer, Boehringer Ingelheim, AstraZeneca, Merrimack, Chugai Pharma, Roche/Genentech, LOXO, Mirati Therapeutics, Araxes Pharma, Ignyta, Lilly, Takeda, Novartis, Biocartis, Voronoi, SFJ Pharmaceuticals Group, Sanofi, Biocartis, Daiichi Sankyo, Silicon Therapeutics
Research Funding: AstraZeneca, Astellas Pharma, Daiichi Sankyo, Lilly, Boehringer Ingelheim, Puma Biotechnology, Takeda, Revolution Medicines
Patents, Royalties, Other Intellectual Property: I am a coinventor on a DFCI-owned patent on EGFR mutations licensed to Lab Corp. I receive post-marketing royalties from this invention
Geoffrey R. Oxnard
Employment: Foundation Medicine
Stock and Other Ownership: Roche
Honoraria: Guardant Health, Foundation Medicine
Consulting or Advisory Role: AstraZeneca, Inivata, Takeda, LOXO, DropWorks, GRAIL, Janssen, Sysmex, Illumina, Abbvie, Merck
Patents, Royalties, Other Intellectual Property: DFCI has a patent pending titled “Non-invasive blood-based monitoring of genomic alterations in cancer,” on which I am a co-inventor
Cloud P. Paweletz
Stock and Other Ownership: XSphera Biosciences
Honoraria: Bio-Rad
Consulting or Advisory Role: DropWorks, XSphera Biosciences
Research Funding: Daiichi Sankyo, Bicycle Therapeutics, Transcenta, Bicara Therapeutics, AstraZeneca, Intellia Therapeutics, Janssen Pharmaceuticals, Array Biopharma
Patents, Royalties, Other Intellectual Property: DFCI has a patent pending titled “Non-invasive blood-based monitoring of genomic alterations in cancer” on which I am a co-inventor
No other potential conflicts of interest were reported.
ACKNOWLEDGMENT
Geoffrey R. Oxnard, MD, is the Damon Runyon-Gordon Family Clinical Investigator supported by the Damon Runyon Cancer Research Foundation (CI-86-16). Additional funding in part from the NIH/NCI (UM1 CA186709, UM1 CA186717, R01 CA240592, and K12 CA138464 [J.W.R.]), the Department of Defense, the Addario and Van Auken Foundation Young Innovators Team Award (JWR), the Pamela Elizabeth Cooper Research Fund, the Expect Miracles Foundation, and the Robert and René Belfer Foundation.
REFERENCES
- 1.Sacher AG, Paweletz C, Dahlberg SE, et al. : Prospective validation of rapid plasma genotyping for the detection of EGFR and KRAS mutations in advanced lung cancer. JAMA Oncol 2:1014-1022, 2016 [DOI] [PMC free article] [PubMed] [Google Scholar]
- 2.Leighl NB, Page RD, Raymond VM, et al. : Clinical utility of comprehensive cell-free DNA analysis to identify genomic biomarkers in patients with newly diagnosed metastatic non–small cell lung cancer. Clin Cancer Res 25:4691-4700, 2019 [DOI] [PubMed] [Google Scholar]
- 3.Oxnard GR, Hu Y, Mileham KF, et al. : Assessment of resistance mechanisms and clinical implications in patients with EGFR T790M–positive lung cancer and acquired resistance to osimertinib. JAMA Oncol 4:1527-1534, 2018 [DOI] [PMC free article] [PubMed] [Google Scholar]
- 4.Aggarwal C, Thompson JC, Black TA, et al. : Clinical implications of plasma-based genotyping with the delivery of personalized therapy in metastatic non–small cell lung cancer. JAMA Oncol 5:173-180, 2019 [DOI] [PMC free article] [PubMed] [Google Scholar]
- 5.Abbosh C, Birkbak NJ, Swanton C: Early stage NSCLC—challenges to implementing ctDNA-based screening and MRD detection. Nat Rev Clin Oncol 15:577-586, 2018 [DOI] [PubMed] [Google Scholar]
- 6.Liu MC, Oxnard GR, Klein EA, et al. : Sensitive and specific multi-cancer detection and localization using methylation signatures in cell-free DNA. Ann Oncol 31:1266-1267, 2017 [DOI] [PMC free article] [PubMed] [Google Scholar]
- 7.Lennon AM, Buchanan AH, Kinde I, et al. : Feasibility of blood testing combined with PET-CT to screen for cancer and guide intervention. Science 369:eabb9601, 2020 [DOI] [PMC free article] [PubMed] [Google Scholar]
- 8.Chaudhuri AA, Chabon JJ, Lovejoy AF, et al. : Early detection of molecular residual disease in localized lung cancer by circulating tumor DNA profiling. Cancer Discov 7:1394-1403, 2017 [DOI] [PMC free article] [PubMed] [Google Scholar]
- 9.Corcoran RB, Chabner BA: Application of cell-free DNA analysis to cancer treatment. N Engl J Med 379:1754-1765, 2018 [DOI] [PubMed] [Google Scholar]
- 10.Diehl F, Schmidt K, Choti MA, et al. : Circulating mutant DNA to assess tumor dynamics. Nat Med 14:985-990, 2008 [DOI] [PMC free article] [PubMed] [Google Scholar]
- 11.Kato K, Uchida J, Kukita Y, et al. : Transient appearance of circulating tumor DNA associated with de novo treatment. Sci Rep 6:38639, 2016 [DOI] [PMC free article] [PubMed] [Google Scholar]
- 12.Goldberg SB, Narayan A, Kole AJ, et al. : Early assessment of lung cancer immunotherapy response via circulating tumor DNA. Clin Cancer Res 24:1872-1880, 2018 [DOI] [PMC free article] [PubMed] [Google Scholar]
- 13.Oxnard GR, Drilon AE, Shah MH, et al. : Detection and clearance of RET variants in plasma cell free DNA (cfDNA) from patients (pts) treated with LOXO-292. J Clin Oncol 36, 2018. (suppl; abstr 9048) [Google Scholar]
- 14.Oxnard GR, Paweletz CP, Kuang Y, et al. : Noninvasive detection of response and resistance in EGFR-mutant lung cancer using quantitative next-generation genotyping of cell-free plasma DNA. Clin Cancer Res 20:1698-1705, 2014 [DOI] [PMC free article] [PubMed] [Google Scholar]
- 15.Raja R, Kuziora M, Brohawn PZ, et al. : Early reduction in ctDNA predicts survival in patients with lung and bladder cancer treated with durvalumab. Clin Cancer Res 24:6212-6222, 2018 [DOI] [PubMed] [Google Scholar]
- 16.Zhou C, Imamura F, Cheng Y, et al. : Early clearance of plasma EGFR mutations as a predictor of response to osimertinib and comparator EGFR-TKIs in the FLAURA trial. J Clin Oncol 37, 2019. (suppl; abstr 9020) [Google Scholar]
- 17.Thress KS, Markovets A, Barrett JC, et al. : Complete clearance of plasma EGFR mutations as a predictor of outcome on osimertinib in the AURA trial. J Clin Oncol 35, 2017. (suppl; abstr 9018) [Google Scholar]
- 18.Zhang Q, Luo J, Wu S, et al. : Prognostic and predictive impact of circulating tumor DNA in patients with advanced cancers treated with immune checkpoint blockade. Cancer Discov 10:1842-1853, 2020 [DOI] [PMC free article] [PubMed] [Google Scholar]
- 19.Bratman SV, Yang SYC, Iafolla MAJ, et al. : Personalized circulating tumor DNA analysis as a predictive biomarker in solid tumor patients treated with pembrolizumab. Nature Cancer 1:873-881, 2020 [DOI] [PubMed] [Google Scholar]
- 20.Oxnard GR, Thress KS, Alden RS, et al. : Association between plasma genotyping and outcomes of treatment with osimertinib (AZD9291) in advanced non–small-cell lung cancer. J Clin Oncol 34:3375-3382, 2016 [DOI] [PMC free article] [PubMed] [Google Scholar]
- 21.Friends of Cancer Research : ctMoniTR. https://www.focr.org/news/friends-cancer-research-launches-ctmonitr [Google Scholar]


