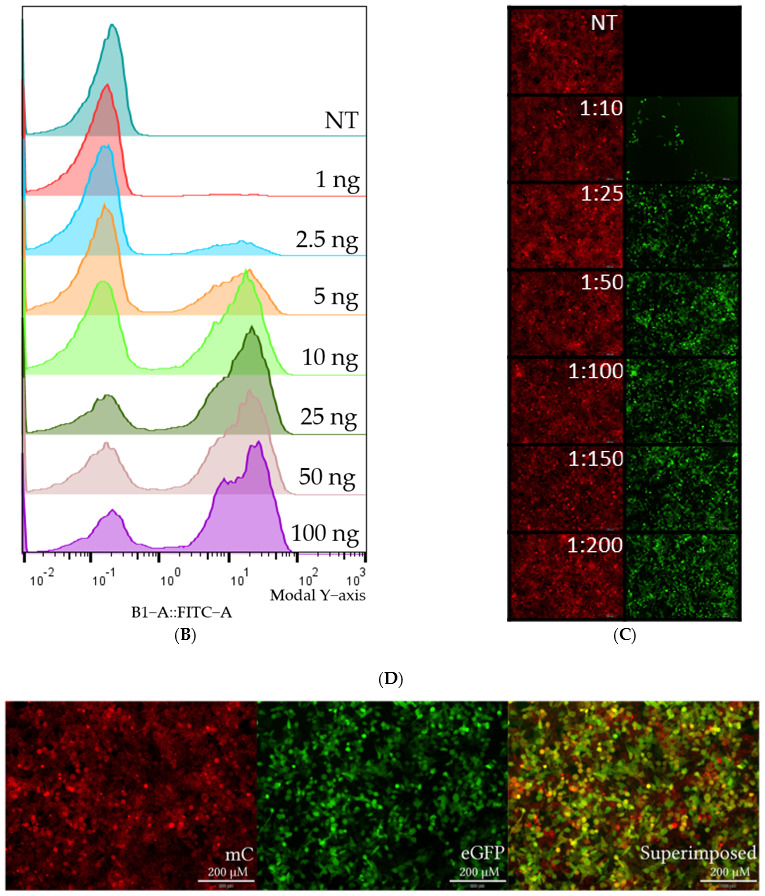
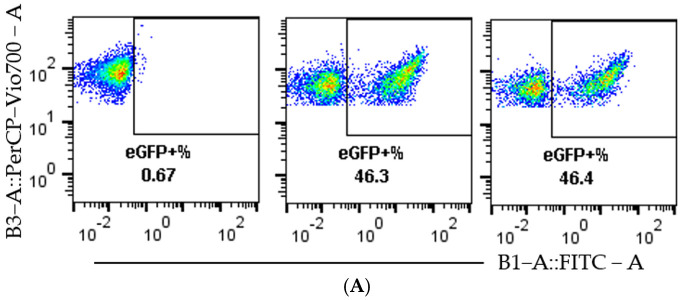
Figure 3.

Visualization of representative flow cytometry data and microscopy. HEK293T SL cells were used for Figure 3A–D. (A) Dot plots of mC (y-axis) plotted against eGFP (x-axis). In the order left to right, non-treated, 10 ng Cas9 RNP-PF14 (MR 1:100, RNP: PF14), and RNAiMAX 10 ng Cas9 RNP. (B) Histogram visualizing the eGFP signal in RNP-PF14 treated cells, added text displays Cas9 (ng)/well. (C,D) Fluorescence microscopy (10×) displaying the mC and eGFP of cells treated with Cas9 RNP-PF14, 50 ng/well in an increasing MR ratio (C) or 100 ng Cas9/well (MR 1:100) (D).

