Abstract
The second and third waves of coronavirus disease-2019 (COVID-19) pandemic have hit the world. Even after more than a year, the economy is yet to return to a semblance of normality. The conference/meeting room is one of the critical sections of offices that might be difficult not to use. This study analyzes the distribution of the virus-laden droplets expelled by coughing inside a conference room, the effect of ventilation rates, and their positioning. The efficacy of masks is studied to get quantitative information regarding the residence time of the droplets. The effects of evaporation, turbulent dispersion, and external forces have been considered for calculating the droplets' trajectories. We have analyzed six cases, of which two are with masks. Change in the ventilation rate from four air changes per hour (ACH) to eight resulted in a increment in the number of droplets entrained in the outlet vent, while their average residence time was reduced by . The shift in the vents' location has significantly altered droplets' distribution inside a conference room. It results in of the injected droplets reaching persons sitting across the table, and a similar indoor environment is not recommended. Wearing a mask in the case of eight ACH has presented the best scenario out of the six cases, with a improvement in the number of droplets entrained in the outlet vent and a decrease in their average residence time compared to the case without a mask. No droplets have reached persons sitting across the table when the infected person is wearing the mask, which follows that a social distancing of with a mask is adequate in indoor environments.
INTRODUCTION
Many countries' economic growth is severely affected by the lockdown and closure of techno-economical activities for a significant period due to the coronavirus disease-2019 (COVID-19) pandemic. During the lockdown, most offices were closed, and enterprises issued work from home guidelines to their employees. After confirming vaccines' efficacy from clinical trials, the vaccination drive is on surge in many countries.1 This has imparted a positive hope; however, the concern is not entirely eliminated. The face mask is a prominent and widely accepted preventive measure. Masks and social distancing may remain integral parts of day-to-day activities in the near future as well. The COVID-19 pandemic had posed a considerable challenge to humanity to restore economic losses. Business operations are now resuming in many countries, and employers follow strict guidelines to prevent their employees from being exposed to COVID-19 at work. Various recommendations such as face covering, adequate social distancing, sanitization, improved ventilation, and flow barriers have been made.2
We believe that the risk of transmission of the virus through the deposition of viral-laden droplets expelled during coughing, sneezing, talking, and laughing deposited on the surface may be taken care of to a great extent by regular workplace sanitization and frequent hand washing. However, the virus's airborne transmission during inhalation is still a major concern in closed environments like workplaces and offices.
The airborne mode of virus transmission is now well acknowledged, and several preventive measures are planned considering this aspect.3–5 Various studies have been conducted on the transmission in the outdoor environment,6–9 but the droplets' distribution in an indoor environment differs significantly due to the appearance of different flow patterns. The droplet spreading in an indoor environment like a classroom, elevators, restaurants, airplane, music room is recently being addressed, and potential mitigations are proposed.3,10–14 However, in the case of an indoor environment, the spread and distribution of droplets are dependent on the surfaces/obstructions present, the ventilation rates, the location of the ventilation. Therefore, to get a gist of a specific environment, different studies are required. Some of the above studies10,14,15 did not include the effect of evaporation at the surface of the droplets. They simulated the droplets in the dry nuclei state, introducing some changes in the trajectory calculations in the droplets' transmission. A few studies adopted uniform droplet diameter in their study.10,15 The effect of ventilation rate has been studied in the literature, but the effect of the ventilation's location is seldom reported in the existing literature. The quantification regarding the residence time of the droplets injected by an infected person in a similar indoor environment is yet to be fully explored, which we have analyzed in this study.
Dbouk and Drikakis3 have analyzed the airborne virus transmission due to mild coughing in an elevator with different ventilation configurations. Their results signify the importance of the placement of inlets and outlets on droplet trajectories. Abuhegazy et al.10 have studied aerosol transmission inside the classroom, and their results indicate that opening windows in a Heating, Ventilation, and Air-Conditioning (HVAC) enabled classroom results in reduced transmission between students. Liu et al.12 have investigated indoor airflow inside a restaurant to find out the likelihood of airborne infection. Their results show that if the aerosols are returned via air conditioning, they can contribute as high as of the total infection risk. Wu et al.13 have numerically analyzed the transmission of virus-laden droplets due to sneezing inside a cafeteria, highlighting the requirement of proper air distribution strategies for indoor activities. Talat et al.14 simulated aerosol transmission on an airplane, analyzing different flow circulation patterns. Narayanan and Yang15 have studied the transmission inside a music classroom for different activities with various aerosol injection rates. Also, they have investigated the effect of a portable air purifier and concluded that locating a purifier nearer to the injector could offer positive benefits. Bhagat et al.16 have studied the effect of ventilation on the indoor spread of COVID-19. They have mentioned that the proper design of a displacement ventilation system would offer the most benefits to reduce the risk of exposure to the virus. Pantelic and Tham17 have signified the importance of local airflow patterns while studying the airborne transmission inside a room. They have indicated that an increase in supply flow rate or air changes per hour (ACH) can reduce exposure to the airborne virus under certain circumstances, hence the importance of local airflow patterns. Pendar and Pascoa18 have studied the distribution of virus-carrying saliva during sneeze and cough. Their results indicate that 2-m social distancing may not be sufficient in the case of sneezing and depend upon local environmental conditions.
Meeting and small conferences may be difficult to be avoided in business enterprises, educational institutes, and industries under some circumstances. However, the attendees are advised to follow the preventive guidelines like covering the face with a mask and recommended social distancing of 6 ft.19 A review article by Ai and Melikov20 suggests that the risk of infection is higher within . We numerically investigate the droplet spreading and transport in a closed conference/meeting room with ventilation and air conditioning in this work. The ventilation rate and positions of the ventilation vents concerning the droplets' location are analyzed. The effect of ventilation rate with a mask is studied, and the results are compared with the cases without a mask for the same indoor conditions. Arumuru et al.21,22 have experimentally investigated the efficacy of facemasks in the case of sneezing and breathing. Their results indicate that wearing a mask reduces the transmission of the airborne virus. Burnett and Sergi23 have provided a general overview of the mask's utility after pointing out to lack of studies on the precise effect of the face masks. Therefore, a study with a mask is essential to ascertain the social distancing guidelines of adequateness in an indoor environment with varying ventilation conditions and to assess the likelihood of the transmission of the virus.
METHODS
Conference room: Geometry and mesh
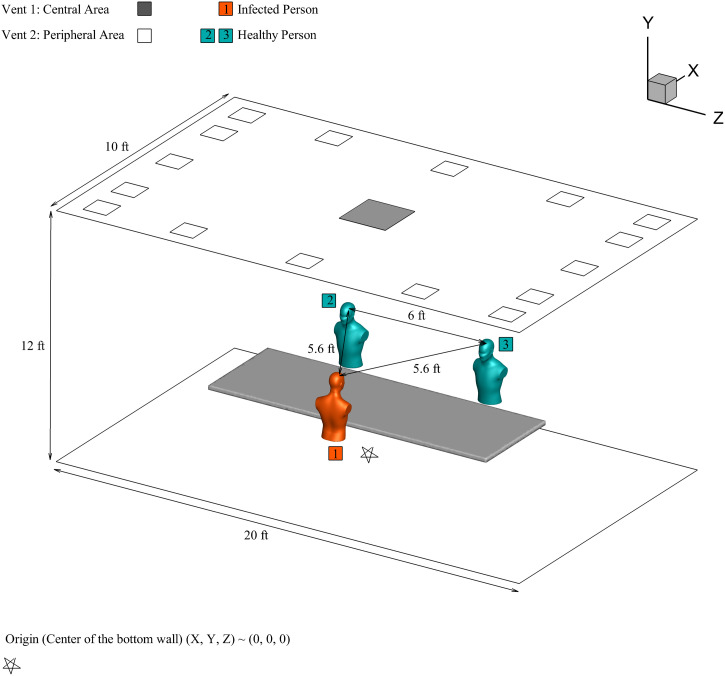
A three-dimensional model of a small conference room with dimensions is generated, which has a maximum capacity of persons. Similar-sized rooms are frequently used in the industry for conducting meetings and conferences. In this study, three persons are considered sitting on either side of the table, as shown in Fig. 1. The distances between persons are shown in Fig. 1, based on recommended distancing to reduce the exposure to the virus. Person 1 is assumed to be an infected person, and the other two are healthy. The mouth opening is used as a sole source of cough injection and has an area of .24 Vent is at the center, and vent is the ventilation area on the conference room's periphery. The conference room is air-conditioned with an external ventilation system as per ASHRAE 62.1 standards for indoor quality,25 with ACH recommended are between four and eight. Sixteen rectangular vents of equal areas are located on the outer periphery of the roof, with a total area of . In the center of the conference room roof, vent with an area of is provided to complete the air exchange. For ACH of four, the air is entering inside the room with a volumetric flow rate of .
FIG. 1.
Conference room model.
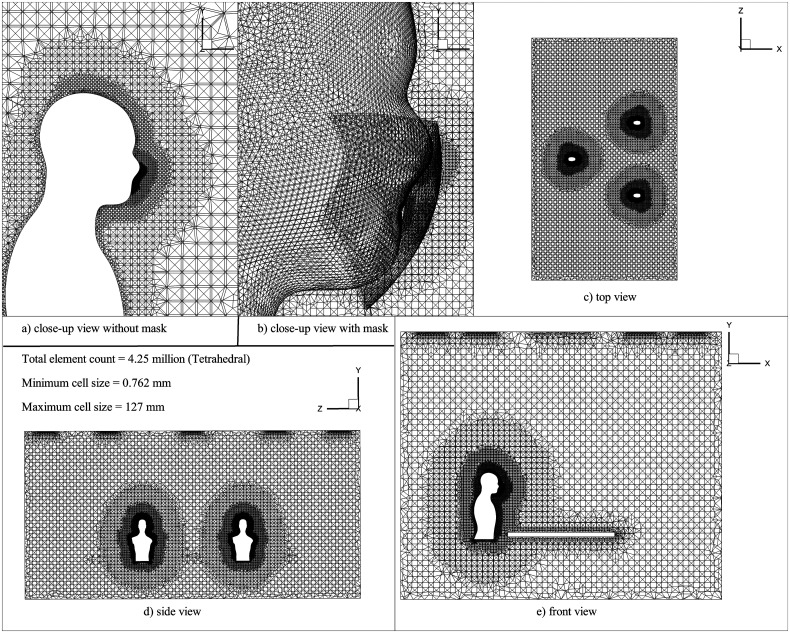
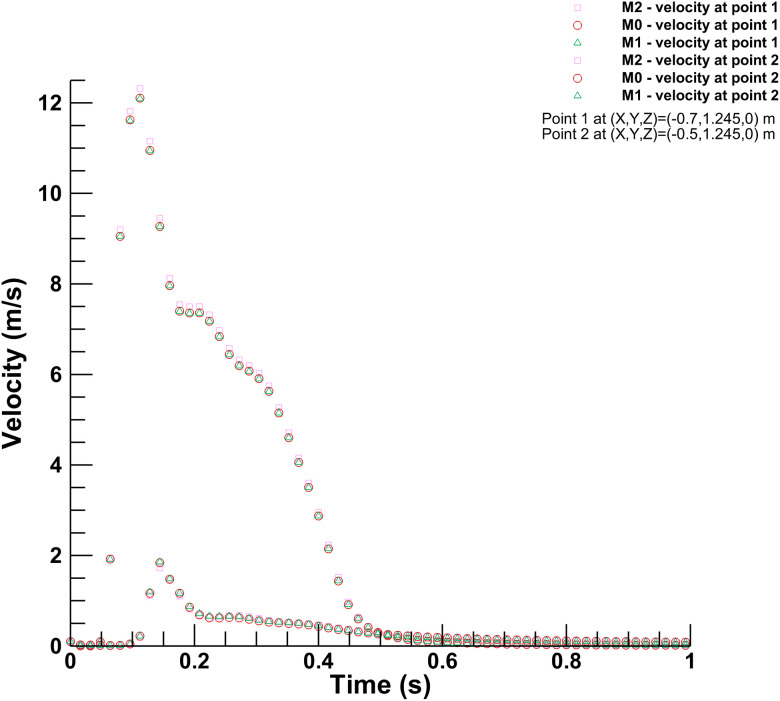
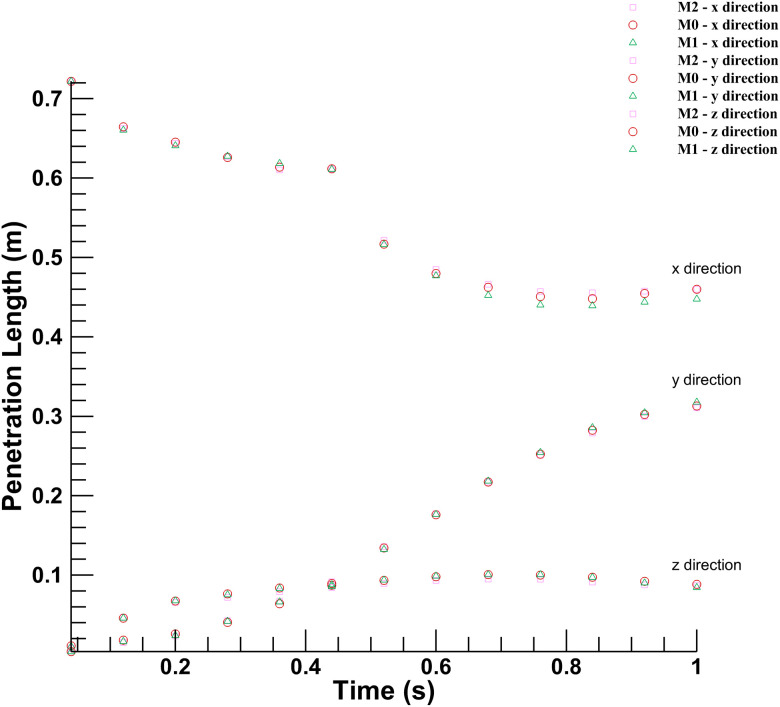
An unstructured mesh consisting of tetrahedral elements is generated using ANSYS ICEM CFD (Fig. 2). The mesh independence study was carried out to select suitable mesh to adhere to the desired accuracy with minimal computational resources (refer to Table I). The velocity of the continuous phase and penetration length of droplets in x-, y-, and z-directions are calculated for three different mesh sizes for the simulation time of . For this study, the penetration length is defined as the average position of the mass present in the conference room.6
FIG. 2.
Mesh domain is containing , and zoomed view near to the face of a person (a) without the mask, and (b) with the mask.
TABLE I.
Mesh sizes used in mesh independence study.
| Mesh size | Number of elements |
|---|---|
| M0 (medium) | |
| M1 (coarse) | |
| M2 (fine) |
Figure 3 shows the variation between the continuous phase's velocity magnitudes inside the conference room at two different points for three mesh sizes. The discrete phase's movement holds significant importance in this study; Fig. 4 shows the results for the penetration length in x-, y-, and z-directions in the conference room. The coordinates of the origin for calculating the penetration length are (0, 1.245, 0), which has the same height as of mouth but at the center of the room. The penetration length in the x-direction is decreasing as the droplets are approaching toward the origin from the mouth of the infected person. As shown in Figs. 3 and 4, there is no significant deviation in the results for the selected mesh sizes. Hence, considering the computational expenses and accuracy offered by three mesh sizes, the medium-sized mesh (M0) is used for further simulations.
FIG. 3.
Mesh independence for continuous phase: Velocity measured across three different mesh sizes.
FIG. 4.
Mesh independence for discrete phase: Droplet penetration length measured across three different mesh sizes.
Validation study of discrete phase model (DPM)
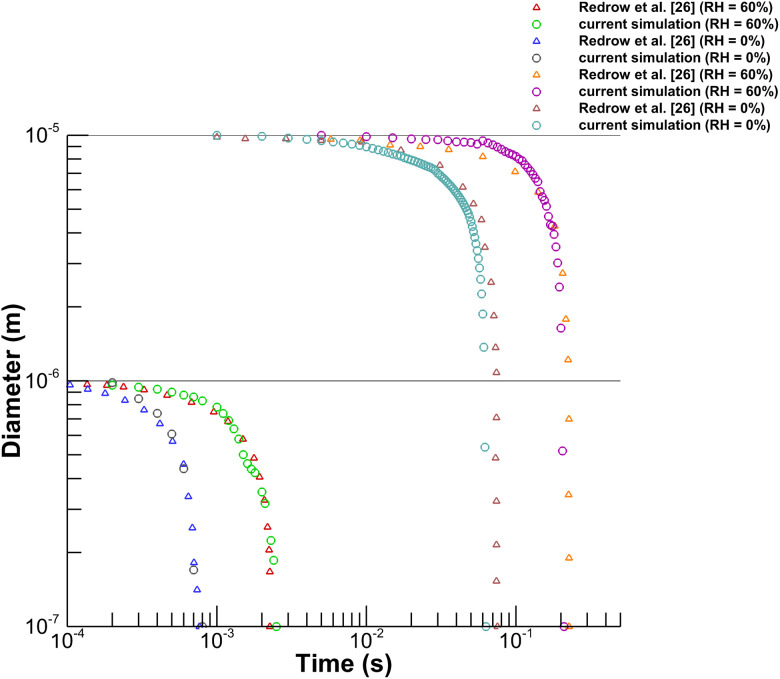
We have used the Euler–Lagrangian DPM to solve the transport of droplets generated from cough inside the conference room. Before using the DPM for our case, we have validated the model with the evaporation time results from existing literature. We compared our results with Redrow et al.26 to validate the droplet evaporation model. We have replicated their numerical setup, and evaporation time for a pure water droplet of diameter and was plotted against their results for two different humidity conditions of RH and RH as shown in Fig. 5. The nature of the curve and the magnitude of evaporation time are in good agreement with results from the literature.26
FIG. 5.
Validation of evaporation model with Redrow et al.26
Numerical modeling
This study uses the Euler–Lagrangian approach to solve the transport of continuous phase and discrete phase. In this case, the approach treats the mixture of air and water vapor as a continuous phase and the droplets generated from the cough as a discrete phase. The continuous phase equations are solved using the Eulerian approach, and the unsteady particle tracking model is used to calculate particle trajectories in the Lagrangian frame of reference.27 The study deals with a single cough generated from the infected person and its transport inside the conference room. The study utilized ANSYS Fluent 20R2 to simulate various scenarios presented in Table II.
TABLE II.
Simulation cases.
| Sr. No. | Mask | Air changes per hour (ACH) | Ventilation boundary condition |
|---|---|---|---|
| Case 1 | No | 4 | Vent 1: Outlet, Vent 2: Inlet |
| Case 2 | No | 8 | Vent 1: Outlet, Vent 2: Inlet |
| Case 3 | No | 4 | Vent 1: Inlet, Vent 2: Outlet |
| Case 4 | No | 8 | Vent 1: Inlet, Vent 2: Outlet |
| Case 5 | Yes | 4 | Vent 1: Outlet, Vent 2: Inlet |
| Case 6 | Yes | 8 | Vent 1: Outlet, Vent 2: Inlet |
First, a converged steady-state solution is attained without modeling discrete phase to establish the mean flow in the conference room with a relative humidity of . To establish desired relative humidity, water vapor with a mass fraction of was given as the initial condition. The properties of the continuous phase used are tabulated in Table III.
TABLE III.
Boundary conditions for continuous phase modeling.
Ventilation inlets are modeled as velocity inlet boundary conditions with a velocity of for Case 1, with a relative humidity of . The outlet that facilitates the air exit is modeled as a pressure outlet boundary condition with atmospheric pressure. A no-slip adiabatic wall boundary condition is applied to all the walls. The cough is generated from the infected person's mouth. We implemented cough airflow as a time-varying velocity boundary condition as per Gupta et al.24 Droplets are injected with a constant velocity of (Ref. 6) for a period of , the number of droplets injected are similar to the values mentioned by Xie et al.29 Droplets are injected horizontally using solid cone injection for generating cough.24,30 The boundary conditions for discrete phase modeling are tabulated in Table IV.
TABLE IV.
Droplet injection properties.
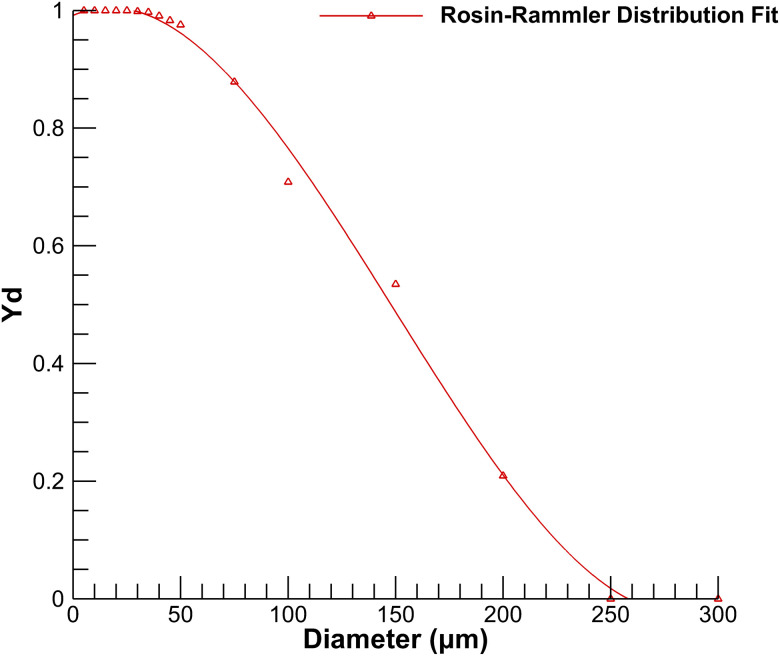
Droplet size distribution plays a vital role in the transport of discrete phase. Various droplet size distributions are reported in the literature.31–35 This study uses droplet size distribution generated from coughing given by Xie et al.29 The diameter sizes are fitted according to the Rosin–Rammler distribution shown in Fig. 6, which uses mass fractions of each droplet size. The current distribution ranges from a minimum diameter of to a maximum diameter of , with a mean diameter of . The Rosin–Rammler diameter distribution is defined by a term , which represents mass fraction of droplets of diameter greater than is given by
| (1) |
where is the mean droplet diameter and is the spread parameter for determining size distribution. For the curve's fitting, the spread parameter for the current droplet distribution size is calculated as per the ANSYS Fluent user guide.36 The value of the spread parameter in the current simulation is 3.
FIG. 6.
Rosin–Rammler diameter distribution for droplets size generated from a cough.29
As per Duguid's study,31 droplets evaporate continuously to their dry nuclei state as they move in the air. The size of the nuclei mentioned by Duguid31 is around of the original diameter. To achieve this, a volatile fraction of the water droplet is assigned as , the remaining being a nonvolatile part.37
Modeling continuous phase
The physics of the transport of droplets in the surrounding medium involves fluid flow, heat transfer, species transport, and turbulent dispersion. First, continuous phase equations are solved, then results generated from a solution of discrete phase iteration are added to the continuous phase as source terms to complete coupling between two phases. This procedure is repeated until the desired convergence is attained. The governing equations for fluid mass, momentum, energy, and species transport are given as
| (2) |
| (3) |
| (4) |
| (5) |
Chen38 evaluated various -based turbulence models and suggested the Renormalization Group (RNG) model for indoor airflow predictions. The RNG turbulence model has been successfully implemented in indoor environments by various authors.10,14,26,37,39,40 This study assumed that the domain's flow was fully turbulent and isotropic.37 Scalable wall functions, which use logarithmic law wall functions, were applied to model the relationship between walls and turbulent flow. Standard values of constants are used, documented in the ANSYS Fluent theory guide.27
Droplet transport
The droplets are transported through the mixture of air and water vapor, and their trajectories are affected by external forces, turbulent dispersion, and the nature of the surrounding flow. Particles are tracked by solving Newton's second law of motion, which equates inertia force on droplets with external forces acting on the droplets. In the present simulation, the effect of gravitation force, drag force, lift force, and inertia force is considered while coupling between the discrete and continuous phases. Dispersion of particles above is more influenced by gravitational force than Brownian motion; the effect of coagulation is minor for this range.41 Therefore, both of these effects are not considered in this study. Source terms generated from Lagrangian tracking of droplets are then added to continuous phase equations to accommodate both phases' coupling. Newton's second law of motion applicable to the transmission of the droplets is given as
| (6) |
where is droplet mass, is the continuous phase velocity, is droplet velocity, represents the droplet's density, is the density of continuous phase, and is droplet relaxation time. Here the effect of other external forces is not considered due to their insignificant effect on droplet transport. As most of the particle diameters are above the effect of pressure gradient forces is not modeled.27 The dispersion of droplets is primarily affected by the turbulence in the continuous phase. The response time is modeled according to Stokes's law27
| (7) |
where is droplet diameter, is dynamic viscosity, is drag coefficient, and is Reynolds number. The values of constants used can be found out in Ref. 42
| (8) |
| (9) |
The turbulent dispersion of droplets is tracked by stochastic tracking with the discrete random walk (DRW) model, enabling instantaneous turbulent fluctuations on the droplet trajectories. The DRW model for tracking the droplets has been successfully used by various authors.10,14,37 The value of integral time constant used is 0.15; the equations used in the DRW model are well documented in the ANSYS Fluent theory guide.27 Two-way turbulence coupling is used in the numerical modeling to allow the effect of damping or turbulent eddies produced by droplets, which contributes to turbulent kinetic energy production. A trap discrete phase boundary condition was given at all the walls. When the droplet comes in contact with a wall, the trap boundary condition stops calculating that trajectory, and its volatile fraction is added into the fluid domain as water vapor. Reflection was not considered due to the inconsistency in the table's material, shape, and size. Ventilation inlets and outlets are assigned with escape boundary conditions for the discrete phase. The escape boundary condition assumes that the droplet has left the calculation domain and stops the droplet's trajectory calculations.
Modeling heat and mass transfer from droplet
Evaporation is an essential phenomenon when a droplet is traversing in the surrounding medium. The modeling of saturation vapor pressure and mass diffusivity is crucial in modeling evaporation. In this study, temperature-dependent saturation vapor pressure is defined according to the ANSYS Fluent's predefined data.36 Mass diffusivity is assumed to be constant (value is used at room temperature of ) as the temperature of the surrounding air does not undergo a drastic change. Evaporation is assumed to be driven by Fick's law's gradient diffusion, which correlates the evaporative molar flux of vapor and the difference between different species' vapor concentrations
| (10) |
where is evaporative molar flux, is mass transfer coefficient, and are vapor concentration at the droplet surface and surrounding medium, respectively. The concentration of vapor at the droplet surface is calculated using the temperature-dependent saturation vapor pressure . is used as a source term in the species transport equation. The vapor concentration at the droplet surface is defined as
| (11) |
where is the universal gas constant and is the droplet temperature.
The concentration of water vapor in the surrounding continuous phase is calculated by solving species equations given as
| (12) |
where is the local mole fraction of species , is local pressure, and is bulk temperature of the surrounding continuous phase. The mass transfer coefficient from droplet to the surrounding continuous phase is calculated by a Sherwood number correlation given by Ranz and Marshall43
| (13) |
where is diffusion coefficient of vapor in the continuous phase and is Schmidt number. The change in mass of the droplet due to evaporation at every time step is calculated as
| (14) |
where is the molecular weight of species and is the surface area of the droplet.
The droplet surface temperature is determined by the heat balance equation, which conveys the relationship between sensible heat change in a droplet with the convective and latent heat transfer between the droplet and the continuous phase
| (15) |
where is the specific heat of droplet, is evaporation rate, and is latent heat. The convective heat transfer coefficient, , is calculated by the Nusselt number correlation given by Ranz and Marshall43
| (16) |
where is the thermal conductivity of continuous phase and is Prandtl number of the continuous phase.
Modeling mask as a porous media
The mask is modeled as a porous-jump for continuous phase, which involves a pressure drop due to viscous resistance and inertial resistance. The thickness of the mask is taken as ; the equations for calculating pressure drop are taken in accordance with modeling done by Dbouk and Drikakis,44 and a critical droplet diameter of is selected. If a droplet diameter is less than the critical diameter, it can pass through the porous medium and are treated as if they “penetrate” through the mask. The interaction of droplets with porous media is modeled through a user-defined function (UDF). If a droplet coming in contact with porous media has a diameter greater than the critical diameter, then the trajectory calculations are stopped for those and are considered as “stick” to the face mask. The pressure drop across the mask is calculated as follows:44
| (17) |
where and are coefficients for viscous and inertial resistances, respectively. It is assumed that porous media is made up of fiber, and the coefficients are calculated as
| (18) |
| (19) |
where is the thickness of the porous media, is the packing density of the material, is the critical diameter. The packing density value is taken as 0.15 according to the average value for the masks' fibrous layers.45
Solution methodology
The conservation equations for mass, momentum, energy, and species transport are solved using the incompressible pressure-based Reynolds averaged Navier–Stokes (RANS) approach. The COUPLED algorithm is used to solve the pressure velocity coupling. Second-order spatial and temporal discretization schemes were adopted for a stable and accurate solution. The RNG turbulence model with scalable wall functions is used to solve turbulence equations, which are utilized to close conservation equations. To apply scalable wall functions, which uses logarithmic law to model the relationship between walls and turbulent flow, values of less than 11.25 were maintained. The convergence is achieved by monitoring residuals of continuity, momentum, turbulence, energy, and species that falls below the order of . The ventilation outlet's mass flow rate is monitored to check mass imbalance to ensure convergence is reached. The continuous phase equations and discrete phase equations are solved alternatively. The discrete phase equations are solved after every ten iterations of the continuous phase to allow coupling between two phases. The DPM source terms were linearized to reduce the number of iterations required to converge the solution. The droplet size distribution used in the study has diameters ranging from 1 to , and as shown in the validation study, evaporation time for droplets is greater than , the time steps are selected such that evaporation is captured accurately. Due to the evaporation, the droplet diameter reduces to a dry nuclei state, and after that, no evaporation of droplet occurs. The time step size of during evaporation and after the evaporation is employed for the simulations, ensuring the stability criteria.
RESULTS AND DISCUSSION
The transmission of the droplets in the surrounding medium differs in every environmental condition. This study focuses on droplets' fate generated from a single cough inside a ventilated conference room/meeting room. We have analyzed the effect of ventilation rates on droplet transmission for two different ACH rates. The ventilation inlet and outlet locations significantly affect the distribution of droplets in a controlled environment. We have altered the inlet and outlet locations for two ACH values to determine its influence on droplet trajectories. The two cases for each ACH are further simulated with a mask on the face of each person. The droplet distribution inside the conference was compared with cases without a mask. During the transmission of the droplets, evaporation plays an important role; therefore, it is imperative to consider this effect. A few studies related to the transmission of the particles have neglected this as they have simulated the dry nuclei transmission.11,13,14,46 This leads to the inclusion of errors in the trajectory calculations compared to real-life scenarios. The mass of the droplets changes significantly due to consideration of the above assumption. We have considered droplet diameter distribution given by Xie et al.,29 generated due to coughing action. After the volatile fraction of the droplet is evaporated, it is transmitted as dry nuclei and becomes airborne. The minimum and maximum diameters obtained in our simulation after completing the evaporation phenomenon agree with Yang et al.32 They have found that the distribution of dry nuclei droplets is around . From the results of our simulation, the size range of dry nuclei obtained is , which is in the same range. These dry nuclei can cause an airborne transmission of the virus. We have simulated each case for and case 6 until the fate of all the droplets is sealed. The number of droplets impinging on various surfaces was tracked for each case, along with their residence time. The number of droplets reaching different surfaces helps to understand the risk of getting exposed to the virus at different locations. The droplets' residence time enables us to recognize the effect of the ventilation rates and their location, whether the droplets are reaching faster or slower.
Transmission of the droplets
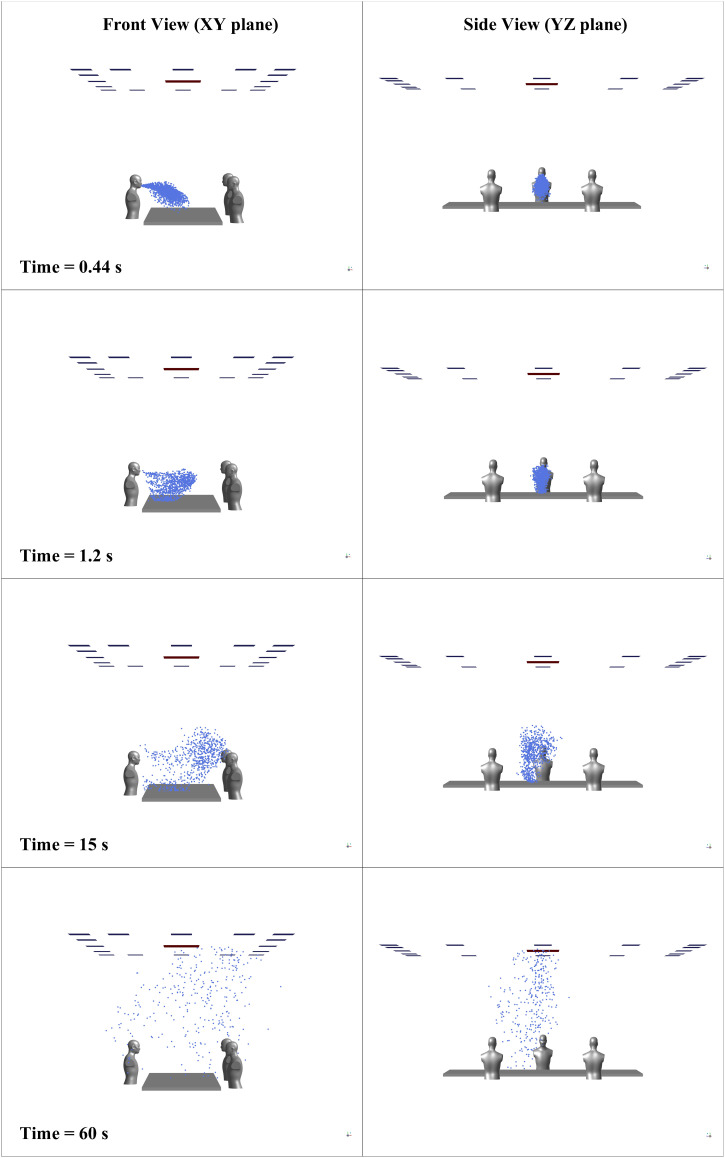
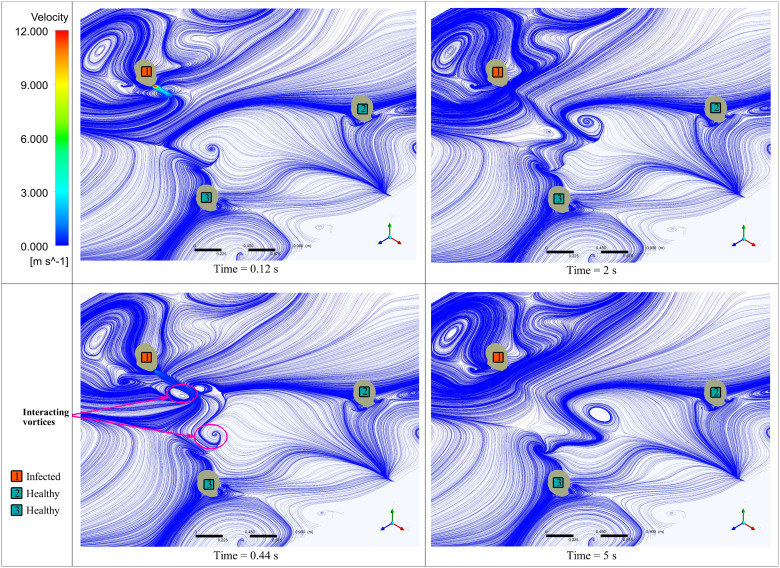
The transmission of the droplets is governed by the external forces acting on them, the effect of evaporation, and the surrounding flow's nature. Figure 7 shows droplet distribution inside the conference room at various time instants in two different planes. The evaporation from the droplet's surface results in a reduction in diameter, and the droplets may travel as dry nuclei carrying the virus. The evaporation of all droplets is completed in less than ; the droplets' trajectory is now affected only by external forces and the motion of the surrounding fluid. One of the vital aspects an indoor environment differs from an outdoor one is the flow patterns surrounding the person. The indoor environment has confined walls and various obstructions to the fluid flow, which causes recirculation of the surrounding medium and changes the flow physics. The cough airflow from an infected person's mouth interacts with the conference room's flow field developed due to ventilation. The interaction between these two alters the movement of the particles flowing along with the cough airflow. Figure 8 shows vortices formed due to the interaction of cough airflow and surrounding fluid passing by obstructions in the conference room at various time instances, at a distance of (same height to that of a coughing source) from the bottom wall. After , there is a slight shift of the droplets' position toward the left-hand side, caused by the interaction between two vortices, as shown in Fig. 8.
FIG. 7.
Distribution of the droplets inside the conference room over 60 s for case 2.
FIG. 8.
Surface velocity streamlines at the height of 1.245 m from the ground.
Droplet fate
Droplets generated from the cough may carry the virus along with them. The evaporation from the droplets' surface causes a reduction in droplet diameter; by a particular time, the droplet reaches the dry nuclei state depending upon its initial diameter and surrounding conditions. In the initial phase, droplets follow the mainstream airflow generated from the cough and travel together, similar to the droplet clouds. The droplet movement is simultaneously affected due to the effect of gravity force, drag force, lift force, and surrounding flow. Droplets with a diameter greater than are tending to settle due to the considerable influence of gravity force than smaller droplets of diameter less than .47 In this particular case, the obstruction due to the table further promotes the droplets' early deposition. As the number of droplets and their mass decreases in the conference room with evaporation and deposition on various surfaces, the surrounding flow's effect increases. The surrounding flow is affected by the ventilation rates, location of the vents, obstructions in the room, size, and vents' shape. This study is restricted to the ventilation rates and their position in the conference room's typical layout. For each case, the continuous phase distribution in the conference room is obtained by running the steady-state simulation, and then transient DPM simulation is carried out for s.
Case 1
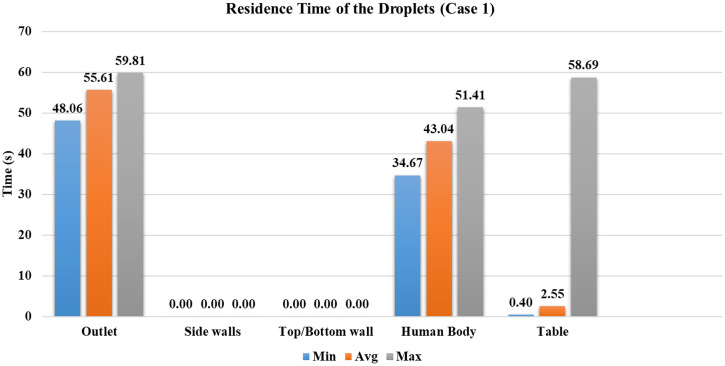
The ventilation inlets' position is at peripheral vents, and the outlet vent is at the center with four ACH. In this case, most particles are deposited on the table, contributing of injected droplets. Larger diameter droplets reach the table within 0.4 s. The average time of droplets to reach the table is 2.55 s, indicating that the most droplets are deposited in less than s. Figure 9 shows the minimum, maximum, and average time taken for droplets to reach the conference room's particular surface. At the end of the simulation, droplets are present in the conference room in their dry nuclei state. The mass of droplets present in the domain and the mass that went inside the outlet vent is less than of the injected mass, as shown in Fig. 9.
FIG. 9.
Residence time of droplets for case 1.
The results indicate that a significant amount, of droplet mass, is deposited on the table. This makes it a higher risk of transmission of the virus through contact with the surface. It signifies that the nearby surfaces/obstructions in the cough's direction receive a significant viral load. In a similar scenario, it is recommended to restrict from touching these surfaces to avoid the virus's spread through surface contact. Case 1 is a low ventilation rate with inlet vents at the top wall's periphery; this provides a minor random movement of droplets from the first four cases. Within , no particle has reached another person or walls of the room.
Case 2
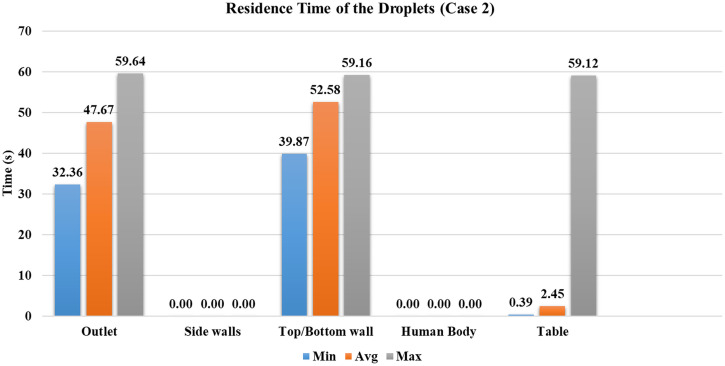
The ventilation inlets' position is at the peripheral vents, and the outlet vent is in the center with eight ACH. The increase in the ventilation rate has a more significant influence on the droplets in the domain than case 1, which results in more particles reaching the outlet vent. Approximately of the injected droplets have reached the outlet vent. The droplets reach the outlet vent faster; the least time taken for droplets to get to the outlet vent is , which is nearly earlier than case 1. The overall increase in the mean flow inside the conference room has forced the droplets to move outwards from the central region, due to which some droplets reach the top and bottom walls. Figure 10 shows the droplet's residence time inside the conference room before they reach a particular surface. Even though the number of droplets reached to the top or bottom walls is small, the ventilation rate increase has increased the droplet's movement inside the conference room.
FIG. 10.
Residence time of droplets for case 2.
Similar to case 1, a large amount, around , of droplets are trapped on the obstruction provided by the table. The minimum, average, and maximum residence time of the droplets before reaching the table is nearly the same as case 1. The number of droplets present inside the domain after has been reduced by ∼9% because the increased ventilation rate has significantly altered the droplets' distribution inside the conference room. From the perspective of mass deposited on various surfaces, the mass reached to the outlet vent is the maximum out of the first four cases, as shown in Fig. 11. It signifies that with the increase in the ventilation rate, more amount of viral load carried by the droplets can be removed from the indoor environment. However, another perspective that must be noted is that the amount of mass present in the domain is also maximum out of the first four cases due to increased randomness in the conference room (refer to Fig. 11). The droplets in the domain are on course to get entrained inside the outlet vent (refer to Fig. 7), so there is an increased chance of droplets being escaped through the outlet vent. No droplets have reached other persons present inside the conference room within .
FIG. 11.
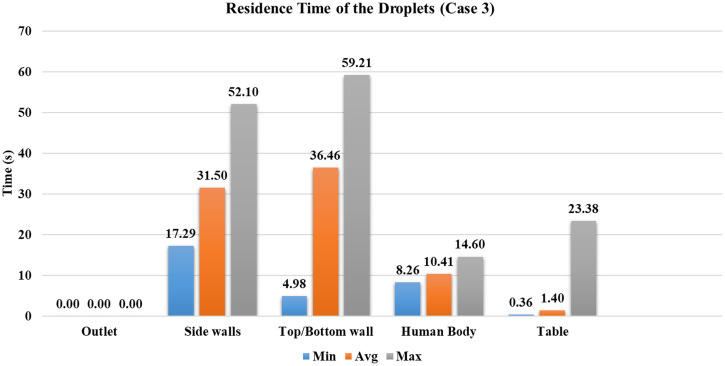
Residence time of droplets for case 3.
Case 3
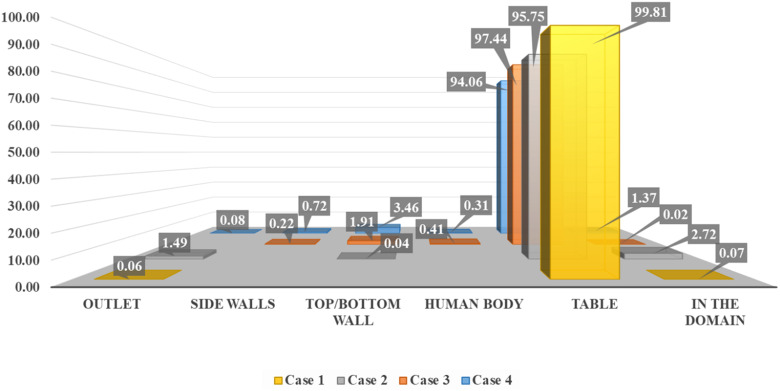
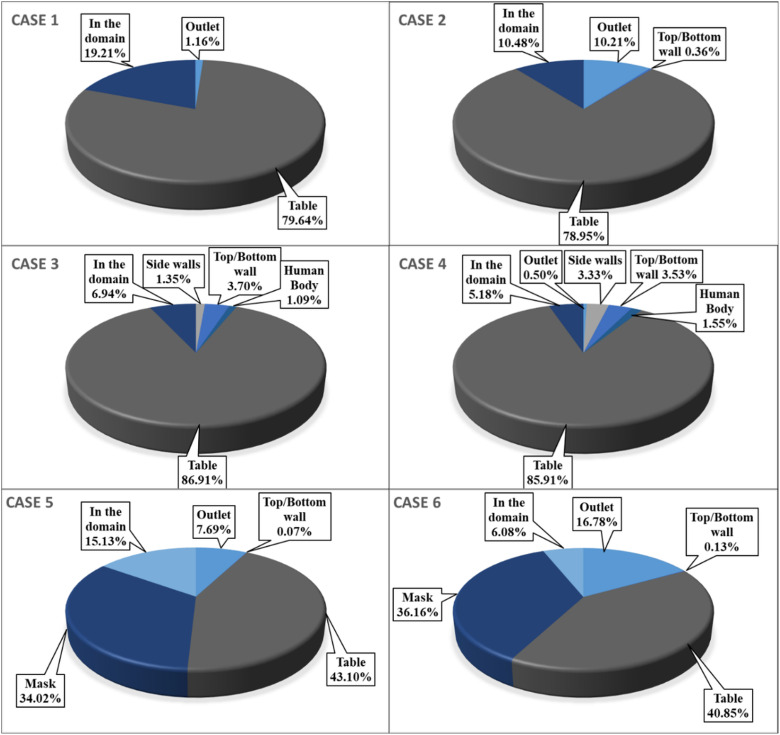
The ventilation inlet position is at the center, and the outlet vents are distributed on the periphery of the conference room, with four ACH. As the ventilation inlet is at the center with a lesser area than the first two cases, the velocity has significantly increased for the same ACH. This situation can also be viewed as similar to a ceiling fan inside a conference room. The velocity through the inlet is four times the velocity provided in case 1. Due to the increased velocity in the center of the room, where droplets are being transmitted in the initial phase, the droplets are forced radially outwards. This causes droplets to reach other persons sitting inside the conference room, with of the injected droplets deposited on the other person's body. As the droplets move outwards, the central stream's influence coming from the ventilation inlet starts diminishing. The droplets on which gravity force prevails other external forces such as drag force and lift force are deposited on the bottom wall or floor. When the surrounding flow has a lesser influence on the droplets, smaller droplets move upwards due to the airflow inside the conference room. Approximately of injected droplets have reached the top/bottom walls, the highest out of the first four cases, as shown in Fig. 12. As the droplets are moved radially outward in the initial phase, the minimum time required for a droplet to reach the bottom wall is Fig. 13). Throughout this period, droplets are continuously trapped on the top and bottom walls, with the average time taken by them is . In the first two cases, droplets were restricted to the conference room's central part compared to cases 3 and 4, resulting in no droplets reaching the side walls. In case 3, as the droplets are forced radially outwards, of injected droplets have reached the side walls, which contributes to of the injected mass.
FIG. 12.
Percentage of droplets deposited on various surfaces according to their initial mass.
FIG. 13.
Percentage of number of droplets deposited to the different surfaces inside the conference room domain.
Because of the central stream from the ventilation inlet, droplets reach the table faster than in the first two cases. Nearly of the injected droplets are deposited on the table, which is 8% greater than cases 1 and 2. The average time they have taken to reach the table is reduced by around . At the end of s simulation, nearly of the injected droplets are still present inside the conference room. In case 3, the droplets have reached other persons sitting across the infected person; it happened due to the high-velocity stream coming from the ventilation inlet. It suggests that the infected person's sitting location should not be under the influence of a high-velocity stream, resulting in droplets being distributed randomly inside an indoor environment, which may cause a significant number of virus-laden droplets becoming airborne.
Case 4
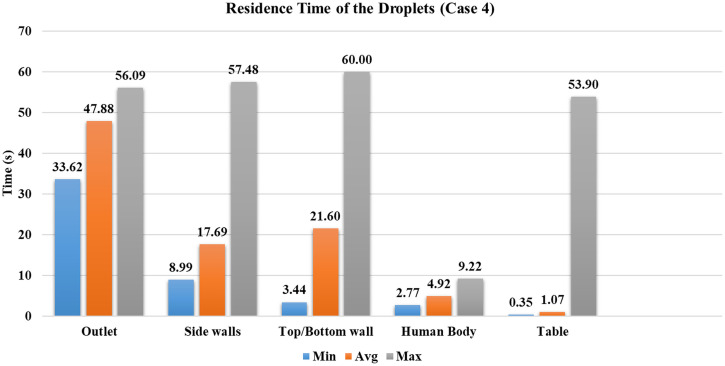
The ventilation inlet position is at the center, and the outlet vents are distributed on the periphery of the conference room, with ACH are eight. It represents a similar scenario to case 3, but with a higher velocity of the central ventilation inlet stream; the droplets are moved radially outwards with high velocity. The average time taken by droplets to reach the table is further reduced by in case 4 than case 3 (refer to Fig. 14). As the ventilation inlet is at the center, the flow behavior is similar to case 3. However, due to higher velocity in the conference room, droplets travel farther than case 3. Nearly of the injected droplets reach to outlet vent within due to the increased velocity of the central stream coming from the ventilation inlet. Refer to Fig.12 for the number of droplets reaching various surfaces inside the conference room.
FIG. 14.
Residence time of droplets for case 4.
Of the first four cases, case 4 has the least number of droplets present inside the domain. The most number of particles reaches sidewalls, and simultaneously the highest number of droplets reached persons sitting inside the conference room. The characteristics of case 4 are similar to case 3 but with greater randomness in the movement of droplets inside the conference room. Of all cases, most droplets ( reached persons sitting across the table, increasing the chances of getting exposed to the virus. Hence, the seating arrangement should such that the person's sitting location inside the conference room should not be below the inlet vents.
Case 5
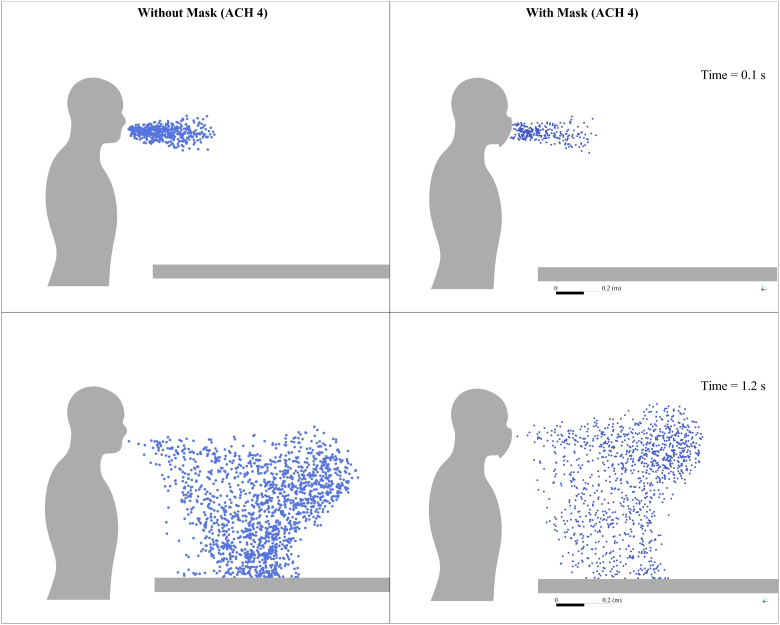
In case 5, the mask as a porous medium is added to case 1, and everything else is the same. From the simulation results, it is found that around of the droplets are absorbed in the mask in less than , as shown in Fig. 12; their trajectory calculations are stopped at that point. As the number of droplets marching inside the conference room is decreased, the droplet cloud's strength is reduced. The reduced strength of droplets results in a lesser penetration length of the injected droplets than the first four cases within the initial period, where droplets follow the cough airflow. Wearing a mask restricts the spread of droplets inside the conference room; simultaneously, the number of droplets entrained inside the outlet vent was increased by compared to case 1 (without a mask for the same ventilation conditions). Figure 15 shows droplet distribution at two different time instances between case 1 (without mask) and case 5 (with mask).
FIG. 15.
Droplet distribution inside the conference room without the mask and with mask for ACH 4 at various time instances.
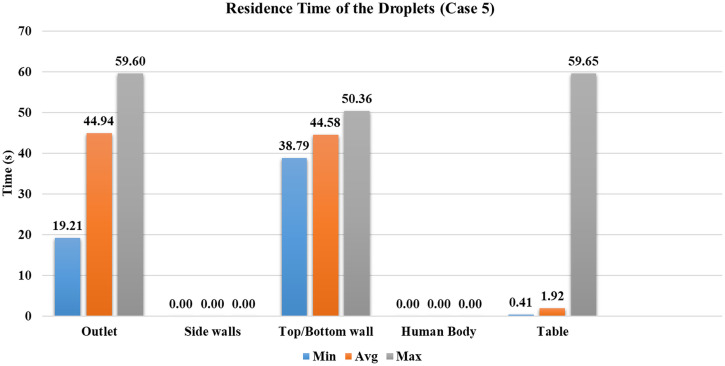
After the cough airflow is diminished, the surrounding fluid's effect is more significant on the droplet transmission compared to cases without a mask. At this stage, particles are still in the center of the room, and they start traveling toward the outlet vent. The usage of a mask has decreased the number of droplets going inside the conference room and improves their tendency to get entrained into the outlet vent. Compared to the case without a mask for the same ventilation conditions (case 1), increment is found in the number of droplets entrained into the outlet vent. The minimum time required for droplets to reach the outlet is reduced by nearly , the average time by (refer to Figs. 9 and 16). The mask presents a safer scenario than the without mask scenario for the same conditions, with fewer droplets inside the indoor space. More droplets can be extracted via the outlet vent within the same time.
FIG. 16.
Residence time of the droplets for case 5.
Case 6
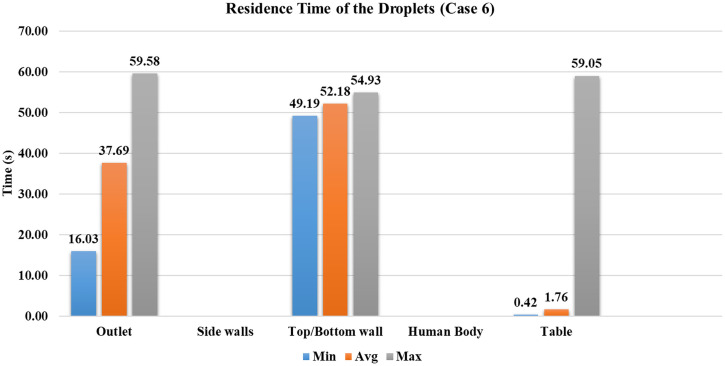
The general behavior of case 6 is on similar lines to that of case 5. The present case has an increased ventilation rate of ACH eight as compared to case 5. Wearing a mask restricts the spread of droplets inside the conference room; simultaneously, the number of droplets entrained inside the outlet vent was increased by compared to case 2 (without a mask for the same ventilation conditions). The reduction in the number of droplets present in the domain after 60 s is ∼4% in cases 5 and 6 compared to cases without a mask for the same ventilation conditions. However, the increment in the number of droplets entrained into the outlet vent is for the double ACH ventilation rate for cases wearing a mask. The minimum time required for droplets to reach the ventilation outlet is reduced by , average time by (refer to Figs. 16 and 17), which confirms that the lesser strength of the droplet cloud generated while wearing a mask promotes early extraction of the droplets from the room. We have simulated case 6 until the of the injected droplets are either trapped or escaped, which required . Hence, the study recommends wearing a mask and high ACH to restrain the virus's transmission in an indoor environment.
FIG. 17.
Residence time of the droplets for case 6.
In all the cases without the mask, at least of the droplets are deposited on the nearby obstruction provided by the table. In case 1, the ventilation flow effect is minimal and does not significantly impact droplets' path. The forces acting on the droplet, the reduction in diameter due to evaporation play a significant role in determining droplets' path. As the velocity of ventilation, inlet streams is increased in case 2; it increased influence on the transmission of the droplets with more droplets reaching the outlet vent and smaller residence time than case 1. The transmission of the droplets in cases 3 and 4 happens in similar nature. The ventilation inlet is in the center with a lesser flow area than cases 1 and 2. The velocity has increased further; it has more influence on the droplet transmission inside the conference room. The high-velocity stream coming from the ventilation inlet alters the droplet cloud present in the domain, and the particles move outwards from the center with the surrounding flow. This results in droplets reaching other persons sitting inside the conference room, not the desired situation. The frequent cleaning of the surfaces/obstructions present in the room is needed to avoid virus spread through surface contact. The ventilation position should be such that it does not randomly distribute the droplets in an indoor space. As the particles are randomly distributed, they might continue to travel inside an indoor space, which is also not a desired situation for containing the virus's spread.
In the scenario with a mask's usage, the strength of the droplet cloud traversing in the surrounding medium gets reduced. The penetration length of the droplets is decreased in the direction of the cough airflow. The effect of ventilation rates is significant due to a reduction in the number of droplets present in the domain, promoting the number of droplets reaching the outlet vent. Compared to the cases without a mask, wearing a mask provides a safer scenario in an indoor environment as more droplets travel faster toward the outlet vent.
CONCLUSIONS
A numerical study is carried out to analyze the effect of ventilation rate, the position of the vents, and efficacy of the mask on the droplet transmission inside a conference room. For various ACH values, the residence time of the droplet is quantified. Results of the study indicate that for this particular scenario, an increase in ventilation rate improved the extraction of the droplets through the outlet vent. The location of the vents determines the flow circulation and has a significant influence on the particle trajectories. Wearing a mask allows fewer droplets inside a conference room, and increased ACH results in the best scenario out of six cases analyzed in this study. The following conclusions and recommendations can be made from the results of this study:
-
•
A large part ( of droplets is deposited on the table in cases without a mask. Therefore, surfaces near the coughing source must be appropriately cleaned, and touching should be avoided to reduce the chances of virus spread through surface contact.
-
•
The rate of ventilation increases the number of droplets extracted from the outlet vent, and changing ACH from four to eight has increased droplets extraction by within . The percentage improvement in the number of droplets that went inside the outlet vent with the addition of the mask is for both ACH.
-
•
The location of ventilation vents significantly alters the distribution of the droplets in the conference room. When the source location is under the inlet vent, the droplets are randomly carried along with the airflow, resulting in a random spread. Therefore, the sitting arrangement should be such that no person is sitting under the direct influence of the inlet vent.
-
•
Of the six cases we have studied in the present analysis, case 6 represents the best scenario. Case 6 simulation was extended until of the droplets fate is sealed, and within that time, no droplet has reached the persons sitting across the table. Therefore, wearing a mask and physical distancing of is recommended inside the conference room or similar indoor environments.
-
•
For case 6, the time required to extract (either trapped or escaped at various surfaces) of injected droplets from the conference room was . A similar time must be mandated between two consecutive meetings inside the same conference room. All surfaces/obstructions should be cleaned as well before the new meeting is started. This minimum time of is to ensure that there should not be any virus contamination present in the conference room when new persons arrive inside.
-
•
The extraction of particles in the outlet vent may concern centralized air conditioning systems, and the vented air needs to be disinfected before it is recirculated again.
This study results are restricted to similar indoor conditions to understand how virus-laden droplets spread from an infected person's coughing action. Different arrangements and different standards of ventilation may require a specific study to analyze the droplet spread. However, the recommendations provided in this study suits typical applications. Heat transfer from the human body is neglected in this study to reduce the numerical setup complications without hampering the droplets' transmission inside the conference room. It may be assumed that persons sitting inside are wearing well-insulated clothes. The droplet interaction such as reflection and breakup when coming in contact with surfaces/obstructions in the conference room is not considered due to the different kinds of materials, shapes, and sizes used in practical situations. A more detailed study may be carried out considering all these aspects.
ACKNOWLEDGMENTS
The authors acknowledge the financial support from the Department of Science and Technology, Government of India (Grant No. ECR/2017/002680).
Note: This paper is part of the special topic, Flow and the Virus.
DATA AVAILABILITY
The data that support the findings of this study are available from the corresponding author upon reasonable request.
References
- 1. Kim J. H., Florian M., and Clemens J. D., “ Looking beyond COVID-19 vaccine phase 3 trials,” Nat. Med. 27(2), 205–211 (2021). 10.1038/s41591-021-01230-y [DOI] [PubMed] [Google Scholar]
- 2.Occupational Safety and Health Administration, Protecting workers: Guidance on mitigating and preventing the spread of COVID-19 in the workplace ( Occupational Safety and Health Administration, 2021). [Google Scholar]
- 3. Dbouk T. and Drikakis D., “ On airborne virus transmission in elevators and confined spaces,” Phys. Fluids 33(1), 011905 (2021). 10.1063/5.0038180 [DOI] [PMC free article] [PubMed] [Google Scholar]
- 4. Akhtar J., Garcia A. L., Saenz L., Kuravi S., Shu F., and Kota K., “ Can face masks offer protection from airborne sneeze and cough droplets in close-up, face-to-face human interactions?—A quantitative study,” Phys. Fluids 32(12), 127112 (2020). 10.1063/5.0035072 [DOI] [PMC free article] [PubMed] [Google Scholar]
- 5. Vuorinen V. et al. , “ Modelling aerosol transport and virus exposure with numerical simulations in relation to SARS-CoV-2 transmission by inhalation indoors,” Saf. Sci. 130, 104866 (2020). 10.1016/j.ssci.2020.104866 [DOI] [PMC free article] [PubMed] [Google Scholar]
- 6. Dbouk T. and Drikakis D., “ On coughing and airborne droplet transmission to humans,” Phys. Fluids 32(5), 053310 (2020). 10.1063/5.0011960 [DOI] [PMC free article] [PubMed] [Google Scholar]
- 7. Blocken B., Malizia F., Van Druenen T., and Marchal T., “ Towards aerodynamically equivalent COVID-19 1.5 m social distancing for walking and running” (to be published), available at http://www.urbanphysics.net/COVID19.html.
- 8. Li Z., Wang H., Zhang X., Wu T., and Yang X., “ Effects of space sizes on the dispersion of cough-generated droplets from a walking person,” Phys. Fluids 32(12), 121705 (2020). 10.1063/5.0034874 [DOI] [PMC free article] [PubMed] [Google Scholar]
- 9. Li H., Leong F. Y., Xu G., Ge Z., Kang C. W., and Lim K. H., “ Dispersion of evaporating cough droplets in tropical outdoor environment,” Phys. Fluids 32(11), 113301 (2020). 10.1063/5.0026360 [DOI] [PMC free article] [PubMed] [Google Scholar]
- 10. Abuhegazy M., Talaat K., Anderoglu O., Poroseva S. V., and Talaat K., “ Numerical investigation of aerosol transport in a classroom with relevance to COVID-19,” Phys. Fluids 32(10), 103311 (2020). 10.1063/5.0029118 [DOI] [PMC free article] [PubMed] [Google Scholar]
- 11. Lelieveld J. et al. , “ Model calculations of aerosol transmission and infection risk of covid-19 in indoor environments,” Int. J. Environ. Res. Public Health 17(21), 8114–8118 (2020). 10.3390/ijerph17218114 [DOI] [PMC free article] [PubMed] [Google Scholar]
- 12. Liu H., He S., Shen L., and Hong J., “ Simulation-based study of COVID-19 outbreak associated with air-conditioning in a restaurant,” Phys. Fluids 33(2), 023301 (2021). 10.1063/5.0040188 [DOI] [PMC free article] [PubMed] [Google Scholar]
- 13. Wu L., Liu X., Yao F., and Chen Y., “ Numerical study of virus transmission through droplets from sneezing in a cafeteria,” Phys. Fluids 33(2), 023311 (2021). 10.1063/5.0040803 [DOI] [PMC free article] [PubMed] [Google Scholar]
- 14. Talaat K., Abuhegazy M., Mahfoze O. A., Anderoglu O., and Poroseva S. V., “ Simulation of aerosol transmission on a Boeing 737 airplane with intervention measures for COVID-19 mitigation,” Phys. Fluids 33, 033312 (2021). 10.1063/5.0044720 [DOI] [PMC free article] [PubMed] [Google Scholar]
- 15. Narayanan S. R. and Yang S., “ Airborne transmission of virus-laden aerosols inside a music classroom: Effects of portable purifiers and aerosol injection rates,” Phys. Fluids 33(3), 033307 (2021). 10.1063/5.0042474 [DOI] [PMC free article] [PubMed] [Google Scholar]
- 16. Bhagat R. K., Davies Wykes M. S., Dalziel S. B., and Linden P. F., “ Effects of ventilation on the indoor spread of COVID-19,” J. Fluid Mech. 903, F1 (2020). 10.1017/jfm.2020.720 [DOI] [PMC free article] [PubMed] [Google Scholar]
- 17. Pantelic J. and Tham K. W., “ Adequacy of air change rate as the sole indicator of an air distribution system's effectiveness to mitigate airborne infectious disease transmission caused by a cough release in the room with overhead mixing ventilation: A case study,” HVAC&R Res. 19(8), 947–961 (2013). 10.1080/10789669.2013.842447 [DOI] [Google Scholar]
- 18. Pendar M. R. and Páscoa J. C., “ Numerical modeling of the distribution of virus carrying saliva droplets during sneeze and cough,” Phys. Fluids 32(8), 083305 (2020). 10.1063/5.0018432 [DOI] [PMC free article] [PubMed] [Google Scholar]
- 19.See https://www.cdc.gov/coronavirus/2019-ncov/prevent-getting-sick/social-distancing.html for Social-Distancing.
- 20. Ai Z. T. and Melikov A. K., “ Airborne spread expiratory droplet nuclei between occupants indoor environments: A review,” Indoor Air 28(4), 500–524 (2018). 10.1111/ina.12465 [DOI] [PubMed] [Google Scholar]
- 21. Arumuru V., Pasa J., and Samantaray S. S., “ Experimental visualization of sneezing and efficacy of face masks and shields,” Phys. Fluids 32(11), 115129 (2020). 10.1063/5.0030101 [DOI] [PMC free article] [PubMed] [Google Scholar]
- 22. Arumuru V., Pasa J., Samantaray S. S., and Varma V. S., “ Breathing, virus transmission, and social distancing—An experimental visualization study,” AIP Adv. 11(4), 045205 (2021). 10.1063/5.0045582 [DOI] [Google Scholar]
- 23. Burnett M. L. and Sergi C. M., “ Face masks are beneficial regardless of the level of infection in the fight against COVID-19,” Disaster Med. Public Health Prep. 14(5), e47–e50 (2020). 10.1017/dmp.2020.320 [DOI] [PMC free article] [PubMed] [Google Scholar]
- 24. Gupta J. K., Lin C. H., and Chen Q., “ Flow dynamics and characterization of a cough,” Indoor Air 19(6), 517–525 (2009). 10.1111/j.1600-0668.2009.00619.x [DOI] [PubMed] [Google Scholar]
- 25. Stanke D. A. et al. , Ventilation for Acceptable Indoor Air Quality, ASHRAE Standard 62.1-2007 ( ASHRAE, 2007), pp. 1–41. [Google Scholar]
- 26. Redrow J., Mao S., Celik I., Posada J. A., and Feng Z., “ Modeling the evaporation and dispersion of airborne sputum droplets expelled from a human cough,” Build. Environ. 46(10), 2042–2051 (2011). 10.1016/j.buildenv.2011.04.011 [DOI] [Google Scholar]
- 27.ANSYS, Inc., ANSYS Fluent Theory Guide ( ANSYS, Inc., 2013), p. 814. [Google Scholar]
- 28. Rosti M. E., Olivieri S., Cavaiola M., Seminara A., and Mazzino A., “ Fluid dynamics of COVID-19 airborne infection suggests urgent data for a scientific design of social distancing,” Sci. Rep. 10(1), 22426 (2020). 10.1038/s41598-020-80078-7 [DOI] [PMC free article] [PubMed] [Google Scholar]
- 29. Xie X., Li Y., Sun H., and Liu L., “ Exhaled droplets due to talking and coughing,” J. R. Soc. Interface 6(SUPPL. 6), S703 (2009). 10.1098/rsif.2009.0388.focus [DOI] [PMC free article] [PubMed] [Google Scholar]
- 30. Komperda J. et al. , “ Computer simulation of the SARS-CoV-2 contamination risk in a large dental clinic,” Phys. Fluids 33(3), 033328 (2021). 10.1063/5.0043934 [DOI] [PMC free article] [PubMed] [Google Scholar]
- 31. Duguid J. P., “ The size and the duration of air-carriage of respiratory droplets and droplet-nuclei,” Epidemiol. Infect. 44(6), 471–479 (1946). 10.1017/S0022172400019288 [DOI] [PMC free article] [PubMed] [Google Scholar]
- 32. Yang S., Lee G. W. M., Chen C. M., Wu C. C., and Yu K. P., “ The size and concentration of droplets generated by coughing in human subjects,” J. Aerosol Med. 20(4), 484–494 (2007). 10.1089/jam.2007.0610 [DOI] [PubMed] [Google Scholar]
- 33. Sureshkumar R., Kale S. R., and Dhar P. L., “ Heat and mass transfer processes between a water spray and ambient air—I. Experimental data,” Appl. Therm. Eng. 28(5–6), 349–360 (2008). 10.1016/j.applthermaleng.2007.09.010 [DOI] [Google Scholar]
- 34. Chao C. Y. H. et al. , “ Characterization of expiration air jets and droplet size distributions immediately at the mouth opening,” J. Aerosol Sci. 40(2), 122–133 (2009). 10.1016/j.jaerosci.2008.10.003 [DOI] [PMC free article] [PubMed] [Google Scholar]
- 35. Johnson G. R. et al. , “ Modality of human expired aerosol size distributions,” J. Aerosol Sci. 42(12), 839–851 (2011). 10.1016/j.jaerosci.2011.07.009 [DOI] [Google Scholar]
- 36.ANSYS, Inc., ANSYS Fluent User's Guide ( ANSYS, Inc., 2012), pp. 724–746. [Google Scholar]
- 37. Chao C. Y. H. and Wan M. P., “ A study of the dispersion of expiratory aerosols in unidirectional downward and ceiling-return type airflows using a multiphase approach,” Indoor Air 16(4), 296–312 (2006). 10.1111/j.1600-0668.2006.00426.x [DOI] [PubMed] [Google Scholar]
- 38. Viswanath R. and Jaluria Y., “ A comparison of different solution methodologies for melting and solidification problems in enclosures,” Numer. Heat Transfer, Part B 24(1), 77–105 (2007). 10.1080/10407799308955883 [DOI] [Google Scholar]
- 39. Katramiz E., Ghaddar N., Ghali K., Al-assaad D., and Ghani S., “ Effect of individually controlled personalized ventilation on cross-contamination due to respiratory activities,” Build. Environ. 194, 107719 (2021). 10.1016/j.buildenv.2021.107719 [DOI] [Google Scholar]
- 40. Zhang Z., Han T., Yoo K. H., Capecelatro J., Boehman A. L., and Maki K., “ Disease transmission through expiratory aerosols on an urban bus,” Phys. Fluids 33(1), 015116 (2021). 10.1063/5.0037452 [DOI] [PMC free article] [PubMed] [Google Scholar]
- 41. Morawska L., “ Droplet fate in indoor environments, or can we prevent the spread of infection?,” Indoor Air 16(5), 335–347 (2006). [DOI] [PubMed] [Google Scholar]
- 42. Morsi S. A. and Alexander A. J., “ An investigation of particle trajectories in two-phase flow systems,” J. Fluid Mech. 55(2), 193–208 (1972). 10.1017/S0022112072001806 [DOI] [Google Scholar]
- 43. Ranz W. E. and W. R. Marshall, Jr. , “ Evaporation from drops,” Chem. Eng. Prog. 48(3), 141–146, 173–180 (1952). [Google Scholar]
- 44. Dbouk T. and Drikakis D., “ On respiratory droplets and face masks,” Phys. Fluids 32(6), 063303 (2020). 10.1063/5.0015044 [DOI] [PMC free article] [PubMed] [Google Scholar]
- 45. Jakšić N. and Jakšić D., “ Novel theoretical approach to the filtration of nano particles through non-woven fabrics,” in Woven Fabrics (Intech Open, 2012). 10.5772/37580 [DOI] [Google Scholar]
- 46. Xi J., Si X. A., and Nagarajan R., “ Effects of mask-wearing on the inhalability and deposition of airborne SARS-CoV-2 aerosols in human upper airway,” Phys. Fluids 32, 123312 (2020). 10.1063/5.0034580 [DOI] [PMC free article] [PubMed] [Google Scholar]
- 47. Wells W. F., “ On air-borne infection,” Am. J. Epidemiol. 20(3), 611–618 (1934). 10.1093/oxfordjournals.aje.a118097 [DOI] [Google Scholar]
Associated Data
This section collects any data citations, data availability statements, or supplementary materials included in this article.
Data Availability Statement
The data that support the findings of this study are available from the corresponding author upon reasonable request.


