Abstract
Class C G protein-coupled receptors (GPCRs) are known to form stable homodimers or heterodimers critical for function, but the oligomeric status of class A and B receptors, which constitute >90% of all GPCRs, remains hotly debated. Single-molecule fluorescence resonance energy transfer (smFRET) is a powerful approach with the potential to reveal valuable insights into GPCR organization but has rarely been used in living cells to study protein systems. Here, we report generally applicable methods for using smFRET to detect and track transmembrane proteins diffusing within the plasma membrane of mammalian cells. We leverage this in-cell smFRET approach to show agonist-induced structural dynamics within individual metabotropic glutamate receptor dimers. We apply these methods to representative class A, B and C receptors, finding evidence for receptor monomers, density-dependent dimers and constitutive dimers, respectively.
GPCRs, the targets of a third of all Food and Drug Administration-approved drugs, comprise the largest class of transmembrane (TM) protein receptors. Numerous studies have suggested that GPCRs can assemble as dimeric and/or heterodimeric complexes, which has raised notable interest that these interactions may impact GPCR function and might therefore allow for selective targeting for improved therapeutics with greater regional and/or pharmacological specificity1–3. Nonetheless, while overwhelming evidence suggests that class C GPCRs form stable homodimers or heterodimers critical for function4,5, the oligomeric status of class A and B receptors remains controversial1,2.
Of the methods capable of detecting receptor interactions in the plasma membrane of living cells, single-molecule imaging techniques offer the distinct advantage of potentially revealing the stochastic and dynamic behaviors of individual molecules in real time6. Single-particle-tracking (SPT) studies of class A GPCRs based on intensity and/or colocalization analyses have, however, reached conflicting conclusions as to the preponderance of monomers versus dimers and the interaction times of such complexes6–11. While SPT studies of receptor interactions interpret particle colocalization as physically interacting molecules, these studies have used conventional diffraction-limited imaging methods (typically >250 nm) that far exceed the molecular scale. This issue represents a potentially substantial complicating factor when seeking to differentiate physical receptor interactions from coincident localization7.
SmFRET (also referred to as single-pair FRET) is a robust tool for reporting distances less than 10 nm between fluorescent probes12,13. However, while the approach has the molecular-scale resolution needed to directly measure GPCR complexation, its use in mammalian cells has rarely been reported due to multiple experimental and data analysis challenges14,15. The most notable studies use smFRET to study conformations of proteins labeled in vitro and microinjected into cells16,17. While feasible for soluble proteins, this approach is not suited for studying TM proteins in the plasma membrane. To date, only two native TM proteins were studied by smFRET in living cells18–20, but these studies did not provide generally applicable methodology for covalent labeling or for systematic analysis of large numbers of smFRET trajectories.
Here, we report advances for smFRET imaging that enable investigations of receptor dimers in living cells, including agonist-induced structural dynamics between protomers. These advances leverage self-labeling tags for site-specific covalent labeling, thereby avoiding the limitations associated with using ligands for labeling, combined with bright self-healing organic fluorophores, the performance of which does not depend on the presence of potentially toxic, membrane-altering photostabilizing agents in solution21,22. By controling expression, we investigate receptor interactions from low receptor densities typically used for SPT to densities that are orders of magnitude higher, including those that occur in natural settings. We also combine smFRET with fluorescence recovery after photobleaching (FRAP) to track individual complexes at high receptor density to address the possibility that dimerization is a rare event at low receptor concentrations. These investigations were further enabled by establishing automated data-processing pipelines for tracking and analyzing smFRET events imaged in the dynamic plasma membrane environment.
To demonstrate the potential of these advances, we examined homodimerization of the μ-opioid receptor (MOR), secretin receptor (SecR) and metabotropic glutamate receptor 2 (mGluR2), representative class A, B and C GPCRs, respectively. We show that smFRET can be efficiently tracked in mGluR2, a well-established constitutive dimer3, and that agonist-mediated conformational dynamics can be detected within these complexes in living cells. Additionally, we show that MOR and SecR are monomeric at the low surface densities used for SPT. By contrast, at much higher densities, we observe that MOR remains monomeric, whereas SecR forms relatively long-lived complexes, demonstrating the density-dependent nature of receptor complex formation for some but not all GPCRs.
Results
Imaging receptor dimers in mammalian cells by smFRET.
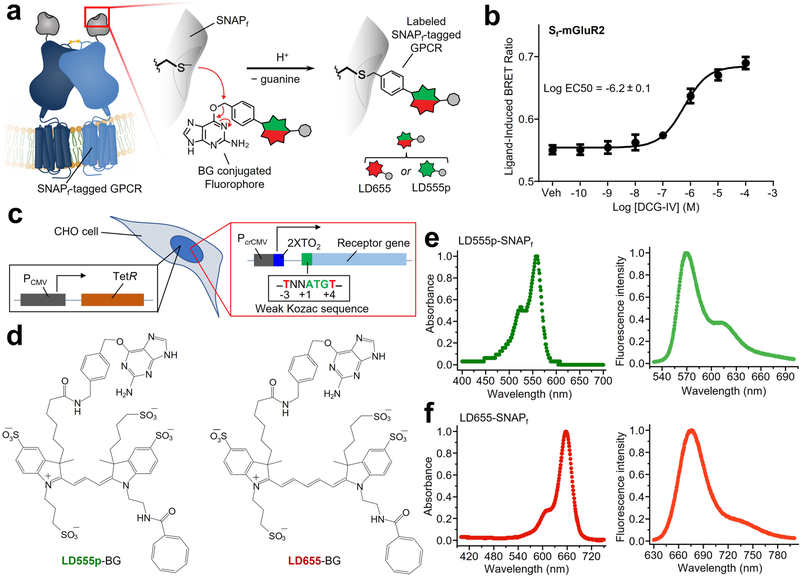
To achieve specific labeling of cell surface receptors, we used the self-labeling SNAPfast tag (SNAPf) that binds fluorophores covalently23–26 (Extended Data Fig. 1a). We generated expression constructs that encode amino-terminally SNAPf-tagged (Sf)-mGluR2 (Extended Data Fig. 1), which forms covalent disulfide-bonded receptor dimers3, and showed that the receptor was functional (Extended Data Fig. 1b and Methods). For single-molecule imaging, we generated Chinese hamster ovary (CHO) cell lines stably expressing Sf-mGluR2 using a system that confers low basal, tetracycline-regulatable receptor densities compatible with SPT (Extended Data Fig. 1c and Methods)21. We chose the membrane-impermeant self-healing Lumidyne 555p (LD555p) and 655 (LD655) dyes as the donor and acceptor fluorophores, respectively, for labeling Sf receptors (Extended Data Fig. 1d–f, Supplementary Table 1 and Methods) in the plasma membrane because they exhibit increased brightness and longevity due to intramolecular triplet-state quenching of triplet-excited states prone to unwanted photophysics and photodestruction, as well as low levels of nonspecific labeling21,22.
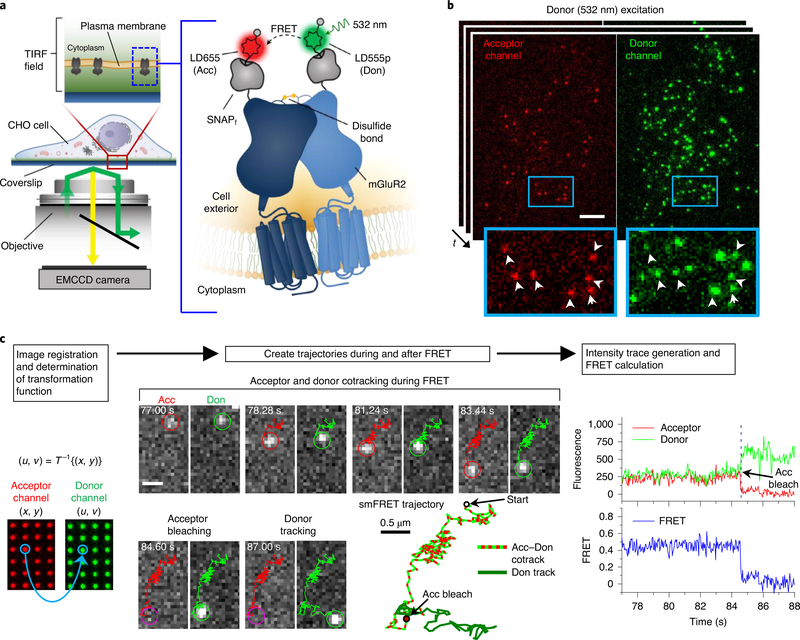
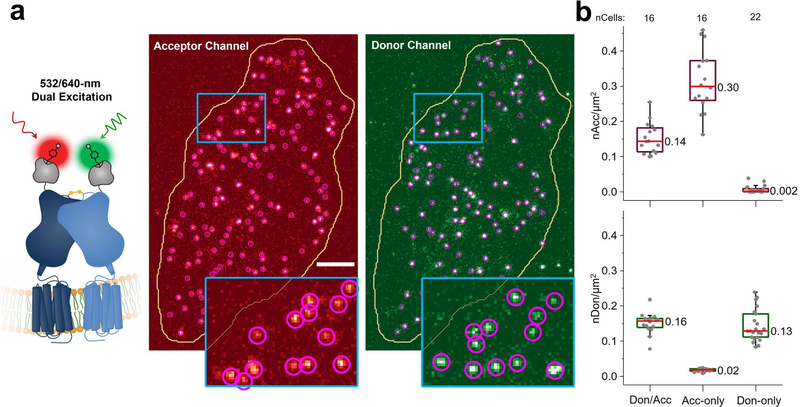
Total internal reflection fluorescence microscopy (TIRF) was used for real-time imaging of individual Sf-mGluR2 proteins stochastically labeled with donor and acceptor fluorophores diffusing within the plasma membrane (Fig. 1a and Methods). Cells were imaged briefly by direct and simultaneous donor and acceptor excitation immediately before smFRET imaging to quantify the surface density of labeled Sf-mGluR2 (Extended Data Fig. 2a and Methods). The median surface density of total labeled receptors was 0.3 receptors per μm2, consistent with previous SPT studies of receptor interactions6,9,10, and at a donor-to-acceptor labeling ratio of ~1:1 (Extended Data Fig. 2b). With only donor excitation, we observed acceptor intensity that colocalized with that of the donor (Fig. 1b and Supplementary Videos 1 and 2), indicative of the detection of receptor complexes by smFRET. Donors without colocalized acceptor are consistent with the stochastic labeling approach employed, in which a population of dimers labeled with two donors or only one donor and no acceptor is possible (Fig. 1b).
Fig. 1 |. Imaging and tracking receptor dimers in living mammalian cells by smFRET.
a, Schematic of single-molecule TIRF imaging of CHO cells expressing Sf-mGluR2 labeled with LD555p and LD655 fluorophores. Don, donor; Acc, acceptor; EMCCD, electron-multiplying charge-coupled device. b, Representative image of a movie (frame 3, 0.12 s) of labeled Sf-mGluR2 excited by the donor laser (532 nm), showing acceptor signals colocalized with their corresponding donors, both delineated by white arrows. Scale bar, 5 μm; enlarged view, 8.8 μm × 5.8 μm. c, Data analysis and tracking platform for smFRET. Left, a set of control points was used to derive a nonlinear transform function T. The spatial position of the donor signal was then calculated by mapping the acceptor position at each time point onto the donor channel. Middle, representative smFRET image sequence of Sf-mGluR2 diffusing at the cell surface, showing the acceptor during FRET and its corresponding donor in the left and right channels, respectively. Scale bars, 1 μm. Trajectories for the acceptor and donor are shown as red and green lines in the image sequence. Right, fluorescence intensity time traces were generated, and FRET was calculated for each smFRET trajectory. The time traces correspond to the image sequence and smFRET trajectory shown.
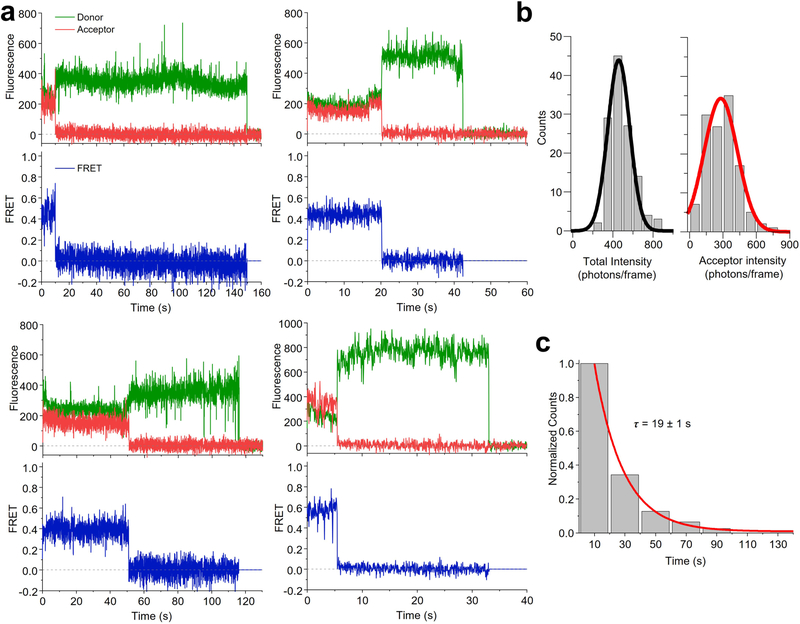
Next, we immobilized receptors in the plasma membrane by paraformaldehyde fixation, so that tracking was not necessary, and used the same imaging conditions as those for live cells (Methods). We observed single-step photobleaching for both donor and acceptor, indicative of individual molecules and anticorrelated donor and acceptor emission intensity upon acceptor photobleaching, a commonly accepted signature of smFRET (Extended Data Fig. 3a). For molecules exhibiting smFRET, at the donor laser power employed and at a frame rate of 40 ms per frame, the mean acceptor intensity was ~279 photons per frame (Extended Data Fig. 3b), and the duration of smFRET, which represents the photobleaching lifetime of acceptor fluorophores excited via FRET (sensitized acceptors) in fixed cells, was ~19 s, shorter than the donor lifetime of ~51 s (Supplementary Table 2 and Extended Data Fig. 3c).
Development of a data-processing platform for tracking smFRET in live cells.
To address the challenge of receptors diffusing within the plasma membrane of living cells, we next sought to establish robust, automated data-processing tools for detecting and tracking smFRET events, as prior efforts did not provide a generally applicable methodology or systematic analysis of large numbers of trajectories16,27–29. We developed smCellFRET, an analysis platform that integrates an established multiple-particle-tracking algorithm30 for generating large numbers of smFRET trajectories, generates fluorescence and smFRET time traces for each trajectory and includes criteria for trajectory selection, as well as tools for generating population histograms (Methods).
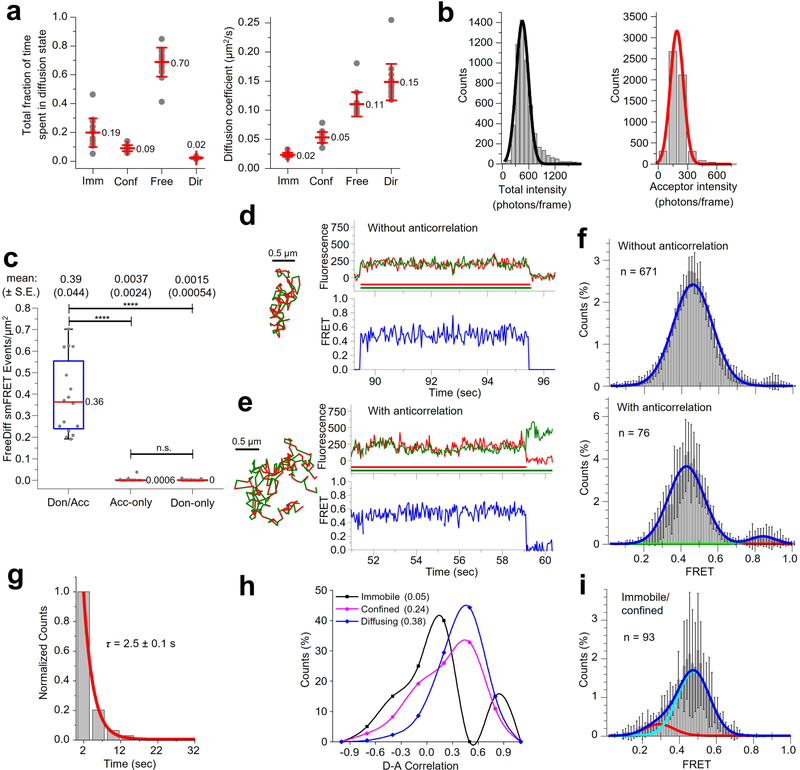
We used smCellFRET to track smFRET events from Sf-mGluR2 dimers (Methods and Supplementary Table 3), demonstrating that acceptor and donor particles can be tracked simultaneously and that fluorescence intensity and FRET efficiency time traces can be generated from the resulting smFRET trajectories (Fig. 1c and Supplementary Videos 3–5). To characterize smFRET from mGluR2, we used divide-and-conquer, moment-scaling spectrum (DC-MSS) analysis31 to classify the motion types associated with each trajectory (Methods). Because FRET from immobilized or confined receptors could result from close packing of receptors within membrane microdomains and not from their direct interaction at a dimeric interface, we focused our initial analysis on smFRET trajectories from receptors freely diffusing within the membrane, which represented ~70% of the total trajectory time (Extended Data Fig. 4a). Of note, DC-MSS requires that smFRET trajectories last at least 20 frames (800 ms at the present time resolution of 40 ms per frame) to differentiate free from confined or immobile diffusion31.
The mean total fluorophore brightness observed in the context of live-cell smFRET imaging of freely diffusing single Sf-mGluR2 receptors was similar to that in the fixed-cell context (Extended Data Fig. 4b and Supplementary Table 2). We analyzed these data with a simple selection filter based on total fluorescence intensity, referred to as freely diffusing-trajectory (FDT) analysis (Methods). In cells containing donor-only or acceptor-only Sf-mGluR2 at similar labeling densities (Extended Data Fig. 2b), the background noise represented only ~1% of the total FRET events identified for donor- and acceptor-labeled Sf-mGluR2 (Extended Data Fig. 4c). We therefore conclude that the molecules comprising the smFRET distributions from donor- and acceptor-labeled Sf-mGluR2 are almost exclusively bona-fide dimers representing the unliganded Sf-mGluR2 receptor. Although the preponderance of individual smFRET traces showed simultaneous loss of acceptor and donor (Extended Data Fig. 4d), approximately 10% of the diffusing Sf-mGluR2 showed anticorrelated donor and acceptor emission upon acceptor photobleaching (Extended Data Fig. 4e). FRET efficiency histograms comprised of both subpopulations were indistinguishable, with the same predominant FRET state of ~0.46 (Extended Data Fig. 4f). Notably, the mean duration of the smFRET trajectories was ~3 s (Extended Data Fig. 4g), approximately 6-fold shorter than that in fixed cells (Supplementary Table 2). The donor lifetime in diffusing trajectories was also ~3 s (Supplementary Table 2). We conclude from these findings that the lifetime of diffusing smFRET trajectories in living cells is limited not by acceptor or donor fluorophore photobleaching but rather by issues related to tracking single molecules in the plasma membrane of live cells using TIRF microscopy (Supplementary Note 1). We also explored other labeling strategies and other experimental conditions (Supplementary Table 4 and Supplementary Note 2), but the most robust signals were observed using those described above.
Ligand-induced conformational dynamics within mGluR2 dimers.
Conformational changes within GPCRs mediate important signaling outcomes, and smFRET has proven to be a powerful approach for monitoring these changes in detergent- and lipid-reconstituted systems24,32,33. However, detecting GPCR dynamics in the native plasma membrane environment of living cells using smFRET has yet to be reported. The predominant FRET state of ~0.46 in the apo receptor either suggests the absence of large-scale structural rearrangements between the apo amino-terminal ligand-binding domains (LBDs) or dynamics that greatly exceed the imaging time scale (approximately »25 s−1), which was reported previously for isolated LBDs34. Fluorescence correlation analysis of smFRET events for all freely diffusing molecules revealed strong positive correlation at zero lag time (Extended Data Fig. 4h), due to correlated fluctuations in both donor and acceptor fluorescence intensities, which we principally attribute to variances in fluorophore excitation efficiencies as the molecules freely diffuse within the cell membrane, altering their position with respect to the evanescent field (Supplementary Note 1). Consistent with this interpretation, we observed lower positive and near-zero correlation values for confined and immobile segments of the same smFRET trajectories, respectively (Extended Data Fig. 4h), while the overall FRET states were very similar to those for diffusing segments (Extended Data Fig. 4i and Supplementary Note 3).
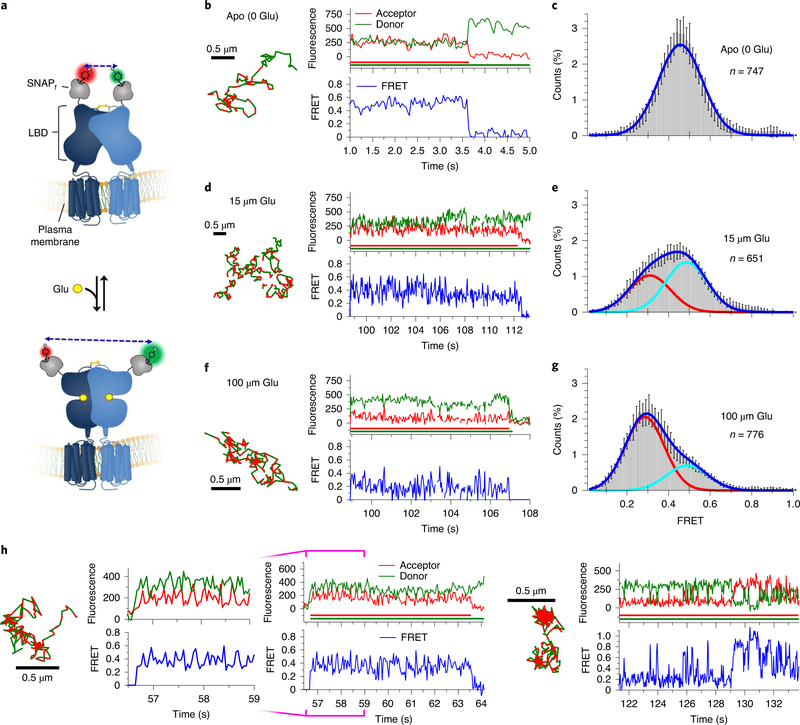
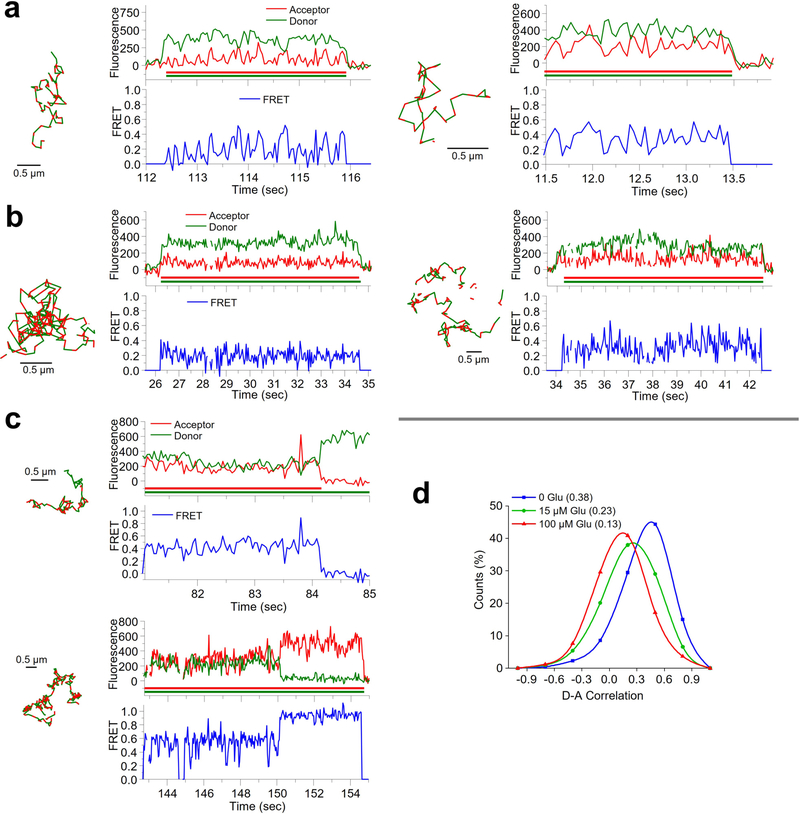
We next used glutamate to generate agonist-induced conformational changes between LBDs associated with mGluR2 activation (Fig. 2a and Methods). As described above, in the absence of glutamate, smFRET trajectories exhibited a predominant FRET state of ~0.46 (Fig. 2b,c and Extended Data Fig. 4d,e). At subsaturating glutamate concentrations (15 μM) approximating the reported half-maximal effective concentration (~6 μM)24, we observed a broadening of the FRET histogram and a shift toward lower FRET values (Fig. 2d,e and Extended Data Fig. 5a). At 100 μM glutamate, we observed a more complete shift to a predominantly lower FRET state with mean value of ~0.29 (Fig. 2f,g and Extended Data Fig. 5b). Application of a simple two-state model to these data revealed the existence of at least two FRET states within the population, consistent with previous studies of mGluR2 dynamics3,24,34.
Fig. 2 |. Agonist-induced conformational dynamics in Sf-mGluR2 dimers.
a, Schematic depicting the structural reorganization of the LBD of mGluR2 upon glutamate (Glu) binding. Representative smFRET trajectories and their corresponding fluorescence and FRET time traces for receptor in the absence (apo) (b) or in the presence of 15 μM (d) or 100 μM (f) glutamate. The smFRET trajectories for each molecule are shown to the left of their fluorescence (donor and acceptor trajectories and intensities are shown in green and red, respectively) and FRET traces (in blue). The green and red bars along the time axis in the fluorescence time trace plots indicate that the signal was derived during tracking. FRET efficiency histograms of freely diffusing smFRET trajectories for molecules in the apo state (c) or in the presence of 15 μM (e) or 100 μM (g) glutamate. Histograms comprising the number of trajectories (n) shown from six cells for each condition were fit with a single Gaussian model for apo receptor, while those for glutamate-treated receptor were best fit with a two-state Gaussian model. Each bar height represents the mean count of FRET values calculated from six cell samples. The length of the error bars corresponds to 1 s.d. from the mean. h, Representative smFRET trajectories and their corresponding fluorescence and FRET time traces for receptors that show dynamics within the LBD. The trace to the left, at 100 μM glutamate, shows transitions between the ~0.29 and ~0.49 state. The trace on the right shows transitions between several states, including the ~0.84 state.
Notably, we observed direct, albeit rare, anticorrelated changes in donor and acceptor fluorescence intensity between discrete fluorescence levels associated with FRET transitions between the FRET states of ~0.29 and ~0.49 (Fig. 2h), indicative of conformational changes within the LBDs. Rare transitions were also observed to a FRET state of ~0.84 (Fig. 2h and Extended Data Fig. 5c), consistent with previous reports of a minor population of high-FRET state conformations in isolated mGluR2 LBD dimers34.
We hypothesized that the observed multimodal FRET efficiency distribution arose from dynamic exchange between distinct FRET states, which increase in the presence of glutamate (Fig. 2e,g), in which the present video frame rate (25 s−1) largely masked rapid LBD dynamics. Consistent with this interpretation, fluorescence correlation analysis of freely diffusing segments of smFRET trajectories, shown to be strongly positive in the apo state as discussed above, revealed substantially less positive correlation in the presence of glutamate (Extended Data Fig. 5d and Methods). This observation is consistent with a dynamic sampling of distinct FRET states contributing negative correlation to the average value evidenced for each trace.
Characterizing smFRET for monomer controls and prototypical class A and B GPCRs.
While MOR proteins were widely reported to exist as homomers and heteromers35, a recent study concluded that they are monomeric36. Likewise, most studies report that SecR exists as a homodimer formed before insertion into the plasma membrane37. However, a recent study suggested that SecR exists in a density-dependent equilibrium between monomers, dimers and oligomers38. Therefore, we applied our smFRET approach to shed light on the potential homodimerization of these receptors in living cells. As controls, we chose the single-pass TM domain of the low-density lipoprotein receptor (TM-LDL) as well as the 7TM domain of mGluR2 lacking its amino- and carboxy-terminal domains (Δ2Δ), which were both reported to be monomeric in cellular membranes28,39.
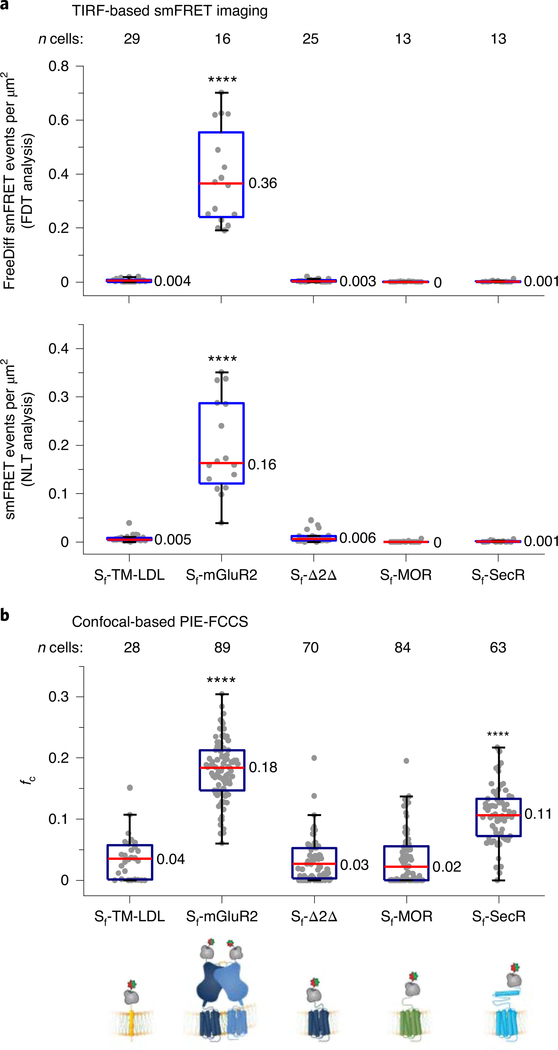
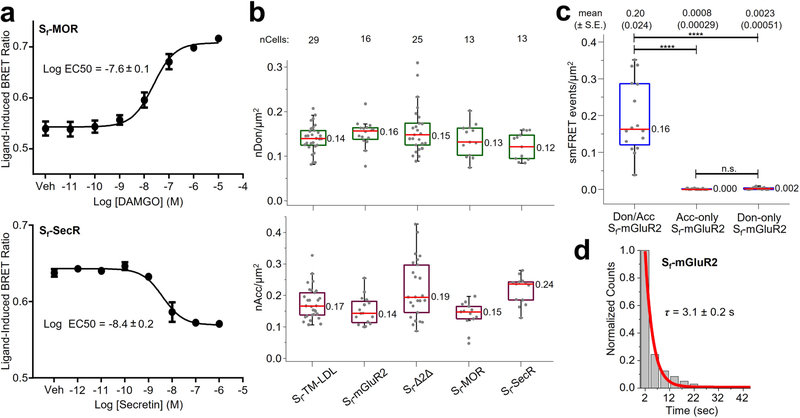
CHO cells stably expressing amino-terminally tagged Sf-TM-LDL, Sf-Δ2Δ, Sf-MOR and Sf-SecR were labeled and imaged as described for Sf-mGluR2 (Methods). Sf-MOR and Sf-SecR were functional (Extended Data Fig. 6a). The median surface density of labeled molecules per cell was similar to that for Sf-mGluR2, ranging from 0.28 to 0.36 molecules per μm2 (Extended Data Fig. 6b and Methods). Interactions between protomers were assessed by the total number of freely diffusing smFRET events per cell area, for which the number of events was determined by FDT analysis (Methods). As expected, Sf-mGluR2 showed numerous smFRET events, while Sf-TM-LDL and Sf-Δ2Δ showed virtually no smFRET events (Fig. 3a). SmFRET events for Sf-MOR and Sf-SecR were indistinguishable from those of the monomer controls (Fig. 3a, top), demonstrating that they did not form long-lived dimers at low surface densities.
Fig. 3 |. Comparing the dimerization of select TM proteins by TIRF-based smFRET imaging and confocal-based PIE-FCCS.
a, Distributions of smFRET events per cell area for Sf-TM-LDL, Sf-mGluR2, Sf-Δ2Δ, Sf-MOR and Sf-SecR. The smFRET events represent either the total number of freely diffusing (FreeDiff) smFRET trajectories (including freely diffusing segments from smFRET trajectories with more than one diffusion state) determined by FDT analysis (top) or the total number of smFRET trajectories determined by NLT analysis (bottom). Dots represent smFRET events per area for each cell. Box plots indicate the median (value shown as the central line) and interquartile range (lower and upper lines represent the 25th and 75th percentiles, respectively), while the whiskers represent the points that fall within 1.5 × interquartile range. Sf-mGluR2 showed a significant difference compared to each of the other samples (****P < 0.0001, both plots), while Sf-TM-LDL, Sf-Δ2Δ, Sf-MOR and Sf-SecR showed no significant differences (P ≥ 0.999, top; P ≥ 0.964, bottom) (degrees of freedom (DF) (both plots) = 95; F (top plot) = 97.0; F (bottom plot) = 74.1). One-way ANOVA and Tukey’s post hoc comparison were performed to obtain P values. b, Distribution of fc, determined by PIE-FCCS for each construct from the same cell lines used for smFRET above after induction to increase expression. Box plot details are described in the legend for a. Sf-mGluR2 and Sf-SecR showed a significant difference compared to all other samples (****P < 0.0001), while no significant differences were present between Sf-TM-LDL, Sf-Δ2Δ and Sf-MOR (P ≥ 0.977) (DF = 333; F = 170.5). One-way ANOVA and Tukey’s post hoc comparison were performed to obtain P values.
SmFRET trajectories shorter than 20 frames cannot be assigned diffusion states and are excluded by the FDT analysis. To include more transient interactions, we developed a second trajectory-selection procedure, referred to as non-limited-lifetime trajectory (NLT) analysis (Supplementary Table 5 and Methods), for selecting smFRET trajectories not classified by motion type that last at least two frames (80 ms), in which the minimum track length was defined by our tracking constants and our current temporal resolution (40 ms) (Supplementary Note 4). By applying this procedure, we found that background noise from donor- and acceptor-only-labeled Sf-mGluR2 represented less than 2% of the total FRET events identified for donor- and acceptor-labeled Sf-mGluR2 (Extended Data Fig. 6c). The mean smFRET lifetime for Sf-mGluR2 from trajectories selected by the NLT criteria was ~3 s (Extended Data Fig. 6d), the same as that from the FDT analysis. Using this approach, we also determined the number of smFRET events for the samples described earlier (Fig. 3a, bottom), and, despite allowing the inclusion of much shorter interactions, the results were qualitatively indistinguishable from those determined by FDT analysis (Fig. 3a, top), with significant numbers of smFRET events observed only for Sf-mGluR2. These findings suggest that the controls, as well as Sf-MOR and Sf-SecR, are monomeric in the present cellular context.
Evaluating receptor dimerization at high receptor densities using PIE-FCCS.
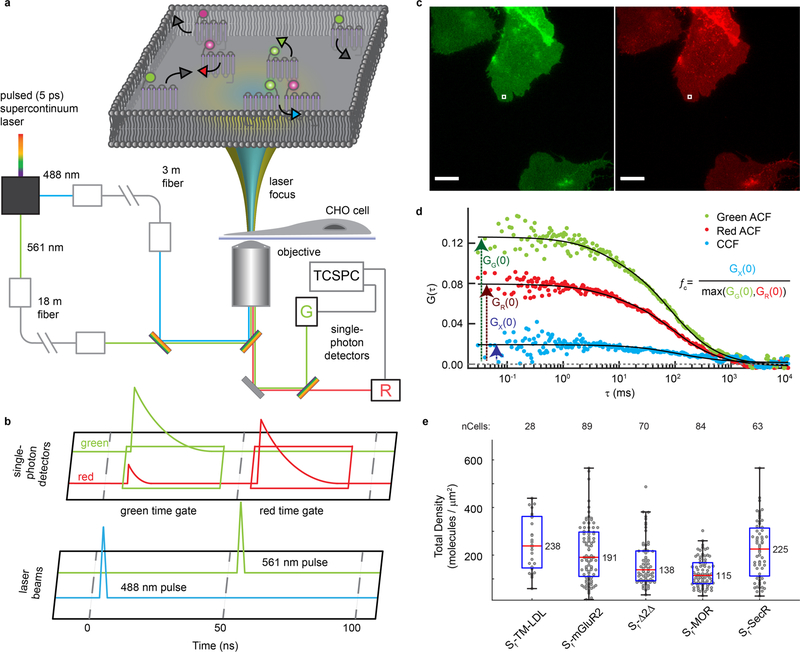
Rationalizing that the low receptor densities required for SPT may be insufficient to promote the formation of a substantial population of transient dimers, we examined whether receptor interactions were detectable at higher expression levels using pulsed-interleaved excitation fluorescence cross-correlation spectroscopy (PIE-FCCS)40 (Extended Data Fig. 7a–d), a confocal-based technique that quantifies interactions between TM proteins, including GPCRs41,42, that codiffuse as dimers for at least 80 ms (the median diffusion time within the confocal volume). While PIE-FCCS does not rely on energy transfer and cannot establish how long receptors interact, it can be used at receptor densities up to ~1,000-fold higher (10–1,000 molecules per μm2) than those compatible with SPT6,9,10, allowing us to probe whether the receptors might interact at higher densities. Notably, PIE-FCCS only detects receptors diffusing through the confocal excitation volume, thereby excluding immobilized receptors that are more challenging to interpret.
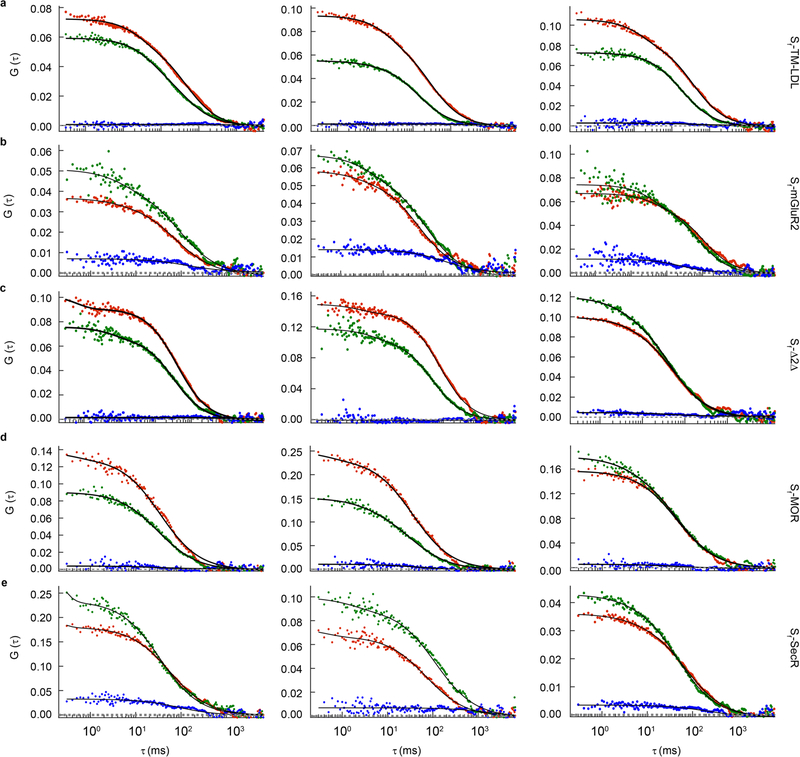
To increase surface expression levels for PIE-FCCS, the CHO cells we used for smFRET were induced with tetracycline and labeled (Extended Data Fig. 7c and Methods). The median surface density for each sample ranged between 120 and 240 molecules per μm2 (Extended Data Fig. 7e). Dimerization was quantified by calculating the fraction of correlated receptors (fc) (Extended Data Figs. 7d and 8, Supplementary Table 6 and Methods). For Sf-mGluR2, fc was ~0.18, consistent with stable TM protein dimers43 (Fig. 3b). Sf-TM-LDL, Sf-Δ2Δ and Sf-MOR had fc values near zero, in agreement with the conclusion that these proteins are monomeric, even at surface densities ~500-fold higher than those used for smFRET. Interestingly, whereas smFRET showed that Sf-SecR is monomeric at low surface densities, PIE-FCCS revealed a relatively high fc distribution, indicating that SecR forms dimers at high surface densities, consistent with ensemble studies at similar expression levels37,38.
Tracking receptor complexes by smFRET at high expression levels.
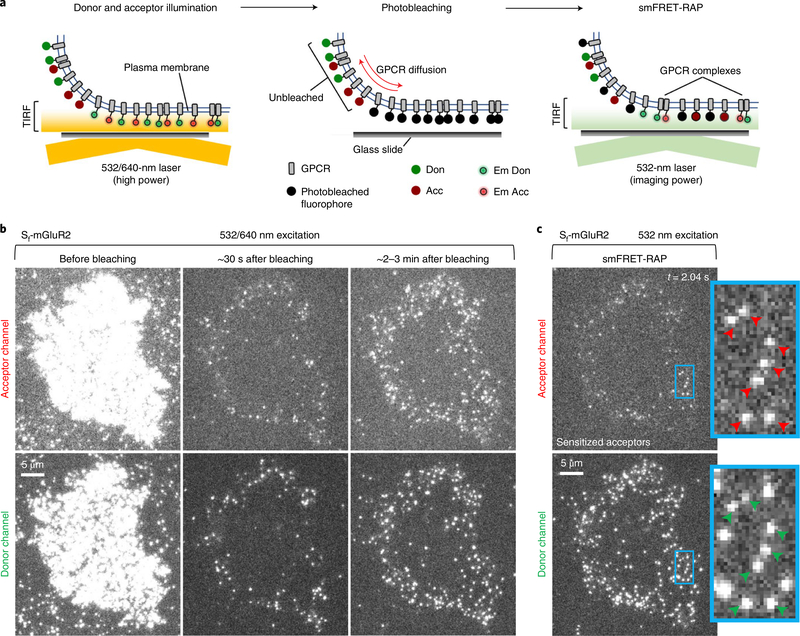
Based on our PIE-FCCS results above, smFRET should be evident within SecR dimers at high expression levels if the proximity between the fluorophores is sufficiently close for FRET to occur and if the density of active fluorescent probes within a select plasma membrane region could be sufficiently reduced by photobleaching44,45. FRAP in TIRF mode combined with single-molecule imaging46,47 has been used to enable SPT at high expression levels. Inspired by these methods, we combined smFRET and FRAP, termed smFRET recovery after photobleaching (smFRET-RAP), to track receptor complexes at higher expression levels that might support dimer formation (Fig. 4a).
Fig. 4 |. Summary of the smFRET-RAP method and representative Sf-mGluR2 data.
a, Schematic of the smFRET-RAP approach. Active donor- and acceptor-labeled receptors in the TIRF-illumination field are selectively photobleached in TIRF mode, producing an analysis region within the plasma membrane defined by the TIRF field. Unbleached acceptor- and donor-labeled receptors subsequently diffuse from the apical membrane outside the TIRF field into the analysis region, so that single molecules can be resolved and imaged under normal single-molecule TIRF imaging conditions. Em Don, emitting donor; Em Acc, emitting acceptor. b, TIRF images taken briefly by direct and simultaneous donor and acceptor excitation of a representative CHO cell from eight cells expressing labeled Sf-mGluR2 before donor and acceptor photobleaching (left), ~30 s after photobleaching (middle) and ~2–3 min after photobleaching (right), showing the recovery of labeled receptors (scale bar, 5 μm). c, SmFRET-RAP image of the cell shown in b, taken by donor excitation, showing sensitized acceptors and associated donors, depicted by red and green arrows, respectively. Scale bar, 5 μm; inset, higher magnification (3.7 μm × 6.7 μm).
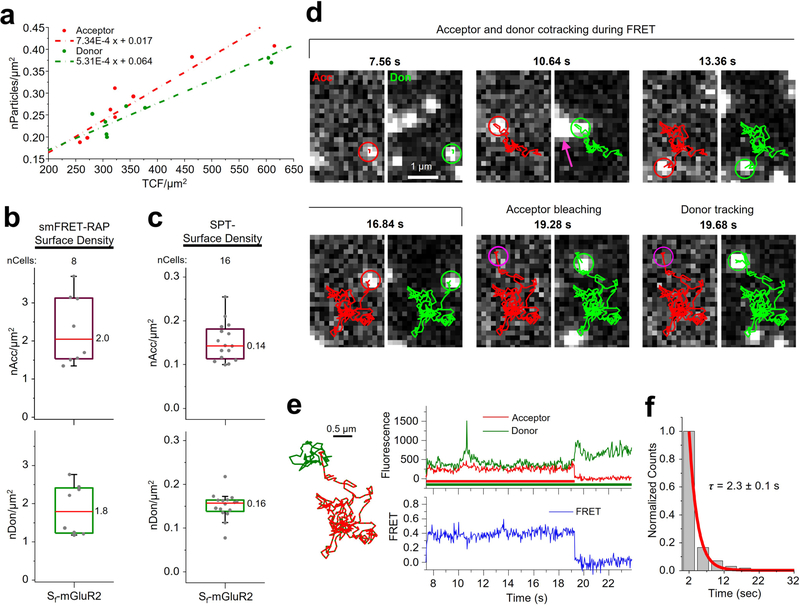
To validate the smFRET-RAP approach, we first used CHO cells expressing Sf-mGluR2, induced to increase expression, prepared as described for smFRET imaging (Methods). Before bleaching, individual molecules could not be resolved (Fig. 4b, left). After ~8 min of high-power TIRF illumination with both lasers (Methods), most labeled receptors within the illumination field were photobleached (Fig. 4b, middle). During recovery, receptors progressively appeared at the cell edge but not in the central area (Fig. 4b, right), indicating that most receptors recovered by diffusion from the unbleached apical membrane and not by insertion from the cytoplasm. Because individual receptors were resolved when imaged after recovery (Fig. 4b, right), we correlated the number of particles to the total background-corrected fluorescence (TCF) for each cell to estimate the receptor density before photobleaching (Extended Data Fig. 9a and Methods). The median surface density before photobleaching was approximately 4 receptors per μm2, with a donor-to-acceptor labeling ratio of ~1:1 (Extended Data Fig. 9b), ~13-fold higher than those used for smFRET at low densities (Extended Data Fig. 9c). We limited analysis of Sf-mGluR2 to these intermediate densities, because, at higher expression levels, the density of smFRET after recovery was too high for reliable detection and tracking.
Sf-mGluR2 imaged using smFRET-RAP exhibited smFRET consistent with the diffusion of receptor complexes into the illumination field after recovery (Fig. 4c). SmFRET trajectories generated by NLT criteria were consistent with those derived from smFRET at low expression levels (Extended Data Fig. 9d,e). The mean smFRET lifetime from distributions of acceptor trajectories during FRET was ~2.3 s (Extended Data Fig. 9f), slightly shorter than that measured under low expression conditions. We attribute this diminished lifetime to the fact that the majority of molecules were near the cell edge, where they were more likely to diffuse in and out of the TIRF field during measurement.
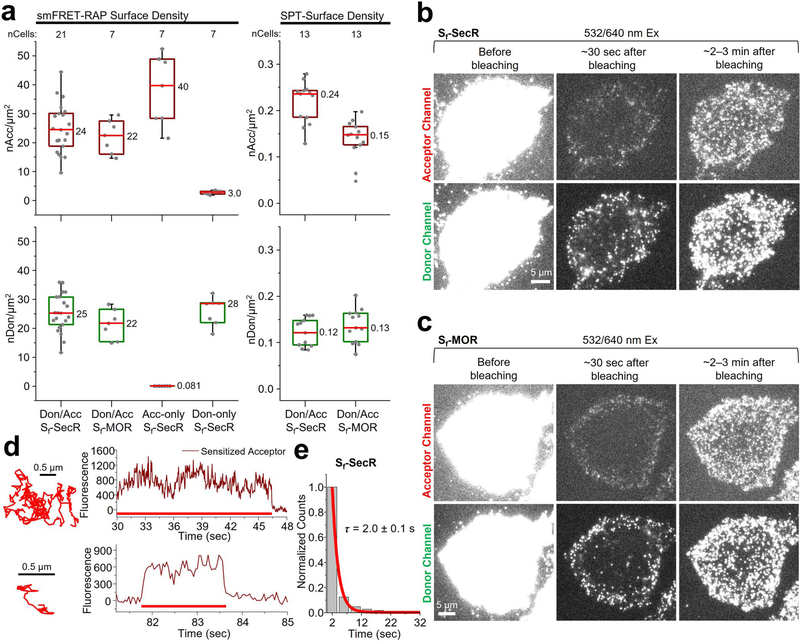
We next applied smFRET-RAP to Sf-SecR and Sf-MOR, with induction conditions chosen to achieve surface densities closer to those used for PIE-FCCS (Methods). The median surface densities of labeled Sf-SecR and Sf-MOR before photobleaching were 49 and 44 receptors per μm2, respectively; for both samples, the donor-to-acceptor labeling ratio was ~1:1 (Extended Data Fig. 10a). These densities are >100-fold higher than those used for smFRET and only about 3- to 6-fold lower than those used for PIE-FCCS (Extended Data Fig. 7e). Images taken after photobleaching revealed a similar recovery profile as that described for mGluR2 (Extended Data Fig. 10b,c).
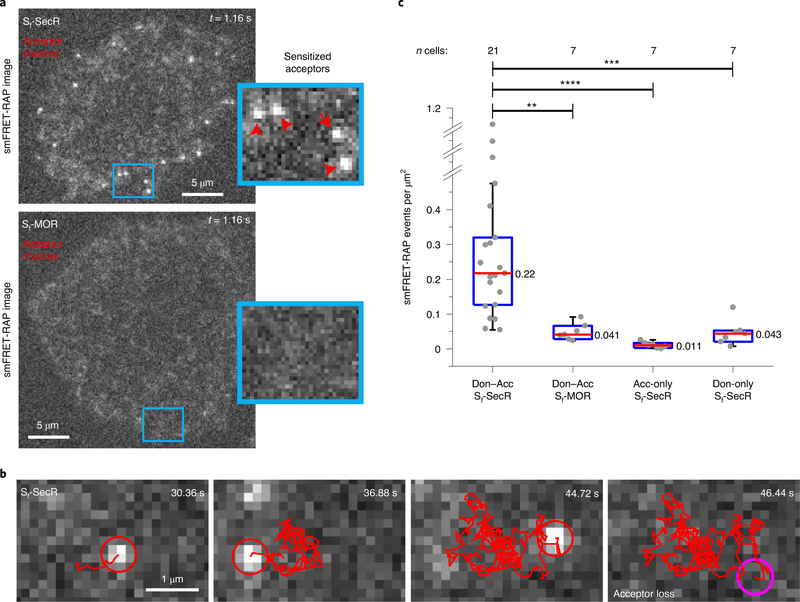
Although we could not detect directly excited individual donor and acceptor fluorophores after recovery from bleaching at the higher surface densities used for Sf-SecR and Sf-MOR, we were nonetheless able to track sensitized acceptors and select trajectories using the NLT criteria (Methods). Sf-SecR exhibited a significantly higher number of sensitized acceptor events compared to those of Sf-MOR (Fig. 5, Extended Data Fig. 10d and Supplementary Videos 6 and 7), consistent with our PIE-FCCS results showing that Sf-SecR forms complexes at higher expression levels. Here, we observed a mean sensitized acceptor lifetime of ~2 s for Sf-SecR (Extended Data Fig. 10e). Donor-only or acceptor-only Sf-SecR at similar expression levels (Extended Data Fig. 10a) showed few or no sensitized acceptor events, comparable to Sf-MOR (Fig. 5c and Methods), confirming that the sensitized acceptor events observed for Sf-SecR arise via FRET and not from other photophysical phenomena and that MOR does not dimerize, even at high expression levels. These findings collectively suggest that Sf-SecR, although monomeric at low receptor levels, does interact at high receptor densities, with individual protomers remaining assembled as complexes for at least as long as can be measured by our approach (approximately 2–3 s).
Fig. 5 |. Summary of smFRET-RAP data for Sf-SecR and Sf-MOR.
a, Representative smFRET-RAP image of acceptors during FRET (sensitized acceptors) for a CHO cell expressing donor- and acceptor-labeled Sf-SecR (top) from 21 cells or Sf-MOR (bottom) from 7 cells. Scale bar, 5 μm; insets, higher magnification (4.8 μm × 3.8 μm). b, Sensitized acceptor image sequence during FRET with a corresponding trajectory (red line) for Sf-SecR. c, Distribution of smFRET-RAP events per cell area for donor- and acceptor (Don–Acc)-labeled Sf-SecR and Sf-MOR, as well as for acceptor-only- and donor-only-labeled Sf-SecR. Dots represent the total number of smFRET-RAP trajectories determined by NLT analysis per area for an individual cell. Box plot details are described in the legend of Fig. 3a. Donor- and acceptor-labeled Sf-SecR showed a significant difference compared to all of the other samples shown (****P = 7.02 × 10⁻⁵, DF = 20.1, t-statistic = 4.98; ***P = 3.01 × 10⁻⁴, DF = 22.0, t-statistic = 4.29; **P = 3.16 × 10⁻⁴, DF = 20.9, t-statistic = 4.31). Unpaired two-sided t-tests were performed to obtain P values.
Discussion
SmFRET is a powerful approach for studying dimerization and conformational dynamics of purified detergent- or lipid-reconstituted GPCRs24,32,33 as well as other TM proteins48. However, smFRET investigations of TM proteins in live-cell contexts have rarely been reported, due to the numerous methodological challenges documented within the field14,15. Here, we developed general strategies that overcome limitations for expressing, labeling and tracking TM proteins by smFRET at varying expression levels.
While ensemble resonance energy transfer-based techniques have been used extensively to study receptors dimers in cells, the presence of indirect interactions and the time-averaged ensemble nature of the measurements greatly complicate the interpretation of these assays7. The sources of resonance energy transfer from indirect interactions include receptors positioned close to each other by random diffusion and/or from those packed within microdomains. In an smFRET context, in which ensemble averaging is eliminated, one can distinguish between receptors confined within microdomains, where receptor interactions might simply result from crowding, and freely diffusing smFRET trajectories that can be more clearly interpreted as true physical association between protomers.
Using smFRET, we show that mGluR2 forms stable dimers at all receptor densities explored, whereas SecR must be present at a surface density high enough to establish relatively long-lived interactions. By contrast, we conclude from our findings that MOR is monomeric, regardless of surface density, suggesting a minimal propensity to interact. It is difficult to estimate endogenous densities of receptors in brain or other tissues, as binding measurements typically discount microdomain architecture and may thus underestimate actual concentrations, for example, in a dendritic spine7. Nevertheless, our findings indicate that the dimerization propensity of some GPCRs may greatly depend on local concentration and thus differ across tissues and microdomains.
At the current imaging frame rate, we can detect interactions as short as 80 ms, using NLT analysis enabled by the robust brightness and photon budget provided by the dyes we employ, and up to ~3 s, limited by the loss of receptor tracking (Supplementary Note 1). Thus, if MOR forms transient dimers or higher-order oligomers, such species must occur for durations substantially shorter than 80 ms.
Access to more transient regimes may be achieved by performing experiments using microscope systems that enable higher illumination intensities and faster imaging frame rates22,49, coupled with further advances in self-healing fluorophore photochemistry21,22. Such advances should also improve detection of conformational dynamics within stable dimers and even within individual appropriately labeled TM proteins. At the low expression levels suitable for SPT and smFRET, transient interactions between receptor protomers will remain infrequent. At higher expression levels, if transient complexes do form, the limited interaction lifetime would make it difficult to observe interactions by smFRET-RAP, which requires that complexes interact long enough to diffuse into the observation area. More focused and rapid photobleaching, however, may dramatically shorten the post-bleaching recovery time, such that advances in imaging temporal resolution will allow identification of much shorter interactions.
Whether other class A receptors, unlike MOR, form productive, relatively long-lasting interactions at higher surface densities must be determined empirically. The methods presented for tracking smFRET in living cells have the versatility to identify constitutive dimers, density-dependent dimers and monomers, as well as the temporal and spatial resolution needed to finally resolve much of the controversy surrounding GPCR dimerization. These methods, including those that employ self-labeling tags or alternative labeling approaches, can also be applied to the interactions of any TM protein, providing new insights into their dynamic interactions in living cells.
Online content
Any methods, additional references, Nature Research reporting summaries, source data, extended data, supplementary information, acknowledgements, peer review information; details of author contributions and competing interests; and statements of data and code availability are available at https://doi.org/10.1038/s41592-021-01081-y.
Methods
Organic fluorophores.
LD555p-benzylguanine (BG) and LD655-BG were prepared from LD555p-NHS and LD655-NHS (Lumidyne Technologies) as previously described50. The chloroalkane (CA) conjugates LD555p-CA and LD655-CA were generated from NHS parent dyes following standard procedures51. SNAP-Surface Alexa Fluor 647 (AF647-BG), SNAP-Surface 549 (DY549P1-BG) and SNAP-Surface 488 (ATTO488-BG) were purchased from New England Biolabs.
Bulk photophysical measurements of LD fluorophore–SNAPf conjugates.
The SNAPf domain of a purified SNAPf–CLIPf conjugate protein was labeled with LD555p-BG and LD655-BG (Supplementary Note 5), and steady-state absorption and fluorescence measurements of the resulting conjugates were carried out using Shimadzu UV-2600 and FluoTime 300 spectrometers, respectively. Absolute fluorescence quantum yields of the constructs were measured in a FluoTime 300 spectrometer using integrating sphere accessories and a 300-W xenon excitation lamp (PicoQuant). For the quantum yield measurements, LD555p and LD655 were photoexcited at 517 and 610 nm, respectively, and the absorbance of the samples at the excitation wavelength was kept low (0.01–0.02) to minimize reabsorption of emitted photons. Steady-state fluorescence anisotropy values of the samples were recorded in a FluoTime 300 spectrometer using a 300-W xenon lamp. LD555p and LD655 were photoexcited at 517 and 610 nm, and the average anisotropies were calculated in the emission ranges of 550–650 nm and 650−700 nm, respectively. Time-correlated single-photon counting measurements were carried out to determine fluorescence lifetimes. LD555p and LD655 were photoexcited with a pulsed laser at 532 and 640 nm (PicoQuant), respectively, and fluorescence was collected at emission wavelengths of 575 and 675 nm, respectively. The fluorescence decay data were analyzed with EasyTau 2 software (PicoQuant). The instrument response function required for the lifetime measurements was calculated using LUDOX AS-40 colloidal silica as a scatterer. All of the measurements were carried out in PBS, pH 7.4, containing 1 mM DTT at room temperature, using standard quartz cuvettes with a path length of 1 cm (Starna Cells).
Cell culture.
All CHO lines were maintained in Ham’s F12 medium (Corning), 10% FBS (Corning), 2 mM l-glutamine (Corning) and 1% penicillin–streptomycin at 37 °C in 5% CO2. For LEx-Flp-In T-REx (FITR) CHO cells, the medium contained 15 μg ml−1 blasticidin (InvivoGen) and 50 μg ml−1 zeocin (Invitrogen). For stable LEx-FITR CHO lines, the medium contained 500 μg ml−1 hygromycin (Thermo Fisher Scientific) and 15 μg ml−1 blasticidin. All CHO lines were grown to ~70% confluency in six-well tissue culture dishes before transfection, tetracycline (MilliporeSigma) induction and/or labeling for microscopy or PIE-FCCS. All cell lines used in this study tested negative for mycoplasma contamination. CHO-K1 cells, the parent line of our CHO cells used in this study, do not natively express mGluR2, MOR or SecR, based on an online database of CHO RNA-seq data52.
Generation of stable CHO cell lines.
To generate stable CHO cell lines expressing Sf-mGluR2, Halo-mGluR2, Sf-TM-LDL, Sf-Δ2Δ, Sf-MOR and Sf-SecR, we used a previously described FITR CHO line containing an FRT recombination target site53 in the CHO genome that confers low expression levels and that also allows for tetracycline-inducible expression, referred to as LEx-FITR cells (Extended Data Fig. 1c)21. Stable integration of the pcDNA5/FRT/TO-IRES vectors (Supplementary Note 6) encoding the TM proteins described above was achieved by cotransfecting 200 ng of each vector with 1,800 ng of the pOG44 Flp-In Recombinase vector (Invitrogen) using Lipofectamine LTX according to the manufacturer’s protocol and selecting for cells with 500 μg ml−1 hygromycin (Thermo Fisher Scientific) in the presence of 15 μg ml−1 blasticidin. The plasmids coding for Sf-mGluR2, Sf-MOR and Sf-SecR were used in bioluminescence resonance energy transfer (BRET)-based cAMP inhibition or generation assays to show receptor functionality (Supplementary Note 6).
Sample preparation for TIRF microscopy and smFRET imaging.
LEx-FITR CHO stable lines were induced with tetracycline (100 ng ml−1 for cells expressing Sf-mGluR2 and Halo-mGluR2; 200 ng ml−1 for cells expressing Sf-Δ2Δ, Sf-MOR and Sf-SecR; 230 ng ml−1 for cells expressing Sf-TM-LDL) 18–24 h before labeling and imaging. The cells expressing SNAPf TM proteins were labeled with a mix of donor (333 nM) and acceptor (666 nM) fluorophores, and the Halo-mGluR2-expressing cells were labeled with 666 nM LD555p-CA and 333 nM LD655-CA using procedures described previously21. The R0 value for the LD555p–LD655 FRET pair was estimated to be 63.5 Å using the absorbance and emission spectra of the two fluorophores attached to SNAPf, with a refractive index of 1.333, a κ2 value of two-thirds and a donor quantum yield of 0.47. Donor-only and acceptor-only controls were labeled with either 333 nM LD555p-BG or 666 nM LD655-BG, respectively. For imaging using the TIRF objective with a numerical aperture (NA) of 1.70, labeled cells were seeded on fibronectin-coated (0.1 μg μl−1, Sigma Aldrich) high-index glass coverslips (HIGHINDEX-CG, Olympus) and incubated in FluoroBrite DMEM medium (Thermo Fisher Scientific) for 1.5 h at 37 °C in 5% CO2. Coverslips were cleaned before use by sonication with the following steps: 20 min in 10% Alconox (Sigma Aldrich), 10 min in deionized water, twice for 40 min in 1 M potassium hydroxide and 20 min in deionized water. The chemically cleaned coverslips were subsequently cleaned under argon plasma for 5 min before being coated with fibronectin. For imaging using the 1.49-NA TIRF objective, labeled Sf-mGluR2-expressing cells were prepared as described previously21.
Immediately before imaging, coverslips with seeded cells were washed with excess DPBS and assembled into a microscopy chamber54. Fixed samples were prepared and labeled as described above but instead were treated with a 5% paraformaldehyde solution overnight at 4 °C. Fixed and live cells were imaged in reduced oxygen conditions (~50% depleted) at 23 °C as previously described21 or in ambient oxygen conditions at 37 °C when indicated. For agonist activation, imaging buffer containing 15 or 100 μM glutamate (MilliporeSigma) was added to Sf-mGluR2-expressing cells ~30 min before imaging.
TIRF microscopy and smFRET imaging.
Image sequences were measured at a time resolution of 40 ms using a customized and previously described objective-based TIRF microscope54 equipped with 100× oil-immersion 1.70-NA (APON100×HOTIRF, NA 1.70, Olympus) and 1.49-NA (UAPON100×OTIRF, NA 1.49, Olympus) objectives, 532-nm (Torus 150 mW, Laser Quantum) and 640-nm (Cell Laser 100 mW, Olympus) lasers and an EMCCD camera (Evolve 512, Photometrics). An evanescent TIRF field with an approximate penetration depth of ~100 nm was used to excite labeled proteins at the proximal plasma membrane. Fluorescence emission was separated from the excitation light using a dual-band laser filter set (ZT523/640rpc, ZET532/640m, ZET532/640x, Chroma) in combination with an emission side image splitter (OptoSplit 2, Cairn) equipped with a FRET filter set (ZT640rdc, ET585/65m, ET655lp, Chroma) to spatially separate and project donor and acceptor emission signals side by side onto a single EMCCD camera (Supplementary Fig. 1). The dual-band TIRF–FRET filter configuration allows for the excitation of donor and acceptor fluorophores separately or simultaneously.
Before smFRET imaging, cells were briefly excited with both 532-nm (~100 mW) and 640-nm (50 mW) laser lines to generate an initial image for quantifying the density of donor- and acceptor-labeled TM proteins (see section below). SmFRET imaging was then performed by exciting the same cells with only the 532-nm laser (~100 mW) and acquiring 4,000 frames per movie in both donor and acceptor channels.
Determination of surface density by single-particle detection.
The surface density of labeled molecules was determined from an initial image of cells taken from direct and simultaneous excitation before smFRET imaging. The number of donors and acceptors within a region of interest for each cell was determined by the DoG particle-detection function of TrackMate in ImageJ (Extended Data Fig. 2a)55,56. The cell surface area and region of interest was determined by boundary tracing on the projected image, generated from the donor image stack using the ImageJ plugin ZProject with projection type ‘Standard Deviation’56.
Analysis of smFRET data in fixed cells.
SmFRET images acquired from paraformaldehyde-fixed cells were processed using Single-molecule Platform for Automated, Real-Time ANalysis (SPARTAN, version 3.7.0) software49. After extracting fluorescence time traces from the movie files, traces with total fluorescence intensity values above 100 photons per frame and single photobleaching steps for both donor and acceptor fluorophores were selected for further analysis. The lifetime was determined by idealizing all FRET time traces to a two-state kinetic model using a segmental k-means optimization method57. Dwell-time distributions were fit to a single-exponential function using the Levenberg–Marquardt algorithm.
smCellFRET platform for tracking smFRET in living cells.
The smCellFRET platform was written and developed using MATLAB (MathWorks). Individual TM proteins labeled with fluorophore(s) were tracked in both the acceptor and donor emission channel using u-track, a multiple-particle-tracking software described in detail previously30. The u-track parameters were optimized by first tracking an Sf-mGluR2 dataset with initial parameter estimates for spot detection and frame-to-frame linking, and then the procedure was repeated again with slightly tuned parameters. The results for each iteration were compared by calculating difference maps, and then the tracking parameters were adjusted further. This parameter tuning scheme was repeated until the tracking accuracy was optimized for both the acceptor and donor (Supplementary Table 3). A minimum track length of two frames was required to establish a trajectory, and merging and splitting was not used (Supplementary Note 1).
To generate smFRET trajectories, we used a locally sensitive transformation function (Supplementary Note 7) mapping the acceptor position at each time point to the donor channel to identify the attenuated donor signal associated with each acceptor particle during FRET. Therefore, donor trajectories during FRET are mapped trajectories derived from those of the acceptor. By using this approach, we specifically select molecules labeled with acceptor and donor that show smFRET, for which sensitized emission from the acceptor is a signature. In addition, determining the donor position by mapping has the advantage that donor tracking is not influenced by a crowded environment or any transiently overlapping particles in the donor emission channel. After loss of acceptor signal for each particle, the mapped donor trajectory was concatenated, if possible, with the nearest matching donor trajectory within the search radius at the position of acceptor loss to give the continuation of the corresponding donor trajectory.
Acceptor and donor fluorescence intensity time traces were generated from corresponding smFRET trajectories. To determine the acceptor and donor fluorescence background intensities, baseline positions before and after each smFRET trajectory were selected, and their intensities were determined. The particle intensity Iloc for the acceptor and donor at each time point during a corresponding smFRET trajectory was computed as the total sum of pixel intensities in a rectangular 5 × 5 pixel array (800 nm × 800 nm) centered around the particle’s position at time t (equation (1)).
| (1) |
Fluorescence time traces were then generated by subtracting the baseline intensity from the acceptor and donor intensities.
Trajectory-selection criteria.
For FDT analysis, freely diffusing smFRET trajectories, as well as freely diffusing segments from smFRET trajectories with more than one diffusion state, were determined by DC-MSS31, and a simple total intensity criterion with lower and upper threshold values was applied. These values were chosen as 2 s.d. below and 3 s.d. above the mean total intensity distribution for Sf-mGluR2 under fixed conditions (Extended Data Fig. 3b).
For NLT analysis, statistical measures of trace qualities were defined (Supplementary Table 5). The local fluorescence intensity in equation (1) and its corresponding background value as described in equation (2)
| (2) |
were calculated as the sum of pixel intensities over the 5 × 5 center region of the particle and the bordering background region. To integrate over the same number of pixels in both regions, a term describing the mean background was added in equation (2). Equations (1) and (2) were then used to compute the time-averaged particle intensity in equation (3)
| (3) |
and the time-averaged background intensity in equation (4)
| (4) |
as the sum of Iloc or IBG, respectively, from track start (frame i) to track end (frame j) divided by the number of frames (nframes). The signal-to-background ratio (s) was computed using equation (5).
| (5) |
The cross-talk value (crt) in equation (6)
| (6) |
estimates the spectral bleed-through of the donor signal into the acceptor emission channel.
A matrix of scatterplots with possible combinations of two features plotted against each other was generated. Based on the observed distribution of data points, the selection criteria listed in Supplementary Table 5 were then chosen for filtering all datasets.
Intensity distribution analysis of the time-averaged total intensity Itotal described in equation (7)
| (7) |
was used to detect smFRET trajectories with low intensities. These traces were removed using a total intensity filter with a lower threshold value of 450 photons per frame (Supplementary Table 5).
Another criterion was implemented to remove immobile trajectories that reappear multiple times (multiple events) at the same location at the cell surface. The filter is characterized by parameters described in Supplementary Table 5.
FRET efficiency calculation and generation of FRET efficiency histograms.
FRET efficiency time traces were calculated according to equation (8) as described by Hellenkamp et al.13.
| (8) |
IDon and IAcc are the baseline-subtracted donor and acceptor intensities, respectively, Itotal = IDon + IAcc is the total fluorescence intensity, α is the spectral bleed-through from the donor-to-acceptor channel, δ is the fraction of acceptor direct excitation at 532 nm, and γ describes the relative detection efficiencies and quantum yields of the fluorophores. The mean correction factors of the observed distributions were determined by fitting to a single Gaussian function (Supplementary Table 7, Supplementary Fig. 2 and Supplementary Note 8), which were then used as global correction factors in the workflow to determine FRET efficiencies. These values generally agreed with theoretical values estimated from the transmission spectra of elements in the optical path and the emission spectra of the fluorophores (Extended Data Fig. 1e,f, Supplementary Fig. 1 and Supplementary Table 1). The δ factor was estimated to be 5.6% from absorbance spectra of the two fluorophores (Supplementary Fig. 2). Further details concerning the FRET calculation can be found in Supplementary Note 8.
FRET efficiency histograms were generated from the FRET times traces of freely diffusing smFRET trajectories, as well as from those of freely diffusing segments from smFRET trajectories with more than one diffusion state, after post-synchronizing each trace to the time point at which tracking began. SmFRET trajectories that overlapped in space or colocalized with other donor particles were manually excluded from histograms because the calculated FRET values from such trajectories were inappropriately influenced by the donor signal of the additional donor particle. Mean FRET values were determined by fitting the resulting histograms to either a single- or multistate Gaussian model.
Analysis of the duration of smFRET events in live cells.
The smFRET lifetime from live cells was determined from the duration of smFRET events. To most accurately reflect the lifetime of an individual particle, for the lifetime histograms of smFRET trajectories determined by FDT analysis, we only used trajectories that were freely diffusing for the entire trajectory and thus excluded trajectories that made transitions to different diffusion states. All smFRET trajectories determined by NLT analysis were included for lifetime determination. Histogram distributions with equal bin sizes were analyzed by single-exponential fitting using a Levenberg–Marquart algorithm. To control for the potential impact of using an arbitrary histogram bin size, we also used empirical cumulative acceptor distributions when noted. These cumulative distributions were fit to a single-exponential function using the trust-region-reflective least-squared algorithm.
Sample preparation for PIE-FCCS.
The LEx-FITR CHO stable lines used for smFRET imaging and described above were induced with 3.5 μg ml−1 tetracycline for 18–24 h before PIE-FCCS. For labeling, the cells were dissociated and resuspended in Ham’s F12 medium containing 2–6 μM ATTO488-BG and DY549P1-BG and incubated for 30 min to achieve a labeling ratio of ~1:1. The labeled cells were then washed with PBS three times, seeded in fibronectin-coated (0.1 μg μl−1) MatTek plates (MatTek) and incubated in Opti-MEM medium without phenol red (Gibco) for 15–30 min before imaging. All incubation steps occurred at 37 °C in 5% CO2.
PIE-FCCS measurements.
PIE-FCCS was performed on a single-cell basis using a custom-built confocal-based instrument described previously and depicted in Extended Data Fig. 7a40. MicroManager software was used for microscope control and cell imaging. The two wavelengths for alternating excitation were picked at 488 ± 6 nm and 561 ± 6 nm from a white-light fiber laser (SuperK Extreme EXW-12, NKT Photonics), delayed 50 ns with respect to each other and focused at a peripheral plasma membrane region for each live cell expressing the constructs labeled as described above. Fluorescence was detected with two single-photon avalanche diodes (Micro Photon Devices) filtered at 520/44 nm (FF01–520/44–25, Semrock) and 612/69 nm (FF01–621/69–25, Semrock). Time-tagged, time-resolved data were collected in 10-s acquisitions for 80 s per cell (Extended Data Fig. 7a–c). Data were recorded with a four-channel-routed time-correlated single-photon counting device (PicoHarp 300, PicoQuant), binned at 100 μs and analyzed as described previously40. The correlation function data were averaged and fit using a two-dimensional diffusion model with triplet blinking using the non-linear least-squares model in equation (9) (Extended Data Figs. 7d and 8).
| (9) |
F is the fraction of the triplet state, τT is the triplet-state lifetime, τD is the characteristic time for diffusion, and G(0) is the correlation function amplitude at t = 0, which is inverse to the average population of diffusing species. The degree of cross-correlation is quantified as the fraction correlated, fc, which is the ratio of the cross-correlation amplitude, GX(0) and the autocorrelation amplitude (GR(0) or GG(0)) (Extended Data Fig. 7d).
Sample preparation and imaging procedure for smFRET-RAP.
LEx-FITR CHO stable lines used for smFRET imaging and PIE-FCCS were prepared and labeled as described above for TIRF imaging, except that higher levels of tetracycline (200 ng ml−1 for cells expressing Sf-mGluR2; 500 ng ml−1 for cells expressing Sf-MOR and Sf-Sec) were used for induction.
SmFRET-RAP was achieved using the TIRF microscope setup described earlier with all imaging and bleaching procedures carried out in TIRF mode. Before smFRET-RAP imaging, cells were briefly excited with both 532-nm (~100 mW) and 640-nm (50 mW) laser lines to generate an initial image for quantifying the density of donor- and acceptor-labeled receptors (see section below). Next, cells were illuminated with both the 532-nm (135 mW) and the 640-nm (65 mW) laser lines at higher powers for 8 min to photobleach fluorophore-labeled receptors. Immediately after a ~2–3 min recovery period in the absence of laser excitation post-bleaching, the cells were first imaged briefly in dual-excitation mode to generate an image for quantifying the density of donor- and acceptor-labeled receptors as described above, followed by smFRET-RAP imaging with only the 532-nm (~100 mW) laser line. For smFRET-RAP imaging, a time series of 4,000 frames per movie was acquired at a time resolution of 40 ms.
Surface density determination for smFRET-RAP.
For Sf-mGluR2-expressing cells used for smFRET-RAP, individual receptors were resolved when imaged in the dual-excitation mode after the ~2–3 min recovery period, and, therefore, the surface density of acceptor- and donor-labeled receptors could be directly quantified by the single-particle-detection procedure as described earlier. In addition, the TCF of each cell (described below) after recovery was also determined to relate the number of particles per cell area to the TCF per cell area (Extended Data Fig. 9a). Using this relationship, the surface density of Sf-mGluR2 before photobleaching, when individual particles are unresolved due to high receptor expression levels, was estimated from the TCF determined from images acquired in dual-excitation mode. This same approach was also used to determine the surface density before photobleaching of acceptor- and donor-labeled Sf-MOR and Sf-SecR.
The TCF intensity per cell was calculated from donor and acceptor fluorescence images acquired under imaging-power dual-excitation mode using equation (10).
| (10) |
Acell is the cell area, and Icell is the integrated density as the sum of all pixel intensities within Acell. is the mean background intensity measured from an arbitrary region outside of but near the cell.
Plotting and statistics.
Plotting, distribution fitting and statistics for all single-molecule and PIE-FCCS data were carried out using Origin 2017 (OriginLab). To determine P values, one-way ANOVA with Tukey’s post hoc test was performed for multisample comparisons, while an unpaired two-sided t-test was used for two-sample comparisons. Dose–response curves from the BRET-based cAMP assays were plotted and fit using GraphPad Prism (GraphPad Software).
Reporting Summary.
Further information on research design is available in the Nature Research Reporting Summary linked to this article.
Data availability
The raw image data generated and analyzed that support the findings of this study are available from the corresponding author upon reasonable request. These image data are not deposited in a public database because of their large file sizes. Source data are provided with this paper.
Code availability
The smCellFRET data analysis pipeline is freely available for academic use. The software and updated versions can be downloaded at http://innovation.columbia.edu/technologies/CU15268. Other software used to collect and analyze data for this work as described in the Methods either was published previously or is commercially available.
Extended Data
Extended Data Fig. 1 |. Expression and labeling of functional Sf-mGluR2 with self-healing fluorophores in living CHO cells.
a, The SNAPf tag is a modified O6-alkylguanine-DNA alkyltransferase enzyme that forms covalent linkages with benzylguanine (BG)-fluorophores. b, Dose-response curve for bioluminescence resonance energy transfer (BRET)-based cAMP inhibition assay confirming Sf-mGluR2 functionality. Global fits from three independent experiments each performed in triplicate. Error bars represent standard error of the mean (SEM). The mean Log EC50 with standard error is shown. c, Schematic of LEx-FITR CHO cells expressing the tet repressor (TetR) and with integrated receptor cDNA under control of the crippled CMV promoter (PcrCMV), two tetracycline operator 2 (2XTO2) sites, and weak Kozac sequence. Note that LEx-FITR cells were selected for a Flp-In site that leads to very low basal expression after receptor cDNA integration. d, Chemical structures of LD555p-BG and LD655-BG. Absorption (left plots) and emission (right plots) spectra of recombinantly expressed and purified SNAPf labeled with e, LD555p and f, LD655.
Extended Data Fig. 2 |. Quantification of the surface density of labeled Sf-mGluR2.
a, Representative initial image of a CHO cell containing donor and acceptor labeled Sf-mGluR2 of 16 cells generated by 532-nm and 640-nm dual excitation taken prior to smFRET imaging. Single-particle detection (purple circles) was used to quantify the number of particles within a region of interest (yellow line). Scale bar, 5 μm. b, Surface densities prior to smFRET imaging of cells labeled with donor and acceptor (Don/Acc) as well as with acceptor only (Acc-only) or with donor only (Don-only). Dots represent the number of acceptors or donors per area for each cell. Box plots indicate the median (central line) and interquartile range (IQR) (lower and upper box lines represent the 25- and 75-percentiles, respectively) while the whiskers represent those points that fall within 1.5 x IQR. The median density of total (acceptor + donor) labeled receptors was 0.30 receptors/μm2 (donor-to-acceptor ratio ~1:1). As expected, donor- and acceptor-only samples show labeling with only the fluorophore indicated.
Extended Data Fig. 3 |. Fluorescence and smFRET data for donor and acceptor labeled Sf-mGluR2 immobilized under fixed cell conditions.
a, Representative fluorescence (top)- and FRET (bottom) time traces for individual receptors. b, Distributions of the total intensity (donor + acceptor) and acceptor intensity during smFRET. The distributions were fit to a single gaussian function, yielding a mean total intensity of 458 photons/frame (full width at half maximum (FWHM) of 218) and a mean acceptor intensity of 279 photons/frame (FWHM of 288). c, Lifetime of smFRET events for Sf-mGluR2 in fixed cells. The lifetime distribution was fit to a single exponential to produce the decay constant τ. The data in panels b and c are derived from 124 molecules and a total of 16 cells.
Extended Data Fig. 4 |. Characterizing fluorescence and smFRET data for Sf-mGluR2 in the plasma membrane of living cells.
a, Total fraction of time spent in (left) and diffusion coefficients (right) for immobile (imm), confined (conf), free, and directed (dir) diffusion states assigned by DC-MSS. Dots represent individual cell means and the middle and upper/lower lines depict the overall mean (values shown) and standard deviation, respectively, for 16 cells. b, Distributions of the total (donor + acceptor) and acceptor intensities during smFRET. Histograms comprised of 5,546 freely diffusing smFRET trajectories from 16 cells were fit with a single-state gaussian model, yielding mean total and acceptor intensities of 457 (FWHM of 284) and 190 (FWHM of 135) photons/frame, respectively. c, Distribution of freely diffusing smFRET events per cell for receptor labeled with donor and acceptor (Don/Acc) (16 cells) compared to those with acceptor-only (16 cells) and donor-only (22 cells). Dots represent the total number of freely diffusing smFRET trajectories (including freely diffusing segments from smFRET trajectories with more than one diffusion state) per area for each cell. Box plot details are described in the legend of Extended Data Fig. 2b. One-way ANOVA (DF = 53; F-value = 92.5) and Tukey post-hoc comparison were performed to obtain p-values (****p « 0.0001; not significant (n.s.) = 0.997). The sum of the mean number of events per cell for the controls represent ~1% of those from Don/Acc Sf-mGluR2. d, Representative smFRET trajectories and fluorescence- and FRET-time traces for Sf-mGluR2 in the absence of ligand (apo state) without and e, with anticorrelation. Here and elsewhere, smFRET trajectories are shown to the left of their fluorescence (red and green traces indicating the intensities are derived from acceptor and donor tracks) and FRET traces. f, FRET-efficiency histograms fit with a single-(top) or two (bottom)-state gaussian model from traces without (top) and with anticorrelation (bottom) containing donor and acceptor labeled-mGluR2. The histograms are comprised of the number of trajectories (n) indicated from 6 cells. Each bar height represents the mean count of FRET values calculated from 6 cell samples. The length of the error bars corresponds to 1 s.d. from the mean. g, Distribution of the duration of smFRET events of 4,800 freely diffusing smFRET trajectories from 16 cells with single-exponential decay constant τ. h, Pearson correlation coefficients between donor and acceptor fluorescence traces were calculated for each segment and are shown as a histogram for the immobile (black), confined (magenta), and freely diffusing (blue) motion types. Lines are spline interpolations to facilitate comparison between conditions. Values in the legend correspond to the ensemble average correlation values. (i) FRET efficiency histogram comprised of immobile/confined segments for Sf-mGluR2 labeled with donor and acceptor. The histogram is fit with a two-state Gaussian model and consists of 93 immobile/confined segments from trajectories that also showed free diffusion obtained from 6 different cells. Error bars are described in the legend of Extended Data Fig. 4f.
Extended Data Fig. 5 |. SmFRET data for Sf-mGluR2 dimers diffusing within the plasma membrane of living cells.
Representative smFRET trajectories and their corresponding fluorescence- and FRET-time traces for individual receptors in the presence of a, 15 μM and b, 100 μM glutamate (Glu) as well as c, those showing transitions to the 0.84 FRET state (top, apo condition; bottom, 15 μM Glu condition). d, Pearson correlation coefficients between donor and acceptor fluorescence traces were compiled into histograms for trajectories obtained in the absence of ligands (blue), or in the presence of 15 μM Glu (green) or 100 μM Glu (red). Lines are spline interpolations to facilitate comparison between conditions. Values in the legend correspond to the ensemble average correlation values.
Extended Data Fig. 6 |. Characterization of functional Sf-MOR, Sf-SecR, and Sf-mGluR2 compared to controls in living cells.
a, Dose-response curves for BRET-based cAMP inhibition and generation assays confirming Sf-MOR (top) and Sf-SecR (bottom) functionality, respectively. Curve fitting details are described in Extended Data Fig. 1b legend. b, Surface densities prior to smFRET imaging of donor and acceptor labeled samples for smFRET studies. Dots represent the number of acceptor (nAcc) or donor (nDon) particles per area for single cells. Box plot details are described in the legend of Extended Data Fig. 2b. The densities for Sf-mGluR2 are reproduced from Extended Data Fig. 2b for comparison. The median density of total labeled (acceptor + donor) TM proteins ranged from 0.28 – 0.36 molecules/μm2. c, Distribution of smFRET events per cell for Sf-mGluR2 labeled with donor and acceptor (Don/Acc) (16 cells) compared to those for acceptor-only (16 cells) and donor-only (22 cells) controls as determined by the NLT analysis criteria. Dots represent the number of smFRET trajectories per area for each cell. Box plot details are described in the legend of Extended Data Fig. 2b. One-way ANOVA (DF = 53; F-value = 75.5) and Tukey post-hoc comparison were performed to obtain p-values (****p « 0.0001; n.s. = 0.996). The sum of the mean number of events per cell for the controls represent < 2% of those from Don/Acc Sf-mGluR2. d, Distribution of the duration of smFRET events of 2,695 smFRET trajectories for Sf-mGluR2 from 16 cells with the single-exponential with decay τ.
Extended Data Fig. 7 |. Overview of the PIE-FCCS method.
a, Schematic of the PIE-FCCS setup. Blue and green excitation beams, split from the same source, travel along fibers of different lengths to interleave the pulse arrival times. The diffraction-limited beams are focused at the cell surface and photons emitted from fluorescently labeled TM proteins diffusing through the laser focus are collected by the objective and directed to single photon detectors coupled to a TCSPC device. b, Pulsed interleaved excitation allows for separate time gating of green and red fluorophore emission readings that are time-tagged by the TCSPC device. c, A representative Sf-mGluR2 expressing CHO cells labeled with ATTO488-BG (left) and DY549P1-BG (right) in a ~1:1 ratio. White squares indicate approximate position and size of the laser focus during PIE-FCCS data collection. Scale bars, 10 μm. d, Example PIE-FCCS data from a single cell for Sf-mGluR2. Green and red dots are the autocorrelation functions (ACFs) obtained from fluorescence fluctuations in the green and red detection channels, respectively, while blue dots are the cross-correlation function (CCF) from the green and red co-diffusing species. The solid lines are model fits used to calculate fraction correlated (fc) as described in the Methods. e, Total surface densities of labeled samples for PIE-FCCS studies. Dots represent the total number of labeled molecules per area for single cells. Box plot details are described in the legend of Extended Data Fig. 2b.
Extended Data Fig. 8 |. Representative PIE-FCCS data curves for each construct.
PIE-FCCS data as described in Extended Data Fig. 7d from three representative cells for a, Sf-TM-LDL, b, Sf-mGluR2, c, Sf-Δ2Δ, d, Sf-MOR, and e, Sf-SecR.
Extended Data Fig. 9 |. SmFRET-RAP data for Sf-mGluR2.
a, Relationship between the number of acceptor and donor particles (nParticles) recovered 2 – 3 minutes after photobleaching and the total-background corrected acceptor and donor fluorescence per cell area. The number of cells for each point is 8. b, Surface densities of donor and acceptor labeled receptors before bleaching for the smFRET-RAP experiments (the median density of total labeled (acceptor + donor) receptors was ~ 4.0 molecules/μm2 (donor-to-acceptor ratio ~1:1)) compared to (c) those used for smFRET at lower expression levels reproduced from Extended Data Fig. 2b for comparison. Dots represent the number of acceptors (nAcc) and donors (nDon) per area for individual cells. Box plot details are described in the legend of Extended Data Fig. 2b. d, Representative acceptor and donor image sequence during smFRET with corresponding smFRET trajectory (red and green lines). Scale bar, 5 μm. Purple arrow at 10.64 s indicates a second donor particle that overlaps briefly with the particle showing smFRET. These occurrences do not influence the number of FRET events or their lifetime. e, Representative smFRET trajectory and fluorescence- and FRET-time traces derived from the image sequence in (d) where the donor and acceptor emission are anticorrelated upon acceptor photobleaching. f, Distribution of the duration of smFRET-RAP events comprised of 7,529 smFRET-RAP trajectories from 8 cells with single-exponential decay constant τ.
Extended Data Fig. 10 |. SmFRET-RAP data for Sf-SecR and Sf-MOR.
a, Acceptor (top) and donor (bottom) labeled receptor densities before photobleaching for smFRET-RAP (left panel) compared to those used for smFRET at lower receptor expression levels (right panel) reproduced from Extended Data Fig. 6b. Dots represent the number of acceptor (nAcc) or donor (nDon) particles per area for single cells. Box plot details are described in the legend of Extended Data Fig. 2b. b, c, TIRF images of representative CHO cells expressing labeled b, Sf-SecR from 7 cells and (c) Sf-MOR from 7 cells before donor and acceptor photobleaching (left panel), ~30 seconds after photobleaching (middle panel), and ~2 – 3 minutes after photobleaching (right panel) showing the recovery of labeled receptors (scale bar, 5 μm). d, Representative trajectories and sensitized acceptor intensity time traces for Sf-SecR. The top trajectory and trace are derived from the image sequence shown in Fig. 5b. e, Duration of smFRET events of SecR interactions determined from the tracking duration of sensitized acceptor trajectories. The distribution comprised of 4,232 trajectories from 21 cells was fit to a single exponential with decay constant (τ).
Supplementary Material
Acknowledgements
This work was supported by NIH grant MH54137 (J.A.J.), the Hope for Depression Research Foundation (J.A.J.), the Lieber Center for Schizophrenia Research (J.A.J.), the Brain and Behavior Research Foundation NARSAD Young Investigator Award (W.B.A.), NIH grant R15EY024451 (A.W.S.), the National Science Foundation under grant number CHE-1753060 (A.W.S.), NIH grant R35GM119619 (K.J.), NIH grant 7R01GM098859-09 (S.C.B.) and the UTSW Endowed Scholars Program (K.J.). This work was supported, in part, by the Single-Molecule Imaging Center at St. Jude Children’s Research Hospital. We thank M. Dawoud for technical assistance, B. Williams for analysis of online RNA-seq data in CHO cells, S. Mondal and H. Weinstein for discussion related to the measurement of diffusion, A. Vega for discussion related to DC-MSS, G. Schütz, M. Brameshuber and C. Bodner for discussion related to single-molecule imaging at high surface expression conditions, I. Correa for discussion related to SNAPf labeling and E. Stevens for assistance with figure illustrations. This work is dedicated to the memory of Y. Zhao.
Footnotes
Competing interests
S.C.B. has an equity interest in Lumidyne Technologies. The other authors have no competing interests.
Additional information
Extended data is available for this paper at https://doi.org/10.1038/s41592-021-01081-y.
Supplementary information The online version contains supplementary material available at https://doi.org/10.1038/s41592-021-01081-y.
Peer review information Rita Strack was the primary editor on this article and managed its editorial process and peer review in collaboration with the rest of the editorial team. Nature Methods thanks Emanuel Margeat, Michael Börsch, and the other, anonymous reviewer for their contribution to the peer review of this work.
Reprints and permissions information is available at www.nature.com/reprints.
References
- 1.Asher WB et al. Extreme vetting of dopamine receptor oligomerization. In Receptors 33, 99–127 (Humana Press, 2017). [Google Scholar]
- 2.Lambert NA & Javitch JA CrossTalk opposing view: weighing the evidence for class A GPCR dimers, the jury is still out. J. Physiol. 592, 2443–2445 (2014). [DOI] [PMC free article] [PubMed] [Google Scholar]
- 3.Doumazane E et al. Illuminating the activation mechanisms and allosteric properties of metabotropic glutamate receptors. Proc. Natl Acad. Sci. USA 110, E1416–E1425 (2013). [DOI] [PMC free article] [PubMed] [Google Scholar]
- 4.Maurel D et al. Cell-surface protein–protein interaction analysis with time-resolved FRET and snap-tag technologies: application to GPCR oligomerization. Nat. Methods 5, 561–567 (2008). [DOI] [PMC free article] [PubMed] [Google Scholar]
- 5.White JH et al. Heterodimerization is required for the formation of a functional GABAB receptor. Nature 396, 679–682 (1998). [DOI] [PubMed] [Google Scholar]
- 6.Scarselli M et al. Revealing G-protein-coupled receptor oligomerization at the single-molecule level through a nanoscopic lens: methods, dynamics and biological function. FEBS J. 283, 1197–1217 (2016). [DOI] [PubMed] [Google Scholar]
- 7.Felce JH, Davis SJ & Klenerman D Single-molecule analysis of G protein-coupled receptor stoichiometry: approaches and limitations. Trends Pharmacol. Sci. 39, 96–108 (2018). [DOI] [PubMed] [Google Scholar]
- 8.Kasai RS et al. Full characterization of GPCR monomer–dimer dynamic equilibrium by single molecule imaging. J. Cell Biol. 192, 463–480 (2011). [DOI] [PMC free article] [PubMed] [Google Scholar]
- 9.Tabor A et al. Visualization and ligand-induced modulation of dopamine receptor dimerization at the single molecule level. Sci. Rep. 6, 33233 (2016). [DOI] [PMC free article] [PubMed] [Google Scholar]
- 10.Calebiro D et al. Single-molecule analysis of fluorescently labeled G-protein-coupled receptors reveals complexes with distinct dynamics and organization. Proc. Natl Acad. Sci. USA 110, 743–748 (2013). [DOI] [PMC free article] [PubMed] [Google Scholar]
- 11.Kasai RS, Ito SV, Awane RM, Fujiwara TK & Kusumi A The class-A GPCR dopamine D2 receptor forms transient dimers stabilized by agonists: detection by single-molecule tracking. Cell Biochem. Biophys. 76, 29–37 (2018). [DOI] [PMC free article] [PubMed] [Google Scholar]
- 12.Juette MF et al. The bright future of single-molecule fluorescence imaging. Curr. Opin. Chem. Biol. 20, 103–111 (2014). [DOI] [PMC free article] [PubMed] [Google Scholar]
- 13.Hellenkamp B et al. Precision and accuracy of single-molecule FRET measurements—a multi-laboratory benchmark study. Nat. Methods 15, 669–676 (2018). [DOI] [PMC free article] [PubMed] [Google Scholar]
- 14.Plitzko JM, Schuler B & Selenko P Structural Biology outside the box—inside the cell. Curr. Opin. Struct. Biol. 46, 110–121 (2017). [DOI] [PubMed] [Google Scholar]
- 15.Sustarsic M & Kapanidis AN Taking the ruler to the jungle: single-molecule FRET for understanding biomolecular structure and dynamics in live cells. Curr. Opin. Struct. Biol. 34, 52–59 (2015). [DOI] [PubMed] [Google Scholar]
- 16.Sakon JJ & Weninger KR Detecting the conformation of individual proteins in live cells. Nat. Methods 7, 203–205 (2010). [DOI] [PMC free article] [PubMed] [Google Scholar]
- 17.Konig I et al. Single-molecule spectroscopy of protein conformational dynamics in live eukaryotic cells. Nat. Methods 12, 773–779 (2015). [DOI] [PubMed] [Google Scholar]
- 18.Winckler P et al. Identification and super-resolution imaging of ligand-activated receptor dimers in live cells. Sci. Rep. 3, 2387 (2013). [DOI] [PMC free article] [PubMed] [Google Scholar]
- 19.Sako Y, Minoghchi S & Yanagida T Single-molecule imaging of EGFR signalling on the surface of living cells. Nat. Cell Biol. 2, 168–172 (2000). [DOI] [PubMed] [Google Scholar]
- 20.Wilmes S et al. Mechanism of homodimeric cytokine receptor activation and dysregulation by oncogenic mutations. Science 367, 643–652 (2020). [DOI] [PMC free article] [PubMed] [Google Scholar]
- 21.Zheng Q et al. Electronic tuning of self-healing fluorophores for live-cell and single-molecule imaging. Chem. Sci. 8, 755–762 (2017). [DOI] [PMC free article] [PubMed] [Google Scholar]
- 22.Pati AK et al. Tuning the Baird aromatic triplet-state energy of cyclooctatetraene to maximize the self-healing mechanism in organic fluorophores. Proc. Natl Acad. Sci. USA 117, 24305–24315 (2020). [DOI] [PMC free article] [PubMed] [Google Scholar]
- 23.Ishitsuka Y et al. Evaluation of genetically encoded chemical tags as orthogonal fluorophore labeling tools for single-molecule FRET applications. J. Phys. Chem. B 119, 6611–6619 (2015). [DOI] [PubMed] [Google Scholar]
- 24.Vafabakhsh R, Levitz J & Isacoff EY Conformational dynamics of a class C G-protein-coupled receptor. Nature 524, 497–501 (2015). [DOI] [PMC free article] [PubMed] [Google Scholar]
- 25.Keppler A et al. A general method for the covalent labeling of fusion proteins with small molecules in vivo. Nat. Biotechnol. 21, 86–89 (2003). [DOI] [PubMed] [Google Scholar]
- 26.Sun X et al. Development of SNAP-tag fluorogenic probes for wash-free fluorescence imaging. ChemBioChem 12, 2217–2226 (2011). [DOI] [PMC free article] [PubMed] [Google Scholar]
- 27.Kawashima N et al. Reversible dimerization of EGFR revealed by single-molecule fluorescence imaging using quantum dots. Chemistry 16, 1186–1192 (2010). [DOI] [PubMed] [Google Scholar]
- 28.Suzuki KG et al. Transient GPI-anchored protein homodimers are units for raft organization and function. Nat. Chem. Biol. 8, 774–783 (2012). [DOI] [PubMed] [Google Scholar]
- 29.Koyama-Honda I et al. Fluorescence imaging for monitoring the colocalization of two single molecules in living cells. Biophys. J. 88, 2126–2136 (2005). [DOI] [PMC free article] [PubMed] [Google Scholar]
- 30.Jaqaman K et al. Robust single-particle tracking in live-cell time-lapse sequences. Nat. Methods 5, 695–702 (2008). [DOI] [PMC free article] [PubMed] [Google Scholar]
- 31.Vega AR, Freeman SA, Grinstein S & Jaqaman K Multistep track segmentation and motion classification for transient mobility analysis. Biophys. J. 114, 1018–1025 (2018). [DOI] [PMC free article] [PubMed] [Google Scholar]
- 32.Gregorio GG et al. Single-molecule analysis of ligand efficacy in β2AR-G-protein activation. Nature 547, 68–73 (2017). [DOI] [PMC free article] [PubMed] [Google Scholar]
- 33.Dijkman PM et al. Dynamic tuneable G protein-coupled receptor monomer–dimer populations. Nat. Commun. 9, 1710 (2018). [DOI] [PMC free article] [PubMed] [Google Scholar]
- 34.Olofsson L et al. Fine tuning of sub-millisecond conformational dynamics controls metabotropic glutamate receptors agonist efficacy. Nat. Commun. 5, 5206 (2014). [DOI] [PubMed] [Google Scholar]
- 35.Ferre S et al. G protein-coupled receptor oligomerization revisited: functional and pharmacological perspectives. Pharmacol. Rev. 66, 413–434 (2014). [DOI] [PMC free article] [PubMed] [Google Scholar]
- 36.Meral D et al. Molecular details of dimerization kinetics reveal negligible populations of transient micro-opioid receptor homodimers at physiological concentrations. Sci. Rep. 8, 7705 (2018). [DOI] [PMC free article] [PubMed] [Google Scholar]
- 37.Harikumar KG & Miller LJ Secretin receptor dimerization. Prototypic of class B GPCR behavior. In Receptors 33, 273–287 (Humana Press, 2017). [Google Scholar]
- 38.Ward RJ, Pediani JD, Harikumar KG, Miller LJ & Milligan G Spatial intensity distribution analysis quantifies the extent and regulation of homodimerization of the secretin receptor. Biochem. J. 474, 1879–1895 (2017). [DOI] [PMC free article] [PubMed] [Google Scholar]
- 39.El Moustaine D et al. Distinct roles of metabotropic glutamate receptor dimerization in agonist activation and G-protein coupling. Proc. Natl Acad. Sci. USA 109, 16342–16347 (2012). [DOI] [PMC free article] [PubMed] [Google Scholar]
- 40.Smith AW Detection of rhodopsin dimerization in situ by PIE-FCCS, a time-resolved fluorescence spectroscopy. Methods Mol. Biol. 1271, 205–219 (2015). [DOI] [PubMed] [Google Scholar]
- 41.Comar WD, Schubert SM, Jastrzebska B, Palczewski K & Smith AW Time-resolved fluorescence spectroscopy measures clustering and mobility of a G protein-coupled receptor opsin in live cell membranes. J. Am. Chem. Soc. 136, 8342–8349 (2014). [DOI] [PMC free article] [PubMed] [Google Scholar]
- 42.Jastrzebska B et al. A G protein-coupled receptor dimerization interface in human cone opsins. Biochemistry 56, 61–72 (2017). [DOI] [PMC free article] [PubMed] [Google Scholar]
- 43.Kaliszewski MJ et al. Quantifying membrane protein oligomerization with fluorescence cross-correlation spectroscopy. Methods 140–141, 40–51 (2018). [DOI] [PMC free article] [PubMed] [Google Scholar]
- 44.Brameshuber M & Schutz GJ Detection and quantification of biomolecular association in living cells using single-molecule microscopy. Methods Enzymol. 505, 159–186 (2012). [DOI] [PubMed] [Google Scholar]
- 45.Mudumbi KC, Schirmer EC & Yang W Single-point single-molecule FRAP distinguishes inner and outer nuclear membrane protein distribution. Nat. Commun. 7, 12562 (2016). [DOI] [PMC free article] [PubMed] [Google Scholar]
- 46.Lacy MM, Baddeley D & Berro J Single-molecule imaging of the BAR-domain protein Pil1p reveals filament-end dynamics. Mol. Biol. Cell 28, 2251–2259 (2017). [DOI] [PMC free article] [PubMed] [Google Scholar]
- 47.Zhang M et al. Quantitative characterization of the membrane dynamics of newly delivered TGF-β receptors by single-molecule imaging. Anal. Chem. 90, 4282–4287 (2018). [DOI] [PubMed] [Google Scholar]
- 48.Zhao Y et al. Single-molecule dynamics of gating in a neurotransmitter transporter homologue. Nature 465, 188–193 (2010). [DOI] [PMC free article] [PubMed] [Google Scholar]
- 49.Juette MF et al. Single-molecule imaging of non-equilibrium molecular ensembles on the millisecond timescale. Nat. Methods 13, 341–344 (2016). [DOI] [PMC free article] [PubMed] [Google Scholar]
References
- 50.Elshenawy MM et al. Cargo adaptors regulate stepping and force generation of mammalian dynein–dynactin. Nat. Chem. Biol. 15, 1093–1101 (2019). [DOI] [PMC free article] [PubMed] [Google Scholar]
- 51.Los GV et al. HaloTag: a novel protein labeling technology for cell imaging and protein analysis. ACS Chem. Biol. 3, 373–382 (2008). [DOI] [PubMed] [Google Scholar]
- 52.Hammond S, Kaplarevic M, Borth N, Betenbaugh MJ & Lee KH Chinese hamster genome database: an online resource for the CHO community at www.CHOgenome.org. Biotechnol. Bioeng. 109, 1353–1356 (2012). [DOI] [PubMed] [Google Scholar]
- 53.O’Gorman S, Fox DT & Wahl GM Recombinase-mediated gene activation and site-specific integration in mammalian cells. Science 251, 1351–1355 (1991). [DOI] [PubMed] [Google Scholar]
- 54.Altman RB et al. Cyanine fluorophore derivatives with enhanced photostability. Nat. Methods 9, 68–71 (2011). [DOI] [PMC free article] [PubMed] [Google Scholar]
- 55.Tinevez JY et al. TrackMate: an open and extensible platform for single-particle tracking. Methods 115, 80–90 (2017). [DOI] [PubMed] [Google Scholar]
- 56.Schneider CA, Rasband WS & Eliceiri KW NIH Image to ImageJ: 25 years of image analysis. Nat. Methods 9, 671–675 (2012). [DOI] [PMC free article] [PubMed] [Google Scholar]
- 57.Qin F Restoration of single-channel currents using the segmental k-means method based on hidden Markov modeling. Biophys. J. 86, 1488–1501 (2004). [DOI] [PMC free article] [PubMed] [Google Scholar]
Associated Data
This section collects any data citations, data availability statements, or supplementary materials included in this article.
Supplementary Materials
Data Availability Statement
The raw image data generated and analyzed that support the findings of this study are available from the corresponding author upon reasonable request. These image data are not deposited in a public database because of their large file sizes. Source data are provided with this paper.


