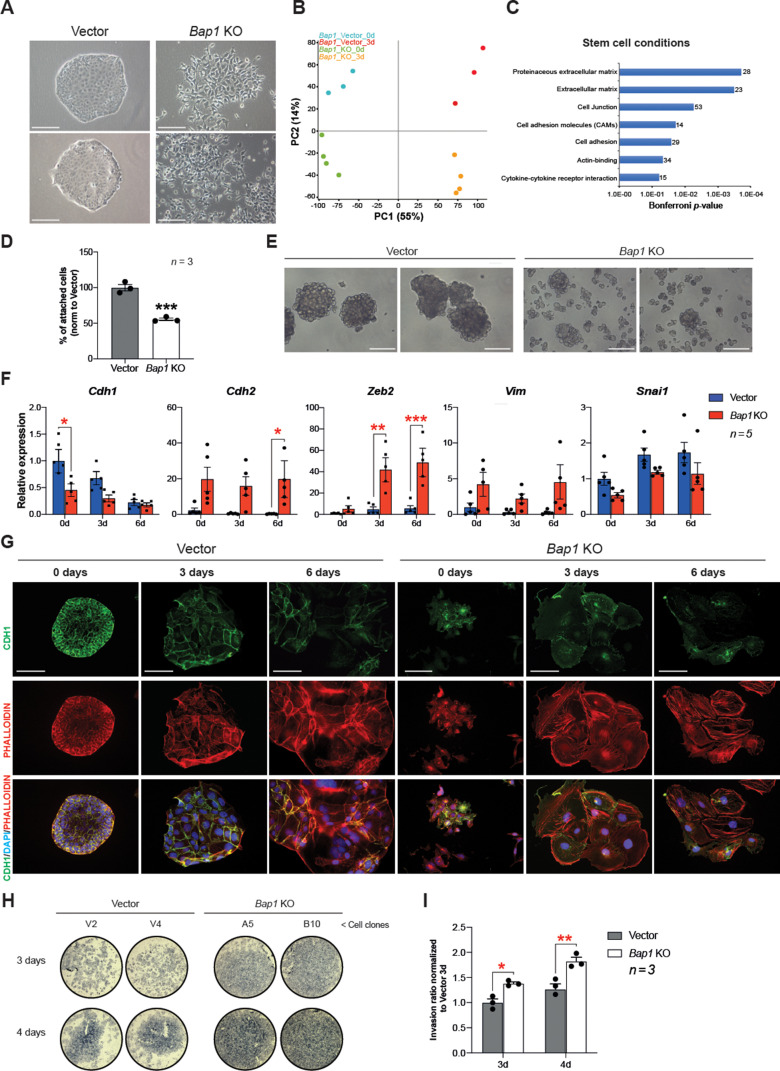
Figure 3. Bap1 deficiency promotes epithelial-mesenchymal transition (EMT).
(A) Colony morphology of wild-type (vector) and Bap1-mutant mouse trophoblast stem cells (mTSCs). Bap1-/- mTSCs show a fibroblast-like morphology with loss of cell-cell attachment compared to vector control mTSCs. Images are representative of five independent TSC clones each. Scale bar: 100 µm. (B) Principal component analysis of global transcriptomes of independent vector control (n = 3) and Bap1 knockout (KO) (n = 4) clones grown in stem cell conditions (0d) and after 3 days of differentiation (3d). (C) Gene ontology analyses of genes differentially expressed between vector and Bap1-mutant mTSCs in stem cell conditions. (D) Cell adhesion assay showing that Bap1-mutant mTSCs are less well attached to cell culture plastic compared to vector control cells. Data are mean of three independent replicates with three biological replicates ( = independent clones) per experiment. ***p<0.001 (Student’s t-test). (E) Morphology of 3D-trophospheres after 8 days of differentiation in low attachment conditions. Representative images of 2 independent vector control and Bap1 KO cell clones. Scale bar: 200 µm. (F) RT-qPCR analysis of EMT marker expression during a 6-day differentiation time course. Data are normalized to Sdha and displayed relative to vector in stem cell conditions (0d). Data are mean of five biological replicates (i.e. independent clones) ± SEM; *p<0.05, **p<0.01, ***p<0.001 (two-way ANOVA with Sidak’s multiple comparisons test). (G) Immunofluorescence analysis for CDH1 and F-actin (phalloidin) of vector control and Bap1-mutant mTSCs over 6 days of differentiation. Lack of BAP1 reduces cell-cell junctions (CDH1 staining) with a profound reorganization of the cytoskeleton (increased actin stress fibres). Data are representative of five independent vector control and Bap1 KO clones each. Scale bar: 100 µm. (H) Transwell invasion assay of vector control (V2, V4) and Bap1-mutant (clones A5, B10) mTSCs after 3 and 4 days of differentiation. Photographs of invasion filters show haematoxylin-stained cells that reached the bottom side of the filter after removal of the reconstituted basement membrane matrix (Matrigel). (I) Quantification of invaded cells, measured by colour intensity, normalized to 3-day controls. Data are mean of three independent replicates (three biological clones in each replicate) ± SEM; *p<0.05, **p<0.01** (two-way ANOVA with Sidak’s multiple comparisons test).


