Abstract
Major depressive disorder (MDD) is a common and serious mental disorder characterized by a persistent negative feeling and tremendous sadness. In recent decades, several studies used functional network connectivity (FNC), estimated from resting state functional magnetic resonance imaging (fMRI), to investigate the biological signature of MDD. However, the majority of them have ignored the temporal change of brain interaction by focusing on static FNC (sFNC). Dynamic functional network connectivity (dFNC) that explores temporal patterns of functional connectivity (FC) might provide additional information to its static counterpart. In the current study, by applying k-means clustering on dFNC of MDD and healthy subjects (HCs), we estimated 5 different states. Next, we use the hidden Markov model as a potential biomarker to differentiate the dFNC pattern of MDD patients from HCs. Comparing MDD and HC subjects’ hidden Markov model (HMM) features, we have highlighted the role of transition probabilities between states as potential biomarkers and identified that transition probability from a lightly-connected state to highly connected one reduces as symptom severity increases in MDD subjects.
Keywords: Major depressive disorder, Dynamic functional network connectivity, Machine learning, Resting-state functional magnetic resonance imaging, Hidden Markov model
I. Introduction
Major depressive disorder (MDD) is a complex mood disorder characterized with feelings of sadness, diminished interests, and loss [1], [2]. It affects more than 16 million American adults in the United States and 350 million adults in the world every year [3].Although a variety of treatments has been developed in last two decades, in about 20% to 30% of patients, symptoms do not entirely cease after treatment [4]. To optimize treatments, we need to improve our understanding of the underlying neurophysiological mechanism of MDD.
In recent years, several studies by analyzing functional network connectivity (FNC), have identified abnormal commination within and between functional brain regions and networks in MDD patients. However, many of these analyses have ignored the temporal changes of FNC during the rs-fMRI [5]–[7]. Indeed, the functional connectivity is highly dynamic even in the absence of external inputs. Recently, using a graph theory method, we have analyzed the dynamic FNC (dFNC) of whole-brain connectivity of MDD [8].
In this study, to investigate temporal dynamics in FNC (dFNC) of the whole-brain connectivity in MDD subject, we leveraged the sliding window approach followed by k-means clustering to identify a set of connectivity states [9]. To further investigate and model the temporal changes in dFNC, we estimated transition probability of HMM from dFNC. Next, using some statistical analysis and the estimated HMM features, we explored the difference between MDD patients and HC subjects. Further, we found a link between symptom severity and the dFNC HMM features MDD subjects.
II. Materials and Methods
A. Participants
In this study, the rs-fMRI data from 500 Chinese Han participants (250 MDD patients and 250 healthy controls) were recruited from 4 hospitals in China, including the West China Hospital of Sichuan (Site 1),the Henan Mental Hospital of Xinxiang (Site 2), the First Affiliated Hospital of Zhejiang (Site 3), and the Anding Hospital of Beijing (Site 4) has been used. Table I provide the detailed demographic information for the subjects. In addition, to rate the current symptom severity of MDD subjects, 17-item Hamilton depressive rating scale (HDRS) has been used [10]. Ethical consent was approved by the relevant ethics committees, and informed consent was obtained from each subject prior to scanning according to each site’s institutional review board. The demographic information of the subjects is shown in Table I. In addition, the scanning parameters were used in these four scanning site are described in [8].
TABLE I.
DEMOGRAPHIC AND CLINICAL INFORMATION OF SUBJECTS.
| MDD | HC | P-value | |
|---|---|---|---|
| Number | 262 | 277 | NA |
| Age | 32.79±11.14 | 31.22±10.37 | 0.06* |
| Gender(M/F) | 96/154 | 87/163 | 0.99* |
| HDRS-17 | 21.38±5.76 | NA | NA |
Two-sample Kolmogorov-Smirnov test
B. Data Processing
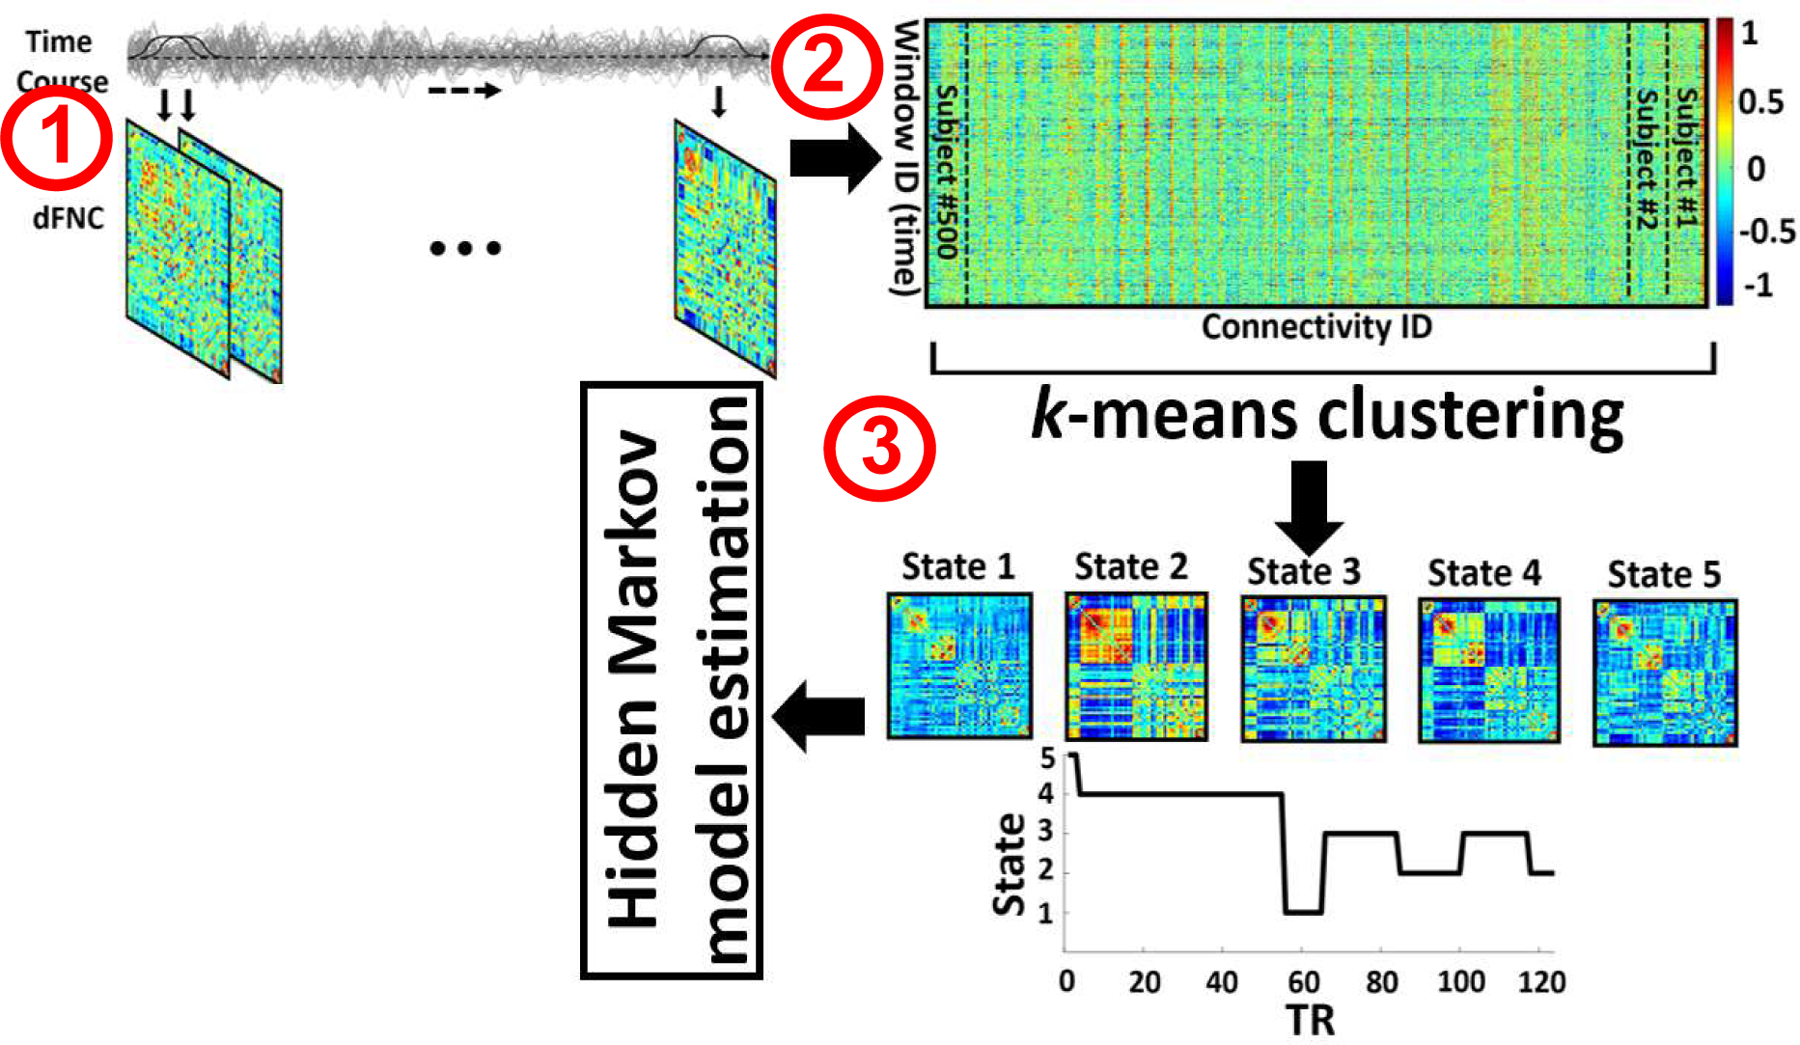
We used statistical parametric mapping (SPM12, http://www.fil.ion.ucl.ac.uk/spm/) to preprocess the fMRI data. First, we performed slice-timing correction on the fMRI data. Then, we applied rigid body motion correction using the toolbox in SPM to correct subject head motion. Next, we performed spatial normalization to an echo planar imaging (EPI) template in the standard Montreal Neurological Institute (MNI) space and resample to 3×3×3 mm. Finally, we used a Gaussian kernel with a full width at half maximum (FWHM) = 6 mm to smooth the fMRI images. In this study, the Neuromark automatic ICA pipeline has been used to extract reliable intrinsic connectivity networks (ICNs) [11]. The Neuromark templates were derived by identifying a subset of matched components as ICNs if they exhibit peak activations in gray matter; have low spatial overlap with known vascular, ventricular, motion, and susceptibility artifacts; and have dominant low-frequency fluctuations on their time-courses. Finally, we categorized all 53 ICNs into seven domains based on their prior anatomical and functional information. These domains include subcortical network (SCN), auditory network (ADN), sensorimotor network (SMN), visual network (VSN), cognitive control network (CCN), default-mode network (DMN), and cerebellar network (CBN). (Step1 in Fig.1). The details of all 53 ICNs used in this study was previously shown in [11].
Fig. 1. Schematic of the analysis pipeline.

A sliding window over time course signal of independent components was used to calculate dFNC of each subject. For each subject, we estimated 205 windows. (Step 1). Then, after concatenating all dFNCs, the dynamic states matrix and subject state transition vectors have been computed by applying a k-means clustering method across all window of all subjects. The optimized number of clusters, which been obtained by searching from 3 to 8, is 5 (Step 2). The dFNC hidden Markov model (HMM) features, which represent the transition probability between the states, have been calculated as a potential biomarker to differentiate MDD from HC subjects (Step 3).
C. Dynamic Functional Network Connectivity (dFNC)
For each subject i = 1 … N, dFNC of the whole-brain connectivity was estimated via a sliding window approach as shown Fig1. We used a tapered window, which was obtained by convolving a rectangle (window size = 20 TRs = 40 s) with a Gaussian (σ = 3), to localize the dataset at each time point. Then, the covariance matrix for each time point from windowed data was calculated to measure the dFNC between ICNs (Fig. 1 Step1). Next, we concatenated dFNC estimates of each window for each subject to form a C × C × T) array (where C=53 denotes the number of ICNs, and T=205 denotes the number of windows), which represented the changes in brain connectivity between ICNs as a function of time (Fig.1 Step 1) [13] (Step2 in Fig.1).
D. Clustering and Latent Transition Probability Feature Estimation
In the next step, we concatenated the dFNC of all subjects as shown in Step 2 of Fig.1 and then applied a k-means algorithm to these dFNC windows to partition the data into a set of separated clusters, called state here [10]. The optimal number of centroid states was estimated using the elbow criterion based on the ratio of within to between cluster distance. We found that the optimal number of clusters is 5 by sweeping the k value from 3 to 8. In addition, correlation was used as a distance metric in this k-means clustering algorithm with 1000 iterations. Next, to estimate the HMM feature, we calculated between-state transition and used this as a latent feature of dFNC. In this model, the transition probability generally is represented by aij which can be explained as the probability of the system to transition from state j at time t to state i at time step t+1. (Step3 in Fig.1).
| (1) |
where p and s donated probability and state, respectively.
E. Statistical Analysis
To compare MDD and HC using HMM features, we have performed two-way ANOVA test. To find a link between HMM features and HDRS of MDD group, we used partial correlation by accounting the age and gender. We performed all statistical analysis on all 25 HMM features. For false discovery rate (FDR) correction, all p values have been adjusted by Benjamini-Hochberg correction method.
III. Results and Discussion
A. Dynamic Connectivity States
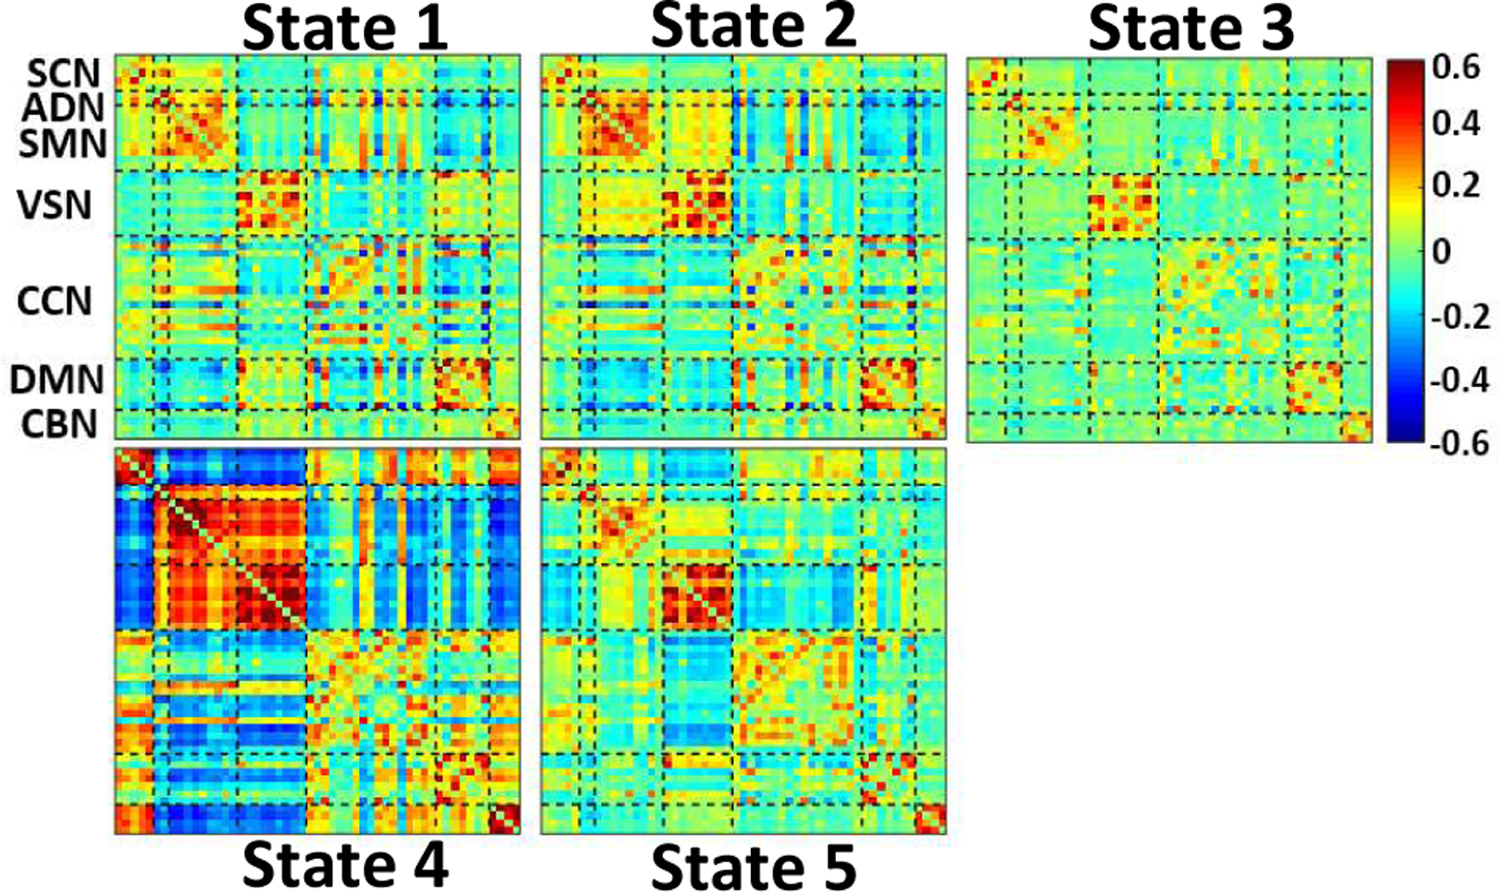
We identified five distinct dFNC states using k-means clustering algorithm are shows in Fig. 3a. We obviously observe different connectivity pattern in these five states. All states show a positive connectivity within and between SMN and VSN. In these networks, state 3 shows the weakest connectivity while state 4 shows the highest connectivity. Also, state 4 is distinguishable from other states by showing a negative connectivity between SMN and VSN with other networks. In addition, this state has the highest connectivity between SCN with rest of the brain except ADN, SMN, and VSN. State 3 fairly shows less connectivity in CCN, DMN, and CBN. In addition, state 2 shows more connectivity in DMN than that of state 1, state 3, and state 5. Also, excepting state 4, the connectivity between SMN and VSN is higher than other states. Relatively, state 5 shows stronger connectivity in VSN than state 1, state 2, and state 3. Comparing the connectivity of all states, relatively, state 3 shows the weakest connectivity of all states. In oppose to main body of previous research, which ignored the dynamic of FNC, we found that the dynamic evolution of short timescale connectivity differs significantly between HCs and MDDs. whole-brain functional connectivity of MDD subjects is indeed highly dynamic, representing flexibility in functional coordination in this mode [14].
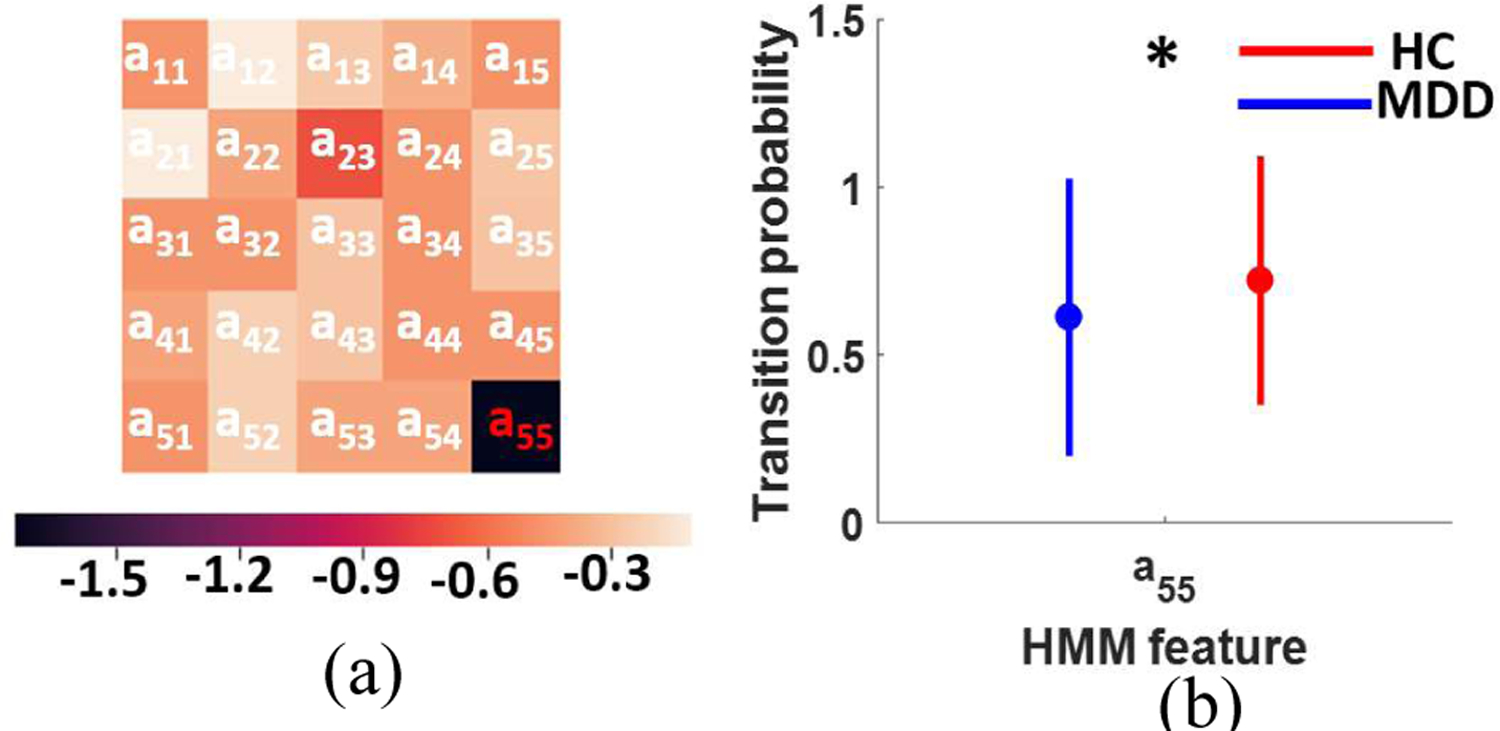
Fig. 3: The difference between MDD and HC subjects using HMM features.

a) Logarithmic p value of two-way ANOVA test after FDR correction (FDR correction p<0.05). b) Transition probability from state 5 to state 5 in HC subjects (F (1,249)=11.71, FDR corrected p=0.04).
B. HMM-based difference between HC and MDD
After calculating the HMM features of each subject, we did a two-way ANOVA test to compare HC and MDD using HMM features. Fig. 3a shows the logarithmic p value after FDR correction. As we see in this figure, a55, dwelling at state 5, shows a significant difference between HC and MDD subjects. As Fig. 3 b shows, the probability of remaining in state 5 is significantly higher in HC subjects.
C. Link between HMM features and symptom severity
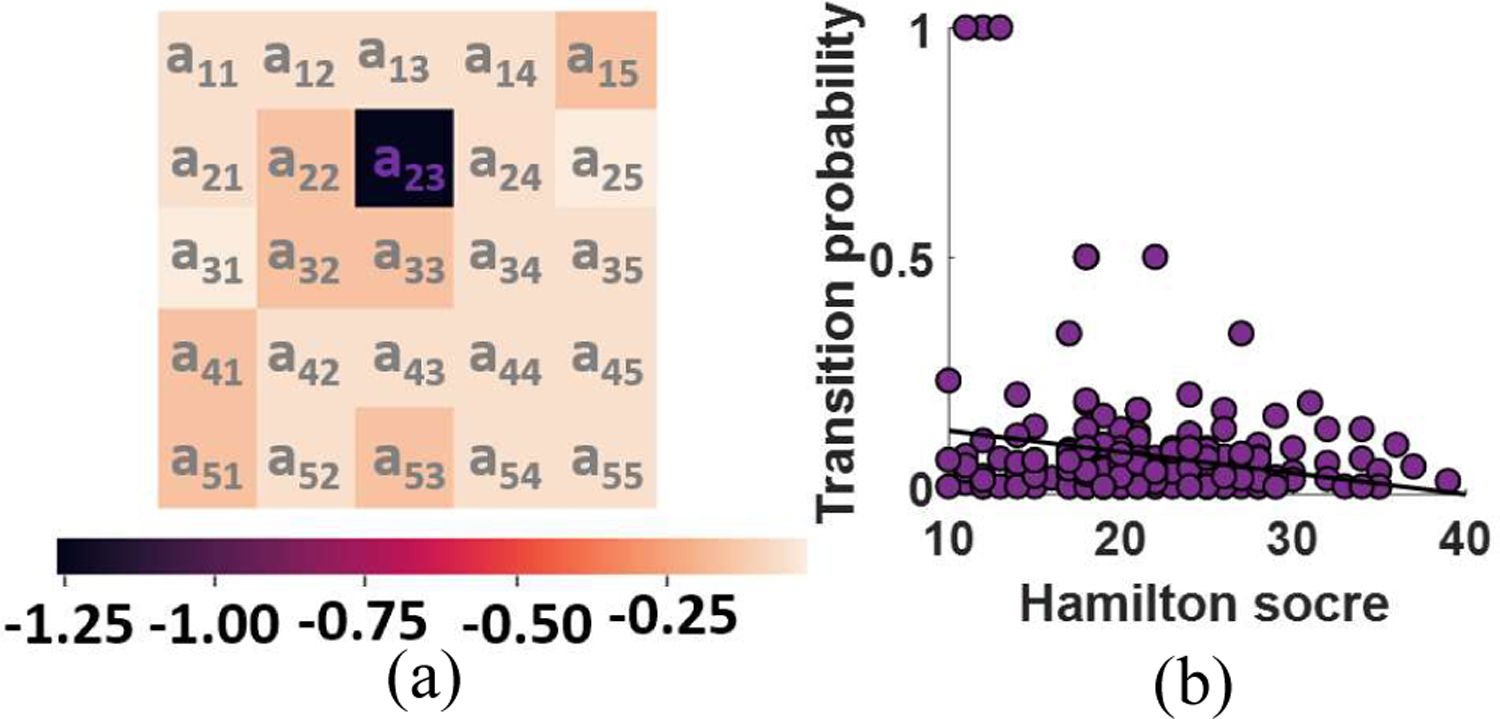
To find a link between HMM feature and HDRS-17, we calculated the Pearson’s linear correlation between transition probability, aij, and HDRS while controlling for age, gender, and scanning site. The logarithmic FDR corrected p values of correlation between HDRS and state transition number are shown in Fig. 4a. As this figure shows, we found that the probability of transitioning from state 3 to state 2 exhibits a negative correlation with HDRS (r=−0.21, FDR corrected p=0.04, n=208). This result suggests that the process of achieving more modularized connectivity from a position of disconnectivity differs for MDDs an HCs (in a way that is more pronounced as symptomology intensifies), a short timescale finding that may help explain the lower static connectivity that has been observed MDD subjects [15]. In addition, we find that HC subjects spend significantly more time in state 5, which presents relatively stronger connectivity within SMN, VSN, and CCN than state 3. Recent studies have also shown a link between weakly-connected FNC and self-focused thinking a key characteristic of depression m [16], [17]. Therefore, our analysis of dFNC both supports the role of weak network connectivity in MDD pathogenesis while also resolving the shorter timescale anomalies in MDD connectivity dynamics that result in lower time-averaged connectivity. The finding reported here that HCs spend more time in a state with greater SMN connectivity combined with our finding that the probability of transitioning from a weakly connected state to a state with stronger SMN connectivity falls with symptom severity suggests an important role for SMN in the MDD. This would be consistent with a recent study highlighting the role of SMN FNC in bipolar disorder (BD) [18].
Fig. 4: Correlation between HMM and HDRS:

a) Logarithmic FDR corrected p value of partial correlation after controlling age, gender, and scanning site (FDR correction p<0.05). b) Transition probability from state 3 to state 2 falls with symptom severity in MDD subjects (r=−0.21, FDR corrected p=0.04, n=208).
IV. Conclusion
Previous studies show play an important role of FNC in MDD. However, the majority of the only studied static FNC. In the current study, upon the previous studies, we analyzed dFNC of 250 MDD patients and 250 HC subjects from rs-fMRI. We found that MDD patients with higher symptom severity have less transition from a state with weaker connectivity to a state with higher connectivity. In addition, comparing between MDD and HC subjects, we found that HC subjects significantly spend more time in a state with higher connectivity in VSN and CCN. This study provides a new evidence of aberrant time-varying activity of the whole-brain FNC in MDD and the link between this aberrant pattern and the symptom severity in this disease group.
Fig. 2: k-means clustering, and the feature selection results.

The five dFNC states identified by the k-means clustering method.
Contributor Information
Elaheh Zendehrouh, Department of Computer Science at Georgia State University, Atlanta, Georgia..
Mohammad. S. E. Sendi, Wallace H. Coulter Department of Biomedical Engineering at Georgia Institute of Technology and Emory University, Atlanta, Georgia and with the Department of Electrical and Computer Engineering at Georgia Institute of Technology, Atlanta, Georgia. Tri-institutional Center for Translational Research in Neuroimaging and Data Science: Georgia State University, Georgia Institute of Technology, Emory University, Atlanta, Georgia.
Jing Sui, Tri-institutional Center for Translational Research in Neuroimaging and Data Science: Georgia State University, Georgia Institute of Technology, Emory University, Atlanta, Georgia. Brainnetome Center and National Laboratory of Pattern Recognition, Institute of Automation, Chinese Academy of Sciences, Beijing, China and University of Chinese Academy of Sciences, Beijing, China. CAS Centre for Excellence in Brain Science and Intelligence Technology, Institute of Automation, Chinese Academy of Sciences, Beijing, China..
Zening Fu, Tri-institutional Center for Translational Research in Neuroimaging and Data Science: Georgia State University, Georgia Institute of Technology, Emory University, Atlanta, Georgia..
Dongmei Zhi, Tri-institutional Center for Translational Research in Neuroimaging and Data Science: Georgia State University, Georgia Institute of Technology, Emory University, Atlanta, Georgia. Brainnetome Center and National Laboratory of Pattern Recognition, Institute of Automation, Chinese Academy of Sciences, Beijing, China and University of Chinese Academy of Sciences, Beijing, China..
Luxian Lv, Department of Psychiatry, Henan Mental Hospital, The Second Affiliated Hospital of Xinxiang Medical University, Xinxiang, China and Henan Key Lab of Biological Psychiatry, Xinxiang Medical University, Xinxiang, China..
Xiaohong Ma, Psychiatric Laboratory and Mental Health Center, the State Key Laboratory of Biotherapy, West China Hospital of Sichuan University, Chengdu, China and Huaxi Brain Research Center, West China Hospital of Sichuan University, Chengdu, China..
Qing Ke, Department of Neurology, The First Affiliated Hospital, Zhejiang University School of Medicine, Hangzhou, China..
Xianbin Li, Beijing Key Lab of Mental Disorders, Beijing Anding Hospital, Capital Medical University, Beijing, China..
Chuanyue Wang, Beijing Key Lab of Mental Disorders, Beijing Anding Hospital, Capital Medical University, Beijing, China..
Christopher. C. Abbott, Department of Psychiatry, University of New Mexico, Albuquerque, New Mexico, USA.
Jessica A. Turner, Tri-institutional Center for Translational Research in Neuroimaging and Data Science: Georgia State University, Georgia Institute of Technology, Emory University, Atlanta, Georgia. Department of Psychology and Neuroscience Institute, Georgia State University, Atlanta, Georgia
Robyn. L Miller, Department of Computer Science at Georgia State University, Atlanta, Georgia. Tri-institutional Center for Translational Research in Neuroimaging and Data Science: Georgia State University, Georgia Institute of Technology, Emory University, Atlanta, Georgia..
Vince D. Calhoun, Department of Computer Science at Georgia State University, Atlanta, Georgia. Wallace H. Coulter Department of Biomedical Engineering at Georgia Institute of Technology and Emory University, Atlanta, Georgia and with the Department of Electrical and Computer Engineering at Georgia Institute of Technology, Atlanta, Georgia. Tri-institutional Center for Translational Research in Neuroimaging and Data Science: Georgia State University, Georgia Institute of Technology, Emory University, Atlanta, Georgia. Department of Psychology and Neuroscience Institute, Georgia State University, Atlanta, Georgia.
REFERENCES
- [1].Fountoulakis KN, “The emerging modern face of mood disorders: A didactic editorial with a detailed presentation of data and definitions,” Annals of General Psychiatry, vol. 9, pp. 1–22, 2010. [DOI] [PMC free article] [PubMed] [Google Scholar]
- [2].Otte C et al. , “Major depressive disorder,” Nature Reviews Disease Primers, vol. 2, no. Mdd, pp. 1–21, 2016. [DOI] [PubMed] [Google Scholar]
- [3].Bromet et al. , “Cross-national epidemiology of DSM-IV major depressive episode.: EBSCOhost,” BMC Medicine, vol. 9, no. 90, 2011. [DOI] [PMC free article] [PubMed] [Google Scholar]
- [4].Kraus C, Kadriu B, Lanzenberger R, Zarate CA, and Kasper S, “Prognosis and improved outcomes in major depression: a review,” Translational Psychiatry, vol. 9, no. 1, 2019. [DOI] [PMC free article] [PubMed] [Google Scholar]
- [5].Yan CG et al. , “Reduced default mode network functional connectivity in patients with recurrent major depressive disorder,” Proceedings of the National Academy of Sciences of the United States of America, vol. 116, no. 18, pp. 9078–9083, 2019. [DOI] [PMC free article] [PubMed] [Google Scholar]
- [6].Yan C, Li L, Chen X, Castellanos FX, and Bai F, “Reduced but not Enhanced Default Mode Network Functional Connectivity in Major Depressive Disorder: Evidence from 25 Cohorts in the REST-meta-MDD Projec,” pp. 1–30, 2018. [Google Scholar]
- [7].Dutta A et al. , “Regional default mode network connectivity in major depressive disorder: modulation by acute intravenous citalopram,” Translational Psychiatry, vol. 9, no. 1, 2019. [DOI] [PMC free article] [PubMed] [Google Scholar]
- [8].Zhi D et al. , “Aberrant Dynamic Functional Network Connectivity and Graph Properties in Major Depressive Disorder,” Frontiers in Psychiatry, vol. 9, no. July, pp. 1–11, 2018. [DOI] [PMC free article] [PubMed] [Google Scholar]
- [9].Allen EA, Damaraju E, Plis SM, Erhardt EB, Eichele T, and Calhoun VD, “Tracking whole-brain connectivity dynamics in the resting state,” Cerebral Cortex, vol. 24, no. 3, pp. 663–676, 2014. [DOI] [PMC free article] [PubMed] [Google Scholar]
- [10].Hamilton M, “A rating scale for depression,” J. Neurol. Neurosurg. Psychiat, no. 23, pp. 56–63, 1960. [DOI] [PMC free article] [PubMed] [Google Scholar]
- [11].Du Y et al. , “NeuroMark: an adaptive independent component analysis framework for estimating reproducible and comparable fMRI biomarkers among brain disorders,” medRxiv, p. 19008631, 2019. [Google Scholar]
- [12].Calhoun VD, Miller R, Pearlson G, and Adali T, “The Chronnectome: Time-Varying Connectivity Networks as the Next Frontier in fMRI Data Discovery,” Neuron, vol. 84, no. 2, pp. 262–274, 2014. [DOI] [PMC free article] [PubMed] [Google Scholar]
- [13].Jafri MJ, Pearlson GD, Stevens M, and Calhoun VD, “A method for functional network connectivity among spatially independent resting-state components in schizophrenia,” NeuroImage, vol. 39, no. 4, pp. 1666–1681, 2008. [DOI] [PMC free article] [PubMed] [Google Scholar]
- [14].Wise T et al. , “Instability of default mode network connectivity in major depression: A two-sample confirmation study,” Translational Psychiatry, vol. 7, no. 4, 2017. [DOI] [PMC free article] [PubMed] [Google Scholar]
- [15].Li G et al. , “Large‐scale dynamic causal modeling of major depressive disorder based on resting‐state functional magnetic resonance imaging,” Human Brain Mapping, no. October, p. hbm.24845, 2019. [DOI] [PMC free article] [PubMed] [Google Scholar]
- [16].Van Buuren M, Gladwin TE, Zandbelt BB, Kahn RS, and Vink M, “Reduced functional coupling in the default-mode network during self-referential processing,” Human Brain Mapping, vol. 31, no. 8, pp. 1117–1127, 2010. [DOI] [PMC free article] [PubMed] [Google Scholar]
- [17].Fransson P and Marrelec G, “The precuneus/posterior cingulate cortex plays a pivotal role in the default mode network: Evidence from a partial correlation network analysis,” NeuroImage, vol. 42, no. 3, pp. 1178–1184, 2008. [DOI] [PubMed] [Google Scholar]
- [18].Martino M et al. , “Contrasting variability patterns in the default mode and sensorimotor networks balance in bipolar depression and mania,” Proceedings of the National Academy of Sciences of the United States of America, vol. 113, no. 17, pp. 4824–4829, 2016. [DOI] [PMC free article] [PubMed] [Google Scholar]


