

Abstract
Residues of oxytetracycline, tetracycline and chlortetracycline in seafood products of Saudi Arabia were detected by using a simple, sensitive and rapid method via HPLC-PDA.
The protein precipitation method that was used for sample extraction demonstrated high recoveries of OTC, TC and CTC. The limits of detection were 0.015 µg/g and 0.025,0.062 µg/g for all TCs in fish and shellfish, respectively. The limits of quantitation were 0.125 µg/g and 0.175 µg/g for all TCs in fish and shellfish, respectively. The method was precise and accurate since the RSD was less than 2%, while the % recovery was 95–105%. This study determined the occurrence of OTC, TC and CTC in seafood products that are sold in KSA’s markets. The overall occurrence of these three medications in 249 seafood products was 24%(n = 60), while 15%(n = 37) exceeded the MRL. Thus, our recommendations are to enhance the monitoring of food production prior to marketing and to educate people regarding the proper disposal of antibiotics.
Keywords: Tetracyclines, Environmental pollution, HPLC-DAD, Seafood products, Saudi market
1. Introduction
Environmental pollution is a critical issue that is faced all over the world. One of the leading causes of pollution is using antibiotics in an improper way (Liu et al., 2018). Antibiotics were ranked as the second most consumed drug in Saudi Arabia in 2010–2015, representing 17% of the total consumed drugs in Saudi Arabia (AlKhamees et al., 2018). They are widely used in agriculture, aquaculture, and livestock for the treatment and prophylaxis for many infections and as growth promoters (Gothwal and Shashidhar, 2015). As a result, there is an increase in the occurrence of antibiotics in the natural environment in many ways. Some are excreted in their active form via the urine or faeces after antibiotic administration (Li et al., 2015). In addition, some people dispose of remaining, unwanted antibiotics via flushing down drains or toilets. Additionally, some of the industries that manufacture antibiotics and other related products may generate environmental pollution if they do not use proper disposal methods. Furthermore, giving antibiotics to affected animals and applying antibiotics in the production of organic vegetables may also contribute to raising their presence in the environment (Li et al., 2015). All of these pathways lead to the ubiquitous presence of antibiotics around humans, such as in streams, lakes, rivers, soil, groundwater, plants, seawater and aquatic animals (Larsson, 2014). Antibiotics appear to be persistent or pseudo-persistent since the rate of their elimination is less than that of entering the environment (Gothwal and Shashidhar, 2015). The most crucial issue related to the presence of antibiotics in the environment is the potential resistance development in human and animal pathogens, which contributes to the increasing morbidity and mortality worldwide (Larsson, 2014).
Tetracyclines are a group of antibiotics that include tetracycline, oxytetracycline, chlortetracycline, doxycycline, and minocycline (Fig. 1) (Chopra and Roberts, 2001). They are widely used in veterinary medicine for many reasons: they are wide-spectrum, commonly available and inexpensive (Biswas et al., 2007). Particularly, enrofloxacin and oxytetracycline are commonly found veterinary drug residues in seafood products in many countries, such as Thailand, Vietnam, Indonesia, and Korea (Kang et al., 2018).
Fig. 1.
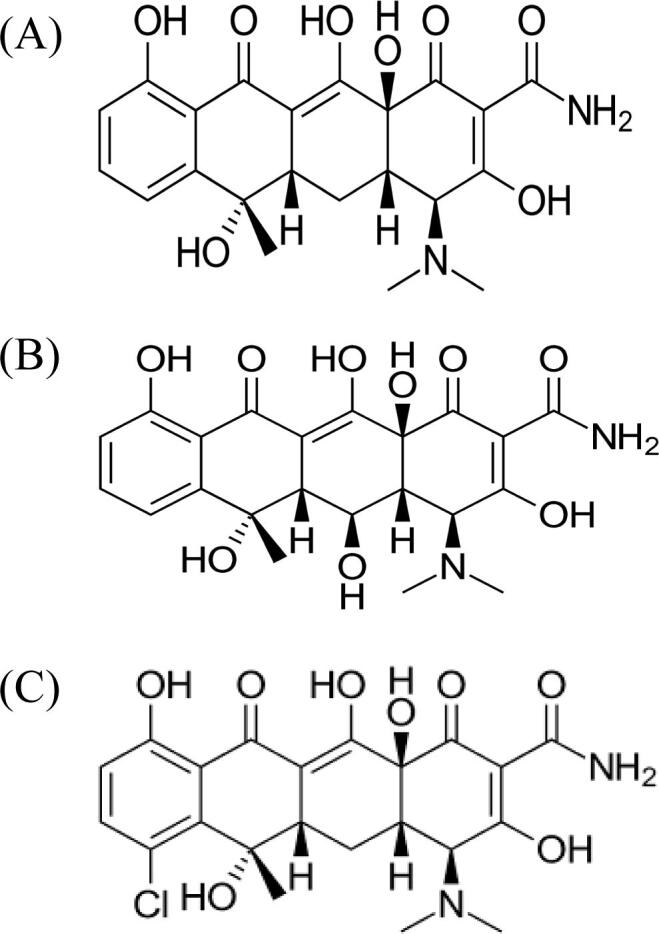
Chemical structure of (a) tetracycline, (b) oxytetracycline, and (c) chlortetracycline.
More than 70% of tetracycline antibiotics are excreted in their active forms into the environment through the urine and faeces of humans and animals. Tetracyclines are hydrophilic in nature and have a low volatile characteristic, which results in their continuous presence in the aquatic environment for long periods of time (Daghrir and Drogui, 2013).
The over- and misuse of tetracyclines may lead to the presence of its residues in edible animal tissues, which may cause allergic reactions in sensitive individuals. Moreover, the ingestion of tetracyclines may show undesirable effects, such as tooth discoloration and pigmentation (Vennila et al., 2014). In addition, teratogenicity may occur in a foetus if tetracyclines are administered to pregnant women (Speer et al., 1992). Additionally, they can cause retardation of skeletal growth in premature infants (Speer et al., 1992). Additionally, even food that contains only low residual levels of antibiotics, when consumed for a long period of time, may cause a person to develop antibiotic resistance (Cetinkaya et al., 2012, Liu et al., 2017).
Tetracycline resistance has many consequences, such as increasing morbidity and mortality rates, as well as extended hospital stays, therefore leading to an increase in medical costs. To minimize or prevent this serious issue, the world must change the practice of purchasing antibiotics in community pharmacies without prescriptions. In addition, a maximum allowed limit to be used or detected in animals should also be implemented. Although many new antibiotics are currently being developed to treat resistant infections, behaviour change regarding the use of antibiotics without a prescription is required (Liu et al., 2017). From this point forward, the SFDA set a rule that prohibits community pharmacies from selling antibiotics without a prescription.
In recent years, seafood has become one of the most consumed foods by humans due to the increase in the awareness of sources of healthy food (WHO, 2019). As per the Dietary Guidelines for Americans in 2010, 8 oz of seafood consumption per week is recommended (WHO, 2019). Oily fish are preferably recommended since oily fish, such as salmon and sardines, contain long-chain omega-3-fatty acids that help to keep the heart healthy (NHS, 2019).
To meet the demand in the increase in the consumption of seafood, the supply has also increased; therefore, aquaculture has been continuously developing to satisfy the need for seafood products (Seafood Production, 2019). However, enhancing productivity by intensive cultivation systems leads to the dissemination of diseases and infections. For this reason, medications, including antibiotics, are administered to the fish. As a consequence, residues from improper use or overdose of antibiotics adversely affect humans. Therefore, regulatory agencies have set a clear maximum residue limit for each medication of every animal to ensure human safety (FAO, 2015).
Although seafood is not a dietary staple in Saudi Arabia, there is a high request due to the increased annual fish consumption from 3 kg in 1977 to more than double (6.5) kg in 1998 (Lin, 2019). In 2002, the number of fish farms increased to 109. In 2008, that number significantly increased to 277 fish farms. Saudi Arabia produced 41% of all seafood from aquaculture sources in 2011. Currently, Saudi Arabia is one of the largest aquaculture producers in the Middle East (National Aquaculture Group, 2016).
Aquaculture has a very important role in food production. Productivity enhancement should be taken into consideration through intensive cultivation systems, which may cause the spread of diseases, including infections. Under these conditions, the health of the fish is threatened, and medications such as antibiotics are given to the affected fish (Olatoye and Basiru, 2013). In addition, antibiotics are administered for growth promotion. Oxytetracycline was the first antibiotic approved by the USFDA to be used in fish farms. It is widely used either for prophylaxis or treatment because of its wide spectrum. The second challenge faced by fish farms is improper medication choice or dose. In addition, some fish farms misuse antibiotics by using them in an uncontrollable way (Olatoye and Basiru, 2013).
To ensure the safety of foods for human consumption, the Saudi food and drug authority set a maximum residue level (MRL) in fish for some antibiotics as follows: oxytetracycline, 200 μg/kg; tetracycline, 200 μg/kg; and chlortetracycline, 200 μg/kg. On the other hand, the acceptable daily intake of these three medications is 0–30 μg/kg (FAO, 2015).
To ensure food safety, national and international regulatory agencieshaveestablished tolerance levels for authorized veterinary drugs, including tetracycline antimicrobials. Therefore, numerous sensitive and specific methods have been developed for the quantification of these compounds indifferent food matrices. More than eighty publications in a review by Pérez-Rodríguez et al. (2018) updated the overview of the determination of tetracycline residues in foodstuffs.
Various analytical methods have been developed for the multi-residue analysis of tetracyclines in fishery products, such as shrimp and fish, using liquid chromatography coupled with tandem mass spectrometry (LC-MS/MS) (Cháfer-Pericás et al., 2010, Guidi et al., 2018, Kang et al., 2018, Li et al., 2006, Lopes et al., 2012, Susakate et al., 2019).
One of the latest studies conducted by Barani and Fallah (2015)was published in 2014, and they used an ELISA kit for tetracycline determination because it is an inexpensive, convenient and rapid method. In addition, sample pre-treatment is not needed (Barani and Fallah, 2015). Moreover, two studies were published in 2013.
Olatoye and Basiru, 2013, Liu et al., 2013 used HPLC as an analytical method for the determination of antibacterial residues in fish because it is a rapid, sensitive and reliable method (Susakate et al., 2019). Additionally, in 1,999, Ueno et al. (1999) chose to use HPLC in their study due to its high sensitivity, and the pre-treatment procedure did not take a long time. Additionally, in 1995, Touraki et al. (1995).conducted a study that also implemented HPLC for its high level of efficiency
The available literature shows that to date, no study has been conducted in Saudi Arabia regarding the determination of antibiotic residues in seafood products. Therefore, the goal of this study was to detect and quantify the presence of oxytetracycline, tetracycline and chlortetracycline in seafood that is present in Saudi Arabia by using HPLC-PDA, which was chosen for its advantages of sensitivity and specificity and can therefore differentiate between different classes of antibiotics. In addition, HPLC-PDA gives adequate quantitative validation outcomes (Cristofani et al., 2009).
2. Experimental
2.1. Instrumentation and HPLC conditions
The HPLC system was equipped with a Waters 1525 binary pump and a 20 µl loop injector. A photo diode array 2998 detector and Empower software were used. The analytical column was a C18 column (250 mm × 4.6 mm, 3.5 µm particle size) from Macherey-NAGEL. The optimized mobile phase for separation was a mixture of 0.05 M oxalic acid, acetonitrile and methanol (70:20:10 V/V/V). The mobile phase was filtered through an MS® Nylon membrane filter with a pore size of 0.45 µm and then degassed by sonication for 15 min prior to use. The flow rate was1 ml/min. Detection was performed at 355 nm with a scanning range of 250–600 nm.
2.2. Materials and reagents
Pure standard chlortetracycline hydrochloride (95%), tetracycline and oxytetracycline (98%) were obtained from Medchemexpress, USA. Methanol was obtained from Fisher Chemical, UK. Deionized water was obtained from a milli Q water purification system and was filtered through a 0.22 µm Millipore membrane filter (Milford, MA, USA). Acetonitrile was purchased from Sigma-Aldrich (France). Sodium acetate, sodium hydrogen phosphate, potassium dihydrogen orthophosphate, trifluoroacetic acid and ethylene diamintetraaceticacid were purchased from LOBA CHEMIE, Mumbai, India. Oxalic acid dihydrate was obtained from WINLAB, UK. Citric acid and tri-sodium citrate2-hydrate were purchased from Avonchem, UK.
Acetic acid was obtained from S.D.FineChem Ltd., India.
2.3. Method
2.3.1. Stock solution and working solution preparation
Stock solutions were prepared by weighing 0.01 g from each standard and dissolving it in 10 ml of methanol to obtain a concentration of 1000 μg/ml. These stock solutions are kept protected from light, stored at −20 °C, and prepared monthly. The working solutions were prepared by taking 1 ml from the stock solutions and combining them each with 10 ml of methanol to obtain a concentration of 100 μg/ml. working solutions were prepared weekly, protected from light and stored at 4 °C.
2.3.2. Preparation of Matrix-Matched calibration standards
A series of calibration standards were prepared by spiking 2 g of antibiotic-free samples with standard solutions of the three antibiotics to yield final concentrations covering a range of0.25–12.5 μg/g for oxytetracycline (OTC), tetracycline (TC) and chlortetracycline (CTC). Spiked samples were then treated as mentioned later under ‘‘Sample Preparation”.
2.3.3. Sample collection
Seafood products were purchased from different areas around Saudi Arabia within three months (February-April) in 2019. A total of 249 seafood product samples were collected; 71 samples were fresh from the sea and collected in Jeddah, Dammam, and Jazan, including different types, and 22 samples were obtained from fish farms inside and outside the Kingdom of Saudi Arabia. A total of 106 samples were purchased frozen from local supermarkets and grocery stores, and 25samples were canned products, such as tuna and sardines. The remaining 24 samples were processed products. The samples information is shown in Table 1.
Table 1.
Samples information of seafood products from different areas around Saudi Arabia.
| Category | Food items |
|---|---|
| Fresh (n = 71) | Hamour(6), mullets (7), salmon(2), sardine(3), saddle Grouper (5), bagha (3), seabream (5), emperor(5), zbaidi(3), sirar (1), white fish (4), kanad (3),shari(3),faskar(2),oyoun (1), hamamarabi(4), lobster(1), squid (4), shrimp (7), red squid (1),white squid (1) |
| Frozen (n = 106) | Menimar(7), rohu(7), fish fillet (18), bana(6), bouh(6), marghal (1), banjash (5), calamari (4), crab (4), ayar (1), shrimp (22), fish* (25) |
| Aquaculture (n = 23) | Barramundi (2),baltiAlqassim (1),milk fish(1),bajash (3), rohu (8),banjash (5), white fish (1),shrimp (2) |
| Canned (n = 25) | Different brands of tuna (20) and sardine (5) |
| Processed (n = 24) | Salmon (1), fish finger (1), fish ball (1), fish nuggets (12), fish burger (8), herring fish (1) |
2.3.4. Sample preparation
As per a previous study, the muscles of fish, which are the edible tissues, were chopped and kept frozen (-20 °C) until the analysis time. Two grams of each sample was weighed into a polypropylene tube, and then 0.8 ml of 20% trifluoroacetic acid and 0.4 ml of 0.01 M EDTA were added (Cristofani et al., 2009, Hermansson, 1982). The mixture was vortexed for 2 min. A mixture of methanol: 0.01 M citrate, (pH4) (80:20), was added to obtain a total volume of 5 ml. The mixture was vortexed for 2 min and sonicated for 10 min at room temperature. After that, it was centrifuged at 4000 rpm for 20 min. The supernatant was filtered through a 0.22 µm nylon filter and injected into the HPLC for analysis.
3. Results
3.1. HPLC condition optimization
Different HPLC conditions were optimized for the purpose of obtaining good separation between the analysed tetracyclines, with good response and within a reasonable runtime. In this respect, both the stationary and mobile phases were investigated.
Based on previous studies for the separation of tetracycline, oxytetracycline and chlortetracycline standards, with minor changes (Biswas et al., 2007), the analytes were separated by using HPLC with a PDA set at wavelength 355 nm and a mobile phase composition of 0.01 M oxalic acid buffer:acetonitrile:methanol (77:18:5 V/V/V). The pH of the oxalic acid buffer was 1.87, and that of the final mobile phase was 2.32. The flow rate was 0.6 ml/min, a C18column (4.6 mm × 250 mm, 3.5 µm particle size) was used at a temperature of 35 °C, and the injection volume was 20 µl (Biswas et al., 2007). Unwanted outcomes were observed, as there was peak broadening and poor resolution. The retention times were as follows: OTC = 3.4 min, TC = 3.9 min and CTC = 7.8 min.
In the study by Abbasi et al. (2011), the best resolution and results (Fig. 2) were achieved with a mobile phase consisting of0.05 M oxalic acid buffer (pH 1.7)/acetonitrile/methanol (70:20:10, V/V/V),a flow rate of 1 ml/min, a C18 column (4.6 mm × 250 mm, 3.5 µm particle size)and an injection volume of 20 μl. The detection wavelength was set to 355 nm (Abbasi et al., 2011). The retention times for OTC, TC, and CTC were 4.361, 5.177, and 10.343 min, respectively.
Fig. 2.

a) A typical chromatogram of a mixed standard solution of the optimize condition (i) 10 μg/ml OTC, (ii) 10 μg/ml TC and (iii) 10 μg/ml CTC. b) The corresponding absorption spectra of each drug.
3.2. Sample extraction optimization
In this method, protein precipitation (PPT) was used as a sample preparation technique. Trifluoroacetic acid (20%) was used for this purpose (Dasenaki and Thomaidis, 2015, Hermansson, 1982). Additionally0.4 ml of 0.01 M EDTA was added to improve the extraction recovery of the tetracyclines since it acts to prevent their rapid chelation with metal ions (Hermansson, 1982). Although many other studies used more advanced sample preparation techniques, e.g., solid-phase extractions (SPE) (Abbasi et al., 2011)or liquid/liquid extractions (LLE) (Liu et al., 2013), PPT has many advantages compared with SPE and LLE. PPT is simpler, less time-consuming, and more economic because it does not require any special apparatus, particular gases or machinery (supplies, pumps, syringe, etc.). The extraction efficiency was evaluated using selected seafood samples with negligible “ND, not detected” TCs levels, being taken as blank samples. The extraction efficiency was evaluated by calculating the recoveries of the three TCs from spiked samples compared with standard solutions with the same nominal concentrations at three levels (0.25, 2.5, and 12.5 µg/g). After many trials, it was found that the best recoveries were shown by the extraction method of the studies (Cetinkaya et al., 2012, Shalaby et al., 2011) with minor changes, the separation of TCs in matrices shown in Fig. 3, Fig. 4.
Fig. 3.

A typical chromatogram of blank and spiked blank fish matrix(i) OTC, Rt = 4.5 min, (ii) TC,Rt = 5.3 min, (iii) CTC, Rt = 10.3 min.
Fig. 4.

A typical chromatogram of blank andspiked blank shellfish matrix (i) OTC, Rt = 4.5 min, (ii) TC,Rt = 5.3 min, (iii) CTC, Rt = 10.3 min.
3.3. Method validation
To evaluate the analytical methods, analytical parameters were measured based on the ICH Guidelines to confirm the validity of the method (ICH, 2019).
3.3.1. Linearity
The linearity of the chosen method was evaluated by using blank fish and shellfish samples spiked with standard solutions to construct calibration curves, which were populated with the area under the curve versus the concentration at five levels. The calibration curves were generated for each tetracycline in both fish and shellfish samples, and they showed excellent linearity within the concentration ranges that are shown in Table 2, Table 3.
Table 2.
Regression analysis data in the fish sample.
| TCs | Linearity range (µg/g) | Regression equation | R2 | LOD (µg/g) | LOQ (µg/g) |
|---|---|---|---|---|---|
| OTC | 0.125 – 12.5 | y = 10389x + 941.22 | 0. 99,995 | 0.015 | 0.125 |
| TC | 0.125 – 12.5 | y = 9422.1x − 309.43 | 0.9994 | 0.025 | 0.125 |
| CTC | 0.125 – 12.5 | y = 3669.8x + 976.9 | 0.99834 | 0.062 | 0.125 |
Table 3.
Regression analysis data in the shellfish sample.
| TCs | Linearity range (µg/g) | Regression equation | R2 | LOD (µg/g) | LOQ (µg/g) |
|---|---|---|---|---|---|
| OTC | 0.175–25 | y = 12611x – 1998.5 | 0.9996 | 0.015 | 0.175 |
| TC | 0.175–25 | y = 14380x − 1890.9 | 0.9999 | 0.025 | 0.175 |
| CTC | 0.175–25 | y = 7031.3x − 1879.1 | 0.9994 | 0.062 | 0.175 |
3.3.2. Limits of detection (LODs) and limits of quantization (LOQs)
The limits of detection and quantitation were measured by using the signal-to-noise ratio. The LOD was defined as the concentration yielding a signal-to-noise ratio of 3:1, and the LOQ was defines as the concentration yielding a signal-to-noise ratio of 10:1 according to the ICH guidelines. The LODs and LOQs of OTC, TC and CTC in the fish sample and shellfish samples are shown in Table 2, Table 3.
3.3.3. Precision and accuracy
To assess the accuracy and precision of the optimized method, % recovery, % error and relative standard deviation were calculated by spiking three blank fishsamplesat three different concentrations (0.25, 6.25, and 10 µg/g) and injecting them three times (n = 3) to obtain the intra-assay results, which were then repeated for 2 more consecutive days to obtain inter-assay variation (n = 9). The same procedure was performed for the shellfish matrix but with different concentrations (0.5, 10, and 20 µg/g). Since the RSD was less than 2%, the optimized method was determined to be precise
3.3.4. Extraction recovery
The extraction recovery was assessed using selected seafood samples that did not have detected levels of tetracyclines, which were used as a blank and fortified with OTC,TC and CTC at three different concentration levels (low, 0.25 μg/g; medium, 2.5 μg/g; and high, 12.5 μg/ g). The signal responses obtained after the samples underwent the extraction procedure were compared with those of standard solutions having the same nominal concentrations. The obtained recoveries ranged from 76.13 to 110.50%, indicating the high efficiency of the extraction procedure for tetracycline determination in seafood samples.
3.4. Occurrence of OTC, TC and CTC residues in seafood products
Following sample preparation, each sample was injected in triplicate into the HPLC system using the optimized chromatographic conditions. The identification of each tetracycline was performed via comparison of both the retention time and absorption spectra obtained using PDA to those of standards. Additionally, spiking samples with the suspected tetracyclines was essential in some situations. The calculated purity index within the threshold limits indicated the peak purity. OTC, TC and CTC were examined in the analysed samples. Typical chromatograms in some of the suspected samples of each seafood category are given in Fig. 5. The presence of tetracyclines within seafood categories is shown in Fig. 6.
Fig. 5.


. Typical chromatograms in some of detected samples of each seafood categoryshowing the TCs analyzed in each sample.
Fig.6.

The presence of tetracyclines within seafood categories.
The overall occurrence of these three medicationsin249 seafood products was 24% (n = 60), while 15% (n = 37) exceeded the MRL. Moreover, the findings showed that the occurrence of OTC in the frozen fish was 9% (n = 7), and 4% (n = 3)of them exceeded the MRL. On the other hand, OTC was found in 10% (n = 3) of the frozen shellfish. In addition, the results showed that 88% (n = 22) of the canned fish had detectable OTC levels, 52% of which exceeded the MRL, while OTC was found in 33% (n = 8) of processed fish, and 36% (n = 5) of the fresh shellfish samples had OTC. However, TC was detected in 10% (n = 3) and 9% (n = 7) of the shellfish and pure fish muscle, respectively, while one of the detected frozen shellfish samples had a TC concentration that exceeded the MRL. Additionally, TC was found in 4% (n = 1) of the canned fish samples, and it was higher than the MRL. Furthermore, TC was found in 54% (n = 13) of processed fish. In regard to CTC, the results showed that 2% (n = 1) of the fresh fish samples contained CTC. Moreover, it was detected in 58% (n = 14) and 11% (n = 8) of the processed and frozen fish, respectively, and all the samples containing CTC had concentrations that exceeded the MRL. Additionally, CTC was found in 13% (n = 4) of the shellfish samples, and the detected levels were higher than the MRL. The data show that the most common medication detected in our samples was oxytetracycline, followed by chlortetracycline and tetracycline. A study conducted in South Korea proved that oxytetracycline was one of the most commonly detected medications in fishery products (Kang et al., 2018). The outcome of a study from Iran highlighted hat 63% of the samples contained tetracycline residues (Barani and Fallah, 2015). A study from Nigeria also reported that 30.0% of catfish samples and 18.8% of fillets contained oxytetracycline residues (Olatoye and Basiru, 2013). OTC, TC, and CTC were mostly detected in processed samples, followed by frozen samples.
However, CTC was not detected in the canned samples. On the other hand, none of these three medications were found in the aquaculture products. The most frequent combination of the two medications presented in the detected samples was OTC with CTC, which may result from the approved use of chlortetracycline and oxytetracycline as feed additives in USFDA (Tables 4 and 5) (Dasenaki and Thomaidis, 2015).
Table 4.
Occurrence of TCs residues (µg/g) in fish samples.
| Pure fish muscle |
||||||
|---|---|---|---|---|---|---|
| Fresh (n = 57) | Frozen (n = 76) | Aquaculture (n = 21) | Canned (n = 25) | processed (n = 24) | ||
| OTC | Number of positive samples (% of total) | - | 7 (9%) | - | 22 (88%) | 8 (33%) |
| Mean of positive samples (µg/g) | – | 0.207 µg/g | – | 0.314 µg/g | 0.419 µg/g | |
| Range of positive samples (µg/g) | 0.104–0.305 µg/g | – | 0.084–1.3 µg/g | 0.167–1.81 µg/g | ||
| Mean overall (µg/g) | 0.019 µg/g | 0.275 µg/g | 0.14 µg/g | |||
| Exceed of MRL | 3(4%) | 13 (52%) | 5 (20%) | |||
| TC | Number of positive samples (% of total) | – | 7 (9%) | – | 1 (4%) | 13 (54%) |
| Mean of positive samples (µg/g) | – | 0.135 µg/g | – | 0.276 µg/g | 0.077 µg/g | |
| Range of positive samples (µg/g) | – | 0.085–0.233 µg/g | – | 0.276 µg/g | 0.028–0.302 µg/g | |
| Mean overall (µg/g) | – | 0.0125 µg/g | – | 0.011 µg/g | 0.041 µg/g | |
| Exceed of MRL | – | 1 (1%) | – | 1 (4%) | 1(4%) | |
| CTC | Number of positive samples (% of total) | 1(2%) | 8 (11%) | – | – | 14 (58%) |
| Mean of positive samples (µg/g) | 0.094 µg/g | 0.60 µg/g | – | – | 0.761 µg/g | |
| Range of positive samples (µg/g) | 0.094 µg/g | 0.39–0.75 µg/g | – | – | 0.23–4.03 µg/g | |
| Mean overall (µg/g) | 0.0016 µg/g | 0.06 µg/g | – | – | 0.44 µg/g | |
| Exceed of MRL | – | 8 (11%) | – | – | 14(58%) | |
Table 5.
Occurrence of TCs residues (µg/g) in shellfish samples.
| Fresh (n = 14) | Frozen (n = 30) | Aquaculture (n = 2) | ||
|---|---|---|---|---|
| OTC | Number of positive samples (% of total) | 5 (36%) | 3 (10%) | – |
| Mean of positive samples (µg/g) | 0.076 µg/g | 0.097 µg/g | – | |
| Range of positive samples (µg/g) | 0.055–0.098 µg/g | 0.021–0.18 µg/g | – | |
| Mean overall (µg/g) | 0.0271 µg/g | 0.009 µg/g | – | |
| Exceed of MRL | – | – | – | |
| TC | Number of positive samples (% of total) | – | 3 (10%) | – |
| Mean of positive samples (µg/g) | – | 0.133 µg/g | – | |
| Range of positive samples (µg/g) Exceed of MRL |
– | 0.019–0.224 µg/g | – | |
| Mean overall (µg/g) | – | 0.013 µg/g | – | |
| Exceed of MRL | – | 1(3%) | – | |
| CTC | Number of positive samples (% of total) | – | 4(13%) | – |
| Mean of positive samples (µg/g) | – | 2.145 µg/g | – | |
| Range of positive samples (µg/g) | – | 1.19–3.068 µg/g | – | |
| Mean overall (µg/g) | – | 0.286 µg/g | – | |
| Exceed of MRL | – | 4 (13%) | – |
4. Conclusion and recommendations
This study is the first study conducted in the kingdom of Saudi Arabia aimed at detecting the residues of OTC, TC and CTC in seafood products. Although there is a clear guideline set by the SFDA regarding the MRL of tetracyclines in seafood products, our findings show that more than 50% of the detected samples had higher levels than the MRL. This indicates the possibility of poor compliance with SFDA guidelines regarding the use of tetracyclines in seafood products. Therefore, we recommend more auditing in food production to ensure human safety. In addition, this study enhanced the importance of increasing the awareness of the proper disposal of antibiotics by health care’s providers and the public.
Compliance with Ethical Standards
Ethical approval
This article does not contain any studies with human participants or animals performed by any of the authors.
Funding
The authors would like to extend their appreciation to the Deanship of Scientific Research at King Saud University for its funding of this research through the research group project no. RGP-331.
Footnotes
Peer review under responsibility of King Saud University.
References
- Abbasi M.M., Babaei H., Ansarin M., Nourdadgar A.O., Nemati M. Simultaneous determination of tetracyclines residues in bovine milk samples by solid phase extraction and HPLC-FL method. Adv. Pharm. Bull. 2011;1:34–39. doi: 10.5681/apb.2011.005. [DOI] [PMC free article] [PubMed] [Google Scholar]
- AlKhamees O.A., AlNemer K.A., Bin Maneea M.W., AlSugair F.A., AlEnizi B.H., Alharf A.A. Top 10 most used drugs in the Kingdom of Saudi Arabia 2010–2015. Saudi Pharm. J. 2018;26(2):211–216. doi: 10.1016/j.jsps.2017.12.009. [DOI] [PMC free article] [PubMed] [Google Scholar]
- Barani A., Fallah A.A. Occurrence of tetracyclines, sulfonamides, fluoroquinolones and florfenicol in farmed rainbow trout in Iran. Food Agric. Immunol. 2015;26(3):420–429. doi: 10.1080/09540105.2014.950199. [DOI] [Google Scholar]
- Biswas A.K., Rao G.S., Kondaiah N., Anjaneyulu A.S.R., Mendiratta S.K., Prasad R., Malik J.K. A simple multi-residue method for determination of oxytetracycline, tetracycline and chlortetracycline in export buffalo meat by HPLC-photodiode array detector. J. Food Drug Anal. 2007;15:278–284. doi: 10.38212/2224-6614.2419. [DOI] [Google Scholar]
- Cetinkaya F., Yibar A., Soyutemiz G.E., Okutan B., Ozcan A., Karaca M.Y. Determination of tetracycline residues in chicken meat by liquid chromatography-tandem mass spectrometry. Food Addit. Contam. Part B Surveill. 2012;5(1):45–49. doi: 10.1080/19393210.2012.655782. [DOI] [PubMed] [Google Scholar]
- Cháfer-Pericás C., Maquieira Á., Puchades R., Company B., Miralles J., Moreno A. Multiresidue determination of antibiotics in aquaculture fish samples by HPLC–MS/MS. Aquac. Res. 2010;41:e217–e225. doi: 10.1111/j.1365-2109.2010.02504.x. [DOI] [Google Scholar]
- Chopra I., Roberts M. Tetracycline antibiotics: mode of action, applications, molecular biology, and epidemiology of bacterial resistance. Microbiol. Mol. Biol. Rev. 2001;65(2):232–260. doi: 10.1128/MMBR.65.2.232-260.2001. [DOI] [PMC free article] [PubMed] [Google Scholar]
- Cristofani E., Antonini C., Tovo G., Fioroni L., Piersanti A., Galarini R. A confirmatory method for the determination of tetracyclines in muscle using high-performance liquid chromatography with diode-array detection. Anal. Chim. Acta. 2009;637(1-2):40–46. doi: 10.1016/j.aca.2008.10.029. [DOI] [PubMed] [Google Scholar]
- Daghrir R., Drogui P. Tetracycline antibiotics in the environment: a review. Environ. Chem. Lett. 2013;11(3):209–227. doi: 10.1007/s10311-013-0404-8. [DOI] [Google Scholar]
- Dasenaki M.E., Thomaidis N.S. Multi-residue determination of 115 veterinary drugs and pharmaceutical residues in milk powder, butter, fish tissue and eggs using liquid chromatography-tandem mass spectrometry. Anal. Chim. Acta. 2015;880:103–121. doi: 10.1016/j.aca.2015.04.013. [DOI] [PubMed] [Google Scholar]
- FAO . FAO; Rome, Italy: 2015. Maximum Residue Limits CODEXALIMENTARIUS FAO-WHO. [Google Scholar]
- Gothwal R., Shashidhar T. Antibiotic pollution in the environment: a review. CLEAN – Soil Air. Water. 2015;43(4):479–489. doi: 10.1002/clen.v43.410.1002/clen.201300989. [DOI] [Google Scholar]
- Guidi L.R., Santos F.A., Ribeiro A.C.S.R., Fernandes C., Silva L.H.M., Gloria M.B.A. Quinolones and tetracyclines in aquaculture fish by a simple and rapid LC-MS/MS method. Food Chem. 2018;245:1232–1238. doi: 10.1016/j.foodchem.2017.11.094. [DOI] [PubMed] [Google Scholar]
- Hermansson J. Rapid determination of tetracycline and lumecycline in human plasma and urine using high-performance liquid chromatography. J. Chromatogr. B: Biomedical Sciences and Applications. 1982;232(2):385–393. doi: 10.1016/S0378-4347(00)84178-X. [DOI] [PubMed] [Google Scholar]
- ICH, 2019. https://www.ich.org/fileadmin/Public_Web_Site/ICH_Products/Guidelines/Quality/Q2_R1/Step4/Q2_R1__Guideline.
- Kang H.S., Lee S.B., Shin D., Jeong J., Hong J.H., Rhee G.S. Occurrence of veterinary drug residues in farmed fishery products in South Korea. Food Control. 2018;85:57–65. doi: 10.1016/j.foodcont.2017.09.019. [DOI] [Google Scholar]
- Larsson D.G.J. Antibiotics in the environment. Upsala J. Med. Sci. 2014;119(2):108–112. doi: 10.3109/03009734.2014.896438. [DOI] [PMC free article] [PubMed] [Google Scholar]
- Li H., Kijak P.J., Turnipseed S.B., Cui W. Analysis of veterinary drug residues in shrimp: a multi-class method by liquid chromatography-quadrupole ion trap mass spectrometry. J. Chromatogr. B Analyt. Technol. Biomed. Life Sci. 2006;836(1-2):22–38. doi: 10.1016/j.jchromb.2006.03.025. [DOI] [PubMed] [Google Scholar]
- Li X., Xie Y., Li L., Yang X., Wang N., Wang J. Using robust Bayesian network to estimate the residuals of fluoroquinolone antibiotic in soil. Environ. Sci. Pollut. Res. 2015;22(22):17540–17549. doi: 10.1007/s11356-015-4751-9. [DOI] [PubMed] [Google Scholar]
- Lin, M.H., 2019. ICDF aquaculture development in the kingdom of Saudi Arabia. http://www.icdf.org.tw/web_pub/20020702140316aquasaudi.pdf.
- Liu X., Lu S., Meng W., Zheng B. Residues and health risk assessment of typical antibiotics in aquatic products from the Dongting Lake, China—“Did you eat “Antibiotics” today?”. Environ. Sci. Pollut. Res. 2018;25(4):3913–3921. doi: 10.1007/s11356-017-0745-0. [DOI] [PubMed] [Google Scholar]
- Liu X., Steele J.C., Meng X.Z. Usage, residue, and human health risk of antibiotics in Chinese aquaculture: a review. Environ. Pollut. 2017;223:161–169. doi: 10.1016/j.envpol.2017.01.003. [DOI] [PubMed] [Google Scholar]
- Liu Y., Yang H., Yang S., Hu Q., Cheng H., Liu H., Qiu Y. High-performance liquid chromatography using pressurized liquid extraction for the determination of seven tetracyclines in egg, fish and shrimp. J. Chromatogr. B Analyt. Technol. Biomed. Life Sci. 2013;917–918:11–17. doi: 10.1016/j.jchromb.2012.12.036. [DOI] [PubMed] [Google Scholar]
- Lopes R.P., Reyes R.C., Romero-González R., Vidal J.L.M., Frenich A.G. Multiresidue determination of veterinary drugs in aquaculture fish samples by ultra high performance liquid chromatography coupled to tandem mass spectrometry. J. Chromatogr. B. 2012;895–896:39–47. doi: 10.1016/j.jchromb.2012.03.011. [DOI] [PubMed] [Google Scholar]
- National Aquaculture Group, 2016. Aquaculture in Saudi Arabia. http://www.naqua.com.sa/.
- NHS . NHS; London, UK: 2019. Fish and Shellfish. [Google Scholar]
- Olatoye I.O., Basiru A. Antibiotic usage and oxytetracycline residue in African Catfish (Clarias gariepinus) in Ibadan. Nigeria. World J. Fish Mar. Sci. 2013;5:302–309. [Google Scholar]
- Pérez-Rodríguez M., Pellerano R.G., Pezza L., Pezza H.R. An overview of the main foodstuff sample preparation technologies for tetracycline residue determination. Talanta. 2018;182:1–21. doi: 10.1016/j.talanta.2018.01.058. [DOI] [PubMed] [Google Scholar]
- Production S. National Academy Press; Washington, DC: 2019. Seafood Production, Distribution, and Consumption-Seafood Safety. [Google Scholar]
- Shalaby A.R., Salama N.A., Abou-Raya S.H., Emam W.H., Mehaya F.M. Validation of HPLC method for determination of tetracycline residues in chicken meat and liver. Food Chem. 2011;124(4):1660–1666. doi: 10.1016/j.foodchem.2010.07.048. [DOI] [PubMed] [Google Scholar]
- Speer B.S., Shoemaker N.B., Salyers A.A. Bacterial resistance to tetracycline: mechanisms, transfer, and clinical significance. Clin. Microbiol. Rev. 1992;5(4):387–399. doi: 10.1128/CMR.5.4.387. [DOI] [PMC free article] [PubMed] [Google Scholar]
- Susakate S., Poapolathep S., Chokejaroenrat C., Tanhan P., Hajslova J., Giorgi M., Saimek K., Zhang Z., Poapolathep A. Multiclass analysis of antimicrobial drugs in shrimp muscle by ultra high performance liquid chromatography-tandem mass spectrometry. J. Food Drug Anal. 2019;27(1):118–134. doi: 10.1016/j.jfda.2018.06.003. [DOI] [PMC free article] [PubMed] [Google Scholar]
- Touraki M., Rigas P., Pergandas P., Kastritsis C. Determination of oxytetracycline in the live fish feed Artemia using high-performance liquid chromatography with ultraviolet detection. J. Chromatogr. B: Biomedical Sciences and Applications. 1995;663(1):167–171. doi: 10.1016/0378-4347(94)00434-7. [DOI] [PubMed] [Google Scholar]
- Ueno R., Sangrungruang K., Miyakawa M. A simplified method for the determination of several fish drugs in edible fish and shrimp by high-performance liquid chromatography. Food Res. Int. (Ott. Ont.) 1999;32(9):629–633. doi: 10.1016/S0963-9969(99)00136-2. [DOI] [Google Scholar]
- Vennila V., Madhu V., Rajesh R., Ealla K.K., Velidandla S.R., Santoshi S. Tetracycline-induced discoloration of deciduous teeth: case series. J. Int. Oral Health. 2014;6:115–119. [PMC free article] [PubMed] [Google Scholar]
- WHO . WHO; Geneva, Switzerland: 2019. Global and Regional Food Consumption Patterns and Trends. [Google Scholar]