

Abstract
Severe viral infections, including SARS-COV-2, could trigger disruption of the balance between pro-oxidant and antioxidant mediators; the magnitude of which could reflect the severity of infection and lung injury. Using publicly available COVID-19 transcriptomic datasets, we conducted an in-silico analyses to evaluate the expression levels of 125 oxidative stress genes, including 37 pro-oxidant genes, 32 oxidative-responsive genes, and 56 antioxidant genes. Seven oxidative stress genes were found to be upregulated in whole blood and lung autopsies (MPO, S100A8, S100A9, SRXN1, GCLM, SESN2, and TXN); these genes were higher in severe versus non-severe COVID-19 leucocytes. Oxidative genes were upregulated in inflammatory cells comprising macrophages and CD8+ T cells isolated from bronchioalveolar fluid (BALF), and neutrophils isolated from peripheral blood. MPO, S100A8, and S100A9 were top most upregulated oxidative markers within COVID-19's lung autopsies, whole blood, leucocytes, BALF derived macrophages and circulating neutrophils. The calprotectin's, S100A8 and S100A9 were upregulated in SARS-COV-2 infected human lung epithelium. To validate our in-silico analysis, we conducted qRT-PCR to measure MPO and calprotectin's levels in blood and saliva samples. Relative to uninfected donor controls, MPO, S100A8 and S100A9 were significantly higher in blood and saliva of severe versus asymptomatic COVID-19 patients. Compared to other different viral respiratory infections, coronavirus infection showed a prominent upregulation in oxidative stress genes with MPO and calprotectin at the top of the list. In conclusion, SARS-COV-2 induce the expression of oxidative stress genes via both immune as well as lung structural cells. The observed correlation between oxidative stress genes dysregulation and COVID-19 disease severity deserve more attention. Mechanistical studies are required to confirm the correlation between oxidative stress gene dysregulation, COVID-19 severity, and the net oxidative stress balance.
Keywords: SARS-COV-2, COVID-19, Oxidative stress, Antioxidant, Pro-oxidant, Neutrophils, Myeloperoxidase, Calprotectin, S100A8, S100A9, Bioinformatics, Saliva, Lung autopsies, Respiratory viral infection
Graphical abstract
Abbreviations
- AMPK
AMP-activated protein kinase
- ARDS
Acute respiratory distress syndrome
- AREs
Antioxidant response elements
- BALF
Bronchioalveolar fluid
- COVID-19
Coronavirus disease 2019
- DEGs
Differentially expressed genes
- DSREC
Dubai Scientific Research Ethics Committee
- FC
Fold-change
- GO
Gene Ontology
- IAV
Influenza A
- ICU
Intensive care unit
- IQR
Interquartile range
- NETs
Neutrophil extracellular traps
- NOX2
NAPDH oxidase
- NRF2
Nuclear factor-erythroid 2 related factor 2
- PBMCs
Peripheral blood mononuclear cells
- RMA
Robust Multi-Array Average
- RSV
Respiratory syncytial virus
- SARS-COV-2
Severe acute respiratory syndrome coronavirus 2
- SOD
Superoxide dismutase
- TLR4
Toll-like receptor 4
1. Introduction
The severity of coronavirus disease 2019 (COVID-19), caused by severe acute respiratory syndrome coronavirus 2 (SARS-COV-2), ranges from asymptomatic to life-threatening infection [[1], [2], [3], [4]]. Severe COVID-19 disease has been associated with innate immune dysregulation, early immunosuppression, lymphopenia, vascular thrombosis, hypoxia, and cytokine storm [[5], [6], [7], [8]].
Many severe viral infections cause oxidative mediated cellular injury through activation of phagocytes, production of reactive oxygen species, and release of pro-oxidant cytokine and inflammatory mediators. Similarly, SARS-COV-2 respiratory viral infection could trigger disruption of the balance between pro-oxidant and antioxidant mediators; the magnitude of this imbalance could, hence, reflect the severity of COVID-19 disease and lung injury. In fact, comorbidities with known impaired redox balance such as cardiometabolic disorders, cancer, and chronic obstructive pulmonary diseases were associated with severe COVID-19 and high mortality rate [[9], [10], [11]].
Oxidative stress level predicts poor prognosis in respiratory viral infection. NAPDH oxidase (NOX2) and dual oxidase enzymes (Duox1 and Duox2) pro-oxidative markers are induced by influenza A (IAV) infection and cause severe lung injury [12]. In addition, production of neutrophil extracellular traps and myeloperoxidase oxidants are triggered by H7N9 and H1N1 viral infection, and correlate with poor prognosis [13]. Alternatively, severe respiratory syncytial virus bronchiolitis cause decrease in expression of antioxidant markers including Superoxide dismutase (SOD), catalase, and glutathione peroxidase [14].
SARS-COV-2 infect lung cells by binding to the host ACE2 receptors that are abundantly expressed in both type II alveolar epithelial cells [15] and multi-ciliated epithelial cells [16]. This viral infection could potentially cause acute respiratory distress syndrome (ARDS) with extreme drop in ACE2 levels [17,18]. ACE2 plays a critical role in regulation of redox balance; it catalyzes conversion of vasoconstrictor angiotensin II peptide into vasodilator angiotensin1-7. The downregulation of ACE2 expression observed with SARS-C-OV-2 infection, would enable unopposed binding of angiotensin II to AT1 receptors, which in turn activates NADPH oxidase, and augments production of reactive oxygen species [19,20]. Expected Cellular response to oxidative stress is mediated by Nuclear factor-erythroid 2 related factor 2 (NRF2) which activate the host antioxidant defense by encoding transcription of oxidative-responsive and antioxidant genes which contain antioxidant response elements (AREs) including thioredoxins, sestrins, and glutathione system [[21], [22], [23]]. The protective NRF2 antioxidant signaling was found to be suppressed in severe COVID-19 lung autopsies as well as SARS-COV-2 in-vitro infection model [24]. These findings could suggest that SARS-COV-2 target NRF2 as an evasion mechanism to enhance their viral survival and replication [24].
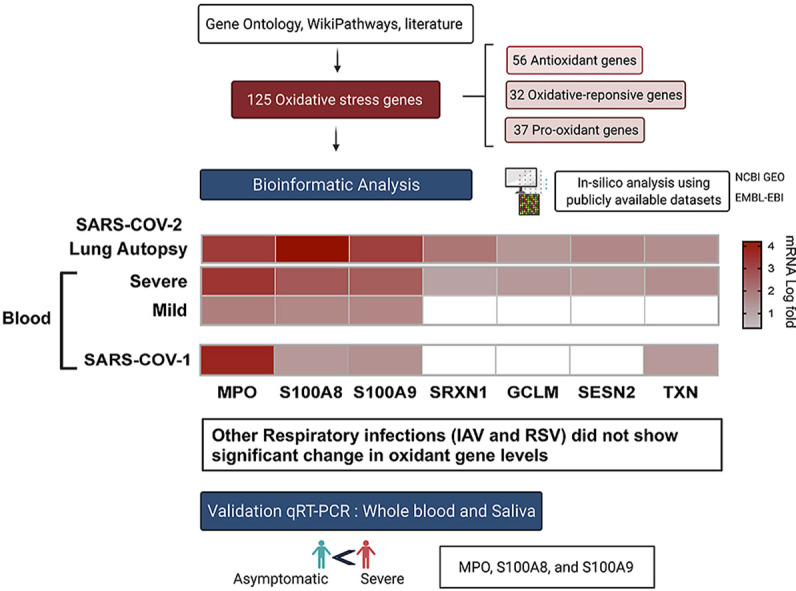
Although the contribution of oxidative stress to disease pathogenesis had been explored in several viral infection [28,29], its relevance to COVID-19 respiratory infection deserves more attention [25,26]. This is due to the fact that immune derangement during SARS-C-OV-2 infection could switch on a lethal cycle of oxidative stress, inflammation and lung tissue injury. Therefore, the aim of the current study is to evaluate the dysregulation of oxidative balance during SARS-COV-2 infection through measuring the gene expression levels of 125 oxidative stress genes known to be associated with proinflammatory, antimicrobial, oxidant-scavenging and apoptosis-inducing activities.
2. Method
For this study, we first established a list of 125 oxidative stress genes including: 37 pro-oxidant genes, 32 oxidative-responsive genes, and 56 antioxidant genes (Table 1, Table 2, Table 3 ). The oxidative stress genes were derived from Gene Ontology (GO) term: 0006979 (response to oxidative stress), WikiPathways oxidative stress database [27], and a number of previous reports [[28], [29], [30], [31]]. The expression of these genes was evaluated using publicly available transcriptomic COVID-19 whole transcriptomic and single-cell datasets of samples obtained from bronchioalveolar fluid (BALF), lung autopsies, and whole blood of COVID-19 patients with different disease severity. We also compared between the blood oxidative stress gene expression levels of COVID-19 and three respiratory infections: SARS-COV-1, influenza (IAV), and respiratory syncytial virus (RSV). These datasets were publicly available at National Center for Biotechnology Information Gene Expression Omnibus (NCBI GEO, http://www.ncbi.nlm.nih.gov/geo) and the European Bioinformatics Institute (EMBL-EBI, https://www.ebi.ac.uk) were used.
Table 1.
Pro-oxidant gene signatures.
| Gene | Approved name | HGNC ID | Location |
|---|---|---|---|
| ACOX1 | acyl-CoA oxidase 1 | HGNC:119 | 17q25.1 |
| ACOX3 | acyl-CoA oxidase 3, pristanoyl | HGNC:121 | 4p16.1 |
| AOC1 | amine oxidase copper containing 1 | HGNC:80 | 7q36.1 |
| AOC2 | amine oxidase copper containing 2 | HGNC:549 | 17q21.31 |
| AOC3 | amine oxidase copper containing 3 | HGNC:550 | 17q21.31 |
| AOX1 | aldehyde oxidase 1 | HGNC:553 | 2q33.1 |
| CYBA | cytochrome b-245 alpha chain | HGNC:2577 | 16q24.2 |
| CYBB | cytochrome b-245 beta chain | HGNC:2578 | Xp21.1-p11.4 |
| DAO | d-amino acid oxidase | HGNC:2671 | 12q24.11 |
| DDO | d-aspartate oxidase | HGNC:2727 | 6q21 |
| DUOX1 | dual oxidase 1 | HGNC:3062 | 15q21.1 |
| DUOX2 | dual oxidase 2 | HGNC:13,273 | 15q21.1 |
| GFER | growth factor, augmenter of liver regeneration | HGNC:4236 | 16p13.3 |
| HAO1 | hydroxyacid oxidase 1 | HGNC:4809 | 20p12.3 |
| HAO2 | hydroxyacid oxidase 2 | HGNC:4810 | 1p12 |
| IL4I1 | interleukin 4 induced 1 | HGNC:19,094 | 19q13.33 |
| LOX | lysyl oxidase | HGNC:6664 | 5q23.1 |
| MAOA | monoamine oxidase A | HGNC:6833 | Xp11.3 |
| MAOB | monoamine oxidase B | HGNC:6834 | Xp11.3 |
| MPO | myeloperoxidase | HGNC:7218 | 17q22 |
| NCF2 | neutrophil cytosolic factor 2 | HGNC:7661 | 1q25.3 |
| NOS1 | nitric oxide synthase 1 | HGNC:7872 | 12q24.22 |
| NOS2 | nitric oxide synthase 2 | HGNC:7873 | 17q11.2 |
| NOS3 | nitric oxide synthase 3 | HGNC:7876 | 7q36.1 |
| NOX1 | NADPH oxidase 1 | HGNC:7889 | Xq22.1 |
| NOX3 | NADPH oxidase 3 | HGNC:7890 | 6q25.3 |
| NOX4 | NADPH oxidase 4 | HGNC:7891 | 11q14.3 |
| NOX5 | NADPH oxidase 5 | HGNC:14,874 | 15q23 |
| PAOX | polyamine oxidase | HGNC:20,837 | 10q26.3 |
| PCYOX1 | prenylcysteine oxidase 1 | HGNC:20,588 | 2p13.3 |
| PIPOX | pipecolic acid and sarcosine oxidase | HGNC:17,804 | 17q11.2 |
| PNPO | pyridoxamine 5′-phosphate oxidase | HGNC:30,260 | 17q21.32 |
| QSOX1 | quiescin sulfhydryl oxidase 1 | HGNC:9756 | 1q25.2 |
| QSOX2 | quiescin sulfhydryl oxidase 2 | HGNC:30,249 | 9q34.3 |
| SMOX | spermine oxidase | HGNC:15,862 | 20p13 |
| SUOX | sulfite oxidase | HGNC:11,460 | 12q13.2 |
Table 2.
Oxidative responsive gene signatures.
| Gene | Approved name | HGNC ID | Location |
|---|---|---|---|
| ANGPTL7 | angiopoietin like 7 | HGNC:24,078 | 1p36.22 |
| APOA4 | apolipoprotein A4 | HGNC:602 | 11q23.3 |
| APTX | Aprataxin | HGNC:15,984 | 9p21.1 |
| ATOX1 | antioxidant 1 copper chaperone | HGNC:798 | 5q33.1 |
| CYGB | cytoglobin | HGNC:16,505 | 17q25.1 |
| CYP1A1 | cytochrome P450 family 1 subfamily A member 1 | HGNC:2595 | 15q24.1 |
| DGKK | diacylglycerol kinase kappa | HGNC:32,395 | Xp11.22 |
| DHCR24 | 24-dehydrocholesterol reductase | HGNC:2859 | 1p32.3 |
| DUSP1 | dual specificity phosphatase 1 | HGNC:3064 | 5q35.1 |
| GCLM | glutamate-cysteine ligase modifier subunit | HGNC:4312 | 1p22.1 |
| GLRX2 | glutaredoxin 2 | HGNC:16,065 | 1q31.2 |
| IPCEF1 | interaction protein for cytohesin exchange factors 1 | HGNC:21,204 | 6q25.2 |
| MGST1 | microsomal glutathione S-transferase 1 | HGNC:7061 | 12p12.3 |
| MSRA | methionine sulfoxide reductase A | HGNC:7377 | 8p23.1 |
| MT1X | metallothionein 1X | HGNC:7405 | 16q13 |
| NFE2L2 | nuclear factor, erythroid 2 like 2 | HGNC:7782 | 2q31.2 |
| NFIX | nuclear factor I X | HGNC:7788 | 19p13.13 |
| NFKB1 | nuclear factor kappa B subunit 1 | HGNC:7794 | 4q24 |
| NUDT1 | nudix hydrolase 1 | HGNC:8048 | 7p22.3 |
| OXSR1 | oxidative stress responsive kinase 1 | HGNC:8508 | 3p22.2 |
| PDLIM1 | PDZ and LIM domain 1 | HGNC:2067 | 10q23.33 |
| PNKP | polynucleotide kinase 3′-phosphatase | HGNC:9154 | 19q13.33 |
| PRNP | prion protein | HGNC:9449 | 20p13 |
| RNF7 | ring finger protein 7 | HGNC:10,070 | 3q23 |
| S100A7 | S100 calcium binding protein A7 | HGNC:10,497 | 1q21.3 |
| S100A8 | S100 calcium binding protein A8 | HGNC:10,498 | 1q21.3 |
| S100A9 | S100 calcium binding protein A9 | HGNC:10,499 | 1q21.3 |
| SCARA3 | scavenger receptor class A member 3 | HGNC:19,000 | 8p21.1 |
| SGK2 | serum/glucocorticoid regulated kinase 2 | HGNC:13,900 | 20q13.12 |
| SGK3 | serum/glucocorticoid regulated kinase family member 3 | HGNC:10,812 | 8q13.1 |
| SP1 | Sp1 transcription factor | HGNC:11,205 | 12q13.13 |
| SRXN1 | sulfiredoxin 1 | HGNC:16,132 | 20p13 |
| STK25 | serine/threonine kinase 25 | HGNC:11,404 | 2q37.3 |
Table 3.
Antioxidant gene signatures.
| Approved symbol | Approved name | HGNC ID | Location |
|---|---|---|---|
| CAT | Catalase | HGNC:1516 | 11p13 |
| CTH | cystathionine gamma-lyase | HGNC:2501 | 1p31.1 |
| DRD1 | dopamine receptor D1 | HGNC:3020 | 5q35.2 |
| DRD2 | dopamine receptor D2 | HGNC:3023 | 11q23.2 |
| DRD3 | dopamine receptor D3 | HGNC:3024 | 3q13.31 |
| DRD4 | dopamine receptor D4 | HGNC:3025 | 11p15.5 |
| DRD5 | dopamine receptor D5 | HGNC:3026 | 4p16.1 |
| ERCC1 | ERCC excision repair 1, endonuclease non-catalytic subunit | HGNC:3433 | 19q13.32 |
| ERCC2 | ERCC excision repair 2, TFIIH core complex helicase subunit | HGNC:3434 | 19q13.32 |
| ERCC3 | ERCC excision repair 3, TFIIH core complex helicase subunit | HGNC:3435 | 2q14.3 |
| ERCC6 | ERCC excision repair 6, chromatin remodeling factor | HGNC:3438 | 10q11.23 |
| ERCC8 | ERCC excision repair 8, CSA ubiquitin ligase complex subunit | HGNC:3439 | 5q12.1 |
| FGF5 | fibroblast growth factor 5 | HGNC:3683 | 4q21.21 |
| FOS | Fos proto-oncogene, AP-1 transcription factor subunit | HGNC:3796 | 14q24.3 |
| GCLC | glutamate-cysteine ligase catalytic subunit | HGNC:4311 | 6p12.1 |
| GPX1 | glutathione peroxidase 1 | HGNC:4553 | 3p21.31 |
| GPX3 | glutathione peroxidase 3 | HGNC:4555 | 5q33.1 |
| GPX4 | glutathione peroxidase 4 | HGNC:4556 | 19p13.3 |
| GSR | glutathione-disulfide reductase | HGNC:4623 | 8p12 |
| GSS | glutathione synthetase | HGNC:4624 | 20q11.22 |
| GSTA1 | glutathione S-transferase alpha 1 | HGNC:4626 | 6p12.2 |
| GSTM1 | glutathione S-transferase mu 1 | HGNC:4632 | 1p13.3 |
| GSTM3 | glutathione S-transferase mu 3 | HGNC:4635 | 1p13.3 |
| GSTP1 | glutathione S-transferase pi 1 | HGNC:4638 | 11q13.2 |
| GSTT1 | glutathione S-transferase theta 1 | HGNC:4641 | 22q11.23 |
| GSTT2 | glutathione S-transferase theta 2 (gene/pseudogene) | HGNC:4642 | 22q11.23 |
| HMOX1 | heme oxygenase 1 | HGNC:5013 | 22q12.3 |
| HMOX2 | heme oxygenase 2 | HGNC:5014 | 16p13.3 |
| JUNB | JunB proto-oncogene, AP-1 transcription factor subunit | HGNC:6205 | 19p13.13 |
| MAPK10 | mitogen-activated protein kinase 10 | HGNC:6872 | 4q21.3 |
| MAPK14 | mitogen-activated protein kinase 14 | HGNC:6876 | 6p21.31 |
| MTHFR | methylenetetrahydrofolate reductase | HGNC:7436 | 1p36.22 |
| NDUFA12 | NADH: ubiquinone oxidoreductase subunit A12 | HGNC:23,987 | 12q22 |
| NDUFA6 | NADH: ubiquinone oxidoreductase subunit A6 | HGNC:7690 | 22q13.2 |
| NDUFB4 | NADH: ubiquinone oxidoreductase subunit B4 | HGNC:7699 | 3q13.33 |
| NDUFS2 | NADH: ubiquinone oxidoreductase core subunit S2 | HGNC:7708 | 1q23.3 |
| NDUFS8 | NADH: ubiquinone oxidoreductase core subunit S8 | HGNC:7715 | 11q13.2 |
| NQO1 | NAD(P)H quinone dehydrogenase 1 | HGNC:2874 | 16q22.1 |
| PARK7 | Parkinsonism associated deglycase | HGNC:16,369 | 1p36.23 |
| PON1 | paraoxonase 1 | HGNC:9204 | 7q21.3 |
| PON2 | paraoxonase 2 | HGNC:9205 | 7q21.3 |
| PPARGC1A | PPARG coactivator 1 alpha | HGNC:9237 | 4p15.2 |
| PRDX2 | peroxiredoxin 2 | HGNC:9353 | 19p13.13 |
| PRDX5 | peroxiredoxin 5 | HGNC:9355 | 11q13.1 |
| PRDX6 | peroxiredoxin 6 | HGNC:16,753 | 1q25.1 |
| SELENOP | selenoprotein P | HGNC:10,751 | 5p12 |
| SELENOS | selenoprotein S | HGNC:30,396 | 15q26.3 |
| SESN2 | sestrin 2 | HGNC:20,746 | 1p35.3 |
| SOD1 | superoxide dismutase 1 | HGNC:11,179 | 21q22.11 |
| SOD2 | superoxide dismutase 2 | HGNC:11,180 | 6q25.3 |
| SOD3 | superoxide dismutase 3 | HGNC:11,181 | 4p15.2 |
| TXN | thioredoxin | HGNC:12,435 | 9q31.3 |
| TXN2 | thioredoxin 2 | HGNC:17,772 | 22q12.3 |
| TXNRD1 | thioredoxin reductase 1 | HGNC:12,437 | 12q23.3 |
| TXNRD2 | thioredoxin reductase 2 | HGNC:18,155 | 22q11.21 |
| UCP2 | uncoupling protein 2 | HGNC:12,518 | 11q13.4 |
The datasets used is detailed in Table 4 . RNA-sequencing platforms were used for COVID-19 studies, while microarray platforms were used for older datasets of SARS-COV-1, IAV, and RSV (Table 4). For the COVID-19 lung autopsies dataset (PRJNA646224) [32], the investigators extracted RNA from Formalin fixed paraffin embedded lung tissues of 9 COVID-19 fatal cases, and 10 SARS-COV-2-uninfected individuals who undertook biopsy as part of routine clinical care for lung cancer. For this lung autopsy datasets, we used processed sequencing data provided by Wu Meng et al. [32].
Table 4.
Gene expression datasets used in this study.
| Groups | GEO accession | Platform | Sample | Condition 1 | Condition 2 |
|---|---|---|---|---|---|
| GSE1739 (38) | GPL201 | PBMCs | Controls (n = 4) | SARS-COV-1 (n = 10) | |
| GSE17156 (37) | GPL571 | Whole blood | Controls (n = 17) | Influenza H3N2 (n = 17) | |
| GSE17156 (37) | GPL571 | Whole blood | Controls (n = 20) | Respiratory syncytial virus (n = 20) | |
| RNA-seq Data | |||||
| PRJNA646224 (32) | GPL21697 | Lung autopsies | Controls (n = 10) | Lung autopsies (n = 9) | |
| EGAS00001004503 (33) | GPL24676 | Whole blood | Controls (n = 10) | COVID -19 (n = 39) | |
| GSE157103 (34) | GPL24676 | Leukocytes from whole blood | Controls (n = 10) | Non-severe COVID-19 (n = 51), severe COVID-19 (n = 37) | |
| GSE147507 (6) | GPL18573 | Primary human lung epithelium (NHBE) | Mock infected NHBE | IAV (n = 4) and SARS-COV-2 (n = 3) infected NHBE | |
| Single-cell RNA-seq Data | |||||
| GSE145926 (8) | GPL23227 | Bronchoalveolar lavage fluid | Healthy (n = 6) | Moderate (n = 3) and Severe (n = 6) COVID-19 | |
| GSE150728 (40) | GPL24676 | Peripheral blood mononuclear cells | Healthy (n = 6) | Severe COVID-19 (n = 7) | |
IAV, Influenza A virus; SARS-COV, Severe acute respiratory syndrome coronavirus.
For COVID-19 whole blood transcriptomic dataset, we used processed sequencing data deposited under project number EGAS00001004503 [33]. In this study, Aschenbrenner et al. extracted whole blood RNA from 10 controls, 20 severe and 19 mild COVID-19 patients and analyzed it using NovaSeq 6000 [34].
To validate whole blood and lung autopsies findings, the expression of the shared oxidative stress genes was extracted from a third COVID-19 leucocyte dataset (GEO: GSE157103) consisting of 37 severe COVID-19 and 51 non-severe COVID-19 patients [34]. COVID-19 disease severity was defined by intensive care unit (ICU) admission, while burden of co‐morbidity was obtained by measuring the Charlson Comorbidity Index score [35]. Logistic regression analysis was then used to determine the independent association between expression of oxidative stress genes and COVID-19 disease severity. ICU admission factor was used as the dependent factor and oxidative stress gene expression as independent factor. The model was adjusted for age, gender, body mass index and Charlson Comorbidity Index score [35]. Statistical analyses were performed using R software (v 3.0.2), SPSS 25.00 (SPSS Inc., Chicago, IL, USA), and Prism (v8; GraphPad Software). P‐value of <0.05 considered statistically significant.
We also examined how SARS-COV-2 and IAV infection may regulate the expression of oxidative stress genes in whole blood and lung autopsies. We, hence, reanalyzed the data deposited by Daniel Blanco-Melo (GEO: GSE147507) [6] to compare the expression of these genes in viral-infected lung epithelial cells compared to Mock-infected controls. For leucocyte datasets (GEO: GSE157103) and Daniel Blanco-Melo (GEO: GSE147507)), we processed the RNAseq raw count using the Bioconductor package limma-voom [36], and presented the results as log2 counts per million (log CPM). Log-transformed normalized intensities were also used in Linear Models for MicroArray data (LIMMA) analyses to identify differentially expressed genes between diseased and control groups.
Transcriptomic datasets of peripheral blood mononuclear cells (PBMCs) isolated from RSV and IAV infected patients (GEO: GSE17156) [37] and from SARS-COV-1 infected patients (GEO: GSE1739) [38] were analyzed. In both studies, blood was obtained during peak of patient's symptoms, and processed by the investigators for RNA extraction and hybridization following Affymetrix protocol. After quality check, we normalized, and log transformed the raw Affymetrix data. Microarray data (CEL files) were pre-processed in our study with Robust Multi-Array Average (RMA) technique using R software [39]. The probe set with the largest interquartile range (IQR) of expression values was selected to represent the gene. Raw data from different studies was never mixed or combined. For each study, the fold change was obtained separately by analyzing data of diseased and controls.
Single-cell RNA sequencing datasets were obtained from two studies on BALF and PBMCs COVID-19 samples. In the first study, Liao et al. performed single-cell RNA sequencing on BALF obtained from 6 severe and 3 moderate COVID-19 patients and 3 healthy control [8]. The investigators clustered macrophages into four groups based on the expression of the differentiation markers. Group one and two represented M1-like macrophages, while group three represented M2-like macrophages [8]. Fold changes were generated for each group of macrophages relative to the total macrophage population. In addition, the differential gene expression of CD8+ T cells was compared between moderate and severe groups. For the second study, single cell dataset of neutrophils sorted from PBMCs were used [40]. Wilk, AJ et al. performed single sequencing on blood neutrophils from 7 COVID-19 patients, and 6 six healthy controls [40]. The investigators clustered neutrophils into two clusters, low-density neutrophils and canonical neutrophils. The novel cell population of low-density neutrophils was significantly increased only in patients with ARDs.
For the purpose of these two investigations, we used the published processed data. The details of sample isolation, sequencing, and data processing are available at NCBI GEO, and the protocol of each study [8,40]. Briefly, single-cell RNA-seq libraries were generated and cellranger 10X genomics was used to generate fastq files from the sequenced data, the reads were aligned to the human reference genome (GRCh38; 10x cellranger reference GRCh38 v3.0.0). Further filtering and normalization were performed using Seurat R package v3.1.5 [17]. Model-based analysis of single cell transcriptomics (MAST) algorithm in Seurat v3 was used to identify differentially expressed genes (DEGs) and to determine the fold change. Only DEGs with a two-sided p value < 0.05 adjusted for multiple comparisons by Bonferroni's correction were selected.
2.1. qRT-PCR
Saliva was obtained from 5 uninfected controls (average age of 34 ± 8 years), 7 asymptomatic COVID-19 patients (average age of 44 ± 6 years), and 10 severe COVID-19 patients (average age of 53 ± 11 years). Blood samples were obtained from 5 uninfected controls (average age of 34 ± 8 years), 9 asymptomatic COVID-19 patients (average age of 43 ± 6 years), and 10 severe COVID-19 patients (average age of 56 ± 11 years). COVID-19 cases were confirmed by qRT-PCR positive test, while the uninfected donor controls were confirmed by qRT-PCR negative test. This study was approved by Dubai Scientific Research Ethics Committee (DSREC). Written, informed consents were obtained from all study participants prior to inclusion. Precautions recommended by CDC for safe collecting, handling and testing of biological fluids were followed [41].
Total RNA from whole blood and saliva was isolated using Trizol reagent according to the manufacturer's instructions (Invitrogen, Carlsbad, CA) [42]. Complementary cDNA was synthesized from 1 μg of RNA using the High-Capacity cDNA Reverse Transcription Kit (Applied Biosystems) according to the manufacturer's protocol. For cDNA amplification, 5x Hot FirePol EvaGreen qRT-PCR SuperMix (Solis Biodyne) was used, and qRT-PCR was performed in QuantStudio 3 Real-Time PCR System (Applied Biosystems) [43]. Primer sequences for MPO, S100A8, S100A9, and 18s used in qRT-PCR are deposited in Supplementary Table 1. Gene expression was analyzed using the Comparative Ct (ΔΔCt) method upon normalization to the reference gene 18s rRNA [44]. The data was log transformed. Unpaired student t-test was used to compare between the independent groups. (GraphPad Software, San Diego, Calif). For all analyses, P-values <0.05 were considered significant.
3. Results
3.1. Expression of oxidative stress genes is increased in blood and lung tissue during SARS-COV-2 infection relative to disease severity
Using publicly available transcriptomic datasets, we have determined the expression levels of 125 oxidative stress genes, including 37 pro-oxidant genes, 32 oxidative-responsive genes, and 56 antioxidant genes. The lists of these genes are presented in Table 1, Table 2, Table 3 The datasets used in this study are presented in Table 4. Expression levels of the oxidative stress genes were determined in lung autopsies and whole blood of COVID-19 patients (Fig. 1, figs1 ). For whole blood, RNA-sequencing data was extracted from 20 severe COVID-19 patients and 10 controls (Fig. 1A). For lung, RNA-sequencing data was obtained from 9 deceased COVID-19 patients and 10 negative controls (PRJNA646224) (Fig. 1B). Twenty-six oxidative stress genes were upregulated in whole blood, while only 10 genes in lung autopsies (Fig. 1C). Seven of these genes were commonly upregulated in both whole blood and lung autopsies (Fig. 1C), including the following five pro-oxidants/oxidative responsive genes: Myeloperoxidase (MPO), Calprotectin (S100A8/S100A9), Sulfiredoxin-1 (SRXN1), Glutamate-cysteine ligase modifier (GCLM), and two antioxidant genes: Sestrin 2 (SESN2) and Thioredoxin (TXN) (Fig. 1C). A significant increase in lung tissue expression of S100A8 (4.2 ± 0.3 log-fold vs 2.7 ± 0.3 log-fold; p-value = 0.001) and SRXN1 (2.1 ± 0.2 log-fold vs 1.04 ± 0.4 log-fold; p-value = 0.03) compared to whole blood was observed (Fig. 1C). We then determined the expression of these seven shared genes in NHBE infected with IAV or SARS-COV-2 using data deposited by Daniel Blanco-Melo (GEO: GSE147507) [6]. Of these seven genes, SRXN1 and SESN2 were slightly increased in IAV infected NHBE (n = 4 IAV NHBE vs n = 4 mock infected NHBE), while calprotectin genes of S100A8 (log-fold of 1.9 ± 0.15; p-value < 0.0001) and S100A9 (log-fold of 1.1 ± 0.07; p-value < 0.0001) were noticeably increased in SARS-COV-2 infected NHBE (n = 3 SARS–CO–V-2 NHBE vs n = 3 mock infected NHBE, GEO: GSE147507). The in-vitro infected results are displayed in Fig. 1D.
Fig. 1.

Oxidative stress gene expression in whole blood and lung autopsies of COVID-19 patients. (A) Expression of 26 oxidative genes were upregulated in whole blood of severe COVID-19 vs non-infected controls. Whole blood transcriptomic data set was used (n = 20 severe COVID-19 vs n = 10 controls, dataset: EGAS00001004503). Results are presented as fold change of gene expression between cases and controls. (B) Upregulation of 10 oxidative genes in lung autopsies (n = 9 COVID-19 vs n = 10 controls, dataset: PRJNA646224). Results are presented as fold change of gene expression between cases and controls. (C) Seven oxidative stress genes were shared between whole blood and lung autopsies. MPO, S100A8, and S100A9 were among the top upregulated oxidative genes, while S100A8 and SRXN1 were higher in lung autopsies. Results are presented as fold change of gene expression between cases and controls. Unpaired student t-test was used to compare between fold changes in mild and severe COVID-19. ∗p < 0.05, ∗∗p < 0.01, ∗∗∗p < 0.001, ∗∗∗∗p < 0.0001. (D) The seven shared oxidative genes were analyzed in SAR-COV-2 and influenza A virus infected human lung epithelial cells. Independent biological replicates of primary human lung epithelium (NHBE) were mock treated or infected with SARS-COV-2 (USA-WA1/2020), or IAV (A/Puerto Rico/8/1934 (H1N1)). Of these seven genes, SRXN1 and SESN2 were slightly increased in IAV infected NHBE (n = 4 IAV NHBE vs n = 4 mock infected NHBE, GEO: GSE147507), while calprotectin genes of S100A8 and S100A9 were noticeably increased in SARS-COV-2 infected NHBE (n = 3 SARS–CO–V-2 NHBE vs n = 3 mock infected NHBE, GEO: GSE147507). All fold changes presented in the figure were significant with a p value < 0.05.
To confirm this increase in expression of oxidative genes during COVID-19 infection, we also determined the expression of these seven genes in a transcriptome dataset of leucocyte isolated from 37 severe and 51 non-severe COVID-19 patients (GSE157103). Confirming the previous results, this analysis showed a significant upregulation of the selected seven oxidative stress genes in severe versus non-severe COVID-19 (Fig. 2 ). To further characterize the association between expression of these genes and COVID-19 severity we carried a logistic regression analysis. After adjustment with age, gender, body mass index, and Charlson Comorbidity Index score, the expression of these seven genes were significantly associated with COVID-19 severity and ICU admission. (Supplementary Table 2).
Fig. 2.

Upregulation of common oxidative genes in leucocytes of severe COVID-19 patients. The seven shared oxidative genes between autopsy and whole blood COVID-19 samples were found to be higher in leucocytes of severe COVID-19 (n = 37 Severe vs n = 51 non-severe COVID-19, GSE157103). All fold changes presented in the figure were significant with a p value < 0.05.
3.2. Expression of oxidative stress genes is upregulated in lung tissue inflammatory cells during COVID-19 infection
After establishing an overall upregulation of oxidative stress genes in autopsies of COVID-19 patients, we next determined whether the observed increase in oxidative stress is reflected on the main inflammatory cells regulating COVID-19 severity. A single cell dataset of macrophage and CD8+ cells isolated from bronchioalveolar fluid (GEO: GSE145926) of COVID-19 severe patients was used [8]. In this study, macrophages were clustered into four main groups. Group one and two represented M1-like macrophages and group three represented M2-like macrophages; M1 and M2 like macrophages were more prominent in severe COVID-19. The fourth group was found to be more common in healthy and non-severe COVID-19 patients [8]. Interestingly, M1 and M2 macrophages of severe COVID-19 patients had an overall increase in the expression of pro-oxidant, oxidative responsive, and antioxidant genes, while macrophages from non-severe COVID-19 and healthy individuals showed more increase in antioxidants genes. Among oxidative genes, the expression of S100A8 (1.8 log-fold; p-value <0.0001) and S100A9 (1.5 log-fold; p-value <0.0001) was significantly increased (Fig. 3 A). Further, a distinct upregulation of oxidative stress genes in BALF CD8+ T cells isolated from the same severe COVID-19 patients, while these markers were not changed in BALF CD8+ T cells isolated from non-severe COVID-19 patients (Fig. 3B). All fold changes presented in Fig. 3A and B were significant with a p value < 0.05.
Fig. 3.

Single-cell expression data of bronchoalveolar lavage from patients with COVID-19 (GEO: GSE145926). Single-cell RNA sequencing was performed on bronchoalveolar lavage fluid (BALF) from 6 severe and 3 moderate COVID-19 patients and 3 healthy control. (A) Prominent upregulation of S100A8 and S100A9 in M1 macrophage group. Macrophages were clustered into four groups; M1 macrophages were presented with group 1 and 2, while M2 macrophages were presented with group 3. Both M1 and M2 like macrophages were enriched in severe COVID-19. Group 4 macrophages were predominant in moderate and healthy controls and presented the less severe COVID-19. Fold changes were generated for each group of macrophages relative to total macrophages. (B) Specific upregulation of oxidative stress genes in CD8+ T cells from severe COVID-19 patients, while none of the oxidative genes appeared in the non-severe COVID-19 cluster. All fold changes presented in the figure were significant with a p value < 0.05.
Neutrophils are one of the main sources of the oxidative stress genes and a key inflammatory cell regulating COVID-19 pathogenesis. To determine the expression of oxidative stress genes within the neutrophils, a single cell dataset of immune cells isolated from PBMCs (GEO: GSE150728) of COVID-19 severe patients was used [40]. In this study overall neutrophil counts were increased in severe COVID-19, while presence of low-density neutrophils was associated with severe COVID-19 phenotype and development of ARDS [40]. Low-density neutrophils showed upregulation of MPO (1.6 log-fold; p-value <0.0001), CYBB (1.1 log-fold; p-value <0.0001), S100A8 (0.8 log-fold; p-value <0.0001) and S100A9 (0.34 log-fold; p-value <0.0001) calprotectin genes. Noticeably, antioxidant genes of JUNB (−0.7 log-fold; p-value <0.0001), FOS (−1.1 log-fold; p-value <0.0001), and SOD2 (−1.5 log-fold; p-value <0.0001) were found to be downregulated, suggesting increase of pro-oxidant and decrease of antioxidant signatures within these neutrophils at the critical ARDS and COVID-19 severe stage (Supplementary Fig. 2).
3.3. Myeloperoxidase and calprotectin levels are upregulated in saliva of COVID-19 patients relative to disease severity
We next examined whether the observed increase in these oxidative stress genes can be detected in saliva of COVID-19 patients. This may hence suggest the usage of these genes as non-invasive biomarkers for disease severity. To do that, we first validated the increase of these markers in blood of asymptomatic and severe COVID-19 patients using qRT-PCR. A significant increase in blood levels of MPO and calprotectin in severe versus asymptomatic COVID-19 patients was observed (Fig. 4 A). MPO was increased one log-fold more in severe versus asymptomatic (p-value = 0.0033), while log-fold difference in S100A8 and S100A9 were 0.87 log-fold (p-value 0.004) and log-fold 0.9 (p-value = 0.006), respectively. We then determined the level of these genes in saliva from the same COVID-19 patients (Fig. 4B). This increase was comparable in saliva compared to blood samples which may suggest that saliva level of expression of these genes could reflect the level of COVID-19 severity. In severe versus asymptomatic saliva, the log-fold difference was one log-fold (p-value = 0.0001) for MPO, 2.7 log-fold (p-value<0.0001) for S100A8, and 0.3 log-fold (p-value = 0001) for S100A9.
Fig. 4.

Myeloperoxidase and calprotectin levels are upregulated in saliva of COVID-19 patients relative to disease severity. (A) Gene expression level of MPO, S100A8 and S100A9 was higher in blood from severe COVID-19 (n = 7) as compared to asymptomatic COVID-19 (n = 9). (B) Gene expression level of MPO, S100A8 and S100A9 was higher in saliva from severe COVID-19 (n = 10) as compared to asymptomatic COVID-19 (n = 7). Results are presented as log2 fold change. Unpaired student t-test was used to compare between the independent groups. ∗p < 0.05, ∗∗p < 0.01, ∗∗∗p < 0.001, ∗∗∗∗p < 0.0001.
3.4. Prominent upregulation of oxidative stress genes during coronavirus infections relative to other viral infections
We next compared the profile of enhanced oxidative stress gene expression observed during SARS-COV-2 to that detected during other respiratory viral infections. To do that, we used transcriptomic microarrays and RNA-sequencing data of PBMCs isolated from SARS-COV-1, IAV, and RSV infected patients at the peak of disease. For each condition, differential gene expression was obtained by comparing the normalized gene expression of the infected group to those of healthy donors (Fig. 5 A). For IAV and RSV infections, none of the oxidative stress genes were increased more than one log fold-change (FC), while 7 genes for SARS-COV-1 and 27 genes for SARS-COV-2 infections were upregulated to a than one log FC (Fig. 5A). TXN, QSOX1, MAPK14, MPO, S100A9, and S100A8 were the top shared oxidative stress genes appearing in both coronavirus respiratory infections, with an increase in expression of more than 1.5 folds following infection (Fig. 5B).
Fig. 5.

Expression of oxidative stress genes during SARS-COV-2 and other viral infections. The number and intensity of gene upregulation were higher during SARS-COV-2 infection compared to other respiratory viral infection. (A) Upregulation of oxidative stress genes during different respiratory infections. The difference in gene expression of case and controls is provided as fold change. (B) Intersection of upregulated oxidative signatures in coronavirus infections; SARS-COV-1 and SARS-COV-2. The following datasets were used; GSE17156 (n = 17 IAV vs n = 17 controls), GSE17156 (n = 20 RSV vs n = 20 controls), GSE1739 (n = 10 SARS-COV-1 vs n = 4 controls), and EGAS00001004503 (n = 39 COVID-19 vs n = 10 controls). For all analyses, p < 0.05 was considered significant. IAV, influenza A virus; RSV, Respiratory syncytial virus.
4. Discussion
Herein, the dysregulation in the expression levels of 125 oxidative stress genes during severe COVID-19 viral infection was explored using bioinformatic analysis of publicly available transcriptomic datasets of lung autopsies, bronchioalveolar fluid, and blood from SARS-COV-2 infected individuals. Seven oxidative stress genes were found to be upregulated in whole blood and lung autopsies of severe COVID-19 (MPO, S100A8, S100A9, SRXN1, GCLM, SESN2, and TXN) (Fig. 1C). Of these genes, calprotectin genes, S100A8 and S100A9, were distinctly elevated in NHBE infected with SARS-COV-2 as compared to cells infected with IAV (Fig. 1D). We then examined if the increase in these genes was relative to disease severity. These genes were significantly increased in blood leucocytes of severe compared to non-severe COVID-19 (Fig. 2). Using logistic regression, this association remained significant even after adjustment with cofounding factors of age, gender, body mass index, and Charlson Comorbidity Index score (Supplementary Table 2).
Similarly, using single cell BALF transcriptomics, the expression of the oxidative genes was shown to be increased more in macrophages and CD8+ T cells from severe COVID-19 patients compared to non-severe and healthy uninfected donors. Results from single cell transcriptomic of blood neutrophils revealed an increase in both canonical and low-density neutrophil during SARS-COV-2 infection. This increase was more apparent in severe COVID-19 disease and was characterized by upregulation of the expression of MPO, and calprotectin genes, while the antioxidant genes were found to be downregulated.
Severe COVID-19 disease has been associated with innate immune dysregulation, an increased neutrophil-to-lymphocyte ratio, lymphopenia, and cytokine storm [[5], [6], [7], [8]]. Hypoxia status, neutrophil count, and cytokine storm all reflect the degree of lung oxidative stress and disease severity. Oxidative stress could induce dose dependent lung tissue injury ranging from apoptosis to necrosis [45]. Respiratory burst is mediated by activated macrophages and neutrophils and generates reactive oxygen species including superoxide, hydrogen peroxide, and hydroxyl radicals [46]. SARS-COV-2 viral entry and replication in the lung tissue activates the viscous cycle starting with phagocyte mediated burst of reactive oxygen species and inflammatory cytokines that eventually triggers further tissue injury, cytokine release, activation of macrophages and neutrophils. Minor perturbation in oxidative balance could aid in controlling viral infection by causing measurable non-specific lethal effect to both infected host tissue and the viral pathogens [47]. However, delayed viral clearance as in the case of severe COVID-19 could results in depletion of cellular antioxidant resources, increase of reactive oxygen species products, and cytokine storm. Long term oxidative stress causes tissue damage through interaction between these free radicals and cellular lipids, proteins and DNA content [48].
Here we observed an overall dysregulation of oxidative stress genes expression in circulating blood and lung tissue during severe COVID-19 disease. MPO and S100A8/9 calprotectin's were the top upregulated oxidative markers in lung autopsies, whole blood, leucocytes, BALF derived macrophages and PBMC derived neutrophils. The three top upregulated oxidative genes were validated in blood of severe COVID-19 patients using qRT-PCR. Relative to uninfected donor controls, MPO, S100A8 and S100A9 were significantly higher in blood of severe versus asymptomatic COVID-19 patients. Interestingly, these three oxidative genes were also significantly upregulated in saliva of severe relative to asymptomatic COVID-19 patients (Fig. 4). This suggest that the saliva level of these oxidative genes can be used as non-invasive markers for COVID-19 disease severity.
S100A8 and S100A9 genes encode calcium binding proteins also known as Migration Inhibitory Factor-Related Protein 8 and 14 (MPR8 and MRP14), respectively. They form heterodimers known as calprotectin that binds to toll-like receptor 4 (TLR4) and function as alarmin to stimulate the innate immune system pathways, namely MAP-kinase and NF-kappa-B signaling [49,50]. Given that, S100A8 and S100A9 have extensive effects on the net inflammation, redox balance, and cell death via autophagy and apoptosis [51,52]. They are also expressed abundantly in cells of myeloid origin such as neutrophils and monocytes. These genes are not expressed in normal tissue resident macrophages, however, S100A9 (MRP14) was found to be expressed in macrophage during acute inflammation, while macrophage infiltrate during chronic inflammation expressed both S100A9 and S100A8 [53]. Interestingly, we found both S100A8 and S100A9 to be upregulated in BALF derived macrophages of severe COVID-19 in contrast to mild COVID-19 (Fig. 3A). Recently, Silvin et al. showed that elevated calprotectin levels in peripheral blood cells could be used to discriminate severe from mild COVID-19 infection [54]. In this study, they used high-dimensional flow cytometry and single-cell RNA sequencing of COVID-19 peripheral blood and suggested that high calprotectin production is mediated by abnormal myeloid subsets [54]. Calprotectin genes are also expressed in lungs, particularly in lung epithelial and alveolar type II pneumocytes [55]. Likewise, the expression of these genes is increased with viral infection [56] and lipopolysaccharide stimulation [57]. In our study, through bioinformatic analyses, we showed that S100A8 and S100A9 were expressed in NHBE and lung autopsies, and their expression was upregulated post SARS-COV-2 infection (Fig. 1D). The observed increase of these markers, especially in lung autopsies, could be attributed to the increase in expression of these genes in both inflammatory as well as structural lung cells. We then associated elevated calprotectin level to severe COVID-19 (Fig. 2, figs1, figs2, Fig. 3 and Supplementary Table 2) and validated this in whole blood and saliva of COVID-19 patients (Fig. 4).
In both blood and lung autopsies, myeloperoxidase enzyme gene, MPO, was among the top three oxidative stress genes. This gene is mainly expressed in neutrophil, and it mediates catalysis of reactive oxygen intermediates such as hypohalous acids [58]. Oxidative stress stimulates neutrophil extracellular traps (NETs) formation by neutrophils, NETosis, and lead to burst of neutrophil granules containing myeloperoxidase enzyme and calprotectin which in turn boost the cellular oxidative levels further. Similar to S100A8 and S100A9, myeloperoxidase expression level was associated with disease severity (Fig. 2). Supporting these findings, a recent investigation by FP Veras et al. showed viable SARS-COV-2 ability to directly induce the release of NETs by healthy neutrophils [2]. This group observed that NETs concentration was increased in plasma, tracheal aspirate and lung autopsies during SARS-COV-2 infection. Other groups also reported association between MPO levels and COVID-19 severity [3,4].
Similar to other viral infections, it is difficult to differentiate between association and causation effects of SARS-COV-2 infection on oxidative stress mediated cellular injury [59]. Viral induced hypoxemia requires increasing the levels of inspired concentration of oxygen to maintain the systemic oxygen delivery [60]. A level of lung oxidative stress could then be induced corresponding to this increase in the level of inspired oxygen [60]. This may contribute to the observed increase in oxidative stress gene markers. More studies could be needed to determine the level of contribution of this potential source of oxidative stress. Recent findings suggest that SARS-COV-2 could directly promote neutrophil activation and release of NETs [61]. Through analysis of different respiratory infections, we have showed a prominent upregulation in oxidative stress genes during coronavirus infection (Fig. 5A) relative to other respiratory infections such as IAV and RSV infections. Recently, using rhesus macaques and mice infected with different viral infections, Guo et al. showed that the increase in S100A8 gene expression during COVID-19 infection is associated with disease severity; and suggest that it could contribute to the evasion mechanism induced by coronavirus infection [56]. Our bioinformatics analysis confirmed Guo et al. animal findings within human blood samples. Further, we have shown that beside S100A8, coronavirus infection also induced the increase of additional 26 oxidative related genes hinting at higher potential oxidative stress load in these infections.
The other noticeable dysregulated oxidative genes in our study were Sulfiredoxin-1 (SRXN1), Glutamate-cysteine ligase modifier (GCLM), and two antioxidant genes: Sestrin 2 (SESN2) and Thioredoxin (TXN). Respiratory virus induced oxidative stress is attributed to the increased expression of these genes in both lung inflammatory and structural cells. Different respiratory viral infections including influenza H5N1, RSV and coronavirus infections induce oxidative stress imbalance [24,62,63]. Lung injury and infection severity in these viral infections are directly related to the viral load, net inflammation, and level of oxidative stress [63]. Interestingly, viral induced lung injury could be attenuated by administration of exogenous antioxidants [62,64,65]. TXN with potent antioxidant properties was found to be elevated in alveolar macrophages and type II epithelial cells in the lungs of acute respiratory distress syndrome [66]. Whilst exogenous administration of thioredoxin decreased Influenza A Virus (H1N1)-Induced acute lung injury and inflammation in the lungs of the virus-infected mice [65,67]. More information is needed to better understand the role of oxidative markers such as SRXN1 in COVID-19 pathogenesis.
Targeting one or more of these oxidative stress gene could represent an effective therapeutic approach for the treatment of COVID-19 disease. This may hence prevent the progression of the disease to cytokine storm, coagulopathy, and extensive lung tissue necrosis. In fact, a recent animal study has showed that targeting calprotectin with administration of paquinimod reduced the neutrophil derived oxidative damage and helped in boosting host antiviral response [56]. SARS-COV-2 induced NRF2 suppression was also reversed through administration of NRF2 agonists, 4-OI and DMF [24]. Direct antioxidant such as Vitamin C are small molecules with short half-life, while NRF2 agonist deploy long lasting antioxidant effect by activating enzymatic reactions that persist days after elimination of this agonist [68,69].
Other selective antioxidant targeting myeloperoxidase could help in clearance of NETs, while macrophage ability to clear NETs could be enhanced by AMP-activated protein kinase (AMPK) activator such as Metformin or application of neutralizing antibody against HMGB1 [70].
In conclusion, SARS-COV-2 induce the expression of oxidative stress genes via both immune as well as lung structural cells. Myeloperoxidase and calprotectin gene levels are increased in blood, lung tissue, and inflammatory cells. In our study, these genes were detected in salivary samples and hence they could potentially be used as a non-invasive severe COVID-19 marker. The observed correlation between oxidative stress genes dysregulation and COVID-19 disease severity deserve more attention. These changes in oxidative stress gene expression may or may not reflect alteration in the net oxidative stress balance. It is warranted that further mechanistical studies are performed to confirm this association.
Declaration of competing interest
The authors declare no competing interests.
Acknowledgments
This research has been financially supported by Tissue Injury and Repair (TIR) group operational grant (Grant code: 150317); COVID-19 research grant (CoV19-0307), Seed grant (Grant code: 2001090275); and by collaborative research grant (Grant code: 2001090278) to RH, University of Sharjah, UAE; and by a Sandooq Al Watan Applied Research & Development grant to RH (SWARD-S20-007), UAE; and by Al Jalila Foundation Seed Grant (AJF202019), UAE; and by Prince Abdullah Ben Khalid Celiac Disease Research Chair, under the Vice Deanship of Research Chairs, King Saud University, Riyadh, Kingdom of Saudi Arabia.
Footnotes
Supplementary data to this article can be found online at https://doi.org/10.1016/j.freeradbiomed.2021.06.018.
Appendix A. Supplementary data
The following is/are the supplementary data to this article:
figs1.

Oxidative stress gene expression in whole blood of COVID-19 patients with different severity. (A) Twenty-six oxidative genes were upregulated in severe COVID-19 vs controls comparison, (B) while twelve genes were upregulated in mild COVID-19 vs controls. Results in (A and B) are presented as fold change of gene expression between cases and controls. (C) The expression of MPO, S100A8, and S100A9 were higher in severe compared to mild COVID-19 samples. Results are presented as fold change of gene expression between cases and controls. All fold changes presented in the figure were significant with a p value<0.05. Unpaired student t-test was used to compare between the independent groups. ∗p < 0.05, ∗∗p < 0.01, ∗∗∗p < 0.001, ∗∗∗∗p < 0.0001(C). The sample size presented in A-C belonged to EGAS00001004503 dataset and were as following; n=10 controls, n=19 mild COVID-19, and n=20 severe COVID-19
figs2.

Single-cell gene expression from PBMCs of severe COVID-19 patients. MPO, S100A8and S100A9 genes were significantly upregulated in developing neutrophils vs canonical neutrophils. Single-cell RNA sequencing was performed on PBMCs from 6 severe COVID-19 patients and 7 healthy controls (GEO: GSE150728). Low-density neutrophils were associated with severe COVID-19 phenotype and development of acute respiratory distress syndrome. Model-based analysis of single cell transcriptomics (MAST) algorithm in Seurat v3 was used by authors to identify differentially expressed genes and to determine the fold change. All fold changes presented in the figure were significant with a two-sided p value<0.05
References
- 1.Chen H., Guo J., Wang C., Luo F., Yu X., Zhang W., et al. Clinical characteristics and intrauterine vertical transmission potential of COVID-19 infection in nine pregnant women: a retrospective review of medical records. Lancet. 2020;395(10226):809–815. doi: 10.1016/S0140-6736(20)30360-3. [DOI] [PMC free article] [PubMed] [Google Scholar]
- 2.Huang C., Wang Y., Li X., Ren L., Zhao J., Hu Y., et al. Clinical features of patients infected with 2019 novel coronavirus in Wuhan, China. Lancet. 2020;395(10223):497–506. doi: 10.1016/S0140-6736(20)30183-5. [DOI] [PMC free article] [PubMed] [Google Scholar]
- 3.Rothe C., Schunk M., Sothmann P., Bretzel G., Froeschl G., Wallrauch C., et al. Transmission of 2019-nCoV infection from an asymptomatic contact in Germany. N. Engl. J. Med. 2020;382(10):970–971. doi: 10.1056/NEJMc2001468. [DOI] [PMC free article] [PubMed] [Google Scholar]
- 4.Holshue M.L., DeBolt C., Lindquist S., Lofy K.H., Wiesman J., Bruce H., et al. First case of 2019 novel coronavirus in the United States. N. Engl. J. Med. 2020;382(10):929–936. doi: 10.1056/NEJMoa2001191. [DOI] [PMC free article] [PubMed] [Google Scholar]
- 5.Vardhana S.A., Wolchok J.D. The many faces of the anti-COVID immune response. J. Exp. Med. 2020;217(6) doi: 10.1084/jem.20200678. [DOI] [PMC free article] [PubMed] [Google Scholar]
- 6.Blanco-Melo D., Nilsson-Payant B.E., Liu W.-C., Uhl S., Hoagland D., Møller R., et al. Imbalanced host response to SARS-CoV-2 drives development of COVID-19. Cell. 2020;181(5):1036–1045. doi: 10.1016/j.cell.2020.04.026. e9. [DOI] [PMC free article] [PubMed] [Google Scholar]
- 7.Lee J.S., Park S., Jeong H.W., Ahn J.Y., Choi S.J., Lee H., et al. Immunophenotyping of COVID-19 and influenza highlights the role of type I interferons in development of severe COVID-19. Science Immunology. 2020;5(49) doi: 10.1126/sciimmunol.abd1554. [DOI] [PMC free article] [PubMed] [Google Scholar]
- 8.Liao M., Liu Y., Yuan J., Wen Y., Xu G., Zhao J., et al. Single-cell landscape of bronchoalveolar immune cells in patients with COVID-19. Nat. Med. 2020;26(6):842–844. doi: 10.1038/s41591-020-0901-9. [DOI] [PubMed] [Google Scholar]
- 9.Singh A.K., Gillies C.L., Singh R., Singh A., Chudasama Y., Coles B., et al. Prevalence of co-morbidities and their association with mortality in patients with COVID-19: a systematic review and meta-analysis. Diabetes Obes. Metabol. 2020;22(10):1915–1924. doi: 10.1111/dom.14124. [DOI] [PMC free article] [PubMed] [Google Scholar]
- 10.Stefan N., Birkenfeld A.L., Schulze M.B. Global pandemics interconnected — obesity, impaired metabolic health and COVID-19. Nat. Rev. Endocrinol. 2021;17(3):135–149. doi: 10.1038/s41574-020-00462-1. [DOI] [PubMed] [Google Scholar]
- 11.Lee L.Y.W., Cazier J.-B., Starkey T., Briggs S.E.W., Arnold R., Bisht V., et al. COVID-19 prevalence and mortality in patients with cancer and the effect of primary tumour subtype and patient demographics: a prospective cohort study. Lancet Oncol. 2020;21(10):1309–1316. doi: 10.1016/S1470-2045(20)30442-3. [DOI] [PMC free article] [PubMed] [Google Scholar]
- 12.Hofstetter A.R., De La Cruz J.A., Cao W., Patel J., Belser J.A., McCoy J., et al. NADPH oxidase 1 is associated with altered host survival and T cell phenotypes after influenza A virus infection in mice. PloS One. 2016;11(2) doi: 10.1371/journal.pone.0149864. e0149864-e. [DOI] [PMC free article] [PubMed] [Google Scholar]
- 13.Zhu L., Liu L., Zhang Y., Pu L., Liu J., Li X., et al. High level of neutrophil extracellular traps correlates with poor prognosis of severe influenza A infection. J. Infect. Dis. 2018;217(3):428–437. doi: 10.1093/infdis/jix475. [DOI] [PubMed] [Google Scholar]
- 14.Hosakote Y.M., Jantzi P.D., Esham D.L., Spratt H., Kurosky A., Casola A., et al. Viral-mediated inhibition of antioxidant enzymes contributes to the pathogenesis of severe respiratory syncytial virus bronchiolitis. Am. J. Respir. Crit. Care Med. 2011;183(11):1550–1560. doi: 10.1164/rccm.201010-1755OC. [DOI] [PMC free article] [PubMed] [Google Scholar]
- 15.Hamming I., Timens W., Bulthuis M.L.C., Lely A.T., Navis G.J., van Goor H. Tissue distribution of ACE2 protein, the functional receptor for SARS coronavirus. A first step in understanding SARS pathogenesis. J. Pathol. 2004;203(2):631–637. doi: 10.1002/path.1570. [DOI] [PMC free article] [PubMed] [Google Scholar]
- 16.Lee I.T., Nakayama T., Wu C.-T., Goltsev Y., Jiang S., Gall P.A., et al. ACE2 localizes to the respiratory cilia and is not increased by ACE inhibitors or ARBs. Nat. Commun. 2020;11(1):5453. doi: 10.1038/s41467-020-19145-6. [DOI] [PMC free article] [PubMed] [Google Scholar]
- 17.Haga S., Yamamoto N., Nakai-Murakami C., Osawa Y., Tokunaga K., Sata T., et al. Modulation of TNF-α-converting enzyme by the spike protein of SARS-CoV and ACE2 induces TNF-α production and facilitates viral entry. Proc. Natl. Acad. Sci. Unit. States Am. 2008;105(22):7809–7814. doi: 10.1073/pnas.0711241105. [DOI] [PMC free article] [PubMed] [Google Scholar]
- 18.Hoffmann M, Kleine-Weber H, Schroeder S, Krüger N, Herrler T, Erichsen S. et al SARS-CoV-2 cell entry depends on ACE2 and TMPRSS2 and is blocked by a clinically proven protease inhibitor. Cell. 2020;181(2):271–280.e278. doi: 10.1016/j.cell.2020.02.052. [DOI] [PMC free article] [PubMed] [Google Scholar]
- 19.Vickers C., Hales P., Kaushik V., Dick L., Gavin J., Tang J., et al. Hydrolysis of biological peptides by human angiotensin-converting enzyme-related carboxypeptidase *. J. Biol. Chem. 2002;277(17):14838–14843. doi: 10.1074/jbc.M200581200. [DOI] [PubMed] [Google Scholar]
- 20.Verdecchia P., Cavallini C., Spanevello A., Angeli F. The pivotal link between ACE2 deficiency and SARS-CoV-2 infection. Eur. J. Intern. Med. 2020;76:14–20. doi: 10.1016/j.ejim.2020.04.037. [DOI] [PMC free article] [PubMed] [Google Scholar]
- 21.Fernandes I.G., de Brito C.A., dos Reis V.M.S., Sato M.N., Pereira N.Z. SARS-CoV-2 and other respiratory viruses: what does oxidative stress have to do with it? Oxidative Medicine and Cellular Longevity. 2020;2020 doi: 10.1155/2020/8844280. [DOI] [PMC free article] [PubMed] [Google Scholar]
- 22.Kaspar J.W., Niture S.K., Jaiswal A.K. Nrf2:INrf2 (Keap1) signaling in oxidative stress. Free Radic. Biol. Med. 2009;47(9):1304–1309. doi: 10.1016/j.freeradbiomed.2009.07.035. [DOI] [PMC free article] [PubMed] [Google Scholar]
- 23.Niture S.K., Khatri R., Jaiswal A.K. Regulation of Nrf2—an update. Free Radic. Biol. Med. 2014;66:36–44. doi: 10.1016/j.freeradbiomed.2013.02.008. [DOI] [PMC free article] [PubMed] [Google Scholar]
- 24.Olagnier D., Farahani E., Thyrsted J., Blay-Cadanet J., Herengt A., Idorn M., et al. SARS-CoV2-mediated suppression of NRF2-signaling reveals potent antiviral and anti-inflammatory activity of 4-octyl-itaconate and dimethyl fumarate. Nat. Commun. 2020;11(1):4938. doi: 10.1038/s41467-020-18764-3. [DOI] [PMC free article] [PubMed] [Google Scholar]
- 25.Kalem A.K., Kayaaslan B., Neselioglu S., Eser F., Hasanoglu İ., Aypak A., et al. A useful and sensitive marker in the prediction of COVID-19 and disease severity: Thiol. Free Radic. Biol. Med. 2021;166:11–17. doi: 10.1016/j.freeradbiomed.2021.02.009. [DOI] [PMC free article] [PubMed] [Google Scholar]
- 26.Singh D., Wasan H., Reeta K.H. Heme oxygenase-1 modulation: a potential therapeutic target for COVID-19 and associated complications. Free Radic. Biol. Med. 2020;161:263–271. doi: 10.1016/j.freeradbiomed.2020.10.016. [DOI] [PMC free article] [PubMed] [Google Scholar]
- 27.Reyes I.H.K., Pico A., Wikipathways Rashid K. Oxidative stress (Homo sapiens) 2016. www.wikipathways.org/index.php/Pathway:WP408 Available at:
- 28.Morel Y., Barouki R. Repression of gene expression by oxidative stress. Biochem. J. 1999;342 Pt 3(Pt 3):481–496. [PMC free article] [PubMed] [Google Scholar]
- 29.Go Y.-M., Chandler J.D., Jones D.P. The cysteine proteome. Free Radic. Biol. Med. 2015;84:227–245. doi: 10.1016/j.freeradbiomed.2015.03.022. [DOI] [PMC free article] [PubMed] [Google Scholar]
- 30.Hoskin T.S., Crowther J.M., Cheung J., Epton M.J., Sly P.D., Elder P.A., et al. Oxidative cross-linking of calprotectin occurs in vivo, altering its structure and susceptibility to proteolysis. Redox Biology. 2019;24 doi: 10.1016/j.redox.2019.101202. [DOI] [PMC free article] [PubMed] [Google Scholar]
- 31.Martindale J.L., Holbrook N.J. Cellular response to oxidative stress: signaling for suicide and survival*. J. Cell. Physiol. 2002;192(1):1–15. doi: 10.1002/jcp.10119. [DOI] [PubMed] [Google Scholar]
- 32.Wu M., Chen Y., Xia H., Wang C., Tan C.Y., Cai X., et al. Transcriptional and proteomic insights into the host response in fatal COVID-19 cases. Proc. Natl. Acad. Sci. Unit. States Am. 2020;117(45):28336. doi: 10.1073/pnas.2018030117. [DOI] [PMC free article] [PubMed] [Google Scholar]
- 33.Aschenbrenner A.C., Mouktaroudi M., Kraemer B., Antonakos N., Oestreich M., Gkizeli K., et al. 2020. Disease Severity-specific Neutrophil Signatures in Blood Transcriptomes Stratify COVID-19 Patients. medRxiv. 2020.07.07.20148395. [DOI] [PMC free article] [PubMed] [Google Scholar]
- 34.Overmyer K.A., Shishkova E., Miller I.J., Balnis J., Bernstein M.N., Peters-Clarke T.M., et al. Large-scale multi-omic analysis of COVID-19 severity. Cell Syst. 2020 doi: 10.1016/j.cels.2020.10.003. [DOI] [PMC free article] [PubMed] [Google Scholar]
- 35.Charlson M.E., Pompei P., Ales K.L., MacKenzie C.R. A new method of classifying prognostic comorbidity in longitudinal studies: development and validation. J. Chron. Dis. 1987;40(5):373–383. doi: 10.1016/0021-9681(87)90171-8. [DOI] [PubMed] [Google Scholar]
- 36.Ritchie M.E., Phipson B., Wu D.I., Hu Y., Law C.W., Shi W., et al. Limma powers differential expression analyses for RNA-sequencing and microarray studies. Nucleic Acids Res. 2015;43(7):e47–e. doi: 10.1093/nar/gkv007. [DOI] [PMC free article] [PubMed] [Google Scholar]
- 37.Zaas A.K., Chen M., Varkey J., Veldman T., Hero A.O., 3rd, Lucas J., et al. Gene expression signatures diagnose influenza and other symptomatic respiratory viral infections in humans. Cell Host Microbe. 2009;6(3):207–217. doi: 10.1016/j.chom.2009.07.006. [DOI] [PMC free article] [PubMed] [Google Scholar]
- 38.Reghunathan R., Jayapal M., Hsu L.Y., Chng H.H., Tai D., Leung B.P., et al. Expression profile of immune response genes in patients with Severe Acute Respiratory Syndrome. BMC Immunol. 2005;6:2. doi: 10.1186/1471-2172-6-2. [DOI] [PMC free article] [PubMed] [Google Scholar]
- 39.Hughey J.J., Butte A.J. Robust meta-analysis of gene expression using the elastic net. Nucleic Acids Res. 2015;43(12):e79–e. doi: 10.1093/nar/gkv229. [DOI] [PMC free article] [PubMed] [Google Scholar]
- 40.Wilk A.J., Rustagi A., Zhao N.Q., Roque J., Martínez-Colón G.J., McKechnie J.L., et al. A single-cell atlas of the peripheral immune response in patients with severe COVID-19. Nat. Med. 2020;26(7):1070–1076. doi: 10.1038/s41591-020-0944-y. [DOI] [PMC free article] [PubMed] [Google Scholar]
- 41.www.cdc.govhttps://www.cdc.gov/coronavirus/2019-ncov/lab/guidelines-clinical-specimens.html Available from:
- 42.Muhammad J.S., Saheb Sharif-Askari N., Cui Z.-G., Hamad M., Halwani R. SARS-CoV-2 infection-induced promoter hypomethylation as an epigenetic modulator of heat shock protein A1L (HSPA1L) gene. Front. Genet. 2021;12(129) doi: 10.3389/fgene.2021.622271. [DOI] [PMC free article] [PubMed] [Google Scholar]
- 43.Goel S., Saheb Sharif-Askari F., Saheb Sharif-Askari N., Mdkhana B., Mahboub B., Zakri A.M., et al. SARS-CoV-2 Switches ‘on’MAPK and NFk B signaling via the reduction of nuclear DUSP1 and DUSP5 expression. Front. Pharmacol. 2021;12:404. doi: 10.3389/fphar.2021.631879. [DOI] [PMC free article] [PubMed] [Google Scholar]
- 44.Kuchipudi S.V., Tellabati M., Nelli R.K., White G.A., Perez B.B., Sebastian S., et al. 18S rRNA is a reliable normalisation gene for real time PCR based on influenza virus infected cells. Virol. J. 2012;9(1):1–7. doi: 10.1186/1743-422X-9-230. [DOI] [PMC free article] [PubMed] [Google Scholar]
- 45.Lennon S.V., Martin S.J., Cotter T.G. Dose-dependent induction of apoptosis in human tumour cell lines by widely diverging stimuli. Cell Prolif. 1991;24(2):203–214. doi: 10.1111/j.1365-2184.1991.tb01150.x. [DOI] [PubMed] [Google Scholar]
- 46.Camini F.C., da Silva Caetano C.C., Almeida L.T., de Brito Magalhães C.L. Implications of oxidative stress on viral pathogenesis. Arch. Virol. 2017;162(4):907–917. doi: 10.1007/s00705-016-3187-y. [DOI] [PubMed] [Google Scholar]
- 47.Nathan C., Shiloh M.U. Reactive oxygen and nitrogen intermediates in the relationship between mammalian hosts and microbial pathogens. Proc. Natl. Acad. Sci. U. S. A. 2000;97(16):8841–8848. doi: 10.1073/pnas.97.16.8841. [DOI] [PMC free article] [PubMed] [Google Scholar]
- 48.Pizzino G., Irrera N., Cucinotta M., Pallio G., Mannino F., Arcoraci V., et al. 2017. Oxidative Stress: Harms and Benefits for Human Health. Oxidative Medicine and Cellular Longevity. 2017. [DOI] [PMC free article] [PubMed] [Google Scholar]
- 49.Riva M., Källberg E., Björk P., Hancz D., Vogl T., Roth J., et al. Induction of nuclear factor-κB responses by the S100A9 protein is Toll-like receptor-4-dependent. Immunology. 2012;137(2):172–182. doi: 10.1111/j.1365-2567.2012.03619.x. [DOI] [PMC free article] [PubMed] [Google Scholar]
- 50.Simard J.C., Girard D., Tessier P.A. Induction of neutrophil degranulation by S100A9 via a MAPK-dependent mechanism. J. Leukoc. Biol. 2010;87(5):905–914. doi: 10.1189/jlb.1009676. [DOI] [PubMed] [Google Scholar]
- 51.Ghavami S., Eshragi M., Ande S.R., Chazin W.J., Klonisch T., Halayko A.J., et al. S100A8/A9 induces autophagy and apoptosis via ROS-mediated cross-talk between mitochondria and lysosomes that involves BNIP3. Cell Res. 2010;20(3):314–331. doi: 10.1038/cr.2009.129. [DOI] [PMC free article] [PubMed] [Google Scholar]
- 52.Ryckman C., Vandal K., Rouleau P., Talbot M., Tessier P.A. Proinflammatory activities of S100: proteins S100A8, S100A9, and S100A8/A9 induce neutrophil chemotaxis and adhesion. J. Immunol. 2003;170(6):3233–3242. doi: 10.4049/jimmunol.170.6.3233. [DOI] [PubMed] [Google Scholar]
- 53.Odink K., Cerletti N., Brüggen J., Clerc R.G., Tarcsay L., Zwadlo G., et al. Two calcium-binding proteins in infiltrate macrophages of rheumatoid arthritis. Nature. 1987;330(6143):80–82. doi: 10.1038/330080a0. [DOI] [PubMed] [Google Scholar]
- 54.Silvin A., Chapuis N., Dunsmore G., Goubet A.G., Dubuisson A., Derosa L., et al. Elevated calprotectin and abnormal myeloid cell subsets discriminate severe from mild COVID-19. Cell. 2020;182(6):1401–1418. doi: 10.1016/j.cell.2020.08.002. e18. [DOI] [PMC free article] [PubMed] [Google Scholar]
- 55.Kotsiou O.S., Papagiannis D., Papadopoulou R., Gourgoulianis K.I. Calprotectin in lung diseases. Int. J. Mol. Sci. 2021;22(4):1706. doi: 10.3390/ijms22041706. [DOI] [PMC free article] [PubMed] [Google Scholar]
- 56.Guo Q., Zhao Y., Li J., Liu J., Yang X., Guo X., et al. Induction of alarmin S100A8/A9 mediates activation of aberrant neutrophils in the pathogenesis of COVID-19. Cell Host Microbe. 2021;29(2):222–235. doi: 10.1016/j.chom.2020.12.016. e4. [DOI] [PMC free article] [PubMed] [Google Scholar]
- 57.Henke M.O., Renner A., Rubin B.K., Gyves J.I., Lorenz E., Koo J.S. Up-regulation of S100A8 and S100A9 protein in bronchial epithelial cells by lipopolysaccharide. Exp. Lung Res. 2006;32(8):331–347. doi: 10.1080/01902140600959580. [DOI] [PubMed] [Google Scholar]
- 58.Aratani Y. Myeloperoxidase: its role for host defense, inflammation, and neutrophil function. Arch. Biochem. Biophys. 2018;640:47–52. doi: 10.1016/j.abb.2018.01.004. [DOI] [PubMed] [Google Scholar]
- 59.Schwarz K.B. Oxidative stress during viral infection: a review. Free Radic. Biol. Med. 1996;21(5):641–649. doi: 10.1016/0891-5849(96)00131-1. [DOI] [PubMed] [Google Scholar]
- 60.Nakane M. Biological effects of the oxygen molecule in critically ill patients. Journal of Intensive Care. 2020;8(1):95. doi: 10.1186/s40560-020-00505-9. [DOI] [PMC free article] [PubMed] [Google Scholar]
- 61.Veras F.P., Pontelli M.C., Silva C.M., Toller-Kawahisa J.E., de Lima M., Nascimento D.C., et al. SARS-CoV-2-triggered neutrophil extracellular traps mediate COVID-19 pathology. J. Exp. Med. 2020;217(12) doi: 10.1084/jem.20201129. [DOI] [PMC free article] [PubMed] [Google Scholar]
- 62.Huang S.-H., Cao X.-J., Liu W., Shi X.-Y., Wei W. Inhibitory effect of melatonin on lung oxidative stress induced by respiratory syncytial virus infection in mice. J. Pineal Res. 2010;48(2):109–116. doi: 10.1111/j.1600-079X.2009.00733.x. [DOI] [PubMed] [Google Scholar]
- 63.He G., Dong C., Luan Z., McAllan B.M., Xu T., Zhao L., et al. Oxygen free radical involvement in acute lung injury induced by H5N1 virus in mice. Influenza and Other Respiratory Viruses. 2013;7(6):945–953. doi: 10.1111/irv.12067. [DOI] [PMC free article] [PubMed] [Google Scholar]
- 64.Espinoza J.A., González P.A., Kalergis A.M. Modulation of antiviral immunity by heme oxygenase-1. Am. J. Pathol. 2017;187(3):487–493. doi: 10.1016/j.ajpath.2016.11.011. [DOI] [PubMed] [Google Scholar]
- 65.Tanaka R., Ishima Y., Enoki Y., Kimachi K., Shirai T., Watanabe H., et al. Therapeutic impact of human serum albumin–thioredoxin fusion protein on influenza virus-induced lung injury mice. Front. Immunol. 2014;5(561) doi: 10.3389/fimmu.2014.00561. [DOI] [PMC free article] [PubMed] [Google Scholar]
- 66.Callister M.E., Burke-Gaffney A., Quinlan G.J., Nicholson A.G., Florio R., Nakamura H., et al. Extracellular thioredoxin levels are increased in patients with acute lung injury. Thorax. 2006;61(6):521–527. doi: 10.1136/thx.2005.053041. [DOI] [PMC free article] [PubMed] [Google Scholar]
- 67.Yashiro M., Tsukahara H., Matsukawa A., Yamada M., Fujii Y., Nagaoka Y., et al. Redox-active protein thioredoxin-1 administration ameliorates influenza A virus (H1N1)-induced acute lung injury in mice. Crit. Care Med. 2013;41(1) doi: 10.1097/CCM.0b013e3182676352. [DOI] [PubMed] [Google Scholar]
- 68.Cuadrado A., Pajares M., Benito C., Jiménez-Villegas J., Escoll M., Fernández-Ginés R., et al. Can activation of NRF2 Be a strategy against COVID-19? Trends Pharmacol. Sci. 2020;41(9):598–610. doi: 10.1016/j.tips.2020.07.003. [DOI] [PMC free article] [PubMed] [Google Scholar]
- 69.Dinkova-Kostova A.T., Talalay P. Direct and indirect antioxidant properties of inducers of cytoprotective proteins. Mol. Nutr. Food Res. 2008;52(Suppl 1):S128–S138. doi: 10.1002/mnfr.200700195. [DOI] [PubMed] [Google Scholar]
- 70.Grégoire M., Uhel F., Lesouhaitier M., Gacouin A., Guirriec M., Mourcin F., et al. Impaired efferocytosis and neutrophil extracellular trap clearance by macrophages in ARDS. Eur. Respir. J. 2018;52(2) doi: 10.1183/13993003.02590-2017. [DOI] [PubMed] [Google Scholar]
Associated Data
This section collects any data citations, data availability statements, or supplementary materials included in this article.