

Summary
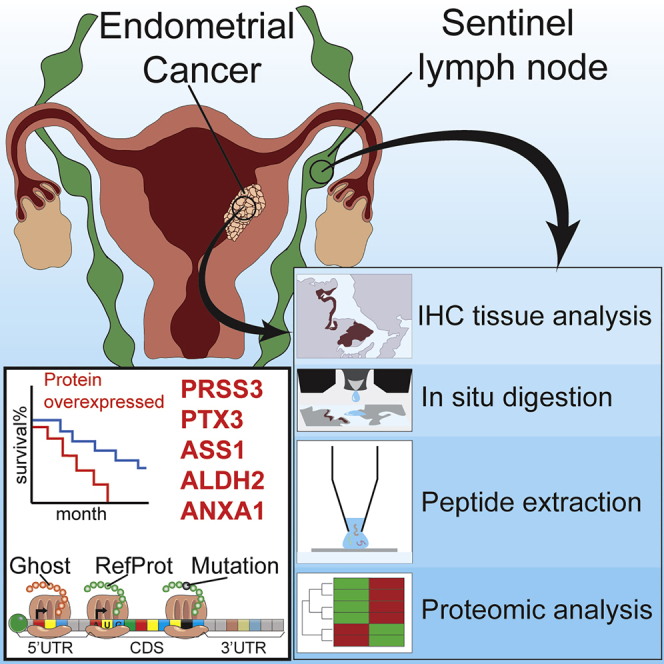
Endometrial cancer (EC) is one of the most common gynecological cancers worldwide. Sentinel lymph node (SLN) status could be a major prognostic factor in evaluation of EC, but several prospective studies need to be performed. Here we report an in-depth proteomics analysis showing significant variations in the SLN protein landscape in EC. We show that SLNs are correlated to each tumor grade, which strengthens evidence of SLN involvement in EC. A few proteins are overexpressed specifically at each EC tumor grade and in the corresponding SLN. These proteins, which are significantly variable in both locations, should be considered potential markers of overall survival. Five major proteins for EC and SLN (PRSS3, PTX3, ASS1, ALDH2, and ANXA1) were identified in large-scale proteomics and validated by immunohistochemistry. This study improves stratification and diagnosis of individuals with EC as a result of proteomics profiling of SLNs.
Keywords: sentinel lymph nodes, endometrial cancer, proteomics, alternative proteins, ghost proteome, protein mutations, diagnosis
Graphical abstract
Highlights
Diagnosis of endometrial cancer does not include sentinel lymph node mapping
In depth-proteomics analysis of sentinel lymph nodes and individuals with endometrial cancer
We identify potential biomarkers for tumor grade and overall survival
The standard of care for endometrial cancer (EC) does not currently include sentinel lymph node (SLN) mapping. Aboulouard et al. report an in-depth proteomic analysis of SLNs from individuals with grade I, II, or III EC and identify potential biomarkers for tumor grade and overall survival.
Introduction
Sentinel lymph node (SLN) mapping is used as a surgical strategy to perform a complete lymphadenectomy in individuals with endometrial cancer.1 The concept of “sentinel nodes” appeared in 19602 and is linked to the fact that if the SLNs are negative for metastasis, then nodes distal from the SLNs should also be negative.3 In 1977, Cabanas4 used lymphography to describe SLNs in individuals with penile carcinoma. SLN mapping enables affected individuals to avoid the side effects associated with complete lymphadenectomy and guides surgeons in decision-making. The use of pathologic “ultrastaging” and surgeon experience are key factors for successful SLN mapping, especially with breast cancer and melanoma.1,5 The approach is based on simply identifying the anatomical location of the SLNs.6 In the case of gynecological malignancies, the reliability of the SLN detection procedure has been investigated extensively in vulvar and cervical cancer.7 SLN mapping in endometrial cancer (EC) was introduced by Burke et al.8 and gained credibility in recent years9 but has not yet been incorporated as a standard-of-care procedure in EC.10 There are several factors that can explain the low use of SLN mapping, including complex uterine drainage, the various modalities of tracer injection, and lack of large prospective series. It has been reported that SLN mapping achieved a detection rate of 81.7%, a metastatic SLN involvement rate of 10.9%, and a false negative rate of 12.3% in main clinical trials.10 In 2017, 55 eligible studies that included 4,915 women, were published.11,12 The overall detection rate of SLN mapping was 81%, with a bilateral pelvic node detection rate of 50% and para-aortic detection rate of 17% with a metastasis detection sensitivity of 96%. Thus, SLN mapping accurately predicts nodal status in women with EC.11 Despite these promising clinical data and a positive view of the role of SLN mapping in detecting EC, the exact underlying molecular mechanisms relating SLNs and EC grades have not been fully identified. Obtaining molecular information can highlight EC pathological mechanisms and serve to identify potential prognostic and therapeutic targets.
Here we present a state-of-the-art proteomics study of SLNs from individuals with EC to look at differences in protein expression and mutations that are associated with tumor grade and identify affected pathways possibly involved in EC. In addition to the mutations, the unreferenced proteins translated from the regions described as non-coding of mRNA such as 5' and 3' UTRs and frameshift or from non-coding RNA (ncRNA), forming the “ghost proteome,” were also investigated. Our work identifies a correlation between SLNs and EC grades based on significant protein abundance variation. Furthermore, we identify and validate five key protein biomarkers that link EC and SLN cancer grading that could be used later as diagnostic tools, pending validation in larger and independent cohorts from multicenters.
Results
The aim of this study was to identify comprehensive molecular proteomics signatures from SLNs and compare them with early-stage endometrial carcinoma proteomes at intermediate and high risk of recurrence, which was performed as a randomized study (Table S1). All sentinel nodes were examined by standard staining. When negative, serial sections were performed for standard staining and pancytokeratin immunohistochemistry (IHC). For the endometrial tissues, P53 immunostaining was performed. Figure 1A presents results of IHC from a healthy sentinel node (Figure 1Aa) or normal endometrial tissue (Figure 1Ae), including from sentinel nodes from grade I (Figures 1Ab–1Ab’’), grade II (Figures 1Ac and 1Ac’), and grade III (Figures 1Ad and 1Ad’) or endometrioid grade I (Figures 1Af and 1Af”), grade II (Figures 1Ag and 1Ag’), and grade III (Figures 1Ah and 1Ah’). Based on these IHC results, we performed spatially resolved shotgun proteomics on regions of interest (ROIs) selected by a pathologist (Figure 1B). The stained slides were then unmounted and resin was removed, and then trypsin was deposited on the ROI using a piezo chemical inkjet printer. The digested ROI was then subjected to liquid junction peptide extraction before separation with a nano-liquid chromatography (LC) coupled with high-resolution mass spectrometry for tandem mass spectrometry (MS/MS) analysis. We first analyzed proteins from sentinel nodes samples and endometrioid tissue samples separately, and then we compared their protein profiles together to assess common signatures that might exist between them. In this way, we expected to demonstrate whether SLNs could provide a more sensitive method of assessing the spread of apparent early-stage EC than a lymph node dissection, which would enable a focus-targeted adjuvant therapy decision, such as performing radiotherapy or chemotherapy.
Figure 1.

Global workflow of spatially resolved analysis
(A) Histopathological data obtained from immunocytochemistry performed with anti-P53 on tissue sections of sentinel nodes (SNs), either healthy (Aa) or cancerous (Ab, Ac, and Ad), from grade I (Ab) with magnification (Ab’ and Ab’’), grade II (Ac) with magnification (Ac’), and grade III (Ad) with magnification (Ad’). Similarly, results were obtained with their corresponding endometrial tissue, either healthy (Ae) or cancerous (Af, Ag, and Ah), at grade I (Af) with magnification (Af’ and Af’’), grade II (Ag) with magnification (Ag’), and grade III (Ah) with magnification (Ah’). See also IHC images in the Supplemental information).
(B) Workflow for spatially resolved proteomics using IHC tissue sections. ROIs were subjected to enzymatic microdigestion using trypsin followed by liquid junction microextraction, and then subjected to shotgun proteomics analyses.
Shotgun proteomics of sentinel nodes
From the 24 samples (normal and grades I–III), 1,291 proteins showed a significant difference in expression based on MS-based relative quantification. After filtering proteins based on a minimum number of values in at least one of the four defined groups (2 of 3 valid values), 1,005 proteins were obtained (Figure 1B; Data S1). Sixty-two specific proteins were identified with the following repartition: 3 in the normal sentinel node, 21 in grade I, 5 in grade II, and 33 in grade III (Figure 1B; Table S2). Comparison of the different sentinel node cancerous states showed differences in terms of cellular components and molecular functions. Grade I tumors contained the highest level of proteins related to the nucleus and cytoplasmic constituents compared with grade II and grade III tumors (Figure S1A), whereas the three grades presented the same level of proteins as detected in exosomes (Figure S1A). For the molecular functions, proteins identified in grade I tumors were more related to an immune response, which was confirmed by STRING analysis (Figure S1B). Serpins, PTX3 (pentraxin-related protein 3), CHI3L1 (chitinase-3-like protein 1), PROM1 (prominin-1), ORM2 (alpha-1-acid glycoprotein 2), MNDA (myeloid cell nuclear differentiation antigen), AZU1 (azurocidin), RNASE3 (eosinophil cationic protein), ASRGL1 (isoaspartyl peptidase/L-asparaginase), and MMP8 (neutrophil collagenase) are proteins involved in the immune response, especially the innate immune response (Figure S1B). Grade II tumors contained only 5 specific proteins: PLEK (Pleckstrin), PLIN1 (Perilipin-1), PLIN4 (Perilipin-4), ECM1 (extracellular matrix protein 1), and GIMAP1 (GTPase, IMAP family member 1). PLIN1 and PLIN4 are involved in the PPAR (peroxisome proliferator-activated receptors) signaling pathway. ECM1 and PLECK are implicated in platelet degranulation and immunity. ECM1 is also involved in angiogenesis (Figure S1C). Grade III tumors contained proteins involved in DNA and RNA binding, nucleic acid metabolism, transcription regulator activity, and metabolism (Figure S1D). Several interesting proteins can be pointed out, in particular CDC42 (cell division control protein 42 homolog), which plays a role in extension and maintenance of formation of thin, actin-rich surface projections called filopodia. SNW1 (NW domain-containing protein 1) is known to be implicated in epigenetics and is involved in NOTCH1-mediated transcriptional activation. Metastasis-associated protein (MTA2) is associated with the estrogen receptor in breast cancer and predicts proliferation in non-small cell lung cancer.13 MTA2 also targets P53. MTA1, but not MTA2, has already been identified in sentinel nodes of head and neck cancer14 and breast cancer.15 MTA1 expression was correlated positively with lymph node metastasis and poor survival rate in EC.16 According to the TCGA (The Cancer Genome Atlas)17, a list of 786 unfavorable genes has been characterized, and among them, 20 are considered to be associated with lower overall survival when overexpressed.18 From this list, PTX3 protein was identified as the only unfavorable factor in grade I.
To better understand the modulation registered across the different lesions, a multiple-sample test ANOVA with p < 0.05 was performed. A total of 336 proteins showed a significant difference in expression among the 4 groups, as shown in a heatmap (Figure 2A). Proteomes in samples from the same group were similar (mean Pearson correlation, 0.92) compared with inter-group variation. The main differences were observed between normal sentinel nodes and grade I SLNs (Figure 2B). A volcano plot was made, based on combination of grades I, II, and II together, which were compared with normal sentinel nodes; the data revealed 91 differentially regulated proteins, with 44 proteins more represented in tumor tissue and 47 in normal tissue (Figure 2C; Table S3). Among the 44 identified proteins more expressed in cancerous sentinel nodes, 12 are involved in the innate immune response (protein SGT1 homolog, nucleoside diphosphate kinase B, Drebrin-like protein, alpha-1-acid glycoprotein 2, Clusterin, DNA-dependent protein kinase catalytic subunit, Ras-related protein Rap-1b, vesicle-associated membrane protein 8, Ras-related protein Rap-1A, major vault protein, interleukin enhancer-binding factor 2, and Cystatin-B), 4 are involved in necroptosis and cellular senescence (ADP/ATP translocase 1, ADP/ATP translocase 2, ADP/ATP translocase 3, ADP/ATP translocase 4, and charged multivesicular body protein 4a), and 20 are involved in mediated transport (Figure 2D). Functional enrichment analysis established that tumors are connected to nucleotide metabolism, whereas proteins involved in normal tissue are highly related to signal transduction and cell communication (Figure 2E). The hierarchical clustering between normal grades and the different grades showed a separation into 2 branches, i.e., one separating grade III and another separating the other grades and normal grade. The second branch separated grade I SLNs to normal and grade II SLNs, and then the last subbranch separated normal from grade II SLNs (Figure 2A). Cluster 1, representing overexpressed proteins in grade I SLNs, contains 47 proteins (Data S2). Nine are antimicrobial peptides, i.e., dermicidin, S100-A8, S100-A9, eosinophil cationic protein, lysozyme C, lactotransferrin, neutrophil elastase, cathepsin G, and neutrophil gelatinase-associated lipocalin. Twenty-four proteins are involved in the innate immune response or neutrophil degranulation (Figure S2A). The other proteins are involved in energy pathways and metabolism (Figure S2A). Cluster 2, corresponding to proteins overexpressed in grade II, contains 37 proteins that are involved in metabolism involving mitochondrial enzymes, such as isocitrate dehydrogenase 1 (IDH1), serine hydroxymethyltransferase (SHMT2), 2-oxoglutarate dehydrogenase (OGDH), ADP/ATP (translocase 1–4), glycanic enzymes such as UDP-glucose 6-dehydrogenase (UGDH), sialic acid synthase (NANS, N-Acetylneuraminate Synthase), 78-kDa glucose-regulated protein (HSPA5), hypoxia upregulated protein 1 (HYOU1), endoplasmin (HSP90A1), and protein disulfide-isomerase A3 (Figure S2B). Other proteins are also involved in cell growth (Figure S2D). Cluster 3 contains 117 proteins more expressed in grade III SLNs (Data S2). ClueGo analyses established that 32 are involved in the ribonucleoprotein complex (Figure S2C, red balls), ribosomes (Figure S2C, blue balls), and translation (Figure S2C, green balls). Among the identified proteins, ICAM-3 is known to mediate inflammatory signaling to promote cancer cell stemness.19,20 Catenin beta-1 and Stathmin are poor prognosis markers in EC.21,22 TP53BP1 is also detected and is known to interact with p53 and MFN1; these two genes encode a mitochondrial membrane protein and are considered to have tumor suppressor gene functions. However, its mutation is also considered a poor prognosis marker in cancer.23 Functional enrichment analyses demonstrated that proteins more represented in grade III SLNs are involved in metabolism of nucleotides, protein metabolism, and energy pathways (Figure S2D). Cluster 4 corresponds to proteins that are more represented in normal sentinel nodes; 26 cytosolic proteins have been identified (Figure S2E) and are involved in oxygen carrier activity, oxygen binding, and myosin binding. Gene set enrichment analysis (GSEA)24 associated with Cytoscape25 analyses of the 4 clusters is in line with the precedent analyses (Figure 2F).
Figure 2.

Proteomics analysis of SLNs
(A) Hierarchical clustering of the most variable proteins between normal tissue and grades I–III (n = 3 for each category, ANOVA with permutation-based FDR < 0.05).
(B) PCA PC1 versus PC3 of the proteomics data obtained from each grade of SN versus healthy tissue.
(C) Volcano plot of overexpressed proteins in normal SNs versus ones in carcinoma (grades I–III).
(D) STRING analysis of proteins present in cluster 1 corresponding to proteins overexpressed only in grade I SNs.
(E) Funrich biological process analyses of normal versus carcinoma SN.
(F) GSEAs associated with Cytoscape of the four clusters.
Comparison of the volcano plot of the grade I, grade II, and grade III sentinel nodes (Figures 3A–3C) established a molecular transition between these grades. The volcano plot confirmed the presence of a high number of differentially regulated proteins between grade I and normal SLNs (Figure 3A). No differentially regulated proteins were detected between grade II and normal SLNs (Figure 3B), whereas few proteins were differentially regulated between grade III and normal SLNs (Figure 3C). Thus, we observed a clear shift from normal to grade I sentinel nodes that keeps immune activity through antimicrobial peptides and immune factors involved in the innate immune response. The transition from grade I to grade II can be explained by the switch from an immune profile to cytoskeleton modifications and proliferation. We then refined the analysis with a false discovery rate (FDR) of less than 0.01 to compare grade II with grade III SLNs (Figure S2F). Nineteen proteins were identified to be in common between grade II and grade III; most of these proteins are involved in metabolism and in the Warburg effect (Figure S2F, inset STRING analysis). Cancer cell evolution to epithelial-mesenchymal transition (EMT) is suggested, as reflected by the presence of hypoxia upregulated protein 1. However, resistance of the immune response to cancer cells is still present in grade III. In fact, regulators of self-antigen presentation are still present, such as Tap1, HLA-CW12 (human leukocyte antigen), and class II HLA-DRB1.
Figure 3.

Establishment of a molecular transition between SLN and EC grades
(A–C) Volcano plots of proteins under- or overexpressed in (A) grade I SNs, (B) grade II SNs, and (C) grade III SNs.
(D) Venn diagram representing specific proteins per grade versus normal and ones in common from SNs.
(E) PCA PC1 versus PC2 of EC versus normal tissue.
(F) Volcano plot and Hierarchical clustering of the most variable proteins between normal tissue and grade I–III EC (n = 3 for each category, ANOVA with permutation-based FDR < 0.05) and GSEA analyses of normal versus the 3 grades of the EC associated together. The GSEA was performed on the two clusters identified.
Shotgun proteomics of EC
Proteins from the 12 samples (normal and grades I–III) were extracted and subjected to shotgun proteomics analyses. 1,280 proteins showed a significant difference in expression level. After filtering proteins based on a minimum number of values in at least one of the four defined groups (2/3 of valid values), 913 proteins were obtained (Data S3). According to the Venn diagram, 11 proteins were specific to healthy endometrial tissue, 24 to grade I EC, 14 to grade II, and 19 for grade III (Figure 3D; Table S3). Moreover, principal-component analyses (PCAs) revealed a clear separation between the different grades and healthy endometrial tissue (Figure 3E). The volcano plot associated with the heatmap confirmed the presence of 2 clusters, i.e., a cluster representative of normal endometrial tissue and cluster 2 related to EC (Figure 3F). GSEA associated with Cytoscape confirmed that cluster 2, corresponding to proteins overexpressed in EC, are involved in translation, transcription, and nucleotide metabolism (Figure 3F). Specific proteins identified in grade I EC tissue are related to the immune response with the presence of antimicrobial peptides (neutrophil elastase, neutrophil gelatinase-associated lipocalin, bactericidal permeability-increasing protein, and azurocidin). Among the immune factors, we identified interleukin-16 (IL-16); receptor-type tyrosine-protein phosphatase C, required for T cell activation; Integrin alpha-M; and Integrin ITGAM/ITGB2, known to be implicated in various adhesive interactions of monocytes, macrophages, and granulocytes. We also identified CD74, which is known to play a role in major histocompatibility complex (MHC) class II antigen presentation. However, CD74 is a poor prognostic marker in breast cancer26 and PTX3 in EC, according to the TCGA (Table S3). For grade II, 4 proteins involved in the Wnt pathway have been identified (i.e., SMARCA4, GNB2, GNB4, and 26S proteasome subunit 10 [PSMC10]) (Table S3) and in grade III, NOTUM and PSMC6. Moreover, endosialin is known to play a role in tumor angiogenesis.27 The host cell factor c1 (HCFC1) is an immunomodulator that plays a role in limiting the anti-cancer immune response and production of cytokines such as IL-6 or IL-8, which can contribute to neovascularization or tumor growth.28 Volcano plots confirmed the high number of specific proteins identified in the 3 stages of EC development (Figures 4A–4C).
Figure 4.

Proteomics analysis of grade I–III EC
(A–C) Volcano plots of proteins under- and overexpressed in (A) grade I EC, (B) grade II EC, and (C) grade III EC.
(D) Hierarchical clustering of the most variable proteins between grade I–III EC (n = 3 for each category, ANOVA with permutation-based FDR < 0.01).
(E) Survival curve and HIC (immunohistochemistry) of the ASS1 marker obtained from a pathological atlas.
To better understand the modulation registered across the different lesions, a multiple-sample ANOVA with p < 0.01 was performed (Figure 4D). A total of 384 proteins showed a significant difference in expression between the 4 groups. Hierarchical clustering and heatmap representation established a good separation between the three EC grades (Figure 4D; Data S3). Cluster 1 contained proteins overexpressed in grade I tumors. Among the identified proteins, 30 are involved in immune response (Figure S3A), such as gamma interferon-inducible protein 16 (IFI16), lysozyme C, myeloperoxidase, and lactotransferrin. The other ones are related to the metabolism of RNA. For grade II, 42 proteins implicated in cytoskeleton protein binding, the ribosome, and actin-binding were detected in cluster 2 (Figure S3B). A network implicating TPM4, TPM2, TPM1, MYH10, and MYH11 was identified, similar to what we found recently in glioma.29 For grade III, some of the proteins are involved in cell adhesion (Cadherin-13, β-catenin, tenascin, vitronectin, emilin 1, and collagen alpha-1 chains) and the extracellular matrix, including ApoE and HSPG2 (cluster 3; Figure S3C). ApoE is important for proliferation and survival of ovarian cancer.30 An analysis with a FDR of 0.01 is presented in Table S4. Interestingly, we identified PTX3 and ASS1 to be overexpressed in grade I and grade II tumors, respectively. These two proteins are considered to be among the top 20 most unfavorable prognostic factors according to TCGA data17 and antibody-based protein data18 (Figure 4G).
Comparison of sentinel node and EC proteomes
A comparison analysis was performed based on the 24 samples used previously after ANOVA with a FDR of 0.01. 659 significant proteins were identified among 1,053. After hierarchical clustering and heatmap representation, healthy endometrial tissue is separated from the sentinel nodes and endometrial tumor grades. Interestingly, one branch regroups sentinel node grade I and endometrial grade I samples. Endometrial grade II and III tumors are also regrouped and separated from sentinel node grades II and III (Table S5). Cluster 1 corresponds to the common proteins overexpressed in sentinel and endometrial grade I tumor tissue (Table S5), and cluster 2 represents the common overexpressed proteins between SLN and EC grade III tissue (Table S5). Cluster 1 contains 22 proteins involved in immune response (Figure 5A) with 10 antimicrobial peptides (neutrophil gelatinase-associated lipocalin, lactotransferrin, lysozyme C, neutrophil elastase, cathepsin G, RNAS3, myeloperoxidase, azurocidin, S100A9, and S100A). Interestingly, cluster 1 also contains the MNDA, which acts as a transcriptional activator/repressor in the myeloid lineage, as well as SerpinB1 and integrins (ITGB2 and ITGA6), also involved in immunity. Besides these immune factors, which are considered favorable prognosis factors for EC, ANXA1 is also overexpressed in grade I SLNs and EC and is considered a favorable prognosis gene. However, ANXA3, ANXA11, LGALS3, FTH1, CP (ceruloplasmin), SERPINB1, FLOT1, and FLOT2 are unfavorable markers for the overall survival (Figure S4A). Cluster 2 contains ALDH2, a favorable prognosis gene for EC, and PRSS3, an unfavorable prognosis marker. YBX1, SLC1A5, ALDOA (aldolase, fructose-bisphosphate A), ATP1A1, and UBA2 are unfavorable OS (overall survival) markers (Figure S4A) and were validated in immunocytochemistry and quantified based on pathological atlas data (Figures S4B–S4B″). Moreover, correlation studies between the different grades of SLNs (Figure 5B) or EC (Figure 5C) and between sentinel nodes and EC grades (Figure 5D) established a positive correlation between grades when the datasets are taken individually. Comparison of sentinel nodes and EC grades points out a positive correlation between grade I of both tissues. Using correlation matrices (Figure 5E), we found that PTMA (prothymosin alpha), ACTL6A, SHMT2, RBM25, and RBM4 were detected in grade I, II, and III sentinel nodes as well as in grade I, II, and III of EC. SUB1 and ETHE1 are expressed in grade II and III SLNs and grade II and III EC. DCD is present in grade I and II SLNs and grade I and II EC. YBX2, NOTUM, and RANDBP1 are found specifically in grade III SLNs and grade III EC. NUP210 is specific to grade II SLNs and grade II EC. PADI4, MUC5B, GOLM1, MNDA, CHI3L1, PTX3, SP100, MMP8, AZU1, and SLC9A3R2 are specific to grade I SLNs and grade I EC.
Figure 5.

Similar marker proteins highlighted between SLN and EC according to their grades
(A) Hierarchical clustering of the most variable proteins between heathy tissue and grade I–III SNs and grade I–III EC (n = 3 for each category, ANOVA with permutation-based FDR < 0.01). 3 clusters were identified (1–3), and GSEAs are shown as insets for clusters 1 and 2.
(B–D) Matrix (B) correlation studies between the different grades of SNs, and (C) EC grades (D) between SN and EC grades.
(E) Table of selected markers found in TCGA and detected or not detected in SNs and endometrial carcinoma (EC) at different grades as well as normal/healthy tissue.
We established the presence of markers common between SLNs and EC tissue that are grade dependent. Among the identified markers, PRSS3, PTX3, and ASS1 are considered poor outcome gene marker, whereas ALDH2 and ANXA1 are positive outcome markers. Validation was performed on 13 samples (Table S1; corresponding to 8 patients) by immunofluorescence (Figure 6). In EC, PRSS3 is more expressed in grade III, ASS1 in grade II, and PTX3 and ANXA1 in grade I, whereas ALDH2 is present in grade II and grade III of EC. In SLNs, PRSS3, PTX3, and ASS1 are highly expressed compared with other markers, such as ANXA1 and ALDH2, which are close to undetectable. ASS1, PTX3, and PRSS3 are highly detectable in grade I, whereas their expression is lower in grades II and III. PRSS3 is slightly less detectable in grade II, and its detection is increased in grade III. For PTX3, the level of detection in grades II and III is lower than in grade I. None of them are detected in healthy patients (Figures 6A and 6B). The other markers correlated with poor outcome (YBX1, SLC1A5, ALDOA, ATP1A1, and UBA2) have already been tested on transcription-mediated amplification (TMA), and we confirmed their presence at elevated levels (Figures S4B and S4B″). We also detected some protein markers that can be correlated with a positive outcome, associated with longer overall survival; these included the CD74, GOLM1, SLC9A3R2, and SP100 proteins, according to the TCGA.
Figure 6.

IHC validation of the panel of survival markers identified
Representative fluorescence images of the 5 proteins of EC grades. PRSS3, PTX3, and ASS1 are associated with poor outcome, and ALDH2 and ANX1 are considered positive outcome markers in (A) EC and (B) SLNs. Images were acquired with a confocal microscope at 40× magnification. Scale bars, 20 μm.
Mutations
Several studies have evaluated genetic mutation frequencies in individuals with EC of different tumor grades.31 In this context, we sought to determine whether these mutations can be translated and detected in proteins. For that purpose, we used a human database combined with the XMan v.2 database.32 This database contains information about mutated peptides that can be found in some cancers, extracted from the COSMIC database. Sixty-six mutated peptides were identified (Data S4). Among the proteins from which mutated peptides were identified, we retrieved collagen alpha 1, histones, laminin 1, myosin 9, HDGF, CAP-1, fibrinogen beta unit, tenascin, PTBP1, actin, hemoglobin subunits, integrin beta 2, ACTBL, SRP-14, annexin 6, TMP2, HCLS1, and lactotransferrin (Data S4). Laminin subunit alpha-1 mutated peptide (Figure 7A) is only detected in EC grade II tissue, and HDGF protein is identified in SLN grade I (Data S4). Correlation between SLN grades and EC grades has shown that CO1A1, histone H1A, histone 2A2C, myosin 9, ACTBL1, and HDGF are in common with CO1A1 mutated peptides, which were found in all samples (Data S4; Figure 7).
Figure 7.

Mutation and alternative proteins analyses
(A) MS/MS spectrum of mutated peptides.
(B) Hierarchical clustering of the most variable alternative proteins between healthy tissue and grade I–III (a; n = 3 for each category, ANOVA with permutation-based FDR < 0.01), healthy tissue and grade I–III EC (b; n = 3 for each category, ANOVA with permutation-based FDR < 0.01), and between healthy tissue and grade I–III SNs and grade I–III EC (n = 3 for each category, ANOVA with permutation-based FDR < 0.01).
Ghost proteins
We have previously established the presence of proteins derived from non-canonical human open reading frames promoting cancer metastasis in high-grade serous carcinoma (HGSC) and glioma.33, 34, 35, 36, 37 From our proteomics data, 36 alternative proteins were identified, with more than 80% derived from non-coding RNA (ncRNA), and 10% of the mRNA coding for RefProt is derived from the 5′ UTR, 11% from the 3′ UTR, and 3% from a shift in the CDS (coding sequence) (Data S5). Eleven are common to all tissues (Data S5). Six are common to all grades of sentinel nodes and grade II of EC tissues (Data S5). Only Alt-RBKS, Alt-LOC100128398, Alt-RP11-193H5.1, Alt-CTA-212A2.3, and Alt-HNRNPA1P58 are not expressed in normal endometrial tissue. Alt-CTA-212A2.3, Alt-HNRNPA1P58, Alt-SLC13A1, and Alt-AP002884.2 are absent in normal lymph nodes (Data S5). A heatmap of the different ghost proteins demonstrates the presence of 7 alternative proteins in sentinel nodes.
Alt-HMGN2P3 and Alt-CACUL1 are overexpressed in grade II and III SLNs. The other ones were not quantified or overexpressed (Figure 7Ba). In endometrial tissue, Alt-ACTBP11, Alt-ACTBP8, Alt-CTA-212A2.3, Alt-ACTG1P211, and Alt-LOC101929048 are overexpressed in healthy endometrial tissue. Alt-CALCUL1 and Alt-RBKS are overexpressed in grade II. Amt-NSMCE1 is overexpressed in grade III (Figure 7Bb). The combination of all tissues gave some specific clusters. Alt-CALCUL1, Alt-HMGN2P3, and Alt-RP11-279O17 are overexpressed only in SLN grades II and III. Alt-ACTBP11, Alt-ACTBP8, Alt-LOC101929048, and Alt-RP11-193H5 are only overexpressed in healthy endometrial tissue. No clear alternative proteins in common in sentinel nodes and endometrial tissue can be found (Figure 7Bc).
Discussion
In this work, based on spatially resolved proteomics analysis of grade I–III clinical samples derived from individuals with EC and SLNs, we establish the presence of common proteomics markers that are grade dependent. Compared with recent studies using SWATH-MS (Sequential Window Acquisition of all Theoretical Mass Spectra) proteomics on grade II and grade I EC, we identified all of their validated markers; i.e., CAPS, PKM, AZU1, CNN1, S100A8, STMN1, and CTSG proteins.38 These proteins are known to have interactions with drugs; some of these are US Food and Drug Administration (FDA)-approved drugs, such as SMARCA4.39 However, these markers are not used from SLN analyses to predict EC status. In our study, we identify markers that cross-correlate nodal status with EC grade. Among the markers identified in EC and SLNs, 3 markers (PRSS3, PTX3, and ASS1) are considered poor outcome gene markers in EC, and 2 (ALDH2 and ANX1) are positive outcome markers. These markers are linked to tumor cell motility. In fact, PTX3 contributes to melanoma cell invasion40 as well as in other cancers,41 through a Toll-like receptor 4 (TLR4)/nuclear factor κB (NF-κB) signaling pathway. ASS1 protein is required for cancer cell migration.42,43 PRSS3 is also known to be involved in tumor metastasis.44 PRSS3 upregulates VEGF (vascular endothelial growth factor) expression via the PAR1-mediated ERK (extracellular signal-regulated kinases) pathway and promote tumors progression and metastasis.45 The two positive outcome markers (ANXA1 and ALDH2) are also involved in tumor motility, but in its modulation. ALDH2 is known as one of the key regulators in tumor metastasis, especially in the lungs.46 ALDH2 functions as a mitogen-activated protein kinase (MAPK) upstream to inhibit cell proliferation and migration, promote cell apoptosis, and alter EMT by elevating E-cadherin and attenuating vimentin. The role of ANXA1 in tumor motility and metastasis is still unclear.47 Loss of annexin A1 expression has been observed in breast, gastric, esophageal, prostate, bladder, head and neck, laryngeal, and oral cancer and correlates with tumorigenesis and malignant tendency. However, its expression has also been linked to advanced stages of specific cancers as well as metastatic tendency and degree of differentiation. In this case, ANXA1 expression increased inversely to epithelial markers such as E-cadherin and cytokeratin (CK) 8 and 18 and proportionally to mesenchymal ones such as vimentin, ezrin, and moesin.48 ANXA1 seems to regulate metastasis by favoring cell migration/invasion intracellularly as a cytoskeleton remodeling factor and extracellularly as a ligand of formyl peptide receptor.49,50 Most of these markers have not been reported previously in EC at the protein level, based on IHC data, except the ASS1 protein. We validate these markers using immunofluorescence and confirmed their specific presence in EC, offering new tools for pathologists for diagnosis. Other markers identified as poor outcome markers (YBX1, SLC1A5, ALDOA, ATP1A1, and UBA2) have already been tested on TMA, and their presence in high abundance was confirmed, as we quantified (Figure S4B). We also detected some positive outcome markers (CD74, GOLM1, SLC9A3R2, and SP100) according to overall survival (from the TCGA and pathological protein atlas).17,18 These results provide a clear answer regarding the disagreement among cancer centers regarding the value of lymph node dissection. It is clear that lymph node metastasis is one of the most important prognostic factors in EC. EC and SLN data identified key proteins that can be used to establish this correlation. In fact, PTMA, ACTL6A, SHMT2, RBM25, and RBM4 are detected in SLN and EC grades I and II and in EC grade III, whereas SUB1 and ETHE1 are expressed in SLN and EC grades II and III.
Of interest, the DCD protein is found in SLN and EC grades I and II. The YBX2, NOTUM, and RANDBP1 proteins are found specifically in SLN and EC grade III. NUP210 is specific to SLN and EC grade II. PADI4, MUC5B, GOLM1, MNDA, CHI3L1, PTX3, SP100, MMP8, AZU1, and SLC9A3R2 are specific to grade I SLNs and EC. We can also include proteins with specific mutations as signature markers. Col1A1, histone H1A, histone 2A2C, myoglobin 9, ACTBL1, and HDGF were detected in all cancer tissue, whatever the grade, but lamin1 mutated peptides are only detected in grade II EC tissue and HDGF only in SLN grade I. In addition to these data, another family of proteins has also been identified (i.e., Alt-CALCUL1, Alt-HMGN2P3, and Alt-RP11-279O17) that is overexpressed only in SLN grades II and III.
Based on these specific markers identified in EC and SLNs and ones that are specific to grade I, II, or III, stratification of affected individuals can be established, which will guide treatment decisions. As we detected the 5 markers which were analyzed blind in SLN tissues and validated in EC tissues, SLN mapping is feasible and can accurately predict nodal status in women with EC based on our markers. In this way, the exact underlying molecular mechanisms relating SLN and EC grades have now been highlighted by systemic biology-proteomics-based study, which facilitates accurate EC detection and can be used as a therapeutic endpoint target.
Limitations of study
The study was performed on a cohort of 41 samples from 15 individuals. A larger cohort is needed to definitively establish the markers we identified and validated for routine molecular pathology. Such a large validation cohort is under construction at the national level and will be tested as a multicentric assay though a national PHCR (Programme hospitalier de recherche clinique) from the National Institute of Cancer.
STAR★Methods
Key resources table
| REAGENT or RESOURCE | SOURCE | IDENTIFIER |
|---|---|---|
| Antibodies | ||
| Goat polyclonal anti-ASS1 | Abcam | Cat# ab77590, RRID: AB_2060467 |
| Rabbit polyclonal anti-PRSS3 | Thermo Fisher Scientific | Cat# PA5-23991, RRID: AB_2541491 |
| Rat monoclonal anti-PTX3 | Abcam | Cat# ab90806, RRID: AB_2050229 |
| Rabbit polyclonal anti-ALDH2 | Thermo Fisher Scientific | Cat# PA5-27414, RRID: AB_2544890 |
| Mouse monoclonal anti-ANXA1 | OriGene | Cat# TA500967, RRID: AB_11125833 |
| Biological samples | ||
| Endometrioid biopsies from human patient | Centre Oscar Lambret (Lille France) | Sentirad-1502, EudraCT: 2015-001732-38 |
| Sentinel nodes biopsies from human patient | Centre Oscar Lambret (Lille France) | Sentirad-1502, EudraCT: 2015-001732-38 |
| Chemicals, peptides, and recombinant proteins | ||
| Ammonium bicarbonate (NH4HCO3) | Sigma-Aldrich | 09830; CAS: 1066-33-7 |
| HPLC water | Biosolve | 232106; CAS: 7732-18-5 |
| Formic acid (FA) | Sigma-Aldrich | 695076; CAS: 64-18-6 |
| Trifluoroacetic acid (TFA) | Sigma-Aldrich | T62200; CAS: 76-05-1 |
| Methanol (MeOH) | VWR | 85800; CAS: 67-56-1 |
| Xylene | Sigma-Aldrich | Cat#247642 |
| Acetonitrile (ACN) | VWR | 20060.320 CAS: 75-05-8 |
| Porcine modified trypsin | Promega | Cat#V5111 |
| Tris | Interchim | UP031657; CAS: 77-86-1 |
| Deposited data | ||
| Raw and analyzed data | This paper | ProteomeXchange: PXD020410 |
| Software and algorithms | ||
| MaxQuant v1.5.6.5 | Cox and Mann51 | https://www.maxquant.org/ |
| Perseus v1.6.12.0 | Tyanova et al.52 | http://maxquant.net/perseus/ |
| Proteome Discoverer 2.3 | Thermo Scientific | https://www.thermofisher.com/us/en/home/industrial/mass-spectrometry/liquid-chromatography-mass-spectrometry-lc-ms/lc-ms-software/multi-omics-data-analysis/proteome-discoverer-software.html |
| Python 3.8.3 | Python Software Foundation (PSF) | https://www.python.org/downloads/ |
| R-4.0.0 | R Core Team | https://www.r-project.org/ |
| Cytoscape 3.6.0 | Cytoscape Consortium | https://cytoscape.org/ |
| FunRich | Pathan et al.53 | http://www.funrich.org/ |
| ImageJ | NIH | https://imagej.nih.gov/ij/download.html |
| Other | ||
| Ghost protein database (GRCh38.83, GRCh38.p7) | Openprot | https://openprot.org/ |
| XManV2 database | Aguilera Flores and Lazar32 | https://github.com/lazarlab/XMAn-v2 |
Resource availability
Lead contact
Further information and requests for resources and reagents should be directed to and will be fulfilled by the Lead Contact, Michel Salzet (michel.salzet@univ-lille.fr).
Materials availability
This study did not generate new unique reagents.
Data and code availability
The raw data and result files used for analysis were deposited at the ProteomeXchange Consortium54 (http://proteomecentral.proteomexchange.org) via the PRIDE partner repository with the dataset identifier PXD020410.
Experimental model and subject details
A cohort of 41 samples was selected for this study including 6 healthy Endometrium, 4 Grade I endometrioid, 8 Grade II endometrioid, 4 Grade III endometrioid, 3 Normal sentinel nodes, 4 Grade I sentinel nodes, 8 Grade II sentinel nodes, 4 Grade III sentinel nodes. The age, type of tumors and patient information has been described in Table S1. The normal tissue was analyzed from a healthy normal tissue section (presenting no abnormalities on IHC) from a patient with p53 signature lesion. Prior to the experiments, patients were asked to sign an informed consent, authorization form describing the experimental protocol and instrument and exposure to the hazards. No personal information and data, such as the name of the individuals and identifiers were used in these experiments. A randomized number was assigned to everyone. This clinical study (Sentirad-1502, EudraCT: 2015-001732-38): Randomized study comparing sentinel node (SN) policy to current French initial staging protocols in early-stage endometrial carcinomas at intermediate and high risk of recurrence is supported by the French cancer clinical research projects funding program 2014 (National Cancer Institute, INCa). The endometrioid and sentinel nodes biopsies were obtained from patients of the Centre Oscar Lambret (Lille, France). All experiments were approved by the local Ethics Committee (CPP Nord-Ouest I on July 20th, 2015, CPP 03/008/2015) in accordance with the French and European legislation on this topic. The study complies with the MR004 reference methodology adopted by the French Data Protection Authority (Paris, France), and we checked that patients did not object to the use of their data and biological samples for research purposes. Serial sections of sentinel nodes were realized every 2-3 mm and then formalin-fixed and paraffin-embedded. On these tissues, HPS and immunostaining of pancytokeratins (CKAE1/3, CKAE1/4, CKAE1/5), P53, L1CAM were performed. Twenty-four samples were selected for spatially resolved shotgun microproteomic analyses (Table S1). This sample selection has been performed by taking into account the ability to find in the same patient the same Grade in endometrial carcinoma and in sentinel nodes tissues. This cohort is considered a diverse representative of the population as each sample is biologically investigated in triplicate.
Method details
Antigen retrieval
All the slides were unmounted, and the resin was removed by soaking them overnight in xylene and rinsing them with xylene and ethanol baths. The tissues are rehydrated using 5′ each successive bath of decreasing ethanol degree (2x95°, 1x30°) and two baths of 10mM NH4HCO3 buffer. Then, antigen retrieval was performed to relax the tissue and increase the trypsin access to biomolecules. Slides are dipped in 90°C pH9 20mM Tris for 30 minutes, rinsed in two baths of 10mM NH4HCO3 for 2 minutes each, and dried under vacuum at room temperature.
Microproteomic analysis
Areas of interest have been selected on the tissue. These areas were digested, extracted and then analyzed in nanoLC-MS.
Trypsin digestion on tissue
Tryptic digestion was performed using a Chemical Inkjet Printer (CHIP-100, Shimadzu, Kyoto, Japan). The regions were selected from the tissue scanned on the software, and then the trypsin solution (40μg/mL, 50mM NH4HCO3 buffer) was deposited on these region defined to 1mm2 for 2h. During this time, the trypsin was changed every half-hour to avoid the autolytic digestion. With 350 cycles and 450pl per spot, a total of 6.3μg was deposited. To stop the digestion, TFA 0.1% was spotted during 25 cycles.
Liquid extraction
After microdigestion, the content of the spot was collected by liquid microjunction using the TriVersa Nanomate (Advion Biosciences Inc., Ithaca, NY, USA) using the parameters of liquid extraction and surface analysis (LESA). 3 Mixtures of different extraction solvents have been prepared and are composed of 0.1% TFA, ACN / 0.1% TFA (8: 2, v / v) and MeOH / 0.1% TFA (7: 3, v / v). A complete LESA sequence run 2 cycles for each mixture solvent. The first step was to aspirate 2μl of solvent into a tip, 0.6 μl was deposited on the tissue to create a liquid microjunction with 10 aspirate-dispense cycles to perform the extraction, and the extracted solution was collected in 0.2 mL weak binding tubes. For each interesting spot, 2 sequences are grouped together in the same bottle.
NanoLC-ESI-MS2
After liquid extraction, samples were freeze-dried in a SpeedVac concentrator (SPD131DPA, ThermoScientific, Waltham, Massachusetts, USA), reconstituted with 10μL 0.1% TFA and subjected to solid-phase extraction to remove salts and concentrate the peptides. This was done using a C-18 ZipTip protocol (Millipore, Saint-Quentin-en-Yvelines, France). The pipettor was set to 10μL and the ZipTip pipette tip was washing by performing 5 aspirate-dispense cycles in ACN, and equilibrated by 5 aspirate-dispense in TFA 0.1%. To bind peptides, 20 aspirate-dispense was performed in the sample and 10 times in TFA 0.1% to remove salts. Peptides were eluted with 20μl of ACN/0.1% TFA (8:2, v/v) by realizing 20 aspirate-dispense, and then the samples were dried for storage. Before analysis, samples were suspended in 20μL ACN/0.1% FA (2:98, v/v), deposited in nanoLC vials and 10μL were injected for analysis. The separation prior to the MS used online reversed-phase chromatography coupled with a Proxeon Easy-nLC-1000 system (Thermo Scientific) equipped with an Acclaim PepMap trap column (75 μm ID x 2 cm, Thermo Scientific) and C18 packed tip Acclaim PepMap RSLC column (75 μm ID x 50 cm, Thermo Scientific). Peptides were separated using an increasing amount of acetonitrile (5%–40% over 145 minutes) and a flow rate of 300 nL/min. The separation column was kept at 50°C. The LC eluent was electrosprayed directly from the analytical column and a voltage of 2 kV was applied via the liquid junction of the nanospray source. The chromatography system was coupled to a Thermo Scientific Q-Exactive Orbitrap mass spectrometer. The mass spectrometer was programmed to acquire in a data-dependent mode defined to analyze the 10 most intense ions of MS analysis (Top 10). The survey scans were acquired in the Orbitrap mass analyzer operated at 70,000 (FWHM) resolving power. The MS analysis was performed with an m/z mass range between 300 to 1600, an AGC of 3e6 ions and a maximum injection time of 120 ms. The MS/MS analysis was performed with an m/z mass range between 200 to 2000, an AGC of 50000 ions, a maximum injection time of 60 ms and the resolution was set at 17,500 FWHM. Higher Energy Collision Dissociation (HCD) was set to 30%. Precursors ions with charges states > +1 and < +8 were kept for the fragmentation, with a dynamic exclusion time of 20 s.
Quantification and statistical analysis
Data interrogation and analyses
All MS data were processed with MaxQuant51,52 (Version 1.5.6.5) using the Andromeda55 search engine. The proteins were identified by searching MS and MS/MS data against the Decoy version of the complete proteome for Homo sapiens in the UniProt database (Release March 2017, 70941 entries) combined with 262 commonly detected contaminants. Trypsin specificity was used for digestion mode, with N-terminal acetylation and methionine oxidation selected as a variable modification. We allowed up to two missed cleavages. Initial mass accuracy of 6 ppm was selected for MS spectra, and the MS/MS tolerance was set to 20 ppm for the HCD data. For the identification parameters, FDR at the peptide spectrum matches (PSM) and protein level was set to 1%, and a minimum of 2 peptides per protein in which 1 was unique. Relative label-free quantification of the proteins was conducted into Max-Quant using the MaxLFQ algorithm56 with default parameters. Analysis of the identified proteins was performed using Perseus software (http://maxquant.net/perseus/) (version 1.6.12.0). The file containing the information from the identification (proteinGroup.txt) was used. Briefly, the LFQ intensity of each sample were downloaded in Perseus and the data matrix was filtered by removing the potential contaminants, reverse and only identified by site. The LFQ intensity was logarithmized (log2[x]). Categorical annotation of the rows was used to define the different group. Venn diagram and principal component analysis (PCA) were done to compare the protein content of each sample. Statistical multiple-sample tests were performed using ANOVA with a p value of 1%. Normalization was achieved using a Z-score with matrix access by rows. Only proteins that were significant by ANOVA were used. The hierarchical clustering and profile plot of only the statistically significant proteins were all performed and visualized by Perseus. Each protein cluster were selected and extracted for biological analysis. Functional annotation and characterization of the identified proteins were performed using FunRich software (version 3) and STRING (version 9.1, http://stringdb.org).57 Pearson’s correlation coefficient and matrix representation were generated in R software using corrplot package. Gene Set Enrichment Analysis (GSEA) and Cytoscape software (version 3.6.1) were used for the biological process analysis of the clusters selected from the heatmap.
Subnetwork Enrichment Pathway Analyses and statistical Testing
The Elsevier’s Pathway Studio version 10.0 (Ariadne Genomics/Elsevier) was used to deduce relationships among differentially expressed proteomics protein candidates using the Ariadne ResNet database.58,59 “Subnetwork Enrichment Analysis” (SNEA) algorithm was selected to extract statistically significant altered biological and functional pathways pertaining to each identified set of protein hits among the different groups. SNEA utilizes Fisher’s statistical test set to determine if there are nonrandom associations between two categorical variables organized by specific relationships. Integrated Venn diagram analysis was performed using “the InteractiVenn”: a web-based tool for the analysis of complex datasets.60
Mutation identification
Proteins identification was also performed using the mutation-specific database.32 XMan v2 database contains 2 539 031 mutated peptide sequences from 17 599 Homo sapiens proteins (2 377 103 are missense and 161 928 are nonsense mutations). The interrogation was performed by Proteome Discoverer 2.3 software and Sequest HT package, using an iterative method. The precursor mass tolerance was set to 15 ppm and the fragment mass tolerance was set to 0.02 Da. For high confidence result, the false discovery rate (FDR) values were specified to 1%. A filter with a minimum Xcorr of 2 was applied. The generated result file was filtered using a Python script to remove unmutated peptides. All mutations were then manually checked based on MSMS spectra profile.
Ghost proteins identification
RAW data obtained by nanoLC-MS/MS analysis were analyzed using Proteome Discoverer V2.2 (Thermo Scientific) with the following parameters: Trypsin as an enzyme, 2 missed cleavages, methionine oxidation as a variable modification and carbamidomethylation of cysteines as static modification, Precursor Mass Tolerance: 10 ppm and Fragment mass tolerance: 0.6 Da. The validation was performed using Percolator with an FDR set to 1%. A consensus workflow was then applied for the statistical arrangement, using the high confidence protein identification. The protein database was uploaded from Openprot (https://openprot.org/) and included RefProt, novel isoforms, and AltProts predicted from both Ensembl and RefSeq annotations (GRCh38.83, GRCh38.p7).35
Confirmatory immunohistochemistry analyses
Grading group validation was performed using antibodies directed against ALDH2, ANXA1, PRSS3, ASS1 and PTX3. After dewaxing and antigen retrieval with citrate buffer, the tissues were incubated with a primary antibody at 4°C overnight, followed by application of a secondary antibody (Alexa fluor conjugated antibody, 1/1 000 dilutions) for 1 hour at RT. We used the following primary antibodies: ALDH2 (Invitrogen; 1/500 dilution), ANXA1 (OriGene, 1/50 dilution), PRSS3 (Invitrogen, 1/100 dilution), ASS1 (Abcam; 1/100 dilution) and PTX3 (Abcam, 1/100 dilution). All slides were imaged on the Zeiss LSM700 confocal microscope. Three pictures were taken for each tumor section.
Additional Resources
More information can be obtained at https://clinicaltrials.gov/ct2/show/study/NCT02598219. ClinicalTrials.gov Identifier: NCT02598219 (Sentirad-1502).
Acknowledgments
This research was supported by grants from the Ministère de L’Education Nationale, de L’Enseignement Supérieur et de la Recherche and SIRIC ONCOLille (to I.F.) and INCa-DGOS-INSERM 6041aa, Inserm, and the PHRC SENTIRAD (to E.L.).
Author contributions
I.F., M.W., and M.S. conceived the study. M.W., P.S., S.A., and M.D. performed the experiments. E.L. and F.N. performed surgery. The pathology analysis was done by A.-S.L. F.K. performed the systemic biology analyses. S.A. and T.C. performed data analyses. I.F. and M.S. supervised the project, participated in experimental design and data analyses, and wrote the manuscript with contributions from all co-authors. M.S. and I.F. acquired funding for the project.
Declaration of interests
The authors declare no competing interests.
Published: June 15, 2021
Footnotes
Supplemental information can be found online at https://doi.org/10.1016/j.xcrm.2021.100318.
Contributor Information
Eric Leblanc, Email: e-leblanc@o-lambret.fr.
Isabelle Fournier, Email: isabelle.fournier@univ-lille.fr.
Michel Salzet, Email: michel.salzet@univ-lille.fr.
Supplemental information
References
- 1.Berveiller P., Mir O., Veyrie N., Barranger E. The sentinel-node concept: a dramatic improvement in breast-cancer surgery. Lancet Oncol. 2010;11:906. doi: 10.1016/S1470-2045(09)70237-2. [DOI] [PubMed] [Google Scholar]
- 2.Gould E.A., Winship T., Philbin P.H., Kerr H.H. Observations on a “sentinel node” in cancer of the parotid. Cancer. 1960;13:77–78. doi: 10.1002/1097-0142(196001/02)13:1<77::aid-cncr2820130114>3.0.co;2-d. [DOI] [PubMed] [Google Scholar]
- 3.Abu-Rustum N.R. Sentinel lymph node mapping for endometrial cancer: a modern approach to surgical staging. J. Natl. Compr. Canc. Netw. 2014;12:288–297. doi: 10.6004/jnccn.2014.0026. [DOI] [PubMed] [Google Scholar]
- 4.Cabanas R.M. An approach for the treatment of penile carcinoma. Cancer. 1977;39:456–466. doi: 10.1002/1097-0142(197702)39:2<456::aid-cncr2820390214>3.0.co;2-i. [DOI] [PubMed] [Google Scholar]
- 5.Cascinelli N., Belli F., Santinami M., Fait V., Testori A., Ruka W., Cavaliere R., Mozzillo N., Rossi C.R., MacKie R.M. Sentinel lymph node biopsy in cutaneous melanoma: the WHO Melanoma Program experience. Ann. Surg. Oncol. 2000;7:469–474. doi: 10.1007/s10434-000-0469-z. [DOI] [PubMed] [Google Scholar]
- 6.Tanis P.J., Nieweg O.E., Valdés Olmos R.A., Th Rutgers E.J., Kroon B.B. History of sentinel node and validation of the technique. Breast Cancer Res. 2001;3:109–112. doi: 10.1186/bcr281. [DOI] [PMC free article] [PubMed] [Google Scholar]
- 7.Mais V., Cirronis M.G., Piras B., Silvetti E., Cossu E., Melis G.B. Intraoperative lymphatic mapping techniques for endometrial cancer. Expert Rev. Anticancer Ther. 2011;11:83–93. doi: 10.1586/era.10.181. [DOI] [PubMed] [Google Scholar]
- 8.Burke T.W., Levenback C., Tornos C., Morris M., Wharton J.T., Gershenson D.M. Intraabdominal lymphatic mapping to direct selective pelvic and paraaortic lymphadenectomy in women with high-risk endometrial cancer: results of a pilot study. Gynecol. Oncol. 1996;62:169–173. doi: 10.1006/gyno.1996.0211. [DOI] [PubMed] [Google Scholar]
- 9.Abu-Rustum N.R. Springer; 2013. The increasing credibility of sentinel lymph node mapping in endometrial cancer. [DOI] [PubMed] [Google Scholar]
- 10.Touboul C., Bentivegna E., Uzan C., Gouy S., Pautier P., Lhommé C., Duvillard P., Haie-Meder C., Morice P. Sentinel lymph node in endometrial cancer: a review. Curr. Oncol. Rep. 2013;15:559–565. doi: 10.1007/s11912-013-0345-1. [DOI] [PubMed] [Google Scholar]
- 11.Smith A.J.B., Fader A.N., Tanner E.J. Sentinel lymph node assessment in endometrial cancer: a systematic review and meta-analysis. Am. J. Obstet. Gynecol. 2017;216:459–476.e10. doi: 10.1016/j.ajog.2016.11.1033. [DOI] [PubMed] [Google Scholar]
- 12.Rossi E.C., Kowalski L.D., Scalici J., Cantrell L., Schuler K., Hanna R.K., Method M., Ade M., Ivanova A., Boggess J.F. A comparison of sentinel lymph node biopsy to lymphadenectomy for endometrial cancer staging (FIRES trial): a multicentre, prospective, cohort study. Lancet Oncol. 2017;18:384–392. doi: 10.1016/S1470-2045(17)30068-2. [DOI] [PubMed] [Google Scholar]
- 13.Liu S.-L., Han Y., Zhang Y., Xie C.-Y., Wang E.-H., Miao Y., Li H.-Y., Xu H.-T., Dai S.-D. Expression of metastasis-associated protein 2 (MTA2) might predict proliferation in non-small cell lung cancer. Target. Oncol. 2012;7:135–143. doi: 10.1007/s11523-012-0215-z. [DOI] [PubMed] [Google Scholar]
- 14.Park J.-O., Jung C.-K., Sun D.-I., Joo Y.-H., Kim M.-S. Relationships between metastasis-associated protein (MTA) 1 and lymphatic metastasis in tonsil cancer. Eur. Arch. Otorhinolaryngol. 2011;268:1329–1334. doi: 10.1007/s00405-010-1478-6. [DOI] [PubMed] [Google Scholar]
- 15.Jang K.-S., Paik S.S., Chung H., Oh Y.-H., Kong G. MTA1 overexpression correlates significantly with tumor grade and angiogenesis in human breast cancers. Cancer Sci. 2006;97:374–379. doi: 10.1111/j.1349-7006.2006.00186.x. [DOI] [PMC free article] [PubMed] [Google Scholar]
- 16.Xu X., Kong X., Liu T., Zhou L., Wu J., Fu J., Wang Y., Zhu M., Yao S., Ding Y. Metastasis-associated protein 1, modulated by miR-30c, promotes endometrial cancer progression through AKT/mTOR/4E-BP1 pathway. Gynecol. Oncol. 2019;154:207–217. doi: 10.1016/j.ygyno.2019.04.005. [DOI] [PubMed] [Google Scholar]
- 17.Cancer Genome Atlas Research Network. Weinstein J.N., Collisson E.A., Mills G.B., Shaw K.R.M., Ozenberger B.A., Ellrott K., Shmulevich I., Sander C., Stuart J.M. The cancer genome atlas pan-cancer analysis project. Nat. Genet. 2013;45:1113–1120. doi: 10.1038/ng.2764. [DOI] [PMC free article] [PubMed] [Google Scholar]
- 18.Uhlen M., Zhang C., Lee S., Sjöstedt E., Fagerberg L., Bidkhori G., Benfeitas R., Arif M., Liu Z., Edfors F. A pathology atlas of the human cancer transcriptome. Science. 2017;357:eaan2507. doi: 10.1126/science.aan2507. [DOI] [PubMed] [Google Scholar]
- 19.Sica A., Porta C., Amadori A., Pastò A. Tumor-associated myeloid cells as guiding forces of cancer cell stemness. Cancer Immunol. Immunother. 2017;66:1025–1036. doi: 10.1007/s00262-017-1997-8. [DOI] [PMC free article] [PubMed] [Google Scholar]
- 20.Shen W., Xie J., Zhao S., Du R., Luo X., He H., Jiang S., Hao N., Chen C., Guo C. ICAM3 mediates inflammatory signaling to promote cancer cell stemness. Cancer Lett. 2018;422:29–43. doi: 10.1016/j.canlet.2018.02.034. [DOI] [PMC free article] [PubMed] [Google Scholar]
- 21.Werner H.M.J., Salvesen H.B. Current status of molecular biomarkers in endometrial cancer. Curr. Oncol. Rep. 2014;16:403. doi: 10.1007/s11912-014-0403-3. [DOI] [PubMed] [Google Scholar]
- 22.Reyes H.D., Bosquet J.G., Stephan J.M., McDonald M.E., Leslie K.K. Stathmin over-expression correlates with poor prognosis in patients with endometrial cancer. Gynecologic Oncology. 2015;137:66. [Google Scholar]
- 23.Liu L., Jiao J., Wang Y., Zhang D., Wu J., Huang D. Lack of association of the TP53BP1 Glu353Asp polymorphism with risk of cancer: a systematic review and meta-analysis. PLoS One. 2014;9:e90931. doi: 10.1371/journal.pone.0090931. [DOI] [PMC free article] [PubMed] [Google Scholar]
- 24.Subramanian A., Tamayo P., Mootha V.K., Mukherjee S., Ebert B.L., Gillette M.A., Paulovich A., Pomeroy S.L., Golub T.R., Lander E.S., Mesirov J.P. Gene set enrichment analysis: a knowledge-based approach for interpreting genome-wide expression profiles. Proc. Natl. Acad. Sci. USA. 2005;102:15545–15550. doi: 10.1073/pnas.0506580102. [DOI] [PMC free article] [PubMed] [Google Scholar]
- 25.Smoot M.E., Ono K., Ruscheinski J., Wang P.-L., Ideker T. Cytoscape 2.8: new features for data integration and network visualization. Bioinformatics. 2011;27:431–432. doi: 10.1093/bioinformatics/btq675. [DOI] [PMC free article] [PubMed] [Google Scholar]
- 26.Wang Z.-Q., Milne K., Webb J.R., Watson P.H. CD74 and intratumoral immune response in breast cancer. Oncotarget. 2017;8:12664–12674. doi: 10.18632/oncotarget.8610. [DOI] [PMC free article] [PubMed] [Google Scholar]
- 27.Rettig W.J., Garin-Chesa P., Healey J.H., Su S.L., Jaffe E.A., Old L.J. Identification of endosialin, a cell surface glycoprotein of vascular endothelial cells in human cancer. Proc. Natl. Acad. Sci. USA. 1992;89:10832–10836. doi: 10.1073/pnas.89.22.10832. [DOI] [PMC free article] [PubMed] [Google Scholar]
- 28.Lahad J.P., Mills G.B., Coombes K.R. Stem cell–ness: a “magic marker” for cancer. J. Clin. Invest. 2005;115:1463–1467. doi: 10.1172/JCI25455. [DOI] [PMC free article] [PubMed] [Google Scholar]
- 29.Cardon T., Franck J., Coyaud E., Laurent E.M.N., Damato M., Maffia M., Vergara D., Fournier I., Salzet M. Alternative proteins are functional regulators in cell reprogramming by PKA activation. Nucleic Acids Res. 2020;48:7864–7882. doi: 10.1093/nar/gkaa277. [DOI] [PMC free article] [PubMed] [Google Scholar]
- 30.Chen Y.-C., Pohl G., Wang T.-L., Morin P.J., Risberg B., Kristensen G.B., Yu A., Davidson B., Shih I.-M. Apolipoprotein E is required for cell proliferation and survival in ovarian cancer. Cancer Res. 2005;65:331–337. [PubMed] [Google Scholar]
- 31.Althubiti M.A. Mutation frequencies in endometrial Cancer patients of different ethnicities and tumor grades: an analytical study. Saudi J. Med. Med. Sci. 2019;7:16–21. doi: 10.4103/sjmms.sjmms_154_18. [DOI] [PMC free article] [PubMed] [Google Scholar]
- 32.Aguilera Flores M., Lazar I.M. XMAn v2—a database of Homo sapiens mutated peptides. Bioinformatics. 2020;36:1311–1313. doi: 10.1093/bioinformatics/btz693. [DOI] [PMC free article] [PubMed] [Google Scholar]
- 33.Vergara D., Verri T., Damato M., Trerotola M., Simeone P., Franck J., Fournier I., Salzet M., Maffia M. A Hidden Human Proteome Signature Characterizes the Epithelial Mesenchymal Transition Program. Curr. Pharm. Des. 2020;26:372–375. doi: 10.2174/1381612826666200129091610. [DOI] [PubMed] [Google Scholar]
- 34.Cardon T., Hervé F., Delcourt V., Roucou X., Salzet M., Franck J., Fournier I. Optimized Sample Preparation Workflow for Improved Identification of Ghost Proteins. Anal. Chem. 2020;92:1122–1129. doi: 10.1021/acs.analchem.9b04188. [DOI] [PubMed] [Google Scholar]
- 35.Cardon T., Salzet M., Franck J., Fournier I. Nuclei of HeLa cells interactomes unravel a network of ghost proteins involved in proteins translation. Biochim. Biophys. Acta, Gen. Subj. 2019;1863:1458–1470. doi: 10.1016/j.bbagen.2019.05.009. [DOI] [PubMed] [Google Scholar]
- 36.Delcourt V., Brunelle M., Roy A.V., Jacques J.F., Salzet M., Fournier I., Roucou X. The protein coded by a short open reading frame, not by the annotated coding sequence is the main gene product of the dual-coding gene MIEF1. Mol. Cell. Proteomics. 2018;17:2402–2411. doi: 10.1074/mcp.RA118.000593. [DOI] [PMC free article] [PubMed] [Google Scholar]
- 37.Vanderperre B., Lucier J.F., Bissonnette C., Motard J., Tremblay G., Vanderperre S., Wisztorski M., Salzet M., Boisvert F.M., Roucou X. Direct detection of alternative open reading frames translation products in human significantly expands the proteome. PLoS ONE. 2013;8:e70698. doi: 10.1371/journal.pone.0070698. [DOI] [PMC free article] [PubMed] [Google Scholar]
- 38.Janacova L., Faktor J., Capkova L., Paralova V., Pospisilova A., Podhorec J., Ebhardt H.A., Hrstka R., Nenutil R., Aebersold R., Bouchal P. SWATH-MS Analysis of FFPE Tissues Identifies Stathmin as a Potential Marker of Endometrial Cancer in Patients Exposed to Tamoxifen. J. Proteome Res. 2020;19:2617–2630. doi: 10.1021/acs.jproteome.0c00064. [DOI] [PubMed] [Google Scholar]
- 39.Krug K., Jaehnig E.J., Satpathy S., Blumenberg L., Karpova A., Anurag M., Miles G., Mertins P., Geffen Y., Tang L.C., Clinical Proteomic Tumor Analysis Consortium Proteogenomic landscape of breast cancer tumorigenesis and targeted therapy. Cell. 2020;183:1436–1456.e31. doi: 10.1016/j.cell.2020.10.036. [DOI] [PMC free article] [PubMed] [Google Scholar]
- 40.Rathore M., Girard C., Ohanna M., Tichet M., Ben Jouira R., Garcia E., Larbret F., Gesson M., Audebert S., Lacour J.-P. Cancer cell-derived long pentraxin 3 (PTX3) promotes melanoma migration through a toll-like receptor 4 (TLR4)/NF-κB signaling pathway. Oncogene. 2019;38:5873–5889. doi: 10.1038/s41388-019-0848-9. [DOI] [PubMed] [Google Scholar]
- 41.Doni A., Stravalaci M., Inforzato A., Magrini E., Mantovani A., Garlanda C., Bottazzi B. The long pentraxin PTX3 as a link between innate immunity, tissue remodeling, and cancer. Front. Immunol. 2019;10:712. doi: 10.3389/fimmu.2019.00712. [DOI] [PMC free article] [PubMed] [Google Scholar]
- 42.Tsai C.Y., Chi H.C., Chi L.M., Yang H.Y., Tsai M.M., Lee K.F., Huang H.W., Chou L.F., Cheng A.J., Yang C.W. Argininosuccinate synthetase 1 contributes to gastric cancer invasion and progression by modulating autophagy. FASEB J. 2018;32:2601–2614. doi: 10.1096/fj.201700094R. [DOI] [PubMed] [Google Scholar]
- 43.Shan Y.-S., Hsu H.-P., Lai M.-D., Yen M.-C., Chen W.-C., Fang J.-H., Weng T.-Y., Chen Y.-L. Argininosuccinate synthetase 1 suppression and arginine restriction inhibit cell migration in gastric cancer cell lines. Sci. Rep. 2015;5:9783. doi: 10.1038/srep09783. [DOI] [PMC free article] [PubMed] [Google Scholar]
- 44.Ma H., Hockla A., Mehner C., Coban M., Papo N., Radisky D.C., Radisky E.S. PRSS3/Mesotrypsin and kallikrein-related peptidase 5 are associated with poor prognosis and contribute to tumor cell invasion and growth in lung adenocarcinoma. Sci. Rep. 2019;9:1844. doi: 10.1038/s41598-018-38362-0. [DOI] [PMC free article] [PubMed] [Google Scholar]
- 45.Jiang G., Cao F., Ren G., Gao D., Bhakta V., Zhang Y., Cao H., Dong Z., Zang W., Zhang S. PRSS3 promotes tumour growth and metastasis of human pancreatic cancer. Gut. 2010;59:1535–1544. doi: 10.1136/gut.2009.200105. [DOI] [PubMed] [Google Scholar]
- 46.Yang M., Wang A., Li C., Sun J., Yi G., Cheng H., Liu X., Wang Z., Zhou Y., Yao G. Methylation-induced silencing of ALDH2 facilitates lung adenocarcinoma bone metastasis by activating the MAPK pathway. Front. Oncol. 2020;10:1141. doi: 10.3389/fonc.2020.01141. [DOI] [PMC free article] [PubMed] [Google Scholar]
- 47.Biaoxue R., Xiguang C., Shuanying Y. Annexin A1 in malignant tumors: current opinions and controversies. Int. J. Biol. Markers. 2014;29:e8–e20. doi: 10.5301/jbm.5000046. [DOI] [PubMed] [Google Scholar]
- 48.Yang W., Wang K., Ma J., Hui K., Lv W., Ma Z., Huan M., Luo L., Wang X., Li L. Inhibition of Androgen Receptor Signaling Promotes Prostate Cancer Cell Migration via Upregulation of Annexin A1 Expression. Arch. Med. Res. 2021;52:174–181. doi: 10.1016/j.arcmed.2020.10.005. [DOI] [PubMed] [Google Scholar]
- 49.Pessolano E., Belvedere R., Bizzarro V., Franco P., Marco I., Petrella F., Porta A., Tosco A., Parente L., Perretti M., Petrella A. Annexin A1 contained in extracellular vesicles promotes the activation of keratinocytes by Mesoglycan effects: an autocrine loop through FPRs. Cells. 2019;8:753. doi: 10.3390/cells8070753. [DOI] [PMC free article] [PubMed] [Google Scholar]
- 50.Belvedere R., Bizzarro V., Popolo A., Dal Piaz F., Vasaturo M., Picardi P., Parente L., Petrella A. Role of intracellular and extracellular annexin A1 in migration and invasion of human pancreatic carcinoma cells. BMC Cancer. 2014;14:961. doi: 10.1186/1471-2407-14-961. [DOI] [PMC free article] [PubMed] [Google Scholar]
- 51.Cox J., Mann M. MaxQuant enables high peptide identification rates, individualized p.p.b.-range mass accuracies and proteome-wide protein quantification. Nat. Biotechnol. 2008;26:1367–1372. doi: 10.1038/nbt.1511. [DOI] [PubMed] [Google Scholar]
- 52.Tyanova S., Temu T., Sinitcyn P., Carlson A., Hein M.Y., Geiger T., Mann M., Cox J. The Perseus computational platform for comprehensive analysis of (prote)omics data. Nat. Methods. 2016;13:731–740. doi: 10.1038/nmeth.3901. [DOI] [PubMed] [Google Scholar]
- 53.Pathan M., Keerthikumar S., Ang C.S., Gangoda L., Quek C.Y., Williamson N.A., Mouradov D., Sieber O.M., Simpson R.J., Salim A. FunRich: An open access standalone functional enrichment and interaction network analysis tool. Proteomics. 2015;15:2597–2601. doi: 10.1002/pmic.201400515. [DOI] [PubMed] [Google Scholar]
- 54.Vizcaíno J.A., Deutsch E.W., Wang R., Csordas A., Reisinger F., Ríos D., Dianes J.A., Sun Z., Farrah T., Bandeira N. ProteomeXchange provides globally coordinated proteomics data submission and dissemination. Nat. Biotechnol. 2014;32:223–226. doi: 10.1038/nbt.2839. [DOI] [PMC free article] [PubMed] [Google Scholar]
- 55.Cox J., Neuhauser N., Michalski A., Scheltema R.A., Olsen J.V., Mann M. Andromeda: a peptide search engine integrated into the MaxQuant environment. J. Proteome Res. 2011;10:1794–1805. doi: 10.1021/pr101065j. [DOI] [PubMed] [Google Scholar]
- 56.Cox J., Hein M.Y., Luber C.A., Paron I., Nagaraj N., Mann M. Accurate proteome-wide label-free quantification by delayed normalization and maximal peptide ratio extraction, termed MaxLFQ. Mol. Cell. Proteomics. 2014;13:2513–2526. doi: 10.1074/mcp.M113.031591. [DOI] [PMC free article] [PubMed] [Google Scholar]
- 57.Szklarczyk D., Franceschini A., Kuhn M., Simonovic M., Roth A., Minguez P., Doerks T., Stark M., Muller J., Bork P. The STRING database in 2011: functional interaction networks of proteins, globally integrated and scored. Nucleic Acids Res. 2011;39:D561–D568. doi: 10.1093/nar/gkq973. [DOI] [PMC free article] [PubMed] [Google Scholar]
- 58.Bonnet A., Lagarrigue S., Liaubet L., Robert-Granié C., Sancristobal M., Tosser-Klopp G. Pathway results from the chicken data set using GOTM, Pathway Studio and Ingenuity softwares. BMC Proc. 2009;3(Suppl 4):S11. doi: 10.1186/1753-6561-3-S4-S11. [DOI] [PMC free article] [PubMed] [Google Scholar]
- 59.Yuryev A., Kotelnikova E., Daraselia N. Ariadne’s ChemEffect and Pathway Studio knowledge base. Expert Opin. Drug Discov. 2009;4:1307–1318. doi: 10.1517/17460440903413488. [DOI] [PubMed] [Google Scholar]
- 60.Heberle H., Meirelles G.V., da Silva F.R., Telles G.P., Minghim R. InteractiVenn: a web-based tool for the analysis of sets through Venn diagrams. BMC Bioinformatics. 2015;16:169. doi: 10.1186/s12859-015-0611-3. [DOI] [PMC free article] [PubMed] [Google Scholar]
Associated Data
This section collects any data citations, data availability statements, or supplementary materials included in this article.
Supplementary Materials
Data Availability Statement
The raw data and result files used for analysis were deposited at the ProteomeXchange Consortium54 (http://proteomecentral.proteomexchange.org) via the PRIDE partner repository with the dataset identifier PXD020410.