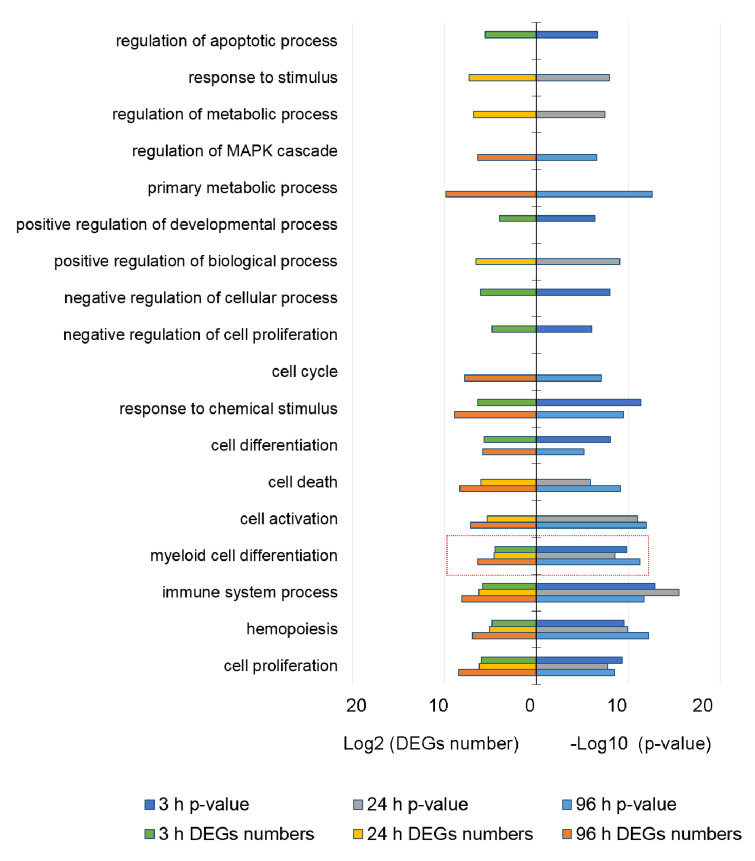
Figure 2.
The functional GO analysis of differentially expressed genes (DEGs) of HL-60 cells at 3 h, 24 h, and 96 h after ATRA treatment. The number of DEGs (Log2 transformed) and p-value (-Log10 transformed) are provided on the x-axis. The groups from the category of “Biological process” are on the y-axis. The threshold adjusted p-value < 10−4. The group of “myeloid cell differentiation” (MCD, GO: 0030099) is marked by red color.

