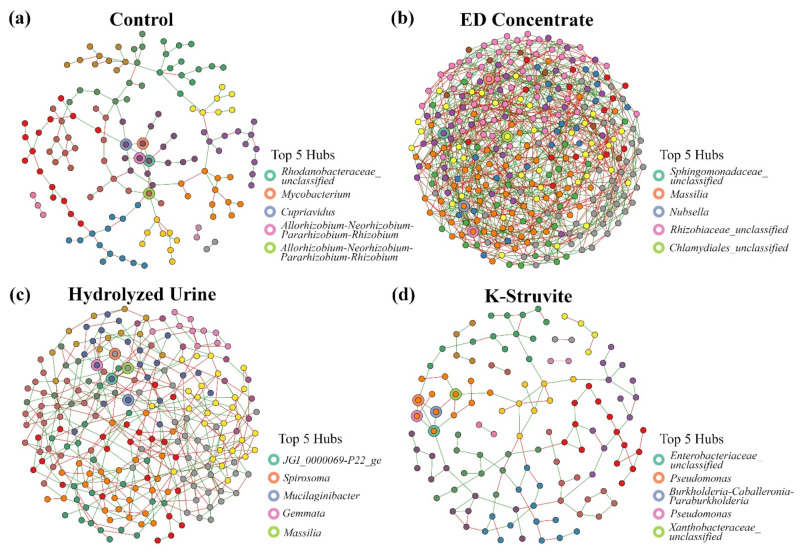
Figure 4.
Lettuce root-associated bacterial community networks grouped per urine-derived fertilizer treatment: (a) NPK control network with 141 nodes, 149 edges (102 positives and 47 negatives), and 15 clusters with a 0.82 modularity (i.e., a measure for how good the division in clusters is); (b) Electrodialysis (ED) concentrate network with 311 nodes, 964 edges (539 positives and 425 negatives), and 9 clusters (modularity = 0.45); (c) Hydrolyzed urine network with 222 nodes, 413 edges (228 positives and 185 negatives), and 11 clusters (modularity = 0.60); (d) K-struvite network with 120 nodes, 130 edges (92 positives and 38 negatives), and 15 clusters (modularity = 0.79). Nodes are colored by cluster (clusters were determined using the fast greedy modularity optimization algorithm). The top 5 hub nodes are indicated by the colored borders (hubs were determined using Kleinberg’s hub centrality scores). The green and red edges indicate a positive or negative correlation between the network nodes, respectively.

