

Key Points
Question
What were the trends in prevalence of diabetes and control of risk factors in diabetes among adults in the US from 1999-2000 to 2017-2018?
Findings
In this serial, cross-sectional study of nationally representative data from 28 143 participants in the National Health and Nutrition Examination Survey (NHANES), the estimated age-standardized prevalence of diabetes increased significantly, from 9.8% in 1999-2000 to 14.3% in 2017-2018. Only 21.2% of adults with diagnosed diabetes achieved all 3 risk factor control goals in 2015-2018, including individualized hemoglobin A1c targets, blood pressure less than 130/80 mm Hg, and low-density lipoprotein cholesterol level less than 100 mg/dL.
Meaning
Based on NHANES data from US adults, the estimated prevalence of diabetes increased significantly between 1999-2000 and 2017-2018, and only an estimated 21% of adults with diagnosed diabetes achieved all 3 risk factor control goals in 2015-2018.
Abstract
Importance
Understanding population-wide trends in prevalence and control of diabetes is critical to planning public health approaches for prevention and management of the disease.
Objective
To determine trends in prevalence of diabetes and control of risk factors in diabetes among US adults between 1999-2000 and 2017-2018.
Design, Setting, and Participants
Ten cycles of cross-sectional National Health and Nutrition Examination Survey (NHANES) data between 1999-2000 and 2017-2018 were included. The study samples were weighted to be representative of the noninstitutionalized civilian resident US population. Adults aged 18 years or older were included, except pregnant women.
Exposures
Survey cycle.
Main Outcomes and Measures
Diabetes was defined by self-report of diabetes diagnosis, fasting plasma glucose level of 126 mg/dL or more, or hemoglobin A1c (HbA1c) level of 6.5% or more. Three risk factor control goals were individualized HbA1c targets, blood pressure less than 130/80 mm Hg, and low-density lipoprotein cholesterol level less than 100 mg/dL. Prevalence of diabetes and proportion of adults with diagnosed diabetes who achieved risk factor control goals, overall and by sociodemographic variables, were estimated.
Results
Among the 28 143 participants included (weighted mean age, 48.2 years; 49.3% men), the estimated age-standardized prevalence of diabetes increased significantly from 9.8% (95% CI, 8.6%-11.1%) in 1999-2000 to 14.3% (95% CI, 12.9%-15.8%) in 2017-2018 (P for trend < .001). From 1999-2002 to 2015-2018, the estimated age-standardized proportion of adults with diagnosed diabetes who achieved blood pressure less than 130/80 mm Hg (P for trend = .007) and low-density lipoprotein cholesterol level less than 100 mg/dL (P for trend < .001) increased significantly, but not individualized HbA1c targets (P for trend = .51). In 2015-2018, 66.8% (95% CI, 63.2%-70.4%), 48.2% (95% CI, 44.6%-51.8%), and 59.7% (95% CI, 54.2%-65.2%) of adults with diagnosed diabetes achieved individualized HbA1c targets, blood pressure less than 130/80 mm Hg, and low-density lipoprotein cholesterol level less than 100 mg/dL, respectively. Only 21.2% of these adults (95% CI, 15.5%-26.8%) achieved all 3. During the entire study period, these 3 goals were significantly less likely to be achieved among young adults aged 18 to 44 years (vs older adults ≥65 years: estimated proportion, 7.4% vs 21.7%; adjusted odds ratio, 0.32 [95% CI, 0.16-0.63]), non-Hispanic Black adults (vs non-Hispanic White adults: estimated age-standardized proportion, 12.5% vs 20.6%; adjusted odds ratio, 0.60 [95% CI, 0.40-0.90]), and Mexican American adults (vs non-Hispanic White adults: estimated age-standardized proportion, 10.9% vs 20.6%; adjusted odds ratio, 0.48 [95% CI, 0.31-0.77]).
Conclusions and Relevance
Based on NHANES data from US adults, the estimated prevalence of diabetes increased significantly between 1999-2000 and 2017-2018. Only an estimated 21% of adults with diagnosed diabetes achieved all 3 risk factor control goals in 2015-2018.
This study uses NHANES data from US adults to determine trends in the prevalence of diabetes and control of risk factors between 1999-2000 and 2017-2018, including subgroups by age and race and ethnicity.
Introduction
Diabetes is a leading cause of disability and mortality.1,2 In the US, its total economic cost was $327 billion in 2017 and care for people with diabetes accounted for 24% of all health care dollars.3 The estimated prevalence of diabetes among US adults increased from 5.3% in 1976-1980 to 11.5% in 2011-2014, increasing at a rate faster than the global increase during the same period.2,4,5 The prevalence of diabetes varies substantially by sociodemographic variables and weight status.6,7,8 Also, it has been associated with increased risk of cardiovascular disease.9 Cardiovascular disease prevention in diabetes requires appropriate management of well-established risk factors such as hemoglobin A1c (HbA1c) level, blood pressure (BP), and serum cholesterol level.10,11 An improvement in the control of the 3 risk factors (HbA1c <7.0% or individualized HbA1c targets, BP <130/80 mm Hg, and low-density lipoprotein cholesterol [LDL-C] level <100 mg/dL) was observed between 1988 and 2010, but only an estimated 18.8% of US adults achieved all 3 goals in 2007-2010.12,13 It is unclear whether trends in control of risk factors in diabetes have changed during the past decade. This information is critical to forecasting population-level complications and guiding prevention efforts.
The primary objective of this study, which used recently released data from the National Health and Nutrition Examination Survey (NHANES), was to provide updated national estimates to evaluate trends in prevalence of diabetes and control of risk factors in diabetes among US adults between 1999-2000 and 2017-2018.
Methods
Data Collection
Beginning in 1999, NHANES has been a continuous, multistage, nationally representative survey of the noninstitutionalized civilian resident US population. Data collected through in-home interviews and study visits at mobile examination centers have been released in 2-year cycles. This study included 10 cycles between 1999-2000 and 2017-2018. The overall response rates ranged from 52% to 84% for the interview component and from 49% to 80% for the examination component. Participants aged 18 years or older were included. Pregnant women were excluded. The National Center for Health Statistics Research Ethics Review Board approved NHANES. Written informed consent was obtained from all adult participants. Shanghai Jiao Tong University School of Medicine Public Health and Nursing Research Ethics Review Committee approved this study.
Information on age, sex, race, ethnicity, statin use, and medical conditions was collected during household interview. Race and ethnicity were self-reported according to fixed-category questions and included because of the known racial and ethnic differences in prevalence of diabetes. Weight, height, waist circumference, and BP were measured in mobile examination centers with standard protocols. Body mass index was computed by dividing weight in kilograms by height in meters squared. The mean of all available BP measurements was used to calculate systolic and diastolic BP. HbA1c was measured and standardized to the Diabetes Control and Complications Trial method. A random subset of the participants was sampled to attend the morning session, during which fasting plasma glucose and LDL-C levels were measured among those who fasted for 8 to less than 24 hours. The Centers for Disease Control and Prevention’s Lipid Standardization Program was applied to ensure accuracy and precision of measurements between laboratories and over time. An oral glucose tolerance test using a 75-g glucose challenge was administered and 2-hour plasma glucose level was measured. Urine albumin and creatinine levels were measured with a fluorescent immunoassay and Jaffe rate reaction method, respectively. Serum creatinine level was measured with a Jaffe kinetic rate method. Glucose data between 2005-2006 and 2017-2018 were calibrated according to the recommended method by the National Center for Health Statistics to account for changes to the laboratory method, equipment, or site.14 Urine and serum creatinine levels were also calibrated. Calibrating HbA1c was not required. Estimated glomerular filtration rate was computed according to the Chronic Kidney Disease Epidemiology Collaboration equation.15
Definition of Diabetes
Diagnosed diabetes was defined as self-report of diabetes diagnosis by a physician or other health professional. Undiagnosed diabetes was defined as having a fasting plasma glucose level of 126 mg/dL or more or HbA1c level of 6.5% or more among individuals without diagnosed diabetes. Diabetes included both diagnosed and undiagnosed diabetes.
Risk Factors
Clinical risk factors commonly targeted to decrease cardiovascular disease risk in diabetes are HbA1c level, BP, and serum cholesterol level.10,11,12 Low-density lipoprotein cholesterol was selected as the cholesterol control target because statins are the first-line treatment for lipid lowering.11 Individualized HbA1c targets have been emphasized for glycemic control,10 and were specified as follows: less than 6.5% for young adults aged 18 to 44 years without complications, less than 7.0% for both young adults with complications and middle-aged adults aged 45 to 64 years without complications, less than 8.0% for both middle-aged adults and older adults aged 65 years or older with complications, and less than 7.5% for older adults without complications.10,16 Complications were defined as any of the following: having self-reported cardiovascular disease (congestive heart failure, coronary heart disease, heart attack, or stroke), retinopathy, urine albumin to creatinine ratio of 30 mg/g or higher, or estimated glomerular filtration rate less than 60 mL/min/1.73 m2.13 Guidelines recommend less than either 130/80 or 140/90 mm Hg for BP control in diabetes.11,17 Achieved systolic BP of 130 mm Hg or lower has been associated with a lower risk of cardiovascular disease.18 Lipid management in diabetes has shifted from controlling LDL-C level to less than 100 mg/dL to prescribing statins with different intensity according to age and presence of atherosclerotic cardiovascular disease and risk factors without a specific LDL-C target.11,19 However, intensity of statin treatment was not collected in NHANES. Therefore, LDL-C level less than 100 mg/dL was used as the primary target.
Outcomes
Risk factor control analysis was conducted among adults with diagnosed diabetes. Primary outcomes included prevalence of diabetes and proportion of adults with diagnosed diabetes who achieved 3 risk factor control goals individually and collectively: individualized HbA1c targets, BP less than 130/80 mm Hg, and LDL-C level less than 100 mg/dL. Secondary outcomes included prevalence of diagnosed and undiagnosed diabetes, percentage of diabetes that was undiagnosed, and proportion of adults with diagnosed diabetes who achieved HbA1c level less than 7% or less than 8%, BP less than 140/90 mm Hg, and LDL-C level less than 70 mg/dL and who took statins. Factors associated with achieving risk factor control goals were also assessed.
Statistical Analysis
The NHANES 2017-2018 cycle was used to estimate prevalence of diagnosed diabetes, undiagnosed diabetes and diabetes, and percentage of diabetes that was undiagnosed, overall and by age (18-44, 45-64, and ≥65 years), sex (men and women), race and ethnicity (non-Hispanic White, non-Hispanic Black, Hispanic overall, Mexican American as a separate Hispanic subgroup, non-Hispanic Asian, and other), education (less than high school, high school graduate, some college, and college graduate or more), body mass index level (18.5-24.9, 25-29.9, 30-34.9, 35-39.9, and ≥40), abdominal obesity (yes/no), and insurance status (uninsured and insured). Mexican American persons were oversampled before 2007 and all Hispanic persons were oversampled from 2007 onward in NHANES. The National Center for Health Statistics recommends not calculating estimates for all Hispanic persons for survey cycles before 2007 and for any Hispanic subgroup other than Mexican American in any survey cycle through 2018.14 Thus, for analyses including data before 2007, results for Mexican American adults instead of all Hispanic adults were reported; otherwise, results for all Hispanic adults and Mexican American adults were reported. Similarly, non-Hispanic Asian subgroup was not available before 2011 due to the survey design. Abdominal obesity was defined as having waist circumference greater than 102 or 88 cm in men or women, respectively. Participants with body mass index less than 18.5 were included in the analyses in the total sample and stratified by other variables. Estimates were age standardized to the 2017-2018 NHANES nonpregnant adult population, using the age groups 18 to 44 years, 45 to 64 years, and 65 years or older.
Joinpoint regressions with heteroscedastic and uncorrelated error were used to determine trends in log-transformed age-standardized prevalence, allowing 1 joinpoint.20 The joinpoint location, if it existed, was identified with a grid search. The best-fitting model was selected by conducting 4499 permutation tests based on a Monte Carlo method, adjusting for multiple tests. Parameters were estimated with weighted least squares, with weights proportional to the inverse of the variance of prevalence at each cycle. Under a log-linear model, prevalence changed at a constant relative percentage per cycle, facilitating comparisons across strata with varying prevalence. Relative percentage change per 2-year cycle in prevalence and its 95% CI were obtained.
Two adjacent NHANES cycles were combined to estimate prevalence of achieving risk factor control goals. Estimates were age standardized to all adults with diagnosed diabetes in 1999-2018. Distribution of HbA1c levels, BP, LDL-C levels, and statin use was displayed and differences over time were assessed with Rao-Scott χ2 tests. Stratified analyses according to previously described subgroups and presence of complications (yes/no) were conducted for each goal. Changes over time were determined by comparing each of the estimates from earlier years with the estimate from 2015-2018, using t tests. An overall trend during the entire period was assessed with F tests. Proportion of adults achieving all 3 risk factor control goals by subgroup was assessed among the total study sample of diagnosed diabetes combined from all years to increase robustness of results. Factors associated with achieving risk factor control goals were identified with logistic models, with all of the aforementioned categorical variables included as covariates. Odds ratios (ORs) and 95% CIs were obtained. Key assumptions for logistic models included binary outcome structure, independence of errors, absence of high multicollinearity, linearity between covariates and log odds, lack of influential outliers, and having at least 10 events per covariate.
A sensitivity analysis was conducted by additionally including undiagnosed diabetes cases based on a 2-hour plasma glucose level of 200 mg/dL or more, available between 2005 and 2016 at this analysis.
Weights for the interview sample, examination sample, fasting subsample, and oral glucose tolerance test subsample were used appropriately to ensure the estimates were representative of the total civilian noninstitutionalized US population. Weights were adjusted for nonresponse, noncoverage, and unequal probabilities of selection. Weights and design variables were included to obtain unbiased estimates and SEs. Complete case analysis was applied if missing data level for primary analyses was 10% or less. Data were analyzed with SAS version 9.4 and Joinpoint Regression Program version 4.8.0.1.20 A 2-sided P < .05 was used to determine statistical significance. Because of the potential for type I error due to multiple comparisons, findings for secondary analyses and secondary outcomes should be interpreted as exploratory.
Results
Among the 28 143 participants included, the weighted mean age was 48.2 years (SE, 0.2), and 49.3% were men, 68.0% non-Hispanic White, 11.3% non-Hispanic Black, and 8.0% Mexican American; all were weighted proportions. For analyzing trends in prevalence of diabetes, included were 28 143 participants from the interview sample and 27 837 from the examination sample; 27 508 had data for HbA1c level, 23 622 for fasting plasma glucose level, and 11 526 for 2-hour plasma glucose level. Missing data were found for education (n = 1), insurance (n = 127 [0.5%]), body mass index (n = 537 [1.9%]), and waist circumference (n = 1276 [4.6%]). For risk factor control analysis, 6678, 6372, and 2632 participants with diagnosed diabetes were included from the interview sample, examination sample, and fasting subsample, respectively; missing data were found for insurance (n = 27 [0.4%]), HbA1c (n = 320 [5.0%]), BP (n = 295 [4.6%]), urine albumin to creatinine ratio and estimated glomerular filtration rate (n = 99 [1.6%]), body mass index (n = 228 [3.6%]), waist circumference (n = 574 [9.0%]), and LDL-C (n = 181 [6.9%]). The estimated proportion of uninsured adults increased significantly from 17.3% in 1999-2000 to 19.4% in 2011-2012 (P for trend = .02) and decreased significantly to 13.9% in 2017-2018 (P for trend = .04).
Prevalence of Diabetes
The estimated unadjusted prevalence was 11.2% for diagnosed diabetes (95% CI, 9.8%-12.5%), 3.4% for undiagnosed diabetes (95% CI, 2.5%-4.3%), and 14.6% for diabetes (95% CI, 12.8%-16.3%) (Table 1). Overall, 23.3% of adults with diabetes (95% CI, 18.6%-28.1%) were undiagnosed. The estimated age-standardized prevalence of diagnosed diabetes, undiagnosed diabetes, and diabetes was significantly higher in older than younger adults, adults identifying as a member of a racial or ethnic minority group than non-Hispanic White adults, people with lower than higher education level (except for undiagnosed diabetes), and people with greater than lower body mass index and waist circumference range. No significant difference by sex and insurance status was identified. The estimated percentage of diabetes that was undiagnosed was significantly higher in younger than older adults. Among young adults, 40.0% (95% CI, 28.4%-51.5%) of participants with diabetes were undiagnosed.
Table 1. Prevalence of Diagnosed Diabetes, Undiagnosed Diabetes, and Diabetes Among US Adults, 2017-2018.
| Characteristics | Total No.a | Diagnosed diabetesb | Undiagnosed diabetesc | Diabetesd | ||||
|---|---|---|---|---|---|---|---|---|
| No.a | Prevalence, % (95% CI)e | No.a | Prevalence, % (95% CI)e | % of diabetes (95% CI)f | No.a | Prevalence, % (95% CI)e | ||
| Overall prevalence | 2965 | 878 | 11.2 (9.8-12.5) | 225 | 3.4 (2.5-4.3) | 23.3 (18.6-28.1) | 1103 | 14.6 (12.8-16.3) |
| Age group, y | ||||||||
| 18-44 | 975 | 69 | 2.8 (2.1-3.4) | 40 | 1.8 (1.0-2.6) | 40.0 (28.4-51.5) | 109 | 4.6 (3.5-5.7) |
| 45-64 | 1102 | 356 | 13.7 (10.5-16.9) | 115 | 4.8 (2.5-7.0) | 25.8 (15.9-35.6) | 471 | 18.5 (14.5-22.5) |
| ≥65 | 888 | 453 | 25.1 (21.4-28.9) | 70 | 4.4 (2.6-6.2) | 14.9 (9.1-20.7) | 523 | 29.5 (25.7-33.4) |
| Sex | ||||||||
| Men | 1445 | 477 | 12.5 (10.6-14.5) | 100 | 3.3 (1.7-4.8) | 21.2 (12.8-29.6) | 577 | 15.8 (13.4-18.2) |
| Women | 1520 | 401 | 9.7 (7.7-11.7) | 125 | 3.5 (2.2-4.8) | 25.2 (19.5-30.8) | 526 | 13.2 (10.3-16.1) |
| Race and ethnicityg | ||||||||
| Non-Hispanic White | 997 | 308 | 10.0 (8.4-11.7) | 43 | 2.5 (1.3-3.7) | 19.7 (12.0-27.5) | 351 | 12.5 (10.4-14.6) |
| Non-Hispanic Black | 688 | 202 | 12.5 (9.7-15.3) | 68 | 5.8 (3.9-7.6) | 31.4 (22.2-40.5) | 270 | 18.3 (15.8-20.8) |
| Hispanic | 697 | 204 | 13.1 (11.2-15.0) | 62 | 5.3 (3.4-7.1) | 29.3 (21.3-37.4) | 266 | 18.3 (15.6-21.0) |
| Mexican American | 423 | 129 | 15.4 (12.2-18.6) | 37 | 6.2 (4.1-8.3) | 29.6 (19.7-39.4) | 166 | 21.6 (19.3-23.9) |
| Non-Hispanic Asian | 418 | 115 | 13.7 (11.6-15.8) | 41 | 5.3 (3.3-7.4) | 29.8 (22.4-37.2) | 156 | 19.0 (16.0-22.1) |
| Other | 165 | 49 | 16.5 (9.2-23.9) | 11 | 2.6 (0.5-4.8) | 14.7 (6.4-23.0) | 60 | 19.2 (10.3-28.1) |
| Education levelh | ||||||||
| <High school | 650 | 242 | 15.1 (12.0-18.1) | 59 | 4.5 (3.1-6.0) | 21.8 (14.4-29.2) | 301 | 19.6 (16.7-22.5) |
| High school graduate | 732 | 203 | 11.4 (8.3-14.5) | 52 | 3.5 (2.5-4.5) | 23.5 (15.9-31.2) | 255 | 14.9 (11.7-18.1) |
| Some college | 925 | 267 | 11.6 (9.1-14.1) | 58 | 2.9 (1.8-4.0) | 20.1 (13.3-26.8) | 325 | 14.5 (12.1-16.9) |
| College graduate or above | 653 | 164 | 8.4 (6.1-10.7) | 55 | 3.2 (1.6-4.8) | 28.3 (17.6-39.0) | 219 | 11.6 (8.8-14.5) |
| Weight group (BMI range)i | ||||||||
| Normal weight (18.5-24.9) | 676 | 106 | 4.4 (2.7-6.2) | 26 | 1.1 (0.4-1.9) | 20.1 (7.4-32.8) | 132 | 5.6 (3.7-7.4) |
| Overweight (25.0-29.9) | 904 | 254 | 8.6 (6.9-10.4) | 52 | 2.3 (0.7-3.9) | 22.2 (10.0-34.4) | 306 | 10.9 (8.7-13.2) |
| Class 1 obesity (30.0-34.9) | 630 | 205 | 12.9 (10.5-15.3) | 60 | 3.4 (2.3-4.5) | 20.8 (14.6-27.0) | 265 | 16.2 (13.7-18.7) |
| Class 2 obesity (35.0-39.9) | 337 | 133 | 18.0 (13.5-22.6) | 43 | 7.6 (3.7-11.5) | 29.3 (18.9-39.8) | 176 | 25.6 (18.6-32.6) |
| Class 3 obesity (≥40.0) | 288 | 118 | 28.2 (18.1-38.2) | 38 | 8.9 (4.5-13.3) | 20.7 (11.3-30.1) | 156 | 37.0 (25.8-48.2) |
| Abdominal obesity (waist circumference range, cm)j | ||||||||
| No (≤102 in men, ≤88 in women) | 1058 | 170 | 5.6 (3.9-7.3) | 43 | 1.7 (0.6-2.8) | 24.0 (14.5-33.4) | 213 | 7.3 (5.0-9.6) |
| Yes (>102 in men, >88 in women) | 1698 | 596 | 13.8 (11.8-15.7) | 168 | 4.5 (3.2-5.8) | 23.3 (18.2-28.4) | 764 | 18.3 (15.7-20.9) |
| Insurance statusk | ||||||||
| Uninsured | 426 | 78 | 10.6 (4.4-16.8) | 36 | 5.7 (2.9-8.4) | 34.9 (19.6-50.1) | 114 | 16.3 (10.1-22.5) |
| Insured | 2534 | 800 | 11.2 (9.8-12.6) | 186 | 3.2 (2.2-4.2) | 22.2 (16.3-28.0) | 986 | 14.4 (12.7-16.1) |
Abbreviation: BMI, body mass index, calculated as weight in kilograms divided by height in meters squared.
Unweighted sample size and number of cases. The total number of participants was 2965 from the interview sample and 2925 from the examination sample (for analyses related to BMI and waist circumference only).
Self-report of diabetes diagnosis by a physician or other health professional.
Hemoglobin A1c level of 6.5% or higher or fasting plasma glucose level of 126 mg/dL or higher among individuals without self-reported diabetes.
Included both diagnosed and undiagnosed diabetes.
Estimates for overall total and by age groups were unadjusted. Other estimates were age standardized to the 2017-2018 National Health and Nutrition Examination Survey nonpregnant adult population, using the age groups 18 to 44 years, 45 to 64 years, and 65 years or older.
Estimates were age standardized to all diabetes cases other than during pregnancy in the 2017-2018 National Health and Nutrition Examination Survey adult population using the age groups 18 to 44 years, 45 to 64 years, and 65 years or greater.
Race and ethnicity was determined by self-report in fixed categories. The “other” group included other non-Hispanic races or multiple races.
Five participants refused to report or did not know their education level.
Thirty-two participants with BMI less than 18.5 (ie, underweight) were not included for this variable, but were included for other variables. Only 1 participant with BMI less than 18.5 had diabetes. BMI was missing for 58 participants (2.0%) among 2925 included from the examination sample.
Waist circumference was missing for 169 participants (5.8%) among 2925 included from the examination sample.
Insurance information was missing for 5 participants.
Trends in Prevalence of Diabetes
The estimated age-standardized prevalence of diabetes increased significantly from 9.8% (95% CI, 8.6%-11.1%) in 1999-2000 to 14.3% (95% CI, 12.9%-15.8%) in 2017-2018, with a 3.3% relative increase (95% CI, 2.2%-4.5%) per 2-year cycle (Table 2; Figure, A). A significant increase in the estimated age-standardized prevalence of diabetes was observed in young and middle-aged adults, men, women, non-Hispanic White adults, Mexican American adults, adults with overweight or abdominal obesity, and insured adults, as well as among all education levels (all P for trend < .05). The estimated age-standardized prevalence of diagnosed diabetes increased significantly from 6.8% (95% CI, 5.7%-7.9%) in 1999-2000 to 11.0% (95% CI, 9.8%-12.1%) in 2017-2018, with a 5.2% relative increase (95% CI, 4.3%-6.0%) per cycle (eTable 1 in the Supplement). The estimated age-standardized prevalence of undiagnosed diabetes was not significantly different across cycles (P for trend = .32) (eTable 2 in the Supplement). The estimated age-standardized percentage of diabetes that was undiagnosed decreased significantly from 31.0% (95% CI, 26.1%-36.0%) in 1999-2000 to 23.3% (95% CI, 18.9%-27.8%) in 2017-2018, with a –4.6% relative decrease (95% CI, –6.8% to –2.3%) per cycle (eTable 3 in the Supplement; Figure, B), but this significant decrease was not observed in several subgroups, including young adults and minority adults (all P for trend >.05). Detailed subgroup results are shown in eTables 1 to 3 in the Supplement.
Table 2. Trends in Prevalence of Diabetes Among US Adults, 1999-2018.
| Adults with diabetes, % (95% CI)a | ||||||||||||
|---|---|---|---|---|---|---|---|---|---|---|---|---|
| 1999-2000 (n = 2375) | 2001-2002 (n = 2712) | 2003-2004 (n = 2539) | 2005-2006 (n = 2415) | 2007-2008 (n = 3018) | 2009-2010 (n = 3261) | 2011-2012 (n = 2900) | 2013-2014 (n = 3035) | 2015-2016 (n = 2923) | 2017-2018 (n = 2965) | Relative % change per 2-y cycleb | P for trendb | |
| No. with diabetesc | 608 | 675 | 680 | 638 | 995 | 959 | 913 | 900 | 1022 | 1103 | ||
| Overall prevalence | 9.8 (8.6 to 11.1) | 11.0 (9.7 to 12.2) | 11.8 (10.5 to 13.2) | 10.9 (9.6 to 12.3) | 12.8 (11.1 to 14.4) | 12.3 (10.4 to 14.1) | 12.5 (10.9 to 14.0) | 12.7 (12.0 to 13.5) | 13.8 (12.2 to 15.5) | 14.3 (12.9 to 15.8) | 3.3 (2.2 to 4.5) | <.001 |
| Age group, y | ||||||||||||
| 18-44 | 2.7 (1.3 to 4.1) | 3.6 (2.5 to 4.7) | 3.3 (2.3 to 4.3) | 3.9 (2.9 to 4.8) | 3.5 (2.6 to 4.4) | 3.1 (2.5 to 3.8) | 4.3 (3.3 to 5.3) | 3.6 (3.1 to 4.2) | 5.0 (3.8 to 6.2) | 4.6 (3.6 to 5.6) | 4.0 (0.2 to 8.0) | .04 |
| 45-64 | 13.1 (10.8 to 15.4) | 12.6 (9.9 to 15.3) | 14.6 (12.3 to 16.8) | 12.9 (10.1 to 15.7) | 15.5 (12.0 to 19.0) | 15.8 (12.0 to 19.6) | 16.2 (13.4 to 19.1) | 17.2 (14.7 to 19.6) | 17.7 (15.2 to 20.2) | 18.5 (14.8 to 22.2) | 4.2 (3.0 to 5.4) | <.001 |
| ≥65 | 20.6 (16.7 to 24.5) | 25.1 (22.3 to 27.8) | 26.7 (21.6 to 31.8) | 23.7 (19.6 to 27.8) | 29.3 (26.2 to 32.4) | 27.0 (23.4 to 30.5) | 24.7 (21.7 to 27.8) | 25.9 (22.2 to 29.6) | 27.3 (23.2 to 31.4) | 29.5 (25.9 to 33.1) | 1.9 (–0.4 to 4.1) | .09 |
| Sex | ||||||||||||
| Men | 10.6 (9.0 to 12.2) | 12.5 (10.7 to 14.2) | 13.0 (11.4 to 14.6) | 11.2 (9.3 to 13.1) | 14.0 (12.2 to 15.8) | 14.5 (11.6 to 17.5) | 13.6 (12.2 to 15.0) | 14.0 (12.6 to 15.3) | 16.1 (13.4 to 18.9) | 15.8 (13.6 to 18.0) | 3.4 (1.6 to 5.3) | .002 |
| Women | 9.2 (7.8 to 10.6) | 9.6 (8.2 to 11.0) | 10.8 (9.4 to 12.1) | 10.6 (8.8 to 12.4) | 11.8 (9.9 to 13.6) | 10.2 (9.1 to 11.3) | 11.6 (9.6 to 13.5) | 11.7 (10.6 to 12.7) | 11.8 (10.3 to 13.3) | 13.2 (10.5 to 15.9) | 2.9 (1.4 to 4.4) | .002 |
| Race and ethnicityd | ||||||||||||
| Non-Hispanic White | 8.4 (7.1 to 9.6) | 9.2 (8.0 to 10.3) | 10.4 (8.8 to 12.0) | 9.0 (7.5 to 10.5) | 10.9 (8.7 to 13.1) | 10.1 (8.0 to 12.2) | 9.6 (8.1 to 11.1) | 10.9 (9.8 to 12.0) | 11.5 (10.2 to 12.9) | 12.5 (10.6 to 14.5) | 3.4 (1.8 to 5.0) | .001 |
| Non-Hispanic Black | 17.5 (13.7 to 21.4) | 17.1 (14.0 to 20.1) | 15.9 (13.5 to 18.3) | 18.8 (15.8 to 21.8) | 22.9 (19.5 to 26.2) | 19.1 (17.0 to 21.2) | 20.7 (17.1 to 24.2) | 18.1 (16.2 to 20.0) | 18.9 (16.6 to 21.2) | 18.3 (16.0 to 20.6) | 0.7 (–1.9 to 3.4) | .57 |
| Mexican American | 13.4 (11.4 to 15.4) | 16.4 (14.0 to 18.7) | 16.7 (14.0 to 19.3) | 18.6 (16.0 to 21.2) | 18.4 (16.3 to 20.5) | 21.2 (17.7 to 24.6) | 20.5 (15.8 to 25.1) | 18.5 (15.7 to 21.4) | 24.4 (21.1 to 27.7) | 21.6 (19.5 to 23.7) | 4.6 (2.5 to 6.8) | <.001 |
| Other | 13.5 (8.6 to 18.4) | 16.0 (10.4 to 21.5) | 16.7 (11.7 to 21.8) | 13.4 (8.3 to 18.6) | 15.2 (10.6 to 19.8) | 16.9 (13.2 to 20.6) | 18.3 (14.8 to 21.8) | 16.7 (13.9 to 19.4) | 16.5 (12.8 to 20.2) | 17.4 (14.6 to 20.2) | 1.8 (–0.2 to 3.7) | .07 |
| Education levele | ||||||||||||
| <High school | 15.2 (12.3 to 18.0) | 16.0 (14.2 to 17.9) | 16.7 (15.2 to 18.2) | 16.3 (13.0 to 19.6) | 17.9 (15.3 to 20.5) | 16.9 (14.8 to 19.1) | 18.5 (14.8 to 22.2) | 16.0 (14.3 to 17.7) | 20.2 (17.3 to 23.2) | 19.6 (16.9 to 22.3) | 1.9 (0.1 to 3.7) | .04 |
| High school graduate | 10.5 (8.7 to 12.4) | 10.6 (8.4 to 12.8) | 10.7 (8.9 to 12.5) | 12.2 (9.6 to 14.9) | 14.0 (10.8 to 17.3) | 11.9 (8.4 to 15.5) | 14.7 (11.9 to 17.5) | 14.6 (12.7 to 16.5) | 13.9 (11.3 to 16.5) | 14.9 (12.0 to 17.9) | 4.5 (2.9 to 6.2) | <.001 |
| Some college | 7.8 (5.6 to 9.9) | 9.9 (7.8 to 12.0) | 11.7 (9.7 to 13.8) | 9.9 (7.8 to 12.0) | 13.4 (10.3 to 16.5) | 12.6 (10.6 to 14.7) | 10.9 (8.5 to 13.3) | 14.8 (12.6 to 16.9) | 14.5 (11.7 to 17.2) | 14.5 (12.3 to 16.7) | 5.5 (2.6 to 8.5) | .002 |
| College graduate or above | 4.1 (2.3 to 5.9) | 7.4 (4.8 to 9.9) | 9.2 (6.8 to 11.6) | 7.5 (5.6 to 9.5) | 6.5 (4.9 to 8.1) | 8.9 (5.1 to 12.7) | 8.8 (6.2 to 11.3) | 7.5 (5.7 to 9.3) | 10.4 (8.1 to 12.7) | 11.6 (9.0 to 14.3) | 6.0 (0.8 to 11.4) | .03 |
| Weight group (BMI range)f | ||||||||||||
| Normal weight (18.5-24.9) | 4.8 (3.2 to 6.4) | 5.2 (3.5 to 6.8) | 6.4 (3.8 to 9.1) | 5.1 (3.8 to 6.3) | 5.7 (3.9 to 7.4) | 5.5 (3.3 to 7.7) | 5.9 (4.3 to 7.5) | 5.4 (4.0 to 6.8) | 6.4 (4.5 to 8.4) | 5.6 (3.9 to 7.3) | 1.7 (–0.4 to 3.9) | .10 |
| Overweightg (25.0-29.9) | 9.3 (7.0 to 11.7) | 9.2 (7.4 to 11.0) | 9.5 (7.2 to 11.7) | 9.1 (7.1 to 11.1) | 9.0 (7.6 to 10.5) | 9.3 (7.0 to 11.6) | 9.1 (7.5 to 10.8) | 10.0 (8.3 to 11.7) | 10.0 (8.0 to 11.9) | 10.9 (8.9 to 13.0) | 1.8 (0.4 to 3.1) | .01 |
| Class 1 obesity (30.0-34.9) | 13.5 (10.6 to 16.3) | 15.6 (12.4 to 18.8) | 15.3 (12.7 to 17.9) | 13.5 (11.2 to 15.7) | 18.1 (14.8 to 21.3) | 15.9 (13.0 to 18.8) | 15.3 (12.2 to 18.5) | 17.4 (13.8 to 20.9) | 20.1 (17.2 to 23.1) | 16.2 (13.9 to 18.6) | 2.7 (0.0 to 5.5) | .052 |
| Class 2 obesity (35.0-39.9) | 17.3 (12.7 to 21.8) | 16.9 (12.0 to 21.8) | 24.8 (18.8 to 30.7) | 21.6 (13.7 to 29.5) | 25.9 (20.1 to 31.7) | 23.9 (19.1 to 28.8) | 21.3 (16.3 to 26.4) | 25.1 (19.6 to 30.6) | 20.2 (15.1 to 25.3) | 25.6 (19.1 to 32.1) | 2.6 (–1.1 to 6.5) | .14 |
| Class 3 obesity (≥40.0) | 29.3 (22.4 to 36.2) | 33.0 (24.4 to 41.6) | 24.7 (17.4 to 32.1) | 25.1 (18.5 to 31.8) | 37.9 (29.9 to 46.0) | 26.6 (21.8 to 31.3) | 38.3 (31.9 to 44.7) | 27.8 (19.7 to 36.0) | 25.0 (18.3 to 31.8) | 37.0 (26.7 to 47.4) | 1.3 (–4.1 to 6.9) | .60 |
| Abdominal obesity (waist circumference range, cm)h | ||||||||||||
| No (≤102 in men, ≤88 in women) | 4.7 (3.4 to 5.9) | 6.1 (5.0 to 7.2) | 6.7 (4.9 to 8.5) | 4.6 (4.0 to 5.2) | 5.8 (4.4 to 7.3) | 6.5 (4.0 to 9.0) | 6.3 (4.6 to 8.0) | 5.5 (4.6 to 6.5) | 8.1 (5.9 to 10.3) | 7.3 (5.1 to 9.4) | 3.2 (–1.5 to 8.2) | .16 |
| Yes (>102 in men, >88 in women) | 14.5 (12.5 to 16.6) | 14.8 (13.1 to 16.6) | 14.8 (12.5 to 17.1) | 15.3 (12.6 to 17.9) | 17.1 (15.5 to 18.8) | 15.3 (13.4 to 17.1) | 16.2 (14.2 to 18.2) | 17.1 (16.0 to 18.1) | 16.5 (14.5 to 18.4) | 18.3 (15.9 to 20.7) | 2.1 (0.9 to 3.4) | .004 |
| Insurance statusi | ||||||||||||
| Uninsured | 20.0 (15.1 to 24.8) | 12.2 (6.8 to 17.7) | 8.1 (5.6 to 10.6) | 8.0 (5.0 to 11.0) | 14.2 (10.3 to 18.0) | 11.0 (7.2 to 14.8) | 16.8 (13.6 to 20.1) | 11.8 (5.0 to 18.5) | 15.6 (11.4 to 19.7) | 16.3 (10.5 to 22.1) | –0.4 (–16.0 to 18.2) | .96 |
| Insured | 9.4 (8.1 to 10.8) | 10.7 (9.5 to 11.9) | 11.7 (10.2 to 13.1) | 11.1 (9.5 to 12.7) | 12.5 (10.8 to 14.3) | 12.2 (10.2 to 14.2) | 11.9 (10.3 to 13.5) | 13.0 (12.0 to 14.0) | 14.0 (12.2 to 15.8) | 14.4 (12.9 to 16.0) | 3.8 (2.7 to 5.0) | <.001 |
Abbreviation: BMI, body mass index, calculated as weight in kilograms divided by height in meters squared.
The definition for diabetes was consistent across all years, including both diagnosed diabetes, defined as having self-report of diabetes diagnosis by a physician or other health professional, and undiagnosed diabetes, defined as having a hemoglobin A1c level of 6.5% or higher or fasting plasma glucose level of 126 mg/dL or higher among individuals without self-reported diabetes. All estimates were age standardized to the 2017-2018 National Health and Nutrition Examination Survey nonpregnant adult population, using the age groups 18 to 44 years, 45 to 64 years, and 65 years or older.
Relative percentage change and P value were obtained from the Joinpoint Regression Program. A joinpoint regression model with heteroscedastic and uncorrelated error was fitted, allowing 1 joinpoint. The joinpoint location, if it existed, was identified with a grid search. The best-fitting model was selected by conducting 4499 permutation tests based on a Monte Carlo method, adjusting for multiple tests. Parameters were estimated with weighted least squares, with weights proportional to the inverse of the variance of the prevalence rate at each cycle.
Unweighted number of adults with diabetes. The total number of participants was 28 143 from the interview sample and 27 837 from the examination sample (for analyses related to BMI and waist circumference only).
Race and ethnicity was determined by self-report in fixed categories. The Non-Hispanic Asian category was not available before 2011 due to the survey design and thus estimates could not be presented separately. All other racial and ethnic groups were grouped as “other.”
Forty-two participants (0.1%) refused to report or did not know their education level. Education information was missing for 1 participant.
Estimates for individuals with BMI less than 18.5 (ie, underweight) were not presented owing to small sample size; there were only 29 diabetes cases in total among participants with underweight. BMI was missing for 537 participants (1.9%) among 27 837 included from the examination sample.
For the overweight subgroup, the trend changed in 2011-2012. The presented estimate in the table was the average relative percentage change during the entire study period. The relative percentage change per 2-year cycle between 1999-2000 and 2011-2012 was –0.2% (95% CI, –1.8% to 1.5%; P for trend = .76); between 2011-2012 and 2017-2018, 5.8% (95% CI, 1.6%-10.1%; P for trend = .02).
Waist circumference was missing for 1276 participants (4.6%) among 27 837 included from the examination population.
Of the 28 143 participants included from the interview sample, 127 (0.5%) had missing insurance data. For the uninsured subgroup, the trend changed in 2003-2004. The presented estimate in the table was the average relative percentage change during the entire study period. The relative percentage change per 2-year cycle between 1999-2000 and 2003-2004 was –31.4% (95% CI, –72.8% to 73.4%; P for trend = .34); between 2003-2004 and 2017-2018, 10.8% (95% CI, –1.1% to 24.1%; P for trend = .07).
Figure. Trends in Prevalence of Diabetes Among US Adults.
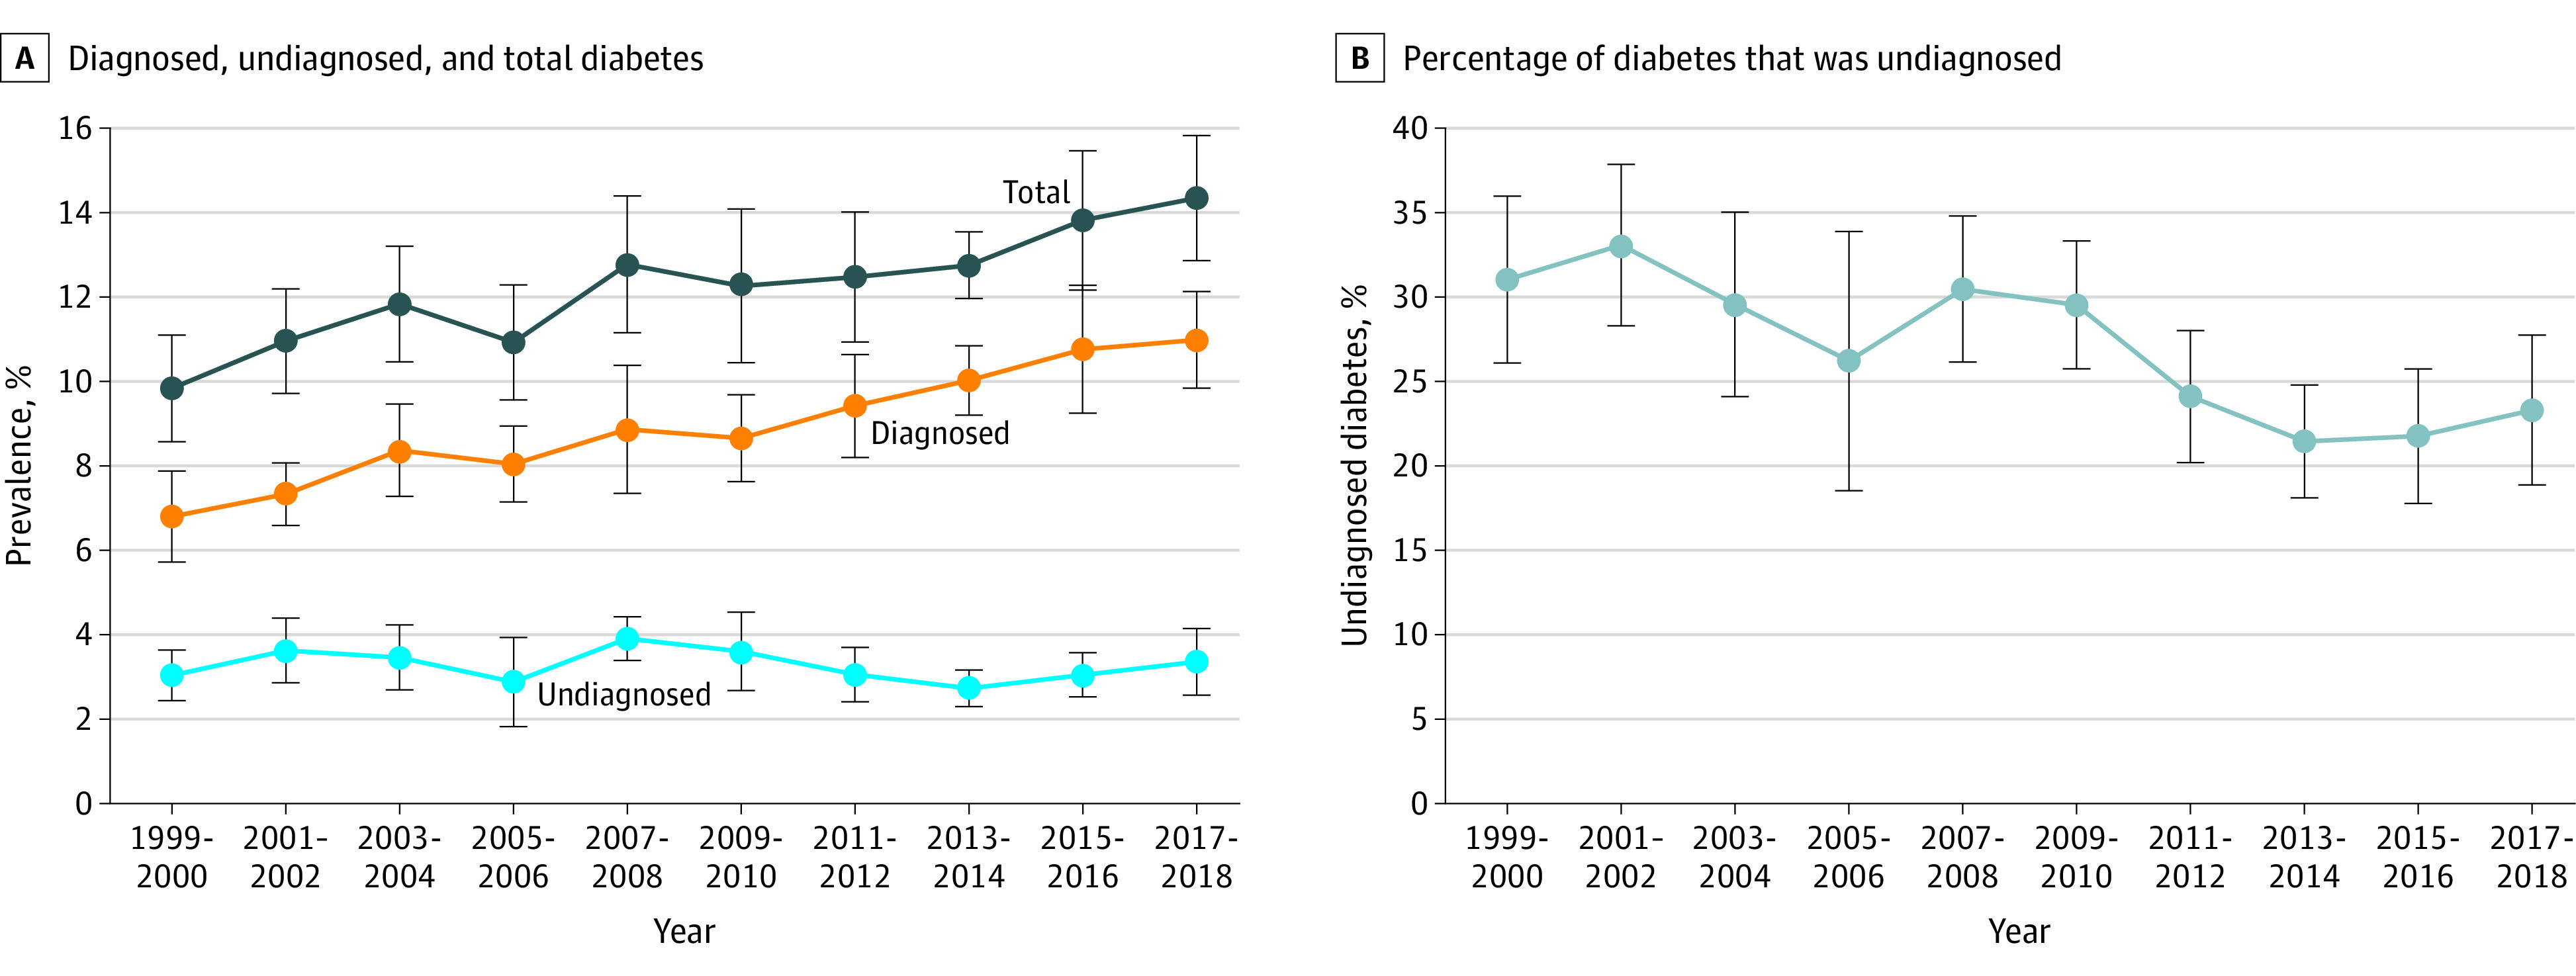
Trends in prevalence of diagnosed diabetes, undiagnosed diabetes, and total diabetes (A), and percentage of diabetes that was undiagnosed (B). Diagnosed diabetes was defined according to self-report of diabetes diagnosis by a physician or other health professional. Undiagnosed diabetes was defined as having a hemoglobin A1c level of 6.5% or higher or fasting plasma glucose level of 126 mg/dL or higher among individuals without diagnosed diabetes. All estimates were age standardized to the 2017-2018 National Health and Nutrition Examination Survey (NHANES) nonpregnant adult population, using the age groups 18 to 44 years, 45 to 64 years, and 65 years or older, except for the analysis related to the percentage of diabetes that was undiagnosed. Estimates were age standardized to all diabetes cases in 2017-2018 other than during pregnancy in the NHANES, using the age groups 18 to 44 years, 45 to 64 years, and 65 years or older. A, Interview sample (28 143 participants). B, Individuals with diabetes (8493 participants). Error bars indicate 95% CIs. P for trend was obtained from joinpoint regressions: P <.001 for total and diagnosed and P = .32 for undiagnosed diabetes in panel A; P = .002 for panel B. Specific estimates are shown in Table 2 and eTables 1 to 3 in the Supplement.
Risk Factor Control
Among adults with diagnosed diabetes, the estimated age-standardized distribution of HbA1c, BP, and LDL-C levels improved significantly, with major improvement occurring between 1999-2002 and 2003-2006 (all P < .05) (eFigure, A-C in the Supplement). The estimated age-standardized prevalence of statin use increased significantly (P < .001) (eFigure, D in the Supplement). The estimated age-standardized proportion of adults with diagnosed diabetes who achieved individualized HbA1c targets did not increase significantly overall and among all subgroups (all P for trend > .05) except young adults without complications (P for trend = .03) (Table 3). The estimated age-standardized proportion of adults with diagnosed diabetes who achieved BP less than 130/80 mm Hg and LDL-C level less than 100 mg/dL increased significantly (both P for trend < .05). There was a significantly higher proportion of adults with diagnosed diabetes who achieved individualized HbA1c targets in 2015-2018 than 1999-2002 (66.8% vs 58.9% [95% CI, 63.2%-70.4% vs 54.4%-63.3%]), but no significant difference was found for estimates between 2003 and 2018 (all P > .05). There was a significantly higher proportion of individuals achieving BP less than 130/80 mm Hg in 2015-2018 than 1999-2002 (48.2% vs 38.5% [95% CI, 44.6%-51.8% vs 33.6%-43.5%]), but no significant difference was found for estimates between 2003 and 2018 (all P > .05). There was a significantly higher proportion of individuals achieving LDL-C level less than 100 mg/dL in 2015-2018 than 1999-2002 and 2003-2006 (59.7% vs 35.4% and 46.9% [95% CI, 54.2%-65.2% vs 27.2%-43.6% and 40.8%-52.9%], respectively), but no significant difference was found for estimates between 2007 and 2018 (all P > .05). There was a significantly higher proportion of individuals achieving all 3 goals in 2015-2018 than 1999-2002 (21.2% vs 9.0% [95% CI, 15.5%-26.8% vs 5.0%-13.1%]), but no significant difference was found for estimates between 2003 and 2018 (all P > .05). Subgroup estimates for primary and secondary goals are shown in eTables 4 to 10 in the Supplement.
Table 3. Trends in Prevalence of Achieving Risk Factor Control Goals Among US Adults With Diagnosed Diabetes.
| Risk factors and population | Adults with diagnosed diabetes, % (95% CI)a,b | |||||||
|---|---|---|---|---|---|---|---|---|
| No.c | Target | 1999-2002 | 2003-2006 | 2007-2010 | 2011-2014 | 2015-2018 | P for trendd | |
| HbA1c targets achieved | ||||||||
| All adults ≥18 y | 6052 | Individualized HbA1c targets shown below | 58.9 (54.4-63.3)e | 71.0 (67.6-74.5) | 66.7 (62.6-70.8) | 62.0 (58.3-65.6) | 66.8 (63.2-70.4) | .51 |
| 18-44 y | ||||||||
| Without complicationsf | 362 | HbA1c <6.5% | 39.9 (21.3-58.5) | 35.9 (23.3-48.6)e | 55.0 (40.6-69.4) | 39.9 (28.1-51.8)e | 59.3 (49.7-68.9) | .03 |
| With complicationsf | 299 | HbA1c <7.0% | 34.6 (16.6-52.6) | 50.3 (32.9-67.8) | 25.0 (10.1-40.0) | 41.3 (25.3-57.3) | 44.2 (28.5-59.9) | .66 |
| 45-64 y | ||||||||
| Without complicationsf | 1177 | HbA1c <7.0% | 49.1 (39.5-58.7) | 60.1 (49.8-70.4) | 54.3 (45.2-63.4) | 56.7 (50.3-63.1) | 50.4 (42.2-58.6) | .76 |
| With complicationsf | 1396 | HbA1c <8.0% | 57.8 (48.1-67.5) | 67.6 (58.9-76.2) | 70.5 (64.7-76.3) | 52.4 (44.3-60.6)e | 68.9 (59.9-77.9) | .63 |
| ≥65 y | ||||||||
| Without complicationsf | 732 | HbA1c <7.5% | 65.2 (51.0-79.3) | 88.4 (81.9-94.9)e | 74.6 (67.2-82.0) | 73.1 (62.6-83.6) | 76.2 (68.1-84.3) | .97 |
| With complicationsf | 2086 | HbA1c <8.0% | 74.3 (66.5-82.1) | 88.6 (84.8-92.3)e | 83.7 (79.0-88.3) | 79.3 (73.3-85.2) | 80.1 (75.7-84.5) | .81 |
| BP targets achieved | ||||||||
| All adults ≥18 y |
6077 | BP <130/80 mm Hg | 38.5 (33.6-43.5)e | 44.8 (39.9-49.6) | 51.5 (48.0-55.1) | 47.9 (44.1-51.6) | 48.2 (44.6-51.8) | .007 |
| 6077 | BP <140/90 mm Hg | 63.6 (59.3-67.9)e | 68.2 (64.7-71.6) | 72.5 (69.2-75.7) | 74.3 (70.9-77.6) | 71.1 (67.7-74.5) | .004 | |
| LDL-C and statin use targets achieved | ||||||||
| All adults ≥18 y |
2451 | LDL-C <70 mg/dL | 4.5 (2.4-6.6)e |
14.6 (10.2-19.0)e | 17.8 (14.3-21.3) | 21.9 (18.4-25.4) | 21.4 (17.8-24.9) | <.001 |
| 2451 | LDL-C <100 mg/dL | 35.4 (27.2-43.6)e | 46.9 (40.8-52.9)e | 56.6 (51.9-61.4) | 54.8 (48.8-60.8) | 59.7 (54.2-65.2) | <.001 | |
| 6678 | Taking statins | 28.5 (24.7-32.3)e | 43.6 (39.8-47.3)e | 51.1 (48.4-53.7)e | 56.0 (51.9-60.0) | 55.5 (52.2-58.9) | <.001 | |
| All 3 targets achieved | ||||||||
| All adults ≥18 y |
2368 | Individualized HbA1c targets + BP <130/80 mm Hg + LDL-C <100 mg/dL | 9.0 (5.0-13.1)e |
14.3 (8.7-19.8) | 22.7 (18.2-27.1) | 16.6 (12.8-20.5) | 21.2 (15.5-26.8) | .01 |
| 2368 | Individualized HbA1c targets + BP <140/90 mm Hg + LDL-C <100 mg/dL | 13.9 (8.1-19.6)e | 24.7 (20.0-29.4) | 32.3 (26.8-37.8) | 25.8 (20.8-30.8) | 27.6 (20.7-34.5) | .06 | |
Abbreviations: BP, blood pressure; HbA1c, hemoglobin A1c; LDL-C, low-density lipoprotein cholesterol.
Diagnosed diabetes was defined as having self-report of diabetes diagnosis by a physician or other health professional.
Estimates were age standardized to the 1999-2018 National Health and Nutrition Examination Survey nonpregnant adult population with diagnosed diabetes, using the age groups 18 to 44 years, 45 to 64 years, and 65 years or older.
Unweighted number of adults with diagnosed diabetes.
Based on F tests.
Indicates P < .05 based on t tests for comparing the estimates in earlier years with the estimate in 2015-2018 within each row.
Complications were defined as having self-reported cardiovascular disease (congestive heart failure, coronary heart disease, heart attack, or stroke) or retinopathy or urine albumin to creatinine ratio ≥30 mg/g or estimated glomerular filtration rate <60 mL/min/1.73 m2.
All model assumptions were met and logistic models converged successfully. During the entire study period, compared with older adults, young adults were significantly less likely to achieve individualized HbA1c targets (43.5% vs 79.8%; adjusted OR, 0.25 [95% CI, 0.19-0.33]), LDL-C level less than 100 mg/dL (41.3% vs 63.5%; adjusted OR, 0.40 [95% CI, 0.27-0.58]), and all 3 goals (7.4% vs 21.7%; adjusted OR, 0.32 [95% CI, 0.16-0.63]), but significantly more likely to achieve BP less than 130/80 mm Hg (56.5% vs 37.4%; adjusted OR, 1.99 [95% CI, 1.52-2.60]) (Table 4, eTable 11 in the Supplement). Compared with non-Hispanic White adults, non-Hispanic Black adults were significantly less likely to achieve individualized HbA1c targets (60.4% vs 68.3%; adjusted OR, 0.64 [95% CI, 0.53-0.77]), BP less than 130/80 mm Hg (38.7% vs 48.5%; adjusted OR, 0.65 [95% CI, 0.55-0.78]), and all 3 goals (12.5% vs 20.6%; adjusted OR, 0.60 [95% CI, 0.40-0.90]). Compared with non-Hispanic White adults, Mexican American adults were significantly less likely to achieve individualized HbA1c targets (55.7% vs 68.3%; adjusted OR, 0.59 [95% CI, 0.47-0.73]), LDL-C level less than 100 mg/dL (43.4% vs 56.6%; adjusted OR, 0.64 [95% CI, 0.47-0.87]), and all 3 goals (10.9% vs 20.6%; adjusted OR, 0.48 [95% CI, 0.31-0.77]). Other subgroup estimates for primary goals and results for secondary goals are shown in Table 4 and eTable 11 in the Supplement.
Table 4. Prevalence of Achieving Selected Risk Factor Control Goals by Subgroup Among US Adults With Diagnosed Diabetes, 1999-2018.
| Characteristics | Adults with diagnosed diabetes, % (95% CI)a,b | |||||||||
|---|---|---|---|---|---|---|---|---|---|---|
| HbA1c <7.0% | HbA1c <8.0% | Individualized HbA1c targets | BP <130/80 mm Hg | BP <140/90 mm Hg | LDL-C <70 mg/dL | LDL-C <100 mg/dL | Taking statins | Individualized HbA1c targets + BP <130/80 mm Hg + LDL-C <100 mg/dL | Individualized HbA1c targets + BP <140/90 mm Hg + LDL-C <100 mg/dL | |
| No. of adults with diagnosed diabetesc | 6052 | 6052 | 6052 | 6077 | 6077 | 2451 | 2451 | 6678 | 2368 | 2368 |
| Overall prevalence | 51.1 (49.0-53.2) | 73.7 (72.1-75.3) | 65.2 (63.5-67.0) |
47.0 (45.2-48.8) | 70.5 (68.9-72.1) | 17.8 (16.1-19.5) | 53.3 (50.5-56.0) | 49.2 (47.5-50.9) | 18.0 (15.6-20.3) | 26.2 (23.4-29.1) |
| Age group, y | ||||||||||
| 18-44 | 47.9 (42.8-53.0) | 61.4 (56.5-66.2) | 43.5 (38.6-48.5) | 56.5 (51.4-61.6) | 84.1 (80.6-87.6) | 6.5 (2.9-10.1) | 41.3 (33.5-49.0) | 22.7 (18.5-26.8) | 7.4 (3.4-11.3) | 15.6 (10.2-21.0) |
| 45-64 | 46.7 (43.9-49.5) | 69.8 (67.1-72.4) | 59.1 (56.1-62.0) | 52.5 (50.0-55.1) | 75.6 (73.3-77.8) | 13.5 (10.7-16.3) | 47.9 (43.1-52.8) | 49.2 (46.4-51.9) | 18.0 (14.1-21.9) | 24.5 (19.5-29.4) |
| ≥65 | 57.1 (54.3-60.0) | 82.3 (80.5-84.2) | 79.8 (77.7-81.9) | 37.4 (35.0-39.7) | 60.1 (57.7-62.6) | 26.5 (23.4-29.7) | 63.5 (60.1-67.0) | 58.6 (56.1-61.0) | 21.7 (18.1-25.2) | 31.9 (28.0-35.7) |
| Sex | ||||||||||
| Men | 48.2 (45.2-51.2) | 72.5 (70.2-74.7) | 63.0 (60.6-65.5) | 47.3 (44.9-49.6) | 72.2 (69.9-74.4) | 21.2 (18.6-23.9) | 58.7 (55.4-61.9) | 52.6 (50.5-54.8) | 21.3 (17.7-25.0) | 30.0 (26.2-33.8) |
| Women | 54.2 (51.9-56.5) | 74.9 (73.1-76.7) | 67.6 (65.6-69.7) | 46.7 (44.0-49.4) | 69.0 (67.0-71.0) | 14.2 (11.7-16.8) | 47.7 (43.7-51.7) | 45.8 (43.4-48.2) | 14.5 (12.0-17.0) | 22.3 (19.1-25.5) |
| Race and ethnicityd | ||||||||||
| Non-Hispanic White | 53.6 (50.4-56.7) | 76.7 (74.4-78.9) | 68.3 (65.7-70.9) | 48.5 (45.6-51.3) | 72.7 (70.2-75.1) | 17.5 (15.2-19.8) | 56.6 (52.4-60.8) | 52.8 (50.3-55.2) | 20.6 (17.0-24.1) | 29.6 (25.1-34.1) |
| Non-Hispanic Black | 47.8 (45.3-50.3) | 68.7 (66.3-71.1) | 60.4 (57.7-63.1) | 38.7 (36.3-41.2) | 61.3 (58.8-63.8) | 16.2 (13.1-19.2) | 46.9 (42.8-51.0) | 44.2 (41.4-46.9) | 12.5 (9.3-15.7) | 19.4 (15.9-22.8) |
| Mexican American | 42.6 (39.2-46.1) | 64.9 (61.3-68.5) | 55.7 (52.2-59.1) | 47.2 (44.1-50.2) | 69.6 (66.0-73.3) | 17.3 (13.3-21.4) | 43.4 (38.8-48.0) | 42.6 (39.3-46.0) | 10.9 (7.8-14.1) | 16.8 (13.2-20.5) |
| Other | 49.3 (45.2-53.4) | 71.7 (67.8-75.7) | 63.3 (59.2-67.4) | 50.1 (46.4-53.8) | 73.1 (69.5-76.7) | 21.4 (16.9-25.9) | 53.4 (46.2-60.5) | 45.8 (41.5-50.1) | 16.3 (10.8-21.8) | 25.7 (19.2-32.2) |
| Education levele | ||||||||||
| <High school | 48.3 (45.6-51.1) | 70.3 (67.7-72.8) | 62.9 (60.2-65.6) | 44.0 (41.2-46.7) | 67.0 (64.5-69.5) | 16.1 (12.7-19.5) | 46.7 (42.4-50.9) | 44.1 (41.3-46.9) | 14.9 (11.9-17.9) | 21.8 (18.3-25.2) |
| High school graduate | 50.3 (46.5-54.1) | 72.3 (69.2-75.4) | 65.9 (62.9-68.9) | 44.2 (40.9-47.6) | 69.5 (66.5-72.5) | 15.8 (11.8-19.8) | 50.8 (44.9-56.7) | 50.6 (47.3-54.0) | 17.1 (13.0-21.2) | 25.4 (20.5-30.3) |
| Some college | 52.8 (48.8-56.8) | 73.9 (71.1-76.7) | 64.6 (61.6-67.5) | 48.1 (44.5-51.7) | 72.1 (68.9-75.4) | 18.4 (14.8-22.0) | 54.8 (48.9-60.7) | 49.0 (45.7-52.3) | 18.1 (13.9-22.3) | 26.7 (21.9-31.6) |
| College graduate or above | 54.4 (49.6-59.1) | 79.9 (76.4-83.3) | 69.3 (65.0-73.5) | 53.1 (48.5-57.7) | 75.0 (70.8-79.1) | 21.6 (16.0-27.2) | 61.0 (54.4-67.5) | 55.3 (51.2-59.5) | 22.2 (15.9-28.4) | 31.4 (24.4-38.4) |
| Weight group (BMI range)f | ||||||||||
| Normal weight (18.5-24.9) | 50.8 (45.2-56.3) | 71.9 (67.1-76.7) | 62.8 (57.6-68.0) | 45.6 (39.7-51.4) | 69.5 (65.3-73.7) | 16.2 (10.7-21.6) | 55.5 (48.1-62.9) | 45.4 (41.1-49.8) | 13.7 (8.0-19.3) | 18.3 (12.5-24.2) |
| Overweight (25.0-29.9) | 52.9 (49.2-56.7) | 73.6 (70.9-76.4) | 65.8 (62.7-68.9) | 50.3 (47.1-53.6) | 70.9 (68.0-73.7) | 17.7 (13.6-21.8) | 49.9 (44.4-55.5) | 47.6 (44.2-51.0) | 19.1 (14.3-23.9) | 25.9 (20.8-31.0) |
| Class 1 obesity (30.0-34.9) | 50.6 (47.0-54.2) | 74.0 (70.8-77.2) | 65.0 (61.7-68.2) | 49.9 (46.5-53.3) | 74.1 (71.1-77.1) | 18.2 (14.5-21.8) | 54.2 (48.9-59.4) | 51.4 (48.0-54.8) | 20.9 (16.3-25.5) | 29.2 (24.0-34.4) |
| Class 2 obesity (35.0-39.9) | 51.3 (46.6-56.0) | 74.4 (70.5-78.3) | 67.3 (63.3-71.4) | 41.7 (36.9-46.4) | 68.2 (64.2-72.3) | 17.7 (12.5-22.9) | 52.1 (46.3-57.9) | 49.8 (45.6-54.0) | 17.8 (12.7-22.9) | 27.2 (22.1-32.2) |
| Class 3 obesity (≥40.0) | 49.5 (44.6-54.3) | 72.2 (67.8-76.6) | 64.0 (59.3-68.6) | 45.1 (40.5-49.8) | 70.5 (65.9-75.1) | 21.1 (13.8-28.5) | 57.4 (51.0-63.7) | 54.1 (49.4-58.8) | 13.4 (7.8-19.0) | 27.8 (19.7-35.9) |
| Abdominal obesity (waist circumference range, cm)g | ||||||||||
| No (≤102 in men, ≤88 in women) | 50.8 (46.6-55.1) | 73.4 (69.8-77.0) | 63.5 (59.6-67.3) | 48.2 (44.3-52.1) | 72.4 (69.3-75.6) | 19.2 (14.9-23.4) | 54.2 (48.6-59.8) | 46.1 (42.3-49.9) | 16.6 (11.3-21.8) | 25.5 (20.5-30.5) |
| Yes (>102 in men, >88 in women) | 51.1 (48.8-53.3) | 74.0 (72.3-75.8) | 65.7 (63.8-67.7) | 47.0 (44.9-49.2) | 70.5 (68.4-72.5) | 17.3 (15.3-19.3) | 53.5 (50.3-56.7) | 50.8 (48.8-52.8) | 18.8 (16.2-21.4) | 27.0 (23.9-30.1) |
| Insurance statush | ||||||||||
| Uninsured | 40.4 (32.8-48.0) | 62.3 (55.4-69.3) | 56.7 (49.6-63.7) | 45.7 (38.3-53.1) | 65.3 (57.2-73.3) | 27.2 (16.6-37.9) | 53.4 (46.3-60.6) | 32.9 (25.9-39.9) | 13.2 (4.9-21.4) | 17.4 (8.4-26.3) |
| Insured | 51.8 (49.5-54.1) | 74.9 (73.2-76.6) | 66.0 (64.1-68.0) | 47.3 (45.3-49.3) | 71.3 (69.6-73.0) | 18.1 (16.3-19.9) | 54.4 (51.5-57.3) | 51.5 (49.7-53.2) | 18.3 (15.7-20.8) | 26.9 (24.0-29.9) |
| Complicationsi | ||||||||||
| No | 56.9 (53.8-60.1) | 78.8 (76.5-81.2) | 61.9 (59.2-64.6) | 53.3 (50.5-56.1) | 78.1 (75.5-80.6) | 15.5 (12.1-18.8) | 52.4 (47.8-57.0) | 45.1 (42.4-47.7) | 19.5 (15.8-23.1) | 27.6 (23.6-31.6) |
| Yes | 46.1 (43.5-48.7) | 69.1 (66.8-71.4) | 67.4 (65.1-69.7) | 41.8 (39.4-44.1) | 65.2 (63.0-67.5) | 19.0 (16.4-21.5) | 53.7 (50.3-57.0) | 51.9 (49.6-54.1) | 18.0 (14.9-21.0) | 26.1 (22.4-29.7) |
Abbreviations: BMI, body mass index, calculated as weight in kilograms divided by height in meters squared; BP, blood pressure; HbA1c, hemoglobin A1c; LDL-C, low-density lipoprotein cholesterol.
Diagnosed diabetes was defined as having self-report of diabetes diagnosis by a physician or other health professional.
Estimates were age standardized to the 1999-2018 National Health and Nutrition Examination Survey nonpregnant adult population with diagnosed diabetes, using the age groups 18 to 44 years, 45 to 64 years, and 65 years or older.
Unweighted number of adults with diagnosed diabetes.
Race/ethnicity was determined by self-report in fixed categories. The Non-Hispanic Asian category was not available before 2011 due to the survey design, and thus estimates could not be presented separately. All other racial and ethnic groups were grouped as “other.”
Participants refused to report or did not know their education level for analyses of HbA1c (n = 11), BP (n = 14), LDL-C (n = 4), taking statins (n = 16), and 3 goals combined (n = 4).
Estimates are not shown for adults with BMI less than 18.5 (ie, underweight) due to small sample size (n = 25). BMI was missing for analyses of HbA1c (n = 189), BP (n = 183), LDL-C (n = 60), takin statins (n = 228), and 3 goals combined (n = 54).
Waist circumference was missing for analyses of HbA1c (n = 475), BP (n = 455), LDL-C (n = 146), taking statins (n = 574), and 3 goals combined (n = 127).
Insurance information was missing for analyses of HbA1c (n = 18), BP (n = 18), LDL-C (n = 5), taking statins (n = 27), and 3 goals combined (n = 5).
Complications were defined as having self-reported cardiovascular disease (congestive heart failure, coronary heart disease, heart attack, or stroke) or retinopathy or urine albumin to creatinine ratio ≥30 mg/g or estimated glomerular filtration rate <60 mL/min/1.73 m2.
Sensitivity Analysis
The estimated age-standardized prevalence of diabetes based on the definition including 2-hour plasma glucose level did not increase significantly between 2005-2006 and 2015-2016 (relative percentage change per 2-year cycle, 1.1% [95% CI, –2.3% to 4.6%]; P for trend = .44) (eTable 12 in the Supplement). If it was restricted to the same period without including 2-hour plasma glucose level, there was a significant increase (relative percentage change per 2-year cycle, 3.1% [95% CI, 0.02%-6.3%]; P for trend = .049).
Discussion
The estimated prevalence of diabetes among US adults increased significantly between 1999-2000 and 2017-2018. The estimated proportion of adults with diagnosed diabetes who achieved individualized HbA1c targets and BP less than 130/80 mm Hg in 2015-2018 was significantly higher than that in 1999-2002, but not in 2003-2014. The estimated proportion of adults with diagnosed diabetes who achieved LDL-C level less than 100 mg/dL in 2015-2018 was significantly higher than that in 1999-2006, but not in 2007-2014. Only an estimated 21% of adults with diagnosed diabetes achieved all 3 risk factor control goals in 2015-2018.
This work extends prior findings by providing the most updated estimates and characterizing previously unreported subgroups (eg, adults with abdominal obesity).6,7,8,12,13 The significant increasing trends in the estimated prevalence of diabetes may in part be a collective product of improved survival in diabetes21; increasing burden of diabetes among children and young adults22; more widespread screening for diabetes, particularly after the implementation of the Patient Protection and Affordable Care Act23; increasing body mass index and waist circumference24; and decreasing incidence of diagnosed diabetes among US adults.5 The estimated prevalence of diabetes continued to increase significantly among subgroups disproportionately affected by diabetes, including Mexican American adults and those with abdominal obesity. Underdiagnosis was common and the estimated prevalence of undiagnosed diabetes did not decrease significantly over time. The estimated percentage of diabetes that was undiagnosed decreased significantly over time, which may be due to better screening and survival. However, among all racial/ethnic subgroups, this significant decrease in the estimated percentage of diabetes that was undiagnosed was observed only in non-Hispanic White adults, which may be attributed in part to higher insurance coverage and more preventive services compared with that for minority adults.25,26
Similar to that for young adults in many other parts of the world,22 the burden of diabetes among US young adults has been increasing. Compared with later-onset diabetes, young-onset diabetes appeared to be associated with worse glycemic control, progressed to adverse cardiometabolic risk profiles more rapidly, and had greater lifetime risk of vascular and nonvascular complications.22 In this study, young adults were significantly less likely than older ones to achieve individualized HbA1c targets, LDL-C level less than 100 mg/dL, and all 3 goals combined. Accordingly, early detection and management of diabetes among young adults is critical, but the estimated percentage of diabetes that was undiagnosed remained high and unchanged during the previous 2 decades.
The improvement in risk factor control reported before 2010 did not continue despite extensive public health investments, as well as advances in therapeutic management of diabetes in the past 2 decades.12,13 Similar to that in previous reports, greater improvement was observed for cholesterol control than glycemic and BP control. Only a small estimated proportion of adults with diagnosed diabetes achieved all 3 risk factor control goals, and stagnation in risk factor control occurred in 2003-2018, although the treatment goals are theoretically achievable via pharmacologic and lifestyle therapies for most people and cardiovascular risk factor control has been emphasized in guidelines.10,11,27 Significant racial and ethnic differences in risk factor control existed. Reasons abound for poor risk factor control, but challenges lie in designing effective tailored approaches for improving adherence to medications and healthy lifestyle behaviors, as well as providing necessary health care access and resources, education, and self-management support for improving adherence and maintaining achieved adherence.12,28
Limitations
This study has several limitations. First, misclassification of diabetes was possible because of the use of self-reported diagnosis and reliance on single-occasion laboratory measurement. Repeating the same laboratory test on another day or performing a different test without delay with a new blood sample has been recommended to confirm a diabetes diagnosis unless there is a clear clinical diagnosis.29 Second, oral glucose tolerance test data were available only between 2005 and 2016. Furthermore, intraindividual variability of 2-hour plasma glucose level (16.7%) was higher than that of fasting plasma glucose level (5.7%) and HbA1c level (3.6%).30 Thus, the primary definition of diabetes did not include 2-hour plasma glucose level. Third, a small shift in the distribution of HbA1c data in 2007-2010 was identified by the National Center for Health Statistics, but the reason was unclear despite intensive investigations. Fourth, results from the analysis of risk factor control did not necessarily apply to all adults with diabetes. Individualized cholesterol control goals were not studied because intensity of statin therapy was not collected in NHANES. However, a number of risk factor control goals were considered to facilitate the understanding of the general risk factor control among US adults with diagnosed diabetes.
Conclusions
Based on NHANES data from US adults, the estimated prevalence of diabetes increased significantly between 1999-2000 and 2017-2018. Only an estimated 21% of adults with diagnosed diabetes achieved all 3 risk factor control goals in 2015-2018.
eFigure. Trends in distribution of risk factors among US adults with diagnosed diabetes
eTable 1. Trends in prevalence of diagnosed diabetes among US adults
eTable 2. Trends in prevalence of undiagnosed diabetes among US adults
eTable 3. Trends in percent of diabetes that was undiagnosed among US adults
eTable 4. Trends in prevalence of achieving individualized hemoglobin A1c targets among US adults with diagnosed diabetes
eTable 5. Trends in prevalence of achieving systolic/diastolic blood pressure <130/80 mm Hg among US adults with diagnosed diabetes
eTable 6. Trends in prevalence of achieving low-density lipoprotein cholesterol <100 mg/dL among US adults with diagnosed diabetes
eTable 7. Trends in prevalence of achieving hemoglobin A1c <7% among US adults with diagnosed diabetes
eTable 8. Trends in prevalence of achieving hemoglobin A1c <8% among US adults with diagnosed diabetes
eTable 9. Trends in prevalence of achieving systolic/diastolic blood pressure <140/90 mm Hg among US adults with diagnosed diabetes
eTable 10. Trends in prevalence of statin use among US adults with diagnosed diabetes
eTable 11. Factors associated with achieving selected risk factor control goals among US adults with diagnosed diabetes, 1999-2018
eTable 12. Trends in prevalence of diabetes including cases identified by 2-hour plasma glucose, 2005-2016
References
- 1.GBD 2017 Risk Factor Collaborators . Global, regional, and national comparative risk assessment of 84 behavioural, environmental and occupational, and metabolic risks or clusters of risks for 195 countries and territories, 1990-2017: a systematic analysis for the Global Burden of Disease Study 2017. Lancet. 2018;392(10159):1923-1994. doi: 10.1016/S0140-6736(18)32225-6 [DOI] [PMC free article] [PubMed] [Google Scholar]
- 2.World Health Organization . Global report on diabetes. Accessed May 2, 2021. https://apps.who.int/iris/bitstream/handle/10665/204871/9789241565257_eng.pdf
- 3.American Diabetes Association . Economic costs of diabetes in the US in 2017. Diabetes Care. 2018;41(5):917-928. doi: 10.2337/dci18-0007 [DOI] [PMC free article] [PubMed] [Google Scholar]
- 4.Gregg EW, Cadwell BL, Cheng YJ, et al. Trends in the prevalence and ratio of diagnosed to undiagnosed diabetes according to obesity levels in the US. Diabetes Care. 2004;27(12):2806-2812. doi: 10.2337/diacare.27.12.2806 [DOI] [PubMed] [Google Scholar]
- 5.Centers for Disease Control and Prevention . National Diabetes Statistics Report, 2020. Centers for Disease Control and Prevention, US Dept of Health and Human Services; 2020. [Google Scholar]
- 6.Menke A, Casagrande S, Geiss L, Cowie CC. Prevalence of and trends in diabetes among adults in the United States, 1988-2012. JAMA. 2015;314(10):1021-1029. doi: 10.1001/jama.2015.10029 [DOI] [PubMed] [Google Scholar]
- 7.Cheng YJ, Kanaya AM, Araneta MRG, et al. Prevalence of diabetes by race and ethnicity in the United States, 2011-2016. JAMA. 2019;322(24):2389-2398. doi: 10.1001/jama.2019.19365 [DOI] [PMC free article] [PubMed] [Google Scholar]
- 8.Gregg EW, Cheng YJ, Narayan KM, Thompson TJ, Williamson DF. The relative contributions of different levels of overweight and obesity to the increased prevalence of diabetes in the United States: 1976-2004. Prev Med. 2007;45(5):348-352. doi: 10.1016/j.ypmed.2007.07.020 [DOI] [PubMed] [Google Scholar]
- 9.Einarson TR, Acs A, Ludwig C, Panton UH. Prevalence of cardiovascular disease in type 2 diabetes: a systematic literature review of scientific evidence from across the world in 2007-2017. Cardiovasc Diabetol. 2018;17(1):83. doi: 10.1186/s12933-018-0728-6 [DOI] [PMC free article] [PubMed] [Google Scholar]
- 10.American Diabetes Association . 6. Glycemic targets: standards of medical care in diabetes—2018. Diabetes Care. 2018;41(suppl 1):S55-S64. doi: 10.2337/dc18-S006 [DOI] [PubMed] [Google Scholar]
- 11.American Diabetes Association . 9. Cardiovascular disease and risk management: standards of medical care in diabetes—2018. Diabetes Care. 2018;41(suppl 1):S86-S104. doi: 10.2337/dc18-S009 [DOI] [PubMed] [Google Scholar]
- 12.Stark Casagrande S, Fradkin JE, Saydah SH, Rust KF, Cowie CC. The prevalence of meeting A1c, blood pressure, and LDL goals among people with diabetes, 1988-2010. Diabetes Care. 2013;36(8):2271-2279. doi: 10.2337/dc12-2258 [DOI] [PMC free article] [PubMed] [Google Scholar]
- 13.Ali MK, Bullard KM, Saaddine JB, Cowie CC, Imperatore G, Gregg EW. Achievement of goals in US diabetes care, 1999-2010. N Engl J Med. 2013;368(17):1613-1624. doi: 10.1056/NEJMsa1213829 [DOI] [PubMed] [Google Scholar]
- 14.National Center for Health Statistics . NHANES survey methods and analytic guidelines. Centers for Disease Control and Prevention. Accessed May 2, 2021. https://wwwn.cdc.gov/nchs/nhanes/analyticguidelines.aspx
- 15.Levey AS, Stevens LA, Schmid CH, et al. ; CKD-EPI (Chronic Kidney Disease Epidemiology Collaboration) . A new equation to estimate glomerular filtration rate. Ann Intern Med. 2009;150(9):604-612. doi: 10.7326/0003-4819-150-9-200905050-00006 [DOI] [PMC free article] [PubMed] [Google Scholar]
- 16.American Diabetes Association . 11. Older adults: Standards of Medical Care in Diabetes—2018. Diabetes Care. 2018;41(suppl 1):S119-S125. doi: 10.2337/dc18-S011 [DOI] [PubMed] [Google Scholar]
- 17.Whelton PK, Carey RM, Aronow WS, et al. 2017 ACC/AHA/AAPA/ABC/ACPM/AGS/APhA/ASH/ASPC/NMA/PCNA guideline for the prevention, detection, evaluation, and management of high blood pressure in adults: a report of the American College of Cardiology/American Heart Association Task Force on Clinical Practice Guidelines. J Am Coll Cardiol. 2018;71(19):e127-e248. doi: 10.1016/j.jacc.2017.11.006 [DOI] [PubMed] [Google Scholar]
- 18.Bundy JD, Li C, Stuchlik P, et al. Systolic blood pressure reduction and risk of cardiovascular disease and mortality: a systematic review and network meta-analysis. JAMA Cardiol. 2017;2(7):775-781. doi: 10.1001/jamacardio.2017.1421 [DOI] [PMC free article] [PubMed] [Google Scholar]
- 19.Haffner SM; American Diabetes Association . Dyslipidemia management in adults with diabetes. Diabetes Care. 2004;27(suppl 1):S68-S71. doi: 10.2337/diacare.27.2007.S68 [DOI] [PubMed] [Google Scholar]
- 20.Joinpoint Regression Program , version 4.8.0.1. Statistical Methodology and Applications Branch, Surveillance Research Program, National Cancer Institute. April 2020.
- 21.Gregg EW, Cheng YJ, Srinivasan M, et al. Trends in cause-specific mortality among adults with and without diagnosed diabetes in the USA: an epidemiological analysis of linked national survey and vital statistics data. Lancet. 2018;391(10138):2430-2440. doi: 10.1016/S0140-6736(18)30314-3 [DOI] [PubMed] [Google Scholar]
- 22.Lascar N, Brown J, Pattison H, Barnett AH, Bailey CJ, Bellary S. Type 2 diabetes in adolescents and young adults. Lancet Diabetes Endocrinol. 2018;6(1):69-80. doi: 10.1016/S2213-8587(17)30186-9 [DOI] [PubMed] [Google Scholar]
- 23.Myerson R, Laiteerapong N. The Affordable Care Act and diabetes diagnosis and care: exploring the potential impacts. Curr Diab Rep. 2016;16(4):27. doi: 10.1007/s11892-016-0712-z [DOI] [PMC free article] [PubMed] [Google Scholar]
- 24.Fryar CD, Kruszon-Moran D, Gu Q, Ogden CL. Mean body weight, height, waist circumference, and body mass index among adults: United States, 1999-2000 through 2015-2016. Natl Health Stat Report. 2018;(122):1-16. [PubMed] [Google Scholar]
- 25.Fisher-Hoch SP, Vatcheva KP, Rahbar MH, McCormick JB. Undiagnosed diabetes and pre-diabetes in health disparities. PLoS One. 2015;10(7):e0133135. doi: 10.1371/journal.pone.0133135 [DOI] [PMC free article] [PubMed] [Google Scholar]
- 26.Nelson KM, Chapko MK, Reiber G, Boyko EJ. The association between health insurance coverage and diabetes care: data from the 2000 Behavioral Risk Factor Surveillance System. Health Serv Res. 2005;40(2):361-372. doi: 10.1111/j.1475-6773.2005.0d362.x [DOI] [PMC free article] [PubMed] [Google Scholar]
- 27.Cosentino F, Grant PJ, Aboyans V, et al. ; ESC Scientific Document Group . 2019 ESC guidelines on diabetes, pre-diabetes, and cardiovascular diseases developed in collaboration with the EASD. Eur Heart J. 2020;41(2):255-323. doi: 10.1093/eurheartj/ehz486 [DOI] [PubMed] [Google Scholar]
- 28.Hill-Briggs F, Adler NE, Berkowitz SA, et al. Social determinants of health and diabetes: a scientific review. Diabetes Care. 2020;44(1):258-279. doi: 10.2337/dci20-0053 [DOI] [PMC free article] [PubMed] [Google Scholar]
- 29.American Diabetes Association . 2. Classification and diagnosis of diabetes: standards of medical care in diabetes—2018. Diabetes Care. 2018;41(suppl 1):S13-S27. doi: 10.2337/dc18-S002 [DOI] [PubMed] [Google Scholar]
- 30.Selvin E, Crainiceanu CM, Brancati FL, Coresh J. Short-term variability in measures of glycemia and implications for the classification of diabetes. Arch Intern Med. 2007;167(14):1545-1551. doi: 10.1001/archinte.167.14.1545 [DOI] [PubMed] [Google Scholar]
Associated Data
This section collects any data citations, data availability statements, or supplementary materials included in this article.
Supplementary Materials
eFigure. Trends in distribution of risk factors among US adults with diagnosed diabetes
eTable 1. Trends in prevalence of diagnosed diabetes among US adults
eTable 2. Trends in prevalence of undiagnosed diabetes among US adults
eTable 3. Trends in percent of diabetes that was undiagnosed among US adults
eTable 4. Trends in prevalence of achieving individualized hemoglobin A1c targets among US adults with diagnosed diabetes
eTable 5. Trends in prevalence of achieving systolic/diastolic blood pressure <130/80 mm Hg among US adults with diagnosed diabetes
eTable 6. Trends in prevalence of achieving low-density lipoprotein cholesterol <100 mg/dL among US adults with diagnosed diabetes
eTable 7. Trends in prevalence of achieving hemoglobin A1c <7% among US adults with diagnosed diabetes
eTable 8. Trends in prevalence of achieving hemoglobin A1c <8% among US adults with diagnosed diabetes
eTable 9. Trends in prevalence of achieving systolic/diastolic blood pressure <140/90 mm Hg among US adults with diagnosed diabetes
eTable 10. Trends in prevalence of statin use among US adults with diagnosed diabetes
eTable 11. Factors associated with achieving selected risk factor control goals among US adults with diagnosed diabetes, 1999-2018
eTable 12. Trends in prevalence of diabetes including cases identified by 2-hour plasma glucose, 2005-2016