

Abstract
Bone marrow mononuclear cells (MNCs) attenuate secondary degeneration and enhance recovery in stroke animal models. In a nonrandomized clinical trial, we imaged 37 patients with stroke: 17 patients treated with MNCs (treated) and 20 patients who received standard of care (nontreated) at 1, 3, and 12 months onset of stroke on 3.0T MRI system. Three‐dimensional anatomical and diffusion tensor images were obtained. The integrity of the corticospinal tract was assessed by measuring absolute and relative fractional anisotropy (FA) and mean diffusivity (MD) in the rostral pons (RP), posterior limb of the internal capsule, and corona radiata by drawing regions of interest. Infarct volume and stroke severity, which was assessed via the NIH Stroke Scale (NIHSS), were higher in the MNC group compared with the nontreated patients, which is a major limitation. Overall, the relative FA (rFA) of the nontreated patients exhibited continued reduction and an increase in relative MD (rMD) from 1 to 12 months, whereas despite larger infarcts and higher severity, treated patients displayed an increase in rFA from 3 to 12 months and no change in rMD. Contrary to the nontreated group, the treated patients' rFA was also significantly correlated (P < .05) with NIHSS score in the RP at all time points, whereas rMD at the last two.
Keywords: cell therapy, corticospinal tract, diffusion tensor imaging, ischemic stroke, serial neuroimaging study
Autologous bone‐marrow mononuclear cells were intravenously administered in patients with acute ischemic stroke as procedure outline in panel (A). The nontreated patients were recruited separately. Both groups were imaged three times over year and neuroimaging biomarkers were developed. Integrity of the ipsilesional and contralesional cortical spinal tracts (CST) were evaluated via diffusion tensor imaging (DTI), in the rostral pons (RP), posterior limb of internal capsule (PLIC), and corona radiata (CR) as illustrated in panel (B). The relative fractional anisotropy (rFA), an imaging marker of white matter integrity, was serially quantified in these three regions in each group as shown in panel (C1), (C2), and (C3). Despite larger infarct size and severity of the treated group, the rFA either increased or stabilized as compared to the nontreated patients.

1. INTRODUCTION
Reperfusion to restore cerebral blood flow is the only viable therapeutic option in patients with ischemic stroke (IS) via intravenous tissue plasminogen activator (tPA) administration within 4.5 hours of symptom onset and/or clot retrieval within 24 hours. However, only a minority of patients are eligible for these treatments. Currently, there are no other approved interventions to promote neurorestoration after IS. Recent advances in regenerative medicine have shown the promise of many novel cell‐based therapies for various medical conditions including stroke. Extensive animal studies have shown that cell therapies enhance stroke recovery, 1 , 2 , 3 , 4 , 5 , 6 , 7 and clinical trials suggest their safety in patients with stroke. 8 , 9 , 10 , 11 , 12 , 13 , 14 , 15
For the last 10 years, various types of cells, doses, and delivery routes have been pursued to explore therapeutic efficacy in animal models. 11 , 16 , 17 , 18 , 19 , 20 , 21 These studies have led to several proposed mechanisms such as the release of cytokines, trophic factors, and exosomes enhancing endogenous brain repair. 22 , 23 , 24 Brain repair mechanisms upregulated by stem cells include an increase in neurovascularization and synaptogenesis 22 , 25 , 26 and an increase in axonal sprouting and white matter tract remodeling. 23 , 27 , 28
To pursue the hypothesis that cell‐based therapies promote white matter tract remodeling, we have been studying white matter tract changes after stroke in patients treated with and without bone marrow‐derived cell therapies. Nearly 90% of patients with IS exhibit middle cerebral artery occlusion causing hemiplegia/hemiparesis. 29 The corticospinal tract (CST), a major white matter axonal pathway that facilitates neuronal communication between the brain and limbs, is the primary source of motor function impairment. Diffusion tensor imaging (DTI), which uses random water molecular motion, assesses the integrity of white matter tracts and provides measures of microstructural changes by the provision of a scalar matrix referred to as fractional anisotropy (FA) and mean diffusivity (MD). 30 , 31 FA is a scalar index ranging from 0 (isotropic diffusion) to 1 (anisotropic diffusion). A higher FA represents better white matter fiber integrity. MD represents the magnitude of water diffusion, and a higher MD in the chronic phase indicates axonal fiber disintegration. Many research studies have shown that longitudinal DTI‐derived measures may serve as neuroimaging markers to assess poststroke changes to white matter tracts. 32 , 33 , 34 , 35 , 36 , 37
Previously, we completed a phase I clinical trial on the safety and feasibility of intravenous administration of autologous bone marrow‐derived mononuclear cells (BM‐MNCs) in patients with IS and reported preliminary longitudinal DTI changes of CST recovery in the rostral pons (RP). 38 Herein, we studied extensive longitudinal microstructural changes in the CST of patients treated with BM‐MNCs compared with a separate, prospectively collected cohort of patients with IS who received only standard of care.
2. MATERIALS AND METHODS
2.1. Human protection
Our bone marrow clinical trial was conducted under the Federal Investigational New Drug Application BB IND 13775 and was registered with ClinicalTrials.gov. The nontreated group was pooled from an ongoing prospective cohort on the natural evolution of white and gray matter changes after IS. Both studies were approved by the institutional review board of the University of Texas Health Sciences Center at Houston and by the Memorial Hermann Hospital Office of Research. Written informed consent was obtained after a thorough discussion with patients and family members.
2.2. Patient enrollment
A total of 45 patients with IS participated; 25 (between 2009 and 2012) were treated with autologous BM‐MNCs (the “treated” group), and 20 (between 2011 and 2019) did not receive BM‐MNCs (which we describe as the “nontreated” group). The nontreated patients were recruited separately after completion of the clinical trial BM‐MNC treatment. Both groups underwent standard and customary poststroke rehabilitation. All the participants underwent serial magnetic resonance imaging (MRI), except four patients of the treated group who underwent CT imaging; their data were excluded. In the BM‐MNC‐treated group, the inclusion and exclusion criteria in the clinical trial are described elsewhere. 39 Briefly, patients were aged 18 to 83 years, with NIH Stroke Scale (NIHSS) score 6 to 30 and lesion size of 5 to 100 cc. In the natural history cohort (nontreated group), patients had an IS, were aged 18 to 80 years, had no minimum severity, and had no minimum or maximum lesion size cutoff. For both groups, patients with brain tumor, claustrophobia, or metal implantation were excluded.
2.3. Bone marrow mononuclear cell harvest, isolation, and infusion
The procedural details of BM‐MNC isolation and intravenous infusion have been previously reported. 39 Briefly, a total of 2 mL/kg bone marrow was harvested aseptically from the posterior iliac bone. The mononuclear cells were enriched from the bone marrow using Ficoll‐Paque (GE Healthcare Bioscience, Uppsala, Sweden) and density gradient separation with the density gradient procedure on the Sepax device (Biosafe SA, Geneva, Switzerland). A maximum of 10 million cells/kg in normal saline was administered into the antecubital vein over approximately 30 minutes. Cells were administered within 72 hours of stroke onset.
2.4. Clinical and radiological assessments
All patients enrolled underwent baseline and serial assessment of neurological deficits and disability using the NIHSS. 40 Baseline imaging was obtained as part of the standard of care protocols within 24 to 48 hours. of stroke onset without DTI. Follow‐up images obtained at 1, 3, and 12 months after stroke were compared between the two groups. The qualitative radiological assessment included serial comparison in lesion size, location, midline shift, presence of Wallerian Degeneration (WD), and involvement of CST by the infarct.
2.5. Image acquisition
For all patients, MRI images were obtained on a full body 3.0T Philips Intera later upgraded to an Ingenia (Philips Medical Systems, Best, The Netherlands) system. There were minor variations in the acquisition protocol between the two groups. Diffusion tensor images were obtained using echo‐planar imaging with the balanced and uniformly distributed Icosa‐21 diffusion encoding scheme 41 with a diffusion sensitization of b = 1000 seconds/mm2, repetition time (TR) = 8.0 seconds, and echo time (TE) = 66 ms. The slice thickness was 3 mm with 44 axial slices covering the entire brain, a square field of view = 256 × 256 mm2, and an image matrix of 128 × 128 mm2 reconstructed to 256 × 256 mm2. Three‐dimensional T1‐weighted images were acquired with TR = 8.06 seconds, TE = 3.68 ms, acquisition matrix = 256 × 256 × 180 mm2, slice thickness = 1 mm. Three‐dimensional fluid‐attenuated inversion recovery (FLAIR) volumes were acquired with TR = 4.8 seconds, TE = 129 ms, inversion time = 1.65 seconds, acquisition matrix = 256 × 256, and slice thickness = 1 mm. The total scan time for these sequences was less than 30 minutes.
2.6. Diffusion tensor image processing
Imaging data of four treated patients were removed from analysis because of poor image quality. Seventeen participants of the treated group completed 1‐ and 3‐month imaging, whereas only 13 completed imaging at 12 months. All 20 participants of the nontreated group completed 1‐ and 3‐month imaging, whereas only 19 completed imaging at 12 months.
The diffusion weighted imaging (DWI) volume data were preprocessed using FSL (http://www.fmrib.ox.ac.uk/fsl), and all images were visually inspected for head motion and imaging artifacts. DWI volumes were registered to “B0” image and eddy current corrected for geometric distortions followed by brain extraction. Scalar metrics such as the eigenvalues, FA, and MD were obtained using the FSL diffusion toolbox. The T1‐weighted, FLAIR, FA, and MD images at 1 month were registered to later time points using FLIRT (FMRIB's Linear Image Registration Tool) affine 12° of freedom. We applied region of interest (ROI) analysis to compare white matter integrity of the CST between the two groups.
2.7. ROI analysis
We measured FA and MD in the three regions of the ipsilesional and contralesional CST, that is, the RP, posterior limb of the internal capsule (PLIC), and corona radiata (CR), by two raters (O.D.A., blinded to the study with 4 years' experience, and M.E.H., unblinded, with 11 years' experience). All the analyses were performed by a blinded biostatistician. The ROIs were obtained by hand drawing in multiple slices of color‐coded principal eigenvector modulated FA maps at the first time point. The ROI size varies in each slice, and extra cautions were taken to avoid partial volume contamination. The average number of voxels in each ROI were 75, 110, and 750 in the RP, PLIC, and CR, respectively. Each ROI was saved as an object and used for later time point temporal measurements using ROI Editor Software (http://www.mristudio.org). We reported both absolute and relative (ipsilesional/contralesional) fractional anisotropy (rFA) and mean diffusivity (rMD) measurements, obtained in the RP, PLIC, and CR. The rFA and rMD measurements in the RP of one nontreated patient were removed from the analysis because of hemorrhagic transformation in the lesion between the 1‐ and 3‐month visit.
2.8. Lesion volume measurements
A semiautomated seed growing algorithm in Analyze 12.0 (Analyze Direct, Inc., Overland Park, Kansas) was used to measure infarct volumes on FLAIR images by two raters, one blinded to the group. The raters selected seed points within the infarct, and a region‐growing algorithm automatically expanded the seed points within the three‐dimensional space of the image. Manual editing was implemented when automated segmentation was not possible because of incongruent infarcts or if there were unclear lines of shape distinction with voxel brightness. Borders of lesions were corrected only for infarcted tissue via manual trace editing. All lesion volumes were corrected or reviewed manually to ensure no errors were present from automatic segmentation.
2.9. Statistical analysis
The summary statistics were median and interquartile range (IQR) for NIHSS score. All other continuous variables are reported as mean ± SD. Change of NIHSS score in 1 year from baseline was evaluated by the Wilcoxon signed rank test. The correlation of rFA measurement with NIHSS score was evaluated by the Spearman correlation coefficient. We depicted stem‐leaf plots and conducted Kolmogorov‐Smirnov tests to examine normality. Based on the plots and test results, the outcome variables approximately followed normal distributions. We used the two‐sample t test to compare FA and MD measurements between the ipsilesional and contralesional sides. The longitudinal data on treated vs nontreated DTI were analyzed by the mixed model. 42 The fixed effects of the mixed model included treatment (yes, no), polychotomous time (1, 3, and 12 months), and interaction between treatment and polychotomous time. The patients were included as random effect to accommodate correlation among repeated measurements over time. Two‐sided P values were reported, and values of P < .05 were considered as significant. All statistical analyses were performed using SAS software (version 9.4, the SAS Institute, Cary, North Carolina).
3. RESULTS
3.1. Demographics and clinical information
Imaging data from a total of 37 patients with stroke (106 scans) were used in this analysis. The nontreated control group consisted of 20 participants (11 male, 9 female) with an average age of 54.8 ± 10.0 years and median baseline NIHSS score of 7. The treated group consisted of 17 participants (11 female, 6 male) with an average age of 60.4 ± 14.4 years and median baseline NIHSS score of 11. Only one patient of the treated group underwent endovascular thrombectomy. The overall lesion volume, vascular occlusion territory, lesion laterality, and tPA treatment are summarized in Table 1.
TABLE 1.
A summary of demographic and clinical assessments of treated and nontreated patients with ischemic stroke
| Characteristic | Treated | Nontreated | P value |
|---|---|---|---|
| No. of patients enrolled, n | 25 | 20 | |
| Total no. of patients with MRI, n (%) | 21 (84) | 20 (100) | |
| Total no. of patients with adequate DTI imaging, n (%) | 17 (68) | 20 (100) | |
| Total no. of patients completed all imaging time point, n (%) | 13 (52) | 19 (95) | |
| Gender, n (%) | |||
| Male | 6 (35) | 11 (55) | .24 |
| Female | 11 (65) | 9 (45) | .24 |
| Age (y), mean ± SD | 60.4 ± 14.4 | 54.8 ± 10.0 | .19 |
| Male | 59.8 ± 10.3 | 59.3 ± 7.6 | .93 |
| Female | 60.66 ± 16.6 | 49.3 ± 9.67 | .08 |
| Stroke laterality, n (%) | |||
| Left | 8 (47) | 12 (60) | .45 |
| Right | 8 (47) | 6 (30) | .45 |
| Pons a | 1 (6) | 2 (10) | |
| Vascular territory, % | |||
| MCA | 95 | 60 | |
| MCA + PCA | 0 | 25 | |
| MCA + ACA | 0 | 5 | |
| Pontine | 5 | 10 | |
| tPA treatment | 64 | 45 | |
| Lesion volume, mean ± SD (min‐max range), cc at 1 mo. | 64.7 ± 40.3 (7.78‐176.4) | 26.4 ± 27.3 (0.37‐87.1) | .003 |
| 3 months | 56.6 ± 54.1 (5.62‐231.2) | 19.2 ± 18.2 (0.34‐61.9) | .014 |
| 12 months | 57.3 ± 47.5 (5.42‐201.0) | 19.8 ± 21.1 (0.08‐66.8) | .037 |
| Baseline NIHSS score, median (IQR) | 11 (10‐14) | 7 (5‐14) | .079 |
Abbreviations: ACA, anterior cerebral artery; DTI, diffusion tensor imaging; IQR, interquartile range; MCA, middle cerebral artery; MRI, magnetic resonance imaging; NIHSS, NIH Stroke Scale; PCA, posterior cerebral artery; tPA, tissue plasminogen activator.
Laterality is defined based on the majority of lesion extension.
3.2. Clinical and radiological assessment
The radiological assessment showed 52.9% (n = 9) of the treated and 40% (n = 8) of the nontreated group had retrograde axonal degeneration at different time intervals over 1 year with distinct atrophy in the ipsilesional cerebral peduncles. All patients with infarcts involving the CST were subsequently found to have WD; however, two patients in the nontreated group did not have an infarct initially involving the CST but later showed WD. The individual patient's demographics and radiological findings are summarized in Table 2.
TABLE 2.
Individual patient radiological assessment
| Folder ID | Age/gender | Risk factor | Stroke side | Vascular territory | NIHSS score at onset | tPA Y/N | Lesion location | CST involved Y/N | AD Y/N |
|---|---|---|---|---|---|---|---|---|---|
| Treated | |||||||||
| P_01 | 61/M | HLD, CVA | L | MCA | 14 | N | Frontal lobe | Y | Y |
| P_02 | 31/F | MVP | R | MCA | 12 | Y | Frontal lobe and insula | Y | Y |
| P_03 | 52/M | No known risk | R | MCA | 16 | Y | Frontal, temporal lobes and insula | Y | Y |
| P_04 | 78/M | CVA | L | MCA | 8 | N | Frontal lobe and insula | N | N |
| P_05 | 55/F | Afib | R | MCA | 15 | Y | Frontal, temporal lobes and insula | Y | Y |
| P_06 | 35/F | No known risk | R | MCA | 14 | Y | Frontal lobe and insula | Y | Y |
| P_07 | 75/F | HTN | R | MCA | 15 | Y | Frontal, temporal lobes and insula | Y | Y |
| P_08 | 50/M | Heavy smoker | R | MCA | 9 | N | Frontal lobe and insula | N | N |
| P_09 | 46/F | HTN, CVA | L | MCA | 15 | N | Corona radiata | Y | Y |
| P_10 | 78/F | HTN | L | MCA | 16 | Y | Frontal, temporal lobes and insula | N | N |
| P_11 | 66/F | HTN, HLD, TIA | R | MCA | 10 | N | Corona radiata | N | N |
| P_12 | 77/F | DM, HTN, Afib | L | MCA | 9 | Y | Parietal, temporal, and occipital lobes | N | N |
| P_13 | 69/F | CAD, HTN, Afib | L | Basilar | 7 | Y | Pons extended to cerebral peduncle | N | N |
| P_14 | 70/F | HTN, DM, | R | MCA | 15 | Y | Frontal, temporal lobes and insula | Y | Y |
| P_15 | 66/F | HTN, HLD | L | MCA | 15 | N | Frontal, temporal lobes and insula | Y | Y |
| P_16 | 53/M | DM, HTN | R | MCA/PCA | 11 | Y | Occipital and temporal lobes | N | N |
| P_17 | 65/M | DM, HTN | L | MCA | 17 | Y | Frontal, parietal, and occipital lobes | N | N |
| Nontreated | |||||||||
| P_01 | 53/M | HTN, TIA | L | ACA | 5 | N | Subventricular zone | N | N |
| P_02 | 67/M | CVA, DM, HTN | L | MCA | 4 | N | Parietal and occipital lobes | Y | N |
| P_03 | 57/M | No known risk | R | MCA | 13 | Y | Temporal and parietal lobes | N | Y |
| P_04 | 59/M | MI | L | MCA | 20 | Y | Frontal and temporal lobes | N | N |
| P_05 | 76/M | HLD | L | PCA | 5 | N | Occipital lobe | N | N |
| P_06 | 51/F | HTN | R | MCA | 8 | Y | Caudate | N | N |
| P_07 | 58/M | HTN | R | PCA | 6 | Y | Occipital, temporal lobes, thalamus | N | N |
| P_08 | 35/F | Preeclampsia | L | PCA | 7 | Y | Temporal, occipital lobes, thalamus | N | N |
| P_09 | 34/F | DM | L | MCA | 27 | Y | Temporal and parietal lobes | Y | Y |
| P_10 | 59/F | HLD | R/Pons | Basilar | 3 | Y | Pons extended to cerebral peduncle | N | Y |
| P_11 | 62/F | No known risk | R | PCA | 2 | N | Occipital lobe | N | N |
| P_12 | 42/F | No known risk | R | MCA | 14 | Y | Basal ganglia | Y | Y |
| P_13 | 49/F | Smoker | L | MCA | 20 | N | Insula, basal ganglia | Y | Y |
| P_14 | 59/M | CAD | L | MCA | 20 | N | Operculum and caudate | Y | Y |
| P_15 | 60/M | DM, HLD, HTN | R/Pons | Basilar | 1 | N | Pons extended cerebral peduncle | N | N |
| P_16 | 53/F | CAD, CVA, HTN, DM | L | MCA | 7 | N | External capsule | Y | Y |
| P_17 | 46/M | Aneurysm, DM | L | MCA | 3 | Y | Putamen | Y | Y |
| P_18 | 59/F | DM, HLD, HTN | R | PCA | 11 | N | Temporal lobe | N | N |
| P_19 | 57/M | No known risk | L | MCA | 5 | N | Left aspect of the medulla compatible | N | N |
| P_20 | 61/M | HTN, MI, Afib | L | MCA | 6 | N | Frontal parietal lobes, pre‐ and postcentral gyri | N | N |
Abbreviations: ACA, anterior cerebral artery; AD, axonal degeneration; Afib, arterial fibrillation; CAD, coronary artery disease; CST, corticospinal tract; CVA, cerebrovascular accident; DM, diabetes mellitus; F, female; HLD, hyperlipidemia; HTN, hypertension; L, left; M, male; MCA, middle cerebral artery; MI, myocardial infarction; N, no; NIHSS, NIH Stroke Scale; PCA, posterior cerebral artery; R, right; TIA, transient ischemic stroke; tPA, tissue plasminogen activator; Y, yes.
The inter‐rater reliability (IRR) measuring lesion volume was 87%. There was a statistically significant (P < .05) difference in lesion volume between the two groups at all three time points. The average lesion volume of the nontreated group decreased from 26.4 ± 27.3 to 19.8 ± 21.1 mL (P = .40) over 1 year whereas in the treated group the infarct volume decreased from 64.7 ± 40.3 to 57.3 ± 50.0 mL (P = .67) over the same time period. There was no significant difference (P = .079) in the NIHSS score obtained in the acute phase between the two groups. The median NIHSS score of the nontreated group was significantly (P < .05) decreased from 7 (IQR = 5‐14) to 1 (IQR = 0‐2) over 1 year. The median NIHSS score of the treated group was also significantly (P < .001) decreased from 11 (IQR = 10‐14) to 3 (IQR = 2‐5) over 12 months.
3.3. DTI results: ROI analysis results
3.3.1. Nontreated group
Hand‐drawn regions of interest in the ipsilesional and contralesional RP, posterior limb of internal capsule, and CR are shown in Figure 1A‐C. This color‐coded map represents water diffusion along with the superior‐inferior (blue), anterior‐posterior (green), and left‐right (red) fiber orientations. The IRR measuring FA and MD between the raters was 89%.
FIGURE 1.
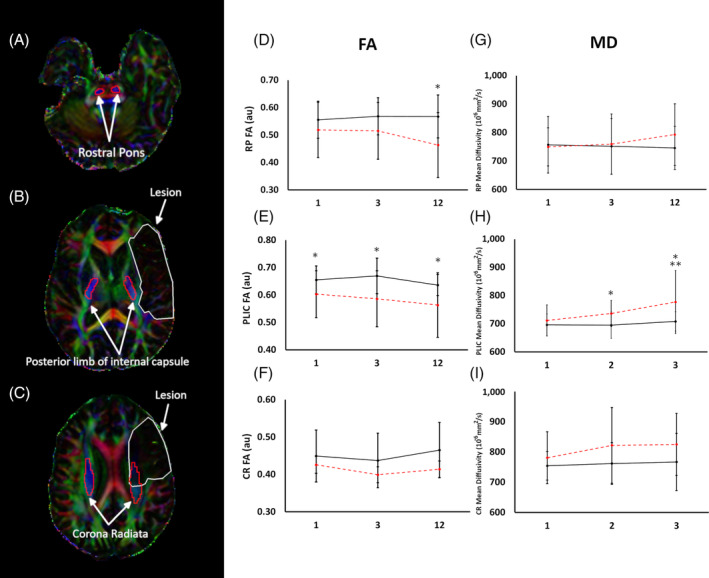
A typical region of interest on a diffusion tensor color‐coded map used to compute FA and MD and absolute temporal FA and MD changes in nontreated patients over 1 year. A‐C, The ipsilesional and contralesional region of interest in the rostral pons (A), posterior limb of internal capsule (B), and corona radiata (C), respectively. D‐I, FA and MD changes in the nontreated group over 1 year. The ipsilesional FA in the RP was significantly (P < .05) decreased at 3 and 12 months compared with the contralesional as shown in (D), whereas MD was increased (P = .12) at 12 months as illustrated in (G). Compared with the contralesional, the ipsilesional FA in the PLIC was significantly (P < .05) reduced as shown in (E) at all imaging time points, whereas MD was significantly increased at 3 and 12 months as shown in (H). The FA and MD in the corona radiata exhibited no significant difference between ipsilesional and contralesional measurements throughout the study as shown in (F) and (I). *P < .05 ipsilesional vs contralesional; **P < .05 ipsilesional temporal. Error bar indicates SD. au, arbitrary units; CR, corona radiata; FA, fractional anisotropy; MD, mean diffusivity; PLIC, posterior limb of the internal capsule; RP, rostral pons
Ipsilesional and contralesional FA measurements
The ipsilesional FA in the RP, posterior limb of internal capsule, and CR was lower than the contralesional side in line with previous reports. 36 , 43 In the RP at 1 month, there was no significant difference in FA between ipsilesional and contralesional (ipsilesional, 0.52 ± 0.1; contralesional, 0.56 ± 0.1; P = .33); however, between 3 and 12 months this difference became statistically significant (P < .001). This is predominantly due to a continual decline of FA in the ipsilesional RP (0.52 ± 0.1 to 0.46 ± 0.12) and a minimal change in the contralesional (0.56 ± 0.07 to 0.57 ± 0.08). The ipsilesional FA in the PLIC remained significantly (P < .05) lower at all three time points compared with the contralesional. Unlike RP, over time there was no statistically significant change of FA in either ipsilesional (1M = 0.60 ± 0.09 to 12M = 0.56 ± 0.12) or contralesional (1M = 0.49 ± 0.08 to 12M = 0.50 ± 0.07) PLIC. There was no significant difference between ipsilesional and contralesional FA in the CR throughout the study.
Ipsilesional and contralesional MD measurements
There was no significant difference between ipsilesional and contralesional MD in the RP over a year. Temporally, the ipsilesional MD in the RP increased 749.6 ± 67 (1M) to 793 ± 108 (12M) × 10−6 mm2/s but failed to reach statistical significance (P = .11). Temporally, the ipsilesional MD in the PLIC increased from 711.2 ± 55.1 to 776.7 ± 111.4 × 10⁻⁶ mm2/s, (P < .05) compared with the contralesional PLIC (695.9 ± 38.8 to 708.4 ± 34.1 × 10⁻⁶ mm2/s, P = .18) between 1 and 12 months. The MD in the CR also exhibited no significant difference between ipsilesional and contralesional measurements throughout the study. The ipsilesional and contralesional FA and MD changes in the nontreated group are summarized in Figure 1.
3.3.2. Treated group
Ipsilesional and contralesional FA measurements
The ipsilesional FA was significantly (P < .05) reduced in all three regions at all the time points compared with the contralesional locations. Temporally, both the ipsilesional and contralesional FA in the RP exhibited no significant change. In the PLIC, the FA decreased between 1 and 3 months (0.45 ± 0.9 to 0.37 ± 0.10, P = .05) but then increased to 0.43 ± 0.13 (P = .30) at 12 months with no change in the contralesional PLIC. Similar to the nontreated cohort, there was no significant temporal change in both the ipsilesional and contralesional FA in the CR.
Ipsilesional and contralesional MD measurements
Both the ipsilesional and contralesional MD in the RP and PLIC remained unchanged. The ipsilesional MD in the CR increased from 889 ± 131 to 945 ± 194 × 10−6 mm2/s between the last two time points but failed to reach statistical significance (P = .44). The ipsilesional and contralesional FA and MD changes in the treated group are summarized in Figure 2.
FIGURE 2.

Temporal absolute FA and MD changes in treated patients over 1 year. Compared with the contralesional, the ipsilesional FA was significantly (P < .05) reduced in RP (A), PLIC (B), and CR (C) at all time points. Significant (P < .05) increased in MD in the RP (D), PLIC (E), and CR (F). *P < .05 ipsilesional vs contralesional; **P < .05 ipsilesional temporal. Error bar indicates SD. au, arbitrary units; Contra, contralesional; CR, corona radiata; FA, fractional anisotropy; Ipsi, ipsilesional; MD, mean diffusivity; PLIC, posterior limb of the internal capsule; RP, rostral pons
3.3.3. Treated vs nontreated group
Given that both groups exhibited minimal FA and MD changes in the contralesional measurements, we report the rFA and rMD to compare the two groups of patients. The ipsilesional rFA in the RP of the nontreated group was significantly (P < .05) higher than the treated patients at 1 and 3 months; however, between 3 and 12 months, the two groups showed opposite change. The rFA in the nontreated group decreased (0.92 ± 0.20 to 0.84 ± 0.16, P = .13), whereas it increased (0.69 ± 0.16 to 0.76 ± 0.13, P = .28) in the treated group. There was no statistically significant (P = .23) difference in the rFA of the RP between the treated and nontreated groups at 12 months. The rMD in the RP of the nontreated group was significantly (P < .05) lower than the treated group at the first two follow‐ups; however, at 12 months, the nontreated group displayed an increase in rMD (1.04 ± 0.14 to 1.64 ± 0.12, P < .05) between the last two visits. However, there was no significant temporal change of the rMD in the treated group.
The rFA in the PLIC of the nontreated group was significantly (P < .001) higher compared with the treated group throughout the study. Temporally, the nontreated patients displayed a slight decrease in rFA (0.98 ± 0.13 to 0.86 ± 0.17, P = .44) between the first two follow‐ups, then stabilized, whereas the rFA of the treated group decreased from 0.74 ± 0.15 to 0.63 ± 0.23 (P = .08) between the first two visits then increased back to 0.69 ± 0.22 (P = .39) between 3 and 12 months. The rMD in the PLIC of the nontreated group was significantly (P < .05) lower at 1‐ and 3‐month visits compared with the treated group, but temporally it exhibited an increasing trend (1.02 ± 0.08 to 1.09 ± 0.1, P = .15), whereas it remained unchanged in the treated group. At the last visit, there was no significant (P = .06) difference in rMD of the PLIC between the two groups.
Temporally, the nontreated group illustrated a decline in rFA (0.94 ± 0.18 to 0.88 ± 0.13, P = .24) in the CR between the first and last visit whereas the treated group displayed no change in rFA. The nontreated group had significantly (P < .05) lower rMD compared with the treated group. Temporally, there was no significant change in rMD in either group. Both rFA and rMD changes in the three regions of CST using native space ROI are summarized in Figure 3.
FIGURE 3.

Summarizes temporal rFA and rMD changes in the three regions of the corticospinal tract using region of interest analysis between treated and nontreated patients. A‐C, Temporal rFA changes between the treated and nontreated groups in the RP (A), PLIC (B), and CR (C). RP of the treated group rFA was significantly (P < .05) reduced at 1 and 3 months, but slightly regained at 12 months whereas the nontreated group showed significant (P < .05) temporal decline between 1 and 12 months. The rFA in the PLIC remains significantly (P < .05) lower in the treated group compared with the nontreated group. Temporally, the rFA in the CR of the treated group remains unchanged with no significant difference between two groups. D‐F, Temporal rMD changes between the treated and nontreated groups in the RP (D), PLIC (E), and CR (F). In the RP of the treated group, rMD was significantly (P < .05) increased at 1 and 3 months, whereas the nontreated group showed a significant (P < .05) temporal increase between 1 and 12 months. The rMD in the PLIC was significantly (P < .05) higher in the treated group at 1 and 3 months with no significant difference at 12 months. Temporally, rMD in the PLIC remains unchanged in each group. The rMD in the CR remains significantly (P < .05) higher in the treated group with no significant temporal changes in either group. *P < .05 treated vs nontreated; **P < .05 temporal nontreated. Error bar indicates SD. au, arbitrary units; CR, corona radiata; FA, fractional anisotropy; MD, mean diffusivity; PLIC, posterior limb of the internal capsule; rFA, relative fractional anisotropy; rMD, relative mean diffusity; RP, rostral pons
3.4. Association of neuroimaging markers with clinical scores
The rFA and NIHSS score of the treated group in the RP and PLIC exhibited a significant (P < .05) negative correlation with the correlation coefficient of −0.73, −0.56, −0.61 (RP) and −0.62, −0.59, −0.61 (PLIC) at 1 month, 3 months, and 12 months, respectively, whereas no significant correlation was found in the nontreated group. In the CR regions, only the nontreated group showed a significant negative correlation at 12 months. There was a significant (P < .05) positive correlation between rMD and NIHSS score in the RP regions of the treated group at 3 and 12 months with correlation coefficient of 0.65 and 0.69, respectively, whereas no significant correlation was found in the nontreated group. In the PLIC, the nontreated group showed a significant positive correlation with the correlation coefficient of 0.58 and 0.67 at 3 and 12 months, respectively, whereas 0.65 in the treated group only at 12 months. In the CR, only the treated group reported significant correlation at 12 months with a correlation coefficient of 0.60. Correlation coefficients at different time points are shown in Figure 4.
FIGURE 4.

Summarized temporal correlation efficient changes between clinical scores, rFA, and rMD measurement in the treated and nontreated groups. (A‐C) and (D‐F) illustrate temporal correlation between the National Institute of Health Stroke Scale, rFA, and rMD in the RP, PLIC, CR, and corticospinal tract, respectively. Error bar indicates 95% confidence interval. CR, corona radiata; PLIC, posterior limb of the internal capsule; rFA, relative fractional anisotropy; rMD, relative mean diffusity; RP, rostral pons
4. DISCUSSION
In the present study, we investigated microstructural axonal fiber changes of the CST in patients treated with mononuclear bone marrow cell therapies and compared the results with a prospectively collected cohort of patients with stroke who received standard of care but were not treated with cell therapies. The CST, a prominent white matter communication pathway between the brain and limbs, has been extensively studied following stroke, 44 , 45 , 46 , 47 , 48 because hemiparesis is the most common impairment in stroke survivors. FA is an indicator of white matter integrity, and a reduction of FA indicates axonal damage. The degree of anisotropy depends on fiber orientation, axonal spacing and coherence, diameter, and myelination, which makes FA highly sensitive to microstructural changes. Previous DTI studies show serial reductions in the ipsilesional FA in the RP within 30 days of onset with continued reductions up to 3 months, followed by stabilization between 3 and 12 months. 36 , 43 We are not aware of longitudinal studies that show ipsilesional FA recovery in the pons at later time points after stroke. Our results are in agreement with previously published studies and show significantly decreased FA in the ipsilesional RP in nontreated patients. In fact, we observed a continued decline in FA up to 1 year after stroke, and a very similar pattern was observed in the CR. In parallel, we also observed a sustained MD increase over a year in the CST in the pons and PLIC of the nontreated patients. The MD measures the average distance a water molecule travels within a given time, and an increase in MD indicates axonal degeneration.
In the treated group, however, we observed a very different pattern of longitudinal changes in the FA. Although the FA decreased, as expected, at 3 months after stroke, the FA then increased back to the levels observed at 1 month. Temporally, MD in the treated population exhibits no significant change. These results suggest the possibility of microstructural stabilization as compared with the nontreated patients.
Despite a significantly higher stroke severity, larger lesion volume, and higher proportion of patients with infarcts involving the CST in the treated group, we still saw in the treated group longitudinal changes suggesting a return, at least partially, of axonal integrity in the RP and CR. In these regions, the rFA temporally increased and stabilized compared with the nontreated group with lower stroke severity and a smaller lesion volume. We, therefore, speculate that BM‐MNC treatment leads to an increase in axonal fiber cohesiveness or attenuates degeneration of the CST. Our study also shows that neither group showed significant reduction in lesion volume, suggesting that cell therapy does not replace damaged brain tissue but, as suggested in the literature, releases biological factors that either enhance an endogenous protective mechanism from further degeneration and/or actively enhance repair mechanisms. Our interpretation of the data is further supported by minimal rMD changes in the treated group in all three regions examined, compared with serial increases in rMD in the nontreated group.
Another possible interpretation of temporal change of rFA in the RP could be due to the presence of neuroinflammation that disrupted axonal coherence causing a reduction in rFA. The intravenous administration of BM‐MNCs is known to reduce different component of the inflammatory response to stroke, 22 , 49 , 50 , 51 which could then result in a regain of rFA in the RP because microglial activation has been detected along the pyramidal tract in the brainstem 51 months after IS in patients.
Last, the strong correlation in the RP and PLIC between rFA, rMD, and clinical scores supports the hypothesis that DTI as a measure of microstructural changes could be used as a noninvasive tool to monitor treatment effects of cell‐based therapies on axonal degeneration. We plan to include DTI to further develop useful imaging markers in randomized clinical trials of cell therapies for stroke. At the very least, we believe that prospective studies are warranted to better understand the relationships of longitudinal microstructural changes to the CST and motor outcomes over time after stroke. In addition, the recent STEPS 4 guidelines 52 emphasize the need for potency assays and targeted preclinical efficacy studies of cell‐based therapies. We envision that preclinical stroke studies might be directed toward identifying white matter protection or repair as an important mechanistic target of efficacy studies and potency assays for bone marrow cell therapies.
4.1. Study limitation
Among the limitations, this study was not randomized and had a significant difference in stroke severity, lesion size, and location between the two groups, which will be addressed in future studies. A larger study cohort is required to substantiate our findings. Last, the ROI‐based methodology is limited to small tissue area with partial volume contamination. We also acknowledge that changes in management over the time course of recruitment that could have affected outcome differently in the two groups, such as tPA and thrombectomy.
5. CONCLUSION
After IS, patients in our study showed ongoing microstructural injury and axonal degeneration in the CST up to 1 year. In contrast, patients treated with autologous bone marrow mononuclear cells had microstructural injury in the CST by 3 months after stroke but then showed improvement in white matter injury at 1 year. Further studies are needed in randomized clinical trials to test the hypothesis that bone marrow cell therapies promote white matter repair.
CONFLICT OF INTEREST
C.S.C. does not have any conflict of interest related directly to this work but has conducted sponsored research with Athersys, Inc., Hope Bio., NIH, and MTEC and has served as member of the scientific advisory board with Cellvation, Inc., Cord Blood Registry, and Biostage, Inc. J.C.G. does not have any conflict of interest related directly to this work but has conducted sponsored research with NIH, Genentech, Inc., and CSL Behring. He also served as member of the advisory board with Haemonetics, Inc., Acticor, Inc., and Prolong, Inc. and consulted with Frazer Ltd. S.I.S. has served in the following roles as an employee of University of Texas Health (UTHealth): as a site investigator in clinical trials sponsored by industry companies Athersys, ReNeuron, and San Bio, for which UTHealth receives payments on the basis of clinical trial contracts; as an investigator on clinical trials supported by NIH grants, Department of Defense, Let us Cure CP, the TIRR Foundation, and the Cord Blood Registry Systems; as a principal investigator on NIH‐funded grants in basic science research; and as principal investigator for an imaging analysis center for clinical trials sponsored by SanBio and ReNeuron. In his capacity as a UTHealth employee with expertise in stroke, S.I.S. has served as a consultant to ReNeuron, Lumosa, Deck Therapeutics, KM Pharma, Neurexcell, Abbvie, and ArunA with all funding going to UTHealth. The other authors declared no potential conflicts of interest.
AUTHOR CONTRIBUTIONS
M.E.H.: conception/design, data analysis and interpretation, manuscript writing; K.M.H., S.B., X.Z.: data analysis and interpretation; S.G.: provision of study material or patients; C.S., O.D.A.: data analysis and interpretation, radiological assessment; F.V.: cell transplantation management; C.S.C.: extraction of bone marrow; S.A.: cell isolation and transplantation; J.A.: manuscript writing; J.C.G.: neurological assessment; S.I.S.: conception/design, financial support, data analysis and interpretation, manuscript writing, final approval of the manuscript.
ACKNOWLEDGMENTS
This work was supported by the National Institutes of Health National Institute of Neurological Disorders and Stroke. The authors thank Dr Mallikarjunarao Kasam for his initial imaging protocol setup and Vipulkumar Patel for help with magnetic resonance imaging experiments. This work was supported by NIH grants R21 HD060978 and NHLBI N01‐HB037163.
Haque ME, Hasan KM, George S, et al. Longitudinal neuroimaging evaluation of the corticospinal tract in patients with stroke treated with autologous bone marrow cells. STEM CELLS Transl Med. 2021;10:943–955. 10.1002/sctm.20-0369
Authored by a member of CBA.
Funding information NHLBI, Grant/Award Number: N01‐HB037163; NIH, Grant/Award Number: R21 HD060978
DATA AVAILABILITY STATEMENT
The data sets generated in this study are available from the corresponding author on reasonable request.
REFERENCES
- 1. Baker EW, Platt SR, Lau VW, et al. Induced pluripotent stem cell‐derived neural stem cell therapy enhances recovery in an ischemic stroke pig model. Sci Rep. 2017;7:10075. [DOI] [PMC free article] [PubMed] [Google Scholar]
- 2. Boltze J, Lukomska B, Jolkkonen J, consortium MI. Mesenchymal stromal cells in stroke: improvement of motor recovery or functional compensation? J Cereb Blood Flow Metab. 2014;34:1420‐1421. [DOI] [PMC free article] [PubMed] [Google Scholar]
- 3. Dabrowski A, Robinson TJ, Felling RJ. Promoting brain repair and regeneration after stroke: a plea for cell‐based therapies. Curr Neurol Neurosci Rep. 2019;19:5. [DOI] [PMC free article] [PubMed] [Google Scholar]
- 4. Horie N, Hiu T, Nagata I. Stem cell transplantation enhances endogenous brain repair after experimental stroke. Neurol Med Chir. 2015;55(suppl 1):107‐112. [PubMed] [Google Scholar]
- 5. Pirzad Jahromi G, Shabanzadeh Pirsaraei A, Sadr SS, et al. Multipotent bone marrow stromal cell therapy promotes endogenous cell proliferation following ischemic stroke. Clin Exp Pharmacol Physiol. 2015;42:1158‐1167. [DOI] [PubMed] [Google Scholar]
- 6. Yang B, Li W, Satani N, et al. Protective effects of autologous bone marrow mononuclear cells after administering t‐PA in an embolic stroke model. Transl Stroke Res. 2018;9:135‐145. [DOI] [PubMed] [Google Scholar]
- 7. Mandeville ET, Ayata C, Zheng Y, Mandeville JB. Translational MR neuroimaging of stroke and recovery. Transl Stroke Res. 2017;8:22‐32. [DOI] [PMC free article] [PubMed] [Google Scholar]
- 8. Bhasin A, Srivastava MV, Mohanty S, et al. Stem cell therapy: a clinical trial of stroke. Clin Neurol Neurosurg. 2013;115:1003‐1008. [DOI] [PubMed] [Google Scholar]
- 9. Boshuizen MCS, Steinberg GK. Stem cell‐based immunomodulation after stroke: effects on brain repair processes. Stroke. 2018;49:1563‐1570. [DOI] [PMC free article] [PubMed] [Google Scholar]
- 10. Honmou O, Houkin K, Matsunaga T, et al. Intravenous administration of auto serum‐expanded autologous mesenchymal stem cells in stroke. Brain. 2011;134:1790‐1807. [DOI] [PMC free article] [PubMed] [Google Scholar]
- 11. Levy ML, Crawford JR, Dib N, Verkh L, Tankovich N, Cramer SC. Phase I/II study of safety and preliminary efficacy of intravenous allogeneic mesenchymal stem cells in chronic stroke. Stroke. 2019;50:2835‐2841. [DOI] [PubMed] [Google Scholar]
- 12. Savitz SI, Yavagal D, Rappard G, et al. A phase 2 randomized, sham‐controlled trial of internal carotid artery infusion of autologous bone marrow‐derived ALD‐401 cells in patients with recent stable ischemic stroke (RECOVER‐stroke). Circulation. 2019;139:192‐205. [DOI] [PubMed] [Google Scholar]
- 13. Steinberg GK, Kondziolka D, Wechsler LR, et al. Two‐year safety and clinical outcomes in chronic ischemic stroke patients after implantation of modified bone marrow‐derived mesenchymal stem cells (SB623): a phase 1/2a study. J Neurosurg. 2018;23:1‐11. [Epub ahead of print]. [DOI] [PubMed] [Google Scholar]
- 14. Kokaia Z, Darsalia V. Neural stem cell‐based therapy for ischemic stroke. Transl Stroke Res. 2011;2:272‐278. [DOI] [PubMed] [Google Scholar]
- 15. Takagi T, Yoshimura S, Sakuma R, Nakano‐Doi A, Matsuyama T, Nakagomi T. Novel regenerative therapies based on regionally induced multipotent stem cells in post‐stroke brains: their origin, characterization, and perspective. Transl Stroke Res. 2017;8:515‐528. [DOI] [PubMed] [Google Scholar]
- 16. Nahhas MI, Hess DC. Stem cell therapy in cerebrovascular disease. Curr Treat Options Neurol. 2018;20:49. [DOI] [PubMed] [Google Scholar]
- 17. Sammali E, Alia C, Vegliante G, et al. Intravenous infusion of human bone marrow mesenchymal stromal cells promotes functional recovery and neuroplasticity after ischemic stroke in mice. Sci Rep. 2017;7:6962. [DOI] [PMC free article] [PubMed] [Google Scholar]
- 18. Shehadah A, Chen J, Pal A, et al. Human placenta‐derived adherent cell treatment of experimental stroke promotes functional recovery after stroke in young adult and older rats. PLoS One. 2014;9:e86621. [DOI] [PMC free article] [PubMed] [Google Scholar]
- 19. Shichinohe H, Ishihara T, Takahashi K, et al. Bone marrow stromal cells rescue ischemic brain by trophic effects and phenotypic change toward neural cells. Neurorehabil Neural Repair. 2015;29:80‐89. [DOI] [PubMed] [Google Scholar]
- 20. Sorensen AG, Wu O, Copen WA, et al. Human acute cerebral ischemia: detection of changes in water diffusion anisotropy by using MR imaging. Radiology. 1999;212:785‐792. [DOI] [PubMed] [Google Scholar]
- 21. Rodriguez‐Frutos B, Otero‐Ortega L, Gutierrez‐Fernandez M, et al. Stem cell therapy and administration routes after stroke. Transl Stroke Res. 2016;7:378‐387. [DOI] [PubMed] [Google Scholar]
- 22. Horie N, Pereira MP, Niizuma K, et al. Transplanted stem cell‐secreted vascular endothelial growth factor effects poststroke recovery, inflammation, and vascular repair. Stem Cells. 2011;29:274‐285. [DOI] [PMC free article] [PubMed] [Google Scholar]
- 23. Andres RH, Horie N, Slikker W, et al. Human neural stem cells enhance structural plasticity and axonal transport in the ischaemic brain. Brain. 2011;134:1777‐1789. [DOI] [PMC free article] [PubMed] [Google Scholar]
- 24. Napoli E, Borlongan CV. Recent advances in stem cell‐based therapeutics for stroke. Transl Stroke Res. 2016;7:452‐457. [DOI] [PMC free article] [PubMed] [Google Scholar]
- 25. Nam HS, Kwon I, Lee BH, et al. Effects of mesenchymal stem cell treatment on the expression of matrix metalloproteinases and angiogenesis during ischemic stroke recovery. PLoS One. 2015;10:e0144218. [DOI] [PMC free article] [PubMed] [Google Scholar]
- 26. Hsieh JY, Wang HW, Chang SJ, et al. Mesenchymal stem cells from human umbilical cord express preferentially secreted factors related to neuroprotection, neurogenesis, and angiogenesis. PLoS One. 2013;8:e72604. [DOI] [PMC free article] [PubMed] [Google Scholar]
- 27. Carpenter KLH, Major S, Tallman C, et al. White matter tract changes associated with clinical improvement in an open‐label trial assessing autologous umbilical cord blood for treatment of young children with autism. Stem Cells Translational Medicine. 2019;8:138‐147. [DOI] [PMC free article] [PubMed] [Google Scholar]
- 28. Sasaki M, Radtke C, Tan AM, et al. BDNF‐hypersecreting human mesenchymal stem cells promote functional recovery, axonal sprouting, and protection of corticospinal neurons after spinal cord injury. J Neurosci. 2009;29:14932‐14941. [DOI] [PMC free article] [PubMed] [Google Scholar]
- 29. Benjamin EJ, Blaha MJ, Chiuve SE, et al. Heart disease and stroke statistics‐2017 update: a report from the American Heart Association. Circulation. 2017;135:e146‐e603. [DOI] [PMC free article] [PubMed] [Google Scholar]
- 30. Basser PJ, Pierpaoli C. A simplified method to measure the diffusion tensor from seven MR images. Magn Reson Med. 1998;39:928‐934. [DOI] [PubMed] [Google Scholar]
- 31. Hasan KM, Walimuni IS, Abid H, et al. Multimodal quantitative magnetic resonance imaging of thalamic development and aging across the human lifespan: implications to neurodegeneration in multiple sclerosis. J Neurosci. 2011;31:16826‐16832. [DOI] [PMC free article] [PubMed] [Google Scholar]
- 32. Lindenberg R, Zhu LL, Ruber T, et al. Predicting functional motor potential in chronic stroke patients using diffusion tensor imaging. Hum Brain Mapp. 2012;33:1040‐1051. [DOI] [PMC free article] [PubMed] [Google Scholar]
- 33. Pierpaoli C, Barnett A, Pajevic S, et al. Water diffusion changes in Wallerian degeneration and their dependence on white matter architecture. Neuroimage. 2001;13:1174‐1185. [DOI] [PubMed] [Google Scholar]
- 34. Puig J, Pedraza S, Blasco G, et al. Wallerian degeneration in the corticospinal tract evaluated by diffusion tensor imaging correlates with motor deficit 30 days after middle cerebral artery ischemic stroke. AJNR Am J Neuroradiol. 2010;31:1324‐1330. [DOI] [PMC free article] [PubMed] [Google Scholar]
- 35. Radlinska B, Ghinani S, Leppert IR, Minuk J, Pike GB, Thiel A. Diffusion tensor imaging, permanent pyramidal tract damage, and outcome in subcortical stroke. Neurology. 2010;75:1048‐1054. [DOI] [PMC free article] [PubMed] [Google Scholar]
- 36. Yu C, Zhu C, Zhang Y, et al. A longitudinal diffusion tensor imaging study on Wallerian degeneration of corticospinal tract after motor pathway stroke. Neuroimage. 2009;47:451‐458. [DOI] [PubMed] [Google Scholar]
- 37. Dijkhuizen RM, van der Marel K, Otte WM, et al. Functional MRI and diffusion tensor imaging of brain reorganization after experimental stroke. Transl Stroke Res. 2012;3:36‐43. [DOI] [PMC free article] [PubMed] [Google Scholar]
- 38. Vahidy FS, Haque ME, Rahbar MH, et al. Intravenous bone marrow mononuclear cells for acute ischemic stroke: safety, feasibility, and effect size from a phase I clinical trial. Stem Cells. 2019;37:1481‐1491. [DOI] [PubMed] [Google Scholar]
- 39. Savitz SI, Misra V, Kasam M, et al. Intravenous autologous bone marrow mononuclear cells for ischemic stroke. Ann Neurol. 2011;70:59‐69. [DOI] [PubMed] [Google Scholar]
- 40. Brott T, Adams HP Jr, Olinger CP, et al. Measurements of acute cerebral infarction: a clinical examination scale. Stroke. 1989;20:864‐870. [DOI] [PubMed] [Google Scholar]
- 41. Hasan KM, Narayana PA. Computation of the fractional anisotropy and mean diffusivity maps without tensor decoding and diagonalization: theoretical analysis and validation. Magn Reson Med. 2003;50:589‐598. [DOI] [PubMed] [Google Scholar]
- 42. Littell RC, Henry PR, Ammerman CB. Statistical analysis of repeated measures data using SAS procedures. J Anim Sci. 1998;76:1216‐1231. [DOI] [PubMed] [Google Scholar]
- 43. Puig J, Blasco G, Daunis IEJ, et al. Decreased corticospinal tract fractional anisotropy predicts long‐term motor outcome after stroke. Stroke. 2013;44:2016‐2018. [DOI] [PubMed] [Google Scholar]
- 44. Vargas P, Gaudron M, Valabregue R, et al. Assessment of corticospinal tract (CST) damage in acute stroke patients: comparison of tract‐specific analysis versus segmentation of a CST template. J Magn Reson Imaging. 2013;37:836‐845. [DOI] [PubMed] [Google Scholar]
- 45. Borich MR, Mang C, Boyd LA. Both projection and commissural pathways are disrupted in individuals with chronic stroke: investigating microstructural white matter correlates of motor recovery. BMC Neurosci. 2012;13:107. [DOI] [PMC free article] [PubMed] [Google Scholar]
- 46. Rosso C, Valabregue R, Attal Y, et al. Contribution of corticospinal tract and functional connectivity in hand motor impairment after stroke. PLoS One. 2013;8:e73164. [DOI] [PMC free article] [PubMed] [Google Scholar]
- 47. Rong D, Zhang M, Ma Q, et al. Corticospinal tract change during motor recovery in patients with medulla infarct: a diffusion tensor imaging study. Biomed Res Int. 2014;2014:524096. [DOI] [PMC free article] [PubMed] [Google Scholar]
- 48. Pannek K, Chalk JB, Finnigan S, Rose SE. Dynamic corticospinal white matter connectivity changes during stroke recovery: a diffusion tensor probabilistic tractography study. J Magn Reson Imaging. 2009;29:529‐536. [DOI] [PubMed] [Google Scholar]
- 49. Stonesifer C, Corey S, Ghanekar S, Diamandis Z, Acosta SA, Borlongan CV. Stem cell therapy for abrogating stroke‐induced neuroinflammation and relevant secondary cell death mechanisms. Prog Neurobiol. 2017;158:94‐131. [DOI] [PMC free article] [PubMed] [Google Scholar]
- 50. Thiel A, Radlinska BA, Paquette C, et al. The temporal dynamics of poststroke neuroinflammation: a longitudinal diffusion tensor imaging‐guided PET study with 11C‐PK11195 in acute subcortical stroke. J Nucl Med. 2010;51:1404‐1412. [DOI] [PubMed] [Google Scholar]
- 51. Mays RW, Savitz SI. Intravenous cellular therapies for acute ischemic stroke. Stroke. 2018;49:1058‐1065. [DOI] [PubMed] [Google Scholar]
- 52. Boltze J, Modo MM, Mays RW, et al. Stem cells as an emerging paradigm in stroke 4: advancing and accelerating preclinical research. Stroke. 2019;50:3299‐3306. [DOI] [PubMed] [Google Scholar]
Associated Data
This section collects any data citations, data availability statements, or supplementary materials included in this article.
Data Availability Statement
The data sets generated in this study are available from the corresponding author on reasonable request.