

Abstract
Gaucher disease (GD) is a lysosomal storage disorder caused by mutations in GBA1, the gene that encodes lysosomal β‐glucocerebrosidase (GCase). Mild mutations in GBA1 cause type 1 non‐neuronopathic GD, whereas severe mutations cause types 2 and 3 neuronopathic GD (nGD). GCase deficiency results in the accumulation of glucosylceramide (GlcCer) and glucosylsphingosine (GlcSph). GlcSph is formed by deacylation of GlcCer by the lysosomal enzyme acid ceramidase. Brains from patients with nGD have high levels of GlcSph, a lipid believed to play an important role in nGD, but the mechanisms involved remain unclear. To identify these mechanisms, we used human induced pluripotent stem cell‐derived neurons from nGD patients. We found that elevated levels of GlcSph activate mammalian target of rapamycin (mTOR) complex 1 (mTORC1), interfering with lysosomal biogenesis and autophagy, which were restored by incubation of nGD neurons with mTOR inhibitors. We also found that inhibition of acid ceramidase prevented both, mTOR hyperactivity and lysosomal dysfunction, suggesting that these alterations were caused by GlcSph accumulation in the mutant neurons. To directly determine whether GlcSph can cause mTOR hyperactivation, we incubated wild‐type neurons with exogenous GlcSph. Remarkably, GlcSph treatment recapitulated the mTOR hyperactivation and lysosomal abnormalities in mutant neurons, which were prevented by coincubation of GlcSph with mTOR inhibitors. We conclude that elevated GlcSph activates an mTORC1‐dependent pathogenic mechanism that is responsible for the lysosomal abnormalities of nGD neurons. We also identify acid ceramidase as essential to the pathogenesis of nGD, providing a new therapeutic target for treating GBA1‐associated neurodegeneration.
Keywords: drug target, experimental models, induced pluripotent stem cells, neural differentiation, neuropathy, signal transduction, stem/progenitor cell
Proposed model of glucosylsphingosine (GlcSph)‐mediated lysosomal dysfunction in neuronopathic Gaucher disease neurons. Mutant β‐glucocerebrosidase (GCase) causes the accumulation of glucosylceramide (GlcCer), which is converted to GlcSph by acid ceramidase in the lysosome. GlcSph exits the lysosome into the cytoplasm and activates mammalian target of rapamycin (mTOR) complex 1 (mTORC1), leading to lysosomal depletion and autophagy block. Inhibitors of GlcCer synthase, acid ceramidase, and mTOR suppress mTOR hyperactivation and rescue the autophagy lysosomal pathway (ALP).

Significance statement.
Using induced pluripotent stem cell‐derived neurons from patients with neuronopathic Gaucher disease (nGD), this study describes a pathogenic mechanism by which glucosylsphingosine (GlcSph), a neurotoxic lipid that accumulates up to a 1000‐fold in nGD brains, deregulates the lysosomal compartment. Elevated GlcSph activates mammalian target of rapamycin (mTOR) complex 1 (mTORC1), interfering with normal lysosomal biogenesis and autophagy. These abnormalities were reversed by inhibition of mTOR kinase, glucosylceramide synthase, and of acid ceramidase, the enzyme responsible for the generation of GlcSph. The results of this study identify a mechanistic link between elevated GlcSph, mTOR hyperactivation, lysosomal dysfunction, and identify acid ceramidase as a new therapeutic target for nGD.
1. INTRODUCTION
Gaucher disease (GD) is an autosomal recessive disease caused by biallelic mutations in GBA1, the gene that encodes lysosomal β‐glucocerebrosidase (GCase). This enzyme hydrolyzes the glycosidic bond in glucosylceramide (GlcCer). GCase deficiency leads to the accumulation of GlcCer and that of its deacylated metabolite glucosylsphingosine (GlcSph). Mild mutations in GBA1 result in type 1 GD, where there is an accumulation of GlcCer and GlcSph in visceral organs including liver, spleen, and bone marrow. Although type 1 GD is considered non‐neuronopathic, heterozygous GBA1 mutations are the highest known risk factor for Parkinson's disease (PD). Severe mutations in GBA1 cause types 2 and 3 neuronopathic GD (nGD), where in addition to visceral organs, there is an accumulation of glucosphingolipids in the central nervous system. 1 , 2 , 3 , 4 Type 2 GD is an acute form of the disease, with early onset and rapidly progressing neuropathology resulting in death by 2 years of age, whereas type 3 GD is a chronic form of the disease, with slower disease progression. These three GD clinical subtypes are not strictly defined, as there is a continuum of clinical manifestations that depends not only on genotype, but also on genetic background, environmental, epigenetic, and other unknown factors. 5 , 6
Mutations in enzymes of sphingolipid metabolism are the cause of more than 50 lysosomal storage disorders. Most sphingolipidoses cause neurodegeneration, indicating that sphingolipid balance is essential for neuronal survival. 3 , 7 GlcSph is almost undetectable in normal tissues, but nGD brains have up to a 1000‐fold elevation in this lipid. 2 , 4 GlcSph is a deacylated derivative of GlcCer formed by the action of acid ceramidase, a lysosomal enzyme that normally hydrolyzes ceramide to sphingosine and fatty acids. 8 , 9 , 10 , 11 It has been proposed that elevated levels of GlcSph play a key role in GBA1‐associated neurodegeneration. 2 , 4 However, the mechanisms involved have not been clarified.
Lysosomal function is essential for neuronal survival, and deregulation of the autophagy lysosomal pathway (ALP) is a key pathogenic event in nGD and other neurodegenerative sphingolipidoses. 7 , 12 , 13 , 14 , 15 , 16 , 17 , 18 , 19 Lysosomes remove damaged organelles and recycle nutrients through autophagy, they clear harmful protein aggregates, and regulate energy balance. We previously showed that GCase deficiency results in lysosomal depletion 20 and reduced autophagic clearance through hyperactivation of mammalian target of rapamycin (mTOR). 21 mTOR is a Ser/Thr kinase that exists in two different complexes, mTORC1 and mTORC2. mTORC1 is a nutrient and energy sensor that regulates the balance between anabolism and catabolism, and is also a key regulator of the ALP. 21 , 22 , 23 , 24 , 25 , 26 , 27 , 28 mTORC2 regulates PI3K/Akt, glucose homeostasis, cytoskeletal rearrangement, and its abnormal activation has been linked to cancer. 28 , 29 , 30 , 31 , 32 , 33 , 34 , 35 We previously showed that mTORC1 hyperactivity in nGD neurons deregulates the ALP by phosphorylation of the transcription factor EB (TFEB), 21 which prevents TFEB translocation to the nucleus and upregulation of lysosomal and autophagy genes. 25 , 26 , 27 , 36 , 37 Because of the central role of mTOR in lysosomal homeostasis and neuronal survival, elucidating the mechanisms by which the accumulation of glucosphingolipids in nGD neurons deregulates mTOR is likely to uncover new therapeutic targets.
In this study, we employed human induced pluripotent stem cells (hiPSC) derived from patients with nGD to investigate the mechanisms by which GCase deficiency deregulates the lysosomal compartment. We report that the elevation of GlcSph in nGD neurons causes a pathogenic activation of mTORC1, leading to lysosomal dysfunction. Our results further reveal that acid ceramidase, which catalyzes the last step in the formation of GlcSph, is essential for nGD pathogenesis, thus making it an attractive therapeutic target for the treatment of GBA1‐associated neurodegeneration.
2. MATERIALS AND METHODS
2.1. iPSC lines
The hiPSC lines from patients with types 1, 2, and 3 GD (GD1, GD2, and GD3), and from control subjects (controls a and b), used in this study were previously described. 38 , 39 In addition to the two control hiPSC lines, we also used H9 human embryonic stem cells (hESCs) (WiCell Repository). The genotypes of the donor‐derived cells used in this study are: N370S/N370S (GD1), W184R/D409H (GD2a‐1 and GD2a‐2), L444P/RecNciI (GD2b‐1 and GD2b‐2), L444P/L444P (GD3a‐1 and GD3a‐2). The three WT/WT control lines are: control a: MJ 38 ; control b: DF4‐7T.A 39 ; control c: H9 hESC (WiCell Repository). These lines are listed in Table S1. The control and nGD lines used in each experiment are specified in the figure legends. hiPSC lines were grown as we described. 39
2.2. Generation of neuronal progenitor cells and neurons
Neuronal progenitor cells (NPCs) and neurons were generated from hiPSCs (Figure S1A) as we previously described. 20 , 39 Briefly, embryoid bodies (EBs) were generated by detaching hiPSCs from the plate using 0.2% dispase and transferring them to ultra‐low attachment plates (Costar). The EBs were maintained in EB culture medium 20 , 39 for 10 days followed by 5 days in the presence of 5 μM Dorsomorphin (DM) and 10 μM SB431542 (SB) for neuronal induction (Sigma‐Aldrich). The EBs were then transferred to Matrigel‐ (Corning) coated petri dishes and maintained in Dulbecco's modified Eagle's medium/F12 media (Life Technologies) containing 1X (vol/vol) N2 supplement (Life Technologies) and 20 ng/mL basic fibroblast growth factor (bFGF) (Peprotech). After 7 to 10 days in adherent culture, the visible neuronal rosettes were manually picked, dissociated into single cells using Accutase (Life Technologies) and expanded as NPCs. NPCs were cultured in Neurobasal medium (Life Technologies) containing 1X (vol/vol) GlutaMAX (Life Technologies), 1X (vol/vol) nonessential amino acids (Life Technologies), 1X (vol/vol) B27 supplement (Life Technologies), 1X (vol/vol) Pen/Strep, and 20 ng/mL bFGF (Peprotech), with media change every other day. Both Control and GD NPCs expressed similar levels of Musashi and SOX1 (Figure S1B,C). To induce differentiation, NPCs were grown in Neurobasal medium containing 1X (vol/vol) GlutaMAX, 1X (vol/vol) Nonessential amino acids, 1X (vol/vol) B27 supplement, 100 nM cyclic adenosine monophosphate (Sigma), 200 μM Ascorbic acid (Sigma), 10 ng/mL Brain‐derived neurotrophic factor (BDNF) (R&D), and 10 ng/mL Glial cell line‐derived neurotrophic factor (GDNF) (R&D) for 3 to 6 weeks on poly‐ornithine/Laminin coated plates. Both control and GD neurons expressed the neuronal‐specific marker class III β‐tubulin (Tuj‐1) (Figure S1D).
2.3. Immunocytochemistry/immunofluorescence
For immunofluorescence analysis, NPCs were plated in 8‐well chamber slides (Lab‐Tek), or were differentiated to neurons in confocal plates (MaTek). Cells were fixed in 4% paraformaldehyde (Sigma) for 15 minutes at room temperature, blocked for 30 to 40 minutes in phosphate‐buffered saline containing 8% fetal bovine serum (vol/vol). This was followed by incubation with the indicated primary antibodies for 1 hour at room temperature or overnight at 4°C. The cells were then incubated for 1 hour at room temperature with the appropriate secondary antibodies. Last, cell nuclei were labeled using 4′,6‐diamidino‐2‐phenylindole (DAPI)‐containing mounting medium (Vector Laboratories Cat No. H‐1200). For Lysotracker staining, Lysotracker Red DND‐99 (Thermo Fisher Scientific) was added directly to the culture medium at 1 μM. The cells were incubated with this dye for 45 minutes to 1 hour at 37°C, fixed, and then stained with primary antibody or with DAPI as indicated in the figure legends.
2.4. Antibodies
The following antibodies were utilized in this study: Primary antibodies; Cell Signaling Technology: p‐mTOR (Ser2448) (#5536), p‐S6 (Ser235/236) (#4856), p‐4EBP1(Thr37/46) (#2855), mTOR (#2983), S6 (#2217), 4EBP1 (#9452), β3‐Tubulin (#5568), LC3A/B (#12741), p62 (#88588), Novus Biologicals: MAP2 (NB300‐213), Developmental Studies Hybridoma Bank: LAMP1 (H4A3), Millipore: SOX1 (AB15766), Annexin V (AB14196), eBioscience: Musashi1 (14‐9896‐82). Secondary antibodies; Goat anti‐rabbit Alexa Fluor 488, Donkey anti‐chicken Alexa Fluor 647, and Donkey anti‐mouse Cy3 (Jackson ImmunoResearch Laboratories).
2.5. Image acquisition and analysis
Immunofluorescence images were captured using an inverted Nikon Eclipse Ti2 microscope attached to a spinning disk unit (CSU‐W1, Yokogawa) and Hamamatsu sCMOS camera. An oil immersion objective (Plan Fluor 40X, NA 1.30) was used for all imaging experiments. The excitation wavelengths used were 405, 488, 561, and 640 nm for blue, green, red, and far‐red fluorophores, respectively. Neuronal images were acquired as z‐stacks. Identical pixel acquisition settings were used for all experiments. Further image processing and analysis was done using Fiji software. 40 For NPCs, fluorescence intensity or puncti counts of the respective signal were obtained from at least three independent replicates (3‐5 different fields/replicate). The average value per field was normalized to the number of cells in the field. For neurons, fluorescence intensity or puncta of the respective signal were obtained from 150 to 200 MAP2 positive neurons, assayed in five different fields from at least three independent replicates. For both NPCs and neurons, the mean fluorescence intensity or average puncti count were calculated accordingly.
2.6. Chemical reagents and treatments
Eliglustat hemitartrate (HY‐14885A) was purchased from MedChem Express; Ibiglustat (P14969) was purchased from AstaTech; GZ667161 was synthesized as we described 21 ; Carmofur (14243) was from Cayman Chemical; Torin1 (475991) was from Sigma Aldrich; INK128 was from Selleck Chemicals; Conduritol β‐epoxide (C5424) was from Sigma Aldrich. Glucosyl(ß) Sphingosine (d18:1) (860535P) was from Avanti Polar Lipids. For GlcCer synthase inhibition, NPCs were treated with a final concentration of 2 μM Eliglustat, Ibiglustat, or GZ667161, for 5 days. For neurons, these inhibitors were added at 1 μM concentration to the culture media during the entire differentiation period from NPCs. The substrate reduction therapy (SRT) drugs were added to the culture medium directly and were replenished with every media change. For acid ceramidase inhibition, neuronal cells were incubated with 10 μM Carmofur for 24 hours (Stock concentration: 10 mM in dimethyl sulfoxide (DMSO)). For GCase inhibition, WT control cells were incubated with 1 mM conduritol‐β‐epoxide (CBE) for 24 hours (Stock concentration: 10 mM in sterile water). For exogenous GlcSph treatment, control NPCs and differentiated neurons were incubated with 2 μM or the indicated concentrations of GlcSph for 8 hours (Stock concentration: 5 mM in EtOH). For mTOR inhibition, neuronal cells were treated with INK128 (50 nM) or Torin1 (100 nM) for 24 hours (Stock concentration: 50 μM for INK128 and 100 μM for Torin1). Where indicated, WT control cells were incubated with GlcSph in the presence or absence of 50 nM INK128 or 100 nM Torin1 for 8 hours. For the autophagy experiment, WT neurons were treated with 1 μM GlcSph in the absence or presence of 100 nM Bafilomycin A1 (Sigma‐Aldrich; Cat. No. B1793) for 18 hours.
2.7. Western blot analysis
Cells were lysed directly in SDS sample buffer, sonicated, denatured by heating at 95°C for 5 minutes, and loaded onto 4% to 20% SDS/polyacrylamide gels (Bio‐Rad). Electrophoresis was followed by protein transfer onto nitrocellulose membranes and incubation with the indicated primary antibodies for 2 hours at room temperature or overnight at 4°C. The membranes were then incubated with anti‐mouse or anti‐rabbit horseradish peroxidase (HRP)‐conjugated secondary antibodies for 1 hour. Membranes were developed with SuperSignal West Femto Maximum Sensitivity Substrate (Thermo Fisher Scientific), and imaged using the Chemidoc system and Imagelab software (BioRad). Densitometry analysis was done using the Imagelab software (BioRad).
2.8. Lipid analysis
LC‐MS grade acetonitrile, isopropanol, methanol, water, formic acid, and ammonium acetate were purchased from Fisher Scientific (Pittsburg, Pennsylvania). HPLC grade tert‐Butyl methyl ether (MTBE), potassium hydroxide, and glacial acetic acid were purchased from Sigma Aldrich (St. Louis, Missouri). Sphingolipid standards were purchased from Avanti Polar Lipids, Inc. (Alabaster, Alabama). The sphingolipid standards included ceramide/sphingoid Internal Standard Mixture I (LM‐6002) and a number of individual sphingolipids. The list of sphingolipid standards is listed in Table S2.
2.8.1. Sample preparation
Control and GD NPCs were cultured in 6‐well plates (Corning) and were either left untreated or treated with inhibitors of GlcCer synthase, acid ceramidase, and GCase as described above. After incubation, the cells were detached using Accutase (Life Technologies), counted and centrifuged at 200g for 5 minutes. The cell pellets were washed once with Dulbecco's Phosphate‐Buffered Saline (DPBS) (Life Technologies) and stored in −80°C. Sphingolipids were extracted from pelleted cells as described previously. 41 , 42 Briefly, 225 μL of methanol was added to the cell pellet followed by 30 seconds of sonication and 30 seconds of vortex mixing. Ten microliters of internal standard was added to the samples followed by the addition of 750 μL of MTBE. The mixture was incubated at 4°C for 1 hour with 650 rpm shaking. After incubation, 97.5 μL of 1 M potassium hydroxide was added and allowed to incubate for 2 hours at 37°C. The mixture was bought to room temperature and neutralized with the addition of 2 μL of acetic acid. Two hundred microliters of water was added and the samples were centrifuged at 8000g for 8 minutes at 4°C. Six hundred microliters of the upper organic layer was transferred and dried with nitrogen at 25°C. The dried lipid extract was resuspended in 100 μL of acetonitrile:isopropanol:water (2:1:1, vol/vol/vol) and stored at −80°C. The lower aqueous phase was used to determine the protein content via a BCA kit (bicinchoninic acid assay, Thermo Fisher Scientific, Rockford, Illinois).
2.8.2. Liquid chromatography tandem mass spectrometry
Sphingolipid quantitation was done using liquid chromatography (LC) tandem mass spectrometry (MS/MS). The separation was achieved using an InfinityLab poroshell HILIC column (2.7 μm; 3.0 × 150 mm) (Agilent, Santa Clara, California). Mobile phase A was 10 mM ammonium acetate in water/acetonitrile (5:95, vol/vol) and mobile phase B was 10 mM ammonium acetate in water/acetonitrile (50:50, vol/vol). The gradient program was 0.0 to 2.25 minutes, 0% B; 2.25 to 3.0 minutes, gradient to 10% B; 3.0 to 3.5 minutes, gradient to 95% B; 3.5 to 6.75 minutes, 95% B; 6.75 to 7.25 minutes, gradient to 0% B; 7.25 to 9.0 minutes, 0% B. The column was maintained at 35°C and the autosampler was kept at 4°C. A 1 μL injection was used for all samples. Mass spectrometry detection was performed in the positive‐ion mode and the electrospray ionization source parameters were as follows: spray voltage, 3500 V; ion transfer tube temperature, 325°C; vaporizer temperature, 350°C; sheath gas pressure, 50; sweep gas pressure, 1; auxiliary gas, 10. Selected reaction monitoring (SRM) was used for mass detection with the following global parameters: RF lens voltage, 30 V; CID gas, 1.5 mTorr; Q1 and Q3 resolution, 0.7 Da full width at half maximum (FWHM). Refer to Table S3 for precursor to product ion transitions, associated timed SRM windows and collision energy. The sphingolipid standard (LM‐6002) was used to as an internal standard and used to create linear regression calibration curves for each sphingolipid class. Data collection and analysis was performed by Xcalibur v 4.1.31.9 (Thermo Scientific, San Jose, California) and Prism 6 (Graph Pad, La Jolla, California). The LC‐MS/MS data showing sphingolipid concentrations, and fold‐change normalized to the corresponding untreated controls, are presented in the Supporting Information.
2.9. Statistical analysis
Data were analyzed using prism software version 7.0a (GraphPad Software). The significance of differences was assessed using two‐tailed unpaired Student's t tests for comparing two groups or one‐way analysis of variance (ANOVA) to compare multiple groups, as indicated in the figure legends. The confidence level for significance was 95%. Results are expressed as mean ± SEM.
3. RESULTS
3.1. GD NPCs have highly elevated levels of GlcSph
It has been reported that postmortem nGD brains have 100‐ to 1000‐fold accumulation of GlcSph, whereas GlcCer is elevated to a much smaller extent (5‐ to 80‐fold). 2 , 4 To determine if nGD neuronal cells have an abnormal glucosphingolipid profile, we carried out LC‐MS/MS sphingolipid analysis of hiPSC‐derived NPCs from type 2 (GD2) and type 3 (GD3) nGD patients. As described below, nGD NPCs also exhibited very high levels of GlcSph compared to GlcCer, suggesting that in these cells, GlcCer is efficiently converted to its neurotoxic metabolite GlcSph. As shown in Figure 1, nGD NPCs exhibited a 10‐ to 100‐fold accumulation of GlcSph (Figure 1A), whereas GlcCer was elevated about twofold to threefold (Figure 1B‐D) compared to WT control NPCs. On the other hand, type 1 (GD1) NPCs had only a 3.5‐fold increase in GlcSph compared to control NPCs (Figure 1A), consistent with the lower pathogenicity of N370S mutations. We also found that GD‐NPCs exhibited very small elevations of ceramide and sphingosine compared to controls (Figure S2A‐F).
FIGURE 1.
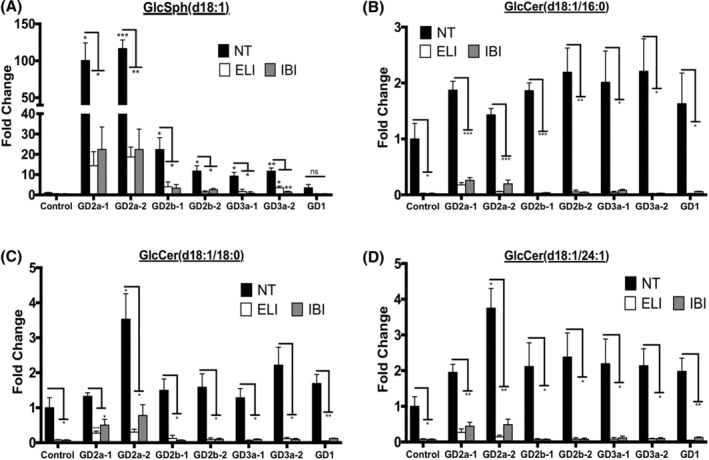
GlcCer synthase inhibitors prevent the accumulation of GlcCer and GlcSph in GD NPCs. NPCs derived from WT control a, two hiPSC clones each of GD2a, GD2b, and GD3a donors, and one clone of a GD1 donor, were either left untreated (NT) or incubated with the GlcCer synthase inhibitors Eliglustat (ELI) or Ibiglustat (IBI) as described in Section 2. The neuronal cells were then analyzed by high‐performance liquid chromatography with tandem mass spectrometry (HPLC‐MS/MS) for the indicated species of GlcSph (A) and GlcCer (B‐D). The plots represent fold‐change compared to no treatment (NT) control a (mean ± SEM, n = 3). Control NT vs GD NT and GD NT vs treated GD, t test. *P < .05, **P < .01, ***P < .001. GD, Gaucher disease; GlcCer, glucosylceramide; GlcSph, glucosylsphingosine; hiPSC, human induced pluripotent stem cell; NPCs, neuronal progenitor cells; ns, nonsignificant; WT, wild type
GlcCer synthase catalyzes the synthesis of GlcCer from glucose and ceramide, and Eliglustat, an inhibitor of this enzyme, has been approved for SRT in type 1 GD. 43 , 44 , 45 , 46 When we treated GD NPCs with the GlcCer synthase inhibitors Eliglustat and the brain‐penetrant Ibiglustat, 47 , 48 we found that there were significant reductions in both, GlcCer and GlcSph levels in the mutant NPCs (Figure 1A‐D).
These data suggest that our nGD hiPSC system recapitulates both, the highly elevated levels of GlcSph found in nGD brains, and the therapeutic response to SRT drugs in patients.
3.2. Elevated glucosphingolipids deregulate lysosomes through mTORC1
To examine the mechanisms by which the abnormal elevation in glucosphingolipids causes nGD, we next analyzed differentiated neurons derived from nGD hiPSC. We previously reported that in nGD neurons, GCase deficiency caused lysosomal depletion and a block in autophagic clearance, 20 and that these alterations are mediated through mTOR hyperactivation. 21 Confocal microscopic and Western blot analyses demonstrated that GD2 and GD3 NPCs express higher levels of phosphorylated mTOR (p‐mTOR) (Figure S3A), and its downstream substrate ribosomal protein S6 (p‐S6) (Figure S3B,C) compared to WT NPCs. To determine whether reducing the accumulation of glucosphingolipids prevents mTOR hyperactivation, we treated nGD NPCs with three different GlcCer synthase inhibitors, namely Eliglustat and the brain‐penetrant Ibiglustat/Venglustat 48 and GZ667161. 49 Quantitative image analysis and immunoblotting revealed that these GlcCer synthase inhibitors prevented mTOR hyperactivation, as determined by decreased levels of p‐mTOR and p‐S6 (Figure S3A‐C). Concomitantly, all three SRT compounds rescued lysosomal biogenesis, as shown by increased Lysotracker and LAMP1 staining (Figure S4A,B), and by Western blot analysis of LAMP1 in untreated and treated GD2 and GD3 NPCs (Figure S4C). The reciprocal correlation between mTOR hyperactivity and lysosomal depletion, as well as the reversal of this phenotype by GlcCer synthase inhibition, was also observed in differentiated nGD neurons. Figure S5A,B shows that nGD neurons exhibit a reduction in Lysotracker and LAMP1 staining and an increase in p‐mTOR, and that these phenotypes are reversed by incubation with GlcCer synthase inhibitors. It is also apparent that in untreated nGD neurons, p‐mTOR colocalized with lysosomes, which is where mTOR has access to and phosphorylates its substrates (Figure S5B). Immunoblot analysis confirmed that in nGD neurons mTOR was hyperactivated as determined by increased levels of phosphorylated mTOR, S6 and 4E binding protein 1 (4EBP1), and that GlcCer synthase inhibition reduced mTOR kinase activity to control levels (Figure S6).
These data demonstrate that the elevation of glucosphingolipids in mutant cells results in mTOR hyperactivation and lysosomal depletion. Moreover, the mTOR/lysosomal phenotype was reversed by lowering the formation of these lipids using SRT compounds in clinical use. 44 , 45 , 46 , 47 , 48 These results suggest that mTORC1 may be a target of elevated glucosphingolipids, and that deregulation of this complex mediates the deleterious effects of GCase deficiency on lysosomes.
3.3. The mTOR/lysosomal phenotype is caused by GCase loss‐of‐function
While the results in the previous section suggested that the nGD phenotype observed was caused by a loss‐of‐function, it is known that misfolding of mutant GCase proteins results in ER stress and induction of the unfolded protein response, a gain‐of‐function believed to contribute to the phenotypic alterations observed in GD. 50 , 51 , 52 , 53 To determine whether loss of GCase enzymatic activity is sufficient to recapitulate the mTOR/lysosomal phenotype observed in mutant cells, we treated WT NPCs and differentiated neurons with CBE, an irreversible inhibitor of GCase. 10 This treatment resulted in ~40‐fold accumulation of GlcSph and a twofold to threefold accumulation of GlcCer (Figure S7A‐C), a sphingolipid profile that was similar to that in the mutant NPCs (Figure 1). Confocal microscopic analysis revealed that CBE treatment also caused lysosomal depletion as determined by decreased Lysotracker staining (Figure S7D). Similar results were obtained by CBE treatment of WT differentiated neurons. Quantitative image analysis showed that CBE treatment of WT neurons resulted in increased p‐mTOR and p‐S6 levels, and a reciprocal decrease in LAMP1 and Lysotracker staining (Figure S8A‐C). CBE treatment induced p‐mTOR colocalization with lysosomes, another indication that an elevation of glucosphingolipids is capable of activating mTOR (Figure S8A). mTOR hyperactivation was confirmed by immunoblot analysis showing that CBE treatment of WT neurons induced increased levels of p‐mTOR, p‐S6, and p‐4EBP1 (Figure S9A‐C).
These data revealed that chemical inhibition of GCase enzymatic activity in three different lines of WT neurons recapitulated the mTOR/lysosomal phenotype of mutant nGD neurons, suggesting that these alterations were due to a GCase loss‐of‐function.
3.4. Acid ceramidase inhibition rescues mTOR/lysosomal phenotype
The reversal of mTOR/lysosomal alterations by GlcCer synthase inhibitors raises the question of the identity of the pathogenic lipids responsible for the mutant phenotype, as these inhibitors reduced the levels of both, GlcCer and GlcSph. To address this question, we determined whether a specific reduction in the levels of GlcSph would be sufficient to reverse the mTOR/lysosomal alterations of the mutant neurons. To this end, we incubated nGD NPCs and neurons with Carmofur, an inhibitor of acid ceramidase. As shown in Figure 2A, Carmofur treatment of GD2 and GD3 NPCs effectively lowered the levels of GlcSph in these cells. This treatment prevented mTOR hyperactivation and concomitantly, it restored lysosomal biogenesis. Confocal image analysis showed that Carmofur treatment reduced mTOR hyperactivity in GD2 and GD3 NPCs, as determined by decreased p‐S6 and p‐mTOR levels (Figures 2B and S10B). Acid ceramidase inhibition also prevented lysosomal depletion in the mutant NPCs as determined by Lysotracker and LAMP1 staining (Figures 2C and S10A). Carmofur also caused a reduction in mTOR activity and rescued lysosomal biogenesis in differentiated GD2 neurons, as determined by p‐mTOR, p‐S6, LAMP1, and Lysotracker staining (Figure 3A‐C). Western blot analysis confirmed that Carmofur treatment of GD2 neurons caused a reduction in mTOR kinase activity (Figure 3D,E) and rescued lysosomal biogenesis (Figure 3F). A similar reversal of the mTOR/lysosomal phenotype by Carmofur was obtained with GD3 neurons (Figure S10C,D).
FIGURE 2.
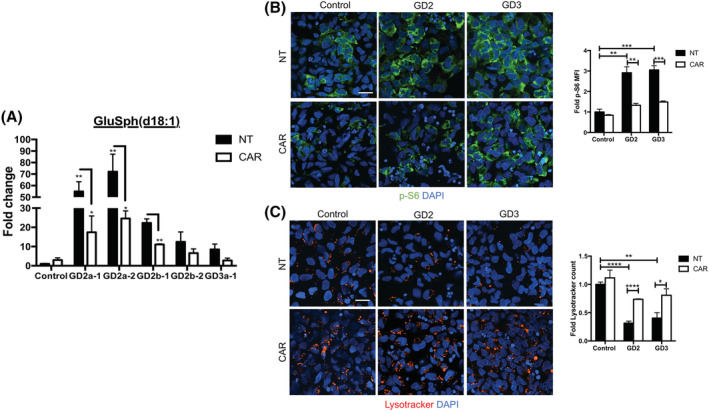
Acid ceramidase inhibition in nGD NPCs decreases GlcSph levels and reverses the mTOR/lysosomal phenotype. A, HPLC‐MS/MS analysis showing GlcSph levels in WT (control a), GD2, and GD3 NPCs that were either left untreated (NT) or treated with the acid ceramidase inhibitor Carmofur (CAR) as described in Section 2. NPCs derived from two hiPSC clones each of a GD2a and a GD2b donor and one clone of a GD3a donor were utilized for this experiment. Data represent fold‐change compared to NT control a (mean ± SEM, n = 3). B,C, Representative immunofluorescence images of p‐S6 (B, green) and Lysotracker (C, red) in control a, GD2a, and GD3a NPCs that were either left untreated (NT) or incubated with Carmofur as in (A), above. Nuclei were stained with DAPI (blue). Magnification ×40. Scale bar = 25 μm. Plots at the right of (B) and (C) represent fold‐change in mean fluorescence intensity (MFI) of p‐S6 and Lysotracker counts, respectively (mean ± SEM, n = 3). Control NT vs GD NT and GD NT vs GD treated with Carmofur, t test. *P < .05, **P < .01, ***P < .001, ****P < .0001. DAPI, 4',6‐diamidino‐2‐phenylindole; GlcSph, glucosylsphingosine; hiPSC, human induced pluripotent stem cell; HPLC‐MS/MS, high‐performance liquid chromatography with tandem mass spectrometry; mTOR, mammalian target of rapamycin; nGD, neuronopathic Gaucher disease; NPCs, neuronal progenitor cells; WT, wild type
FIGURE 3.
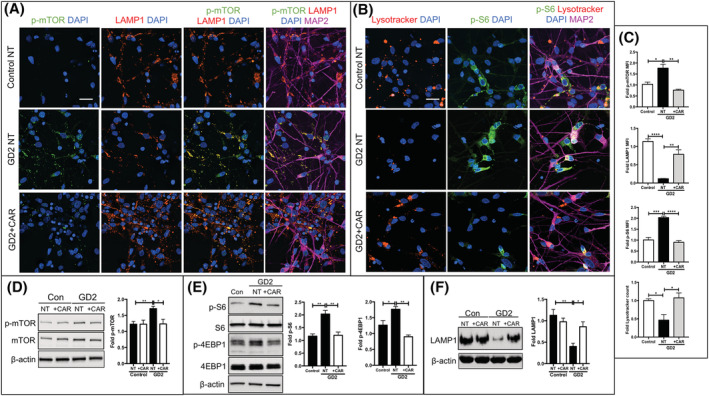
Acid ceramidase inhibition in GD2 neurons reduces mTOR hyperactivity and rescues lysosomal biogenesis. A,B, Representative immunofluorescence images of control a neurons, and GD2a neurons that were either not treated (NT) or incubated with Carmofur (CAR) as described in Section 2. The neurons were stained with Lysotracker (B, red) and with antibodies to p‐mTOR (A, green), LAMP1 (A, red), p‐S6 (B, green), and MAP2 (A, B, magenta). Nuclei were stained with DAPI (blue). Magnification ×40. Scale bar = 25 μm. C, The fold‐change in Lysotracker counts and MFI of p‐mTOR, LAMP1 and p‐S6 shown in the graphs (mean ± SEM, n = 4) were calculated as described in Section 2. D‐F, Immunoblot analysis of p‐mTOR, mTOR, p‐S6, S6, p‐4EBP1, 4EBP1, and LAMP1 in control a and GD2a neurons that were either left untreated (NT) or incubated with Carmofur (CAR) as in (A) and (B), above. Results in the adjacent plots are expressed as fold‐change with respect to the NT control a (mean ± SEM, n = 3). Control NT vs GD NT and GD NT vs GD treated with Carmofur, t test. *P < .05, **P < .01, ***P < .001, ****P < .0001. DAPI, 4',6‐diamidino‐2‐phenylindole; MFI, mean fluorescence intensity; mTOR, mammalian target of rapamycin
We conclude from these results that reducing the abnormal elevation of GlcSph was sufficient to prevent the mTOR/lysosomal alterations of nGD neurons and that therefore, GlcSph is the likely sphingolipid species responsible for this phenotype. These results further suggest that acid ceramidase plays an essential role in the pathogenesis of nGD, and that its inhibition may be an effective approach to treat GBA1‐associated neurodegeneration. We should note, however, that Carmofur also has other pharmacological actions such as inhibition of Fatty acid amide hydrolase and N‐acylethanolamine acid amidase. 54 Therefore, further analysis is required to ascertain whether rescue of the GD phenotype was solely due to acid ceramidase inhibition by Carmofur.
3.5. Treatment of WT neurons with exogenous GlcSph phenocopies the mTOR hyperactivation and lysosomal abnormalities of nGD neurons
GlcCer deacylation results in the formation of GlcSph, an amphipathic, positively charged sphingolipid that exits the lysosome to the cytoplasm, 9 , 55 where mTOR is located. To directly determine whether GlcSph is capable of activating mTOR and reproducing the lysosomal phenotype of the mutant cells, we incubated WT NPCs and differentiated neurons with exogenous GlcSph (Figure 4). In NPCs, this treatment caused a reduction in Lysotracker staining (Figure 4A) and mTOR hyperactivation (not shown). Similar results were obtained with differentiated neurons. Confocal microscopic analysis demonstrated that GlcSph treatment of WT neurons caused mTOR hyperactivation and a decrease in LAMP1 and Lysotracker staining (Figures 4B and S11A,B). Western blot analysis also showed that GlcSph induced a dose‐dependent increase in mTOR activity and a concomitant decrease in LAMP1 levels (Figure 4C).
FIGURE 4.
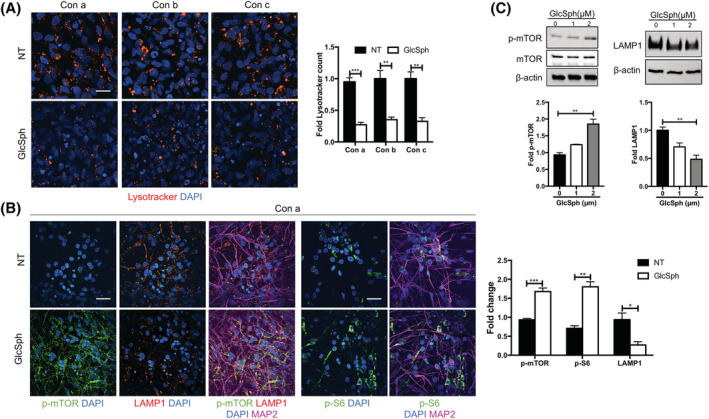
Treatment of WT NPCs and differentiated neurons with GlcSph recapitulates the mTOR/lysosomal phenotype of neuronopathic GD. A, Lysotracker staining (red) of WT NPCs from controls a, b, and c (Con a, Con b, and Con c) that were either left untreated (NT) or treated with GlcSph for 8 hours as described in Section 2. Nuclei were stained with DAPI (blue). Lysotracker counts plotted at the right of images are expressed as fold‐change compared to untreated control a (mean ± SEM, n = 4, t test). B, Immunofluorescence staining of p‐mTOR (green), LAMP1 (red), p‐S6 (green), MAP2 (magenta), and DAPI (nuclei‐blue) in WT (control a) neurons that were either left untreated (NT) or treated with GlcSph as in (A), above. Magnification in (A) and (B): ×40. Scale bar = 25 μm. The fold‐change in MFI of p‐mTOR, p‐S6, and LAMP1 is shown in graph at the right of image (mean ± SEM, n = 4, t test). C, Representative Western blot of p‐mTOR, mTOR, and LAMP1 in WT (control a) neurons treated with the indicated doses of GlcSph for 8 hours. The graphs below each immunoblot represents fold‐change with respect to untreated neurons (mean ± SEM, n = 3, one‐way analysis of variance [ANOVA]). *P < .05, **P < .01, ***P < .001. DAPI, 4',6‐diamidino‐2‐phenylindole; GD, Gaucher disease; GlcSph, glucosylsphingosine; MFI, mean fluorescence intensity; mTOR, mammalian target of rapamycin; NPCs, neuronal progenitor cells; WT, wild type
Collectively, these results obtained with neurons derived from multiple WT lines demonstrated that treatment with exogenous GlcSph phenocopied the mTOR/lysosomal alterations seen in nGD neurons.
3.6. mTOR inhibitors prevent the lysosomal depletion induced by exogenous GlcSph
The results in the previous section suggested that endogenous and exogenous GlcSph used similar mechanisms to cause lysosomal alterations. As we previously showed, mTOR inhibition by Torin1 rescued the lysosomal abnormalities in nGD neuronal cells. 21 In the present study, Torin1 and INK128, another catalytic inhibitor of mTOR, also rescued lysosomal biogenesis, as determined by Lysotracker staining (Figure S12A,B) and LAMP1 immunoblotting (Figure S12C). We reasoned that if GlcSph causes lysosomal depletion through mTOR hyperactivation, then mTOR inhibitors should be able to block the effects of exogenous GlcSph on lysosomes. To examine this question, we incubated WT NPCs and neurons with GlcSph in the presence or absence of Torin1 or INK128. As shown in Figure 5A‐C, confocal and Western blot analyses showed that mTOR kinase inhibition prevented the lysosomal depletion induced by exogenous GlcSph.
FIGURE 5.
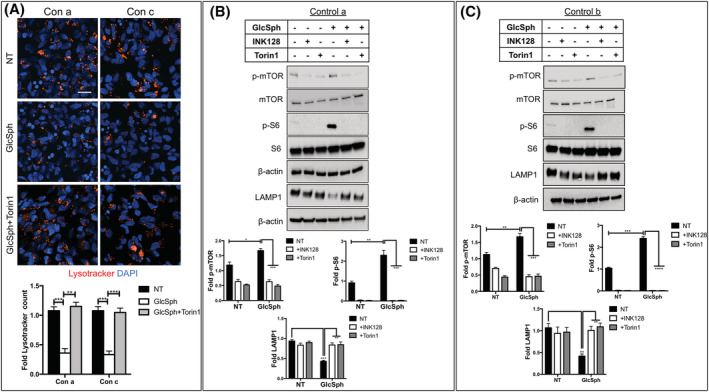
mTOR inhibitors prevent mTOR hyperactivation and lysosomal depletion induced by exogenous GlcSph. A, WT NPCs (controls a and c) were either left untreated (NT) or incubated with GlcSph for 8 hours in the absence or presence of Torin1 as described in Section 2. The cultures were then stained with Lysotracker (red) and with DAPI (blue). Magnification ×40. Scale bar = 25 μm. Graph below the image represents fold‐change in Lysotracker counts compared to the untreated controls (mean ± SEM, n = 3). B,C, Western blot analysis of p‐mTOR, mTOR, p‐S6, S6, and LAMP1 in WT control a (B) and control b (C) neurons that were either left untreated (NT), or incubated with INK128 alone, Torin1 alone, or were incubated with GlcSph in the absence or presence of INK128 and Torin1, as indicated in the figure. Quantitation of the Western blots is shown below the corresponding immunoblots. The graphs represent fold‐change with respect to the corresponding untreated Controls, and results are plotted as mean ± SEM (n = 3). The graphs in (A), (B), and (C) were assessed by t test between the indicated groups. *P < .05, **P < .01, ***P < .001, ****P < .0001. DAPI, 4',6‐diamidino‐2‐phenylindole; GlcSph, glucosylsphingosine; mTOR, mammalian target of rapamycin; NPCs, neuronal progenitor cells; WT, wild type
3.7. GlcSph induces an autophagy block that is reversed by inhibitors of mTOR and acid ceramidase
We previously showed that nGD neurons have an autophagy block. 20 In view of our results, we wanted to determine whether treatment of WT neurons with exogenous GlcSph would also impair autophagy. As shown in Figure 6A, GlcSph treatment of WT neurons caused an increase in LC3‐II levels, suggesting an accumulation of autophagosomes. To determine whether this was due to an increase in the number of autophagosomes or a blockade in autophagic flux, 56 we used bafilomycin A1 (Baf), a lysosomal v‐ATPase inhibitor that blocks lysosomal acidification. 57 Coincubation of WT neurons with GlcSph and Baf did not further increase LC3‐II levels, suggesting that elevated LC3‐II levels were due to a block in autophagic flux and not an increase in the number of autophagosomes (Figure 6A).
FIGURE 6.
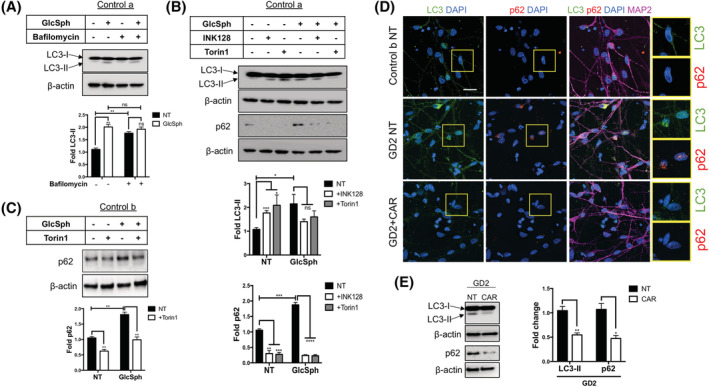
Inhibitors of mTOR and acid ceramidase reverse the autophagic block caused by GlcSph. A, control a neurons were either left untreated (NT) or incubated with GlcSph alone, Bafilomycin (Baf) alone, or were coincubated with both GlcSph and Baf as described in Section 2. Total cell lysates were prepared and Western blotting was performed to analyze the levels of LC3‐I and LC3‐II. B, Western blotting showing LC3 and p62 protein levels in WT (control a) neurons that were either left untreated (NT) or incubated with INK128 alone, Torin1 alone, or incubated with GlcSph in the absence or presence of INK128 and Torin1, as indicated in the figure. Quantitation of the Western blots is shown below the immunoblots. C, Western blot of p62 protein levels in control b neurons that were either left untreated (NT) or incubated with Torin1 alone, GlcSph alone, or were coincubated with GlcSph and Torin1. The graphs in (A), (B), and (C) represent fold‐change with respect to the corresponding NT Control, and results are plotted as mean ± SEM (n = 3). The differences were assessed by t test between the indicated groups. *P < .05, **P < .01, ***P < .001, ****P < .0001. D, Confocal immunofluorescence images of LC3 (green), p62 (red), and MAP2 (magenta) in untreated WT (control b) and GD2a neurons as well as GD2a neurons treated with Carmofur (CAR). Nuclei were stained with DAPI (blue). Magnification ×40. Scale bar = 25 μm. Insets on the right side of the images are enlarged areas from each panel. E, Western blot depicting LC3‐I, LC3‐II, and p62 protein expression in untreated (NT) or Carmofur (CAR)‐treated GD2a neurons. The results are expressed as fold‐change with respect to NT GD2a (mean ± SEM, n = 3, t test, *P < .05, **P < .01). DAPI, 4',6‐diamidino‐2‐phenylindole; GlcSph, glucosylsphingosine; mTOR, mammalian target of rapamycin; WT, wild type
As the ALP is largely regulated by mTORC1 pathway and we found that GlcSph activates mTORC1 and perturbs autophagy, we wanted to determine whether GlcSph blocked autophagy through mTORC1 activation. To this end, we incubated WT neurons with GlcSph in the absence or presence of INK128 and Torin1. As shown in Figure 6B, these inhibitors caused a reduction in LC3‐II levels. In order to assess autophagic degradation, we examined the levels of SQSTM1/p62, an autophagy adaptor protein that brings protein aggregates to the autophagosome and is itself degraded by the lysosomes during normal autophagy. Treatment of WT neurons with GlcSph increased p62 levels suggesting a block in autophagosome degradation, which was reversed by coincubation with INK128 and Torin1 (Figure 6B,C). Thus, treatment with exogenous GlcSph phenocopied mTOR hyperactivation, lysosomal depletion, and the defects in autophagy that we previously reported in Gaucher neurons. 20 , 21 As shown in Figure 6D,E, treatment of GD2 neurons with Carmofur caused a reduction in the levels of LC3‐II and p62, showing that lowering GlcSph accumulation by acid ceramidase inhibition was sufficient to remove the autophagic block in these cells.
We conclude from these results that the elevation in GlcSph in nGD neurons mediates autophagic block through mTORC1, and that preventing mTOR hyperactivation through either mTOR or acid ceramidase inhibition, can restore normal autophagy in Gaucher neurons. Furthermore, the ability of exogenous GlcSph to recapitulate these phenotypes lends strong support to the idea that this sphingolipid is largely responsible for the ALP abnormalities caused by GCase deficiency.
3.8. Elevated GlcSph increases vulnerability of neurons to cell death
Deregulation of the ALP has been associated with promoting neurodegeneration in many neurodegenerative disorders including Alzheimer's disease, PD, and Huntington's disease. 58 , 59 This is primarily due to the role of the ALP in recycling of intracellular macromolecules, and the degradation of misfolded proteins and other cellular debris. To examine whether the defects in ALP caused by elevated GlcSph would impact neuronal survival, we examined the levels of Annexin V in GD2 neurons, and in WT neurons treated with GlcSph. Annexin V is a phospholipid‐binding protein with high affinity for phosphatidylserine, which is normally found in the inner leaflet of the plasma membrane but translocates to its outer leaflet during apoptosis. As shown in Figure S13, GD2 neurons exhibit higher levels of Annexin V compared to WT neurons, suggesting that GCase deficiency increases vulnerability of the mutant cells to apoptosis. In addition, treatment of WT neurons with GlcSph caused an increase in Annexin V in a dose‐dependent manner, phenocopying the effects seen in the mutant neurons. Figure S13 also shows that treatment of GD2 neurons with the mTOR inhibitor INK128 significantly decreased Annexin V staining in these cells, suggesting that mTOR inhibition can decrease the vulnerability of mutant neurons to cell death. Identification of the mechanisms involved will require further analysis.
Taken together, our results provide compelling evidence that GlcSph is a bioactive lipid whose elevation in neuronal cells due to GBA1 mutation, pharmacological GCase inhibition, or direct exposure to this lipid activates mTORC1, and that GlcSph elevation is sufficient to disrupt the ALP. We further suggest that in nGD neurons, mTORC1 may act as a sensor of pathological levels of GlcSph. A diagram of the model we propose is shown in Figure 7.
FIGURE 7.
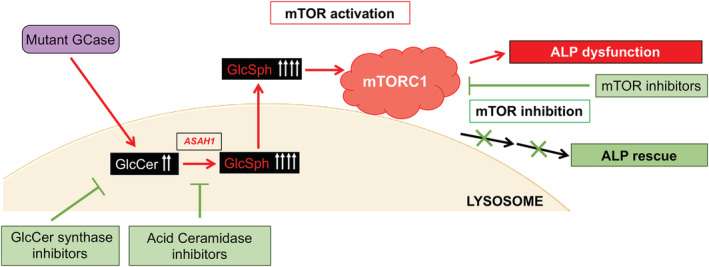
Proposed model of GlcSph‐mediated lysosomal dysfunction in nGD neurons. Mutant GCase causes the accumulation of GlcCer, which is converted to GlcSph via an alternate metabolic pathway by acid ceramidase (ASAH1) in the lysosome. The excess GlcSph, which is water‐soluble, exits the lysosome into the cytoplasm and activates the mTOR complex 1 (mTORC1) leading to lysosomal depletion and autophagy block. Inhibitors of GlcCer synthase, ASAH1, and mTOR are able to suppress mTOR hyperactivation and rescue the ALP in mutant neurons. ALP, autophagy lysosomal pathway; GCase, β‐glucocerebrosidase; GlcCer, glucosylceramide; GlcSph, glucosylsphingosine; mTOR, mammalian target of rapamycin; nGD, neuronopathic Gaucher disease
4. DISCUSSION
In this study, we report the identification of an mTORC1‐dependent pathogenic mechanism activated by elevated GlcSph, which is largely responsible for the lysosomal abnormalities of nGD neurons. Our results implicate acid ceramidase as essential for nGD pathogenesis, and as a potential therapeutic target to treat GBA1‐associated neurodegeneration.
nGD patient brains have up to a 1000‐fold elevation of GlcSph, 2 , 4 and there are also large accumulations of this lipid in plasma, even in GD1, as this amphipathic lipid readily exits the lysosome to the cytoplasm and the extracellular space. 55 , 60 , 61 , 62 Because of the high levels of GlcSph in nGD brains, it is widely believed that this lipid plays an important role in neurodegeneration, but the mechanisms involved are not completely understood. In the present study, we uncovered a mechanism by which elevated GlcSph deregulates the ALP, a key pathogenic event in nGD and other neurodegenerative diseases. 7 , 19 , 53 , 63 , 64 , 65 , 66 Although GlcCer is the primary substrate of GCase, we found that as in brains of nGD patients, the fold‐elevation of GlcSph in nGD NPCs, and in CBE‐treated WT NPCs, is an order of magnitude higher than that of GlcCer. Thus in nGD neuronal cells, elevated GlcCer is efficiently converted to its lyso‐derivative through an alternative metabolic pathway involving acid ceramidase. 9 , 10 , 11
Our results suggest that GlcSph is the lipid species that induces lysosomal depletion and blocks autophagy through mTORC1 activation. This conclusion is based on two lines of evidence. First, treatment of nGD NPCs and neurons with an acid ceramidase inhibitor, which significantly reduced GlcSph levels, was sufficient to prevent mTOR hyperactivation, lysosomal depletion, and restore autophagic flux. Second, direct treatment of WT NPCs and differentiated neurons with exogenous GlcSph phenocopied the mTOR and ALP alterations of nGD neurons, consistent with the idea that the pathogenic effects caused by endogenous and exogenous GlcSph involved similar mechanisms. In both cases, there was a redistribution of mTOR from the cytoplasm to the lysosomal surface, an increase in phosphorylation of mTOR and its substrates, a concomitant depletion of lysosomes and impairment in autophagy, and these alterations were prevented by mTOR inhibitors. Additionally, GlcSph also increased the vulnerability of WT neurons to cell death, phenocopying the increased vulnerability of the mutant cells, which was partially prevented by mTOR inhibition. Although it has been proposed that sphingosine is involved in GD pathogenesis, 67 , 68 the levels of sphingosine in the mutant cells were not significantly elevated, arguing that in this cell type, sphingosine may not have contributed to the deleterious effects of GCase deficiency we observed. Our conclusion is also supported by studies from Taguchi et al suggesting that in vivo, GlcSph is likely to be the neurotoxic species responsible for GBA1‐associated neuropathology. 55
Current SRT with the GlcCer synthase inhibitor Eliglustat (Genzyme) has been approved for the treatment of type 1 GD; and a brain‐penetrant GlcCer synthase inhibitor, 47 , 48 is in phase 2 clinical trials for type 3 GD (NCT02843035), GBA1‐associated PD (NCT02906020), and Fabry disease (NCT02228460). In our hiPSC system, treatment of nGD neurons with GlcCer synthase inhibitors lowered GlcCer and GlcSph levels and rescued the mTOR/lysosomal phenotype. In view of our results, we suggest that the phenotypic rescue we observed using GlcCer synthase inhibitors was primarily due to a secondary effect of these drugs in reducing GlcSph levels in the nGD hiPSC neurons.
Elevated levels of deacylated‐glycosphingolipids are also responsible for neurodegeneration in other sphingolipidoses. Krabbe disease is a fatal demyelinating disorder caused by a deficiency in the lysosomal enzyme galactosylceramidase. While the primary substrate of this enzyme is galactosylceramide (GalCer), the lipid that accumulates in this disease is its lyso‐derivative galactosylsphingosine (GalSph), due to the action of acid ceramidase. 69 , 70 , 71 Li et al recently showed that crossing of Krabbe (Twitcher) mice with Asah1/acid ceramidase‐deficient mice (Farber mice) prevented accumulation of GalSph and cured the Krabbe mice. 69 Also, intraperitoneal injection of Carmofur into Krabbe mice decreased the levels of GalSph and extended their lifespan. Thus, acid ceramidase is likely to be an important therapeutic target in sphingolipidoses where there is an accumulation of lyso‐glycosphingolipids including Gaucher, Krabbe, and Fabry diseases. 9
It was recently shown that α‐synuclein abnormalities caused by GCase deficiency can also be reversed by acid ceramidase inhibition. 9 , 55 , 72 Carmofur treatment of HEK293‐FT cells deficient in GCase and GBA1/PD dopamine neurons resulted in decreased oxidized α‐synuclein. 72 And in vivo studies in a relevant mouse model of GBA1‐associated PD showed that Carmofur significantly decreased the levels of oligomeric precursors of aggregated α‐synuclein. 55 Based on in vitro and in vivo studies, it has been proposed that GlcCer and GlcSph interact directly with α‐synuclein promoting its aggregation. 55 , 73 In view of our results, we suggest that this beneficial effect of Carmofur in reducing α‐synuclein aggregation may also be facilitated by an effect on improving lysosomal function, as these organelles are involved in clearing of aggregation‐prone proteins. 15 , 20 , 63 , 64 , 65 , 66
In contrast to GlcCer, which is a hydrophobic molecule that is largely membrane‐associated, GlcSph is an amphipathic and water‐soluble molecule. This lyso‐glycosphingolipid is positively charged at the acid pH of the lysosome and it is still partially charged in the cytoplasm. 9 , 74 After GlcCer deacylation, GlcSph exits the lysosome to the cytoplasm, 61 , 74 where mTOR is located. In response to nutrients, mTOR kinase is activated and translocated to the lysosomal surface where it phosphorylates its substrates. 22 , 24 , 25 , 27 , 28 , 75 , 76 Consistent with its constitutive activation by GlcSph, mTOR colocalized with lysosomes in nGD neurons as well as in GlcSph‐treated WT neurons. Our finding that mTOR inhibitors rescued the lysosomal phenotype that was induced by either mutant GBA1, or by direct treatment of WT neurons with exogenous GlcSph, strongly suggests that mTOR activation by GlcSph mediates the deleterious effects of this lipid on lysosomal homeostasis. Our results further suggest that the mTOR complex activated by elevated GlcSph is mTORC1, as nGD neurons as well as WT neurons treated with GlcSph, exhibited increased levels of p‐S6 and p‐4EBP1, two substrates normally associated with mTORC1. However, we cannot rule out that mTORC2 may also be responsive to elevated GlcSph. Another question raised by the present studies is whether GlcSph activates mTORC1 by direct interaction with one or more of its components. In this regard, it is interesting to point out that cholesterol has been shown to bind cholesterol‐responsive motifs in SLC38A9, an mTORC1 component involved in amino acid sensing, leading to mTORC1 activation. 77 Whether GlcSph regulates mTORC1 through direct interactions with this complex will require further analysis.
A role of mTOR in nGD neurodegeneration is also supported by previous reports. Brains from the 4 L;C* mouse model of nGD had increased expression of mTOR pathway genes including p70S6K, the kinase that phosphorylates the mTORC1 substrate S6. 78 On the other hand, some reports in the literature are in apparent contradiction to our results showing mTOR hyperactivation in nGD neurons. It has been reported that in drosophila harboring a mutation in the GBA1 homolog, there was a decrease in mTOR activity, yet Rapamycin treatment prolonged the life of the flies. 79 In another study, GBA1 mutations in fibroblasts from patients with PD and in primary neurons of GBA1 transgenic mice there was decreased mTOR activity, which was coincident with a decrease in acidic functional lysosomes. 63 As the regulation of mTOR is complex and is likely to depend on the model system and experimental conditions, further analysis is required to understand the role of mTOR in GBA1‐associated neurodegeneration.
In summary, this study describes a mechanism by which elevated GlcSph activates mTORC1 and uncovers a possible role of this complex as a sensor of sphingolipid imbalance. Abnormal mTOR hyperactivation led to deregulation of the lysosomal compartment, a phenotype that was reversed by inhibitors of GlcCer synthase, mTOR, and acid ceramidase. Our results establish for the first time a mechanistic link between elevated GlcSph, mTOR hyperactivation, ALP dysfunction, and identify acid ceramidase as a therapeutic target for GBA1‐associated neurodegeneration. The position of acid ceramidase as the last step in the formation of neurotoxic GlcSph suggests that development of safe and effective inhibitors of this enzyme may provide a new therapeutic alternative for the treatment of GBA1‐associated neurodegeneration.
CONFLICT OF INTEREST
The authors declared no potential conflicts of interest.
AUTHOR CONTRIBUTIONS
M.P.S.: project direction, experiment planning and performance, data analysis and interpretation, manuscript writing; J.W.J.: experiment performance, data analysis and interpretation, manuscript writing; M.K.: experiment performance, data analysis and interpretation; O.A.: experiment performance, data analysis and interpretation, manuscript editing; T.S.P., E.T.Z.: provision of study materials, data analysis and interpretation, manuscript editing; R.A.F.: project direction, experiment planning, data analysis and interpretation, manuscript writing.
Supporting information
Appendix S1: Supplementary File.
Fig. S1 Generation of human iPSC‐derived NPCs and neurons. (A) Schematic showing directed differentiation of GD2 hiPSCs to neuronal progenitor cells (NPCs) and neurons. (B and C) Representative immunofluorescence images of control a and GD2a NPCs stained with antibodies to Musashi (B, green) and Sox1 (C, green). The nuclei were stained with DAPI (blue). Magnification 20x. (D) Representative immunofluorescence images of control a and GD2a neurons stained with Tuj1 (green) antibody. The nuclei were stained with DAPI (blue). Magnification 60x.
Fig. S2 Ceramide and Sphingosine levels in mutant NPC are not significantly elevated compared to control NPCs. The control and mutant NPC samples listed in the legend to Figure 1 were analyzed by HPLC‐MS/MS for the indicated species of Ceramide (Cer) (A‐E) and Sphingosine (Sph) (F). The plots represent fold‐change compared to the untreated Control a (mean ± SEM, n = 3). Control NT vs GD NT and GD NT vs treated GD, t‐test. *P < 0.05, **P < 0.01, ns: non‐significant.
Fig. S3 GlcCer synthase inhibitors prevent mTOR hyperactivation in GD NPCs. NPCs derived from untreated Controls a and b, and from GD2a and GD3a NPC that were either left untreated (NT) or treated with GZ667161 (GZ), Ibiglustat (IBI), or Eliglustat (ELI) as described in Materials and Methods, were stained for p‐mTOR (A, green) and p‐S6 (B, green), and with DAPI (blue). Magnification 40x. Scale bar, 25 μm. Plots at the right of A and B represent fold‐change in MFI of p‐mTOR and p‐S6 compared to Control a (mean ± SEM, n = 3). (C) Representative immunoblots of p‐S6 and S6 in Control a NPCs (Con), and in NPCs from GD2a (upper blot) and GD3a (lower blot) that were treated with GZ667161, Ibiglustat, and Eliglustat as above. The graphs below each blot show a quantitation of the results, in which differences in protein levels were expressed as fold‐change with respect to Control a (mean ± SEM, n = 3 for Control; n = 4 for GD2 and GD3; data were compiled from two different hiPSC clones of GD2a and GD3a donors). Control NT vs GD NT, t‐test; GD NT vs treated GD, one‐way ANOVA. *P < 0.05, **P < 0.01, ***P < 0.001, ****P < 0.0001.
Fig. S4 GlcCer synthase inhibitors restore lysosomal biogenesis in nGD NPCs. NPCs derived from untreated Controls a and b, and from GD2a and GD3a NPC that were either left untreated (NT) or treated with GZ667161 (GZ), Ibiglustat (IBI) or Eliglustat (ELI) as described in Materials and Methods, were stained with Lysotracker (A, red), or with antibodies to LAMP1 (B, red). Nuclei were labeled with DAPI (blue). Magnification 40x. Scale bar, 25 μm. Plots at the right of A and B represent fold‐change in Lysotracker and LAMP1 counts, respectively. The differences are expressed as fold‐change compared to Control a (mean ± SEM, n = 3). Control NT vs GD NT, t‐test; GD NT vs treated GD, one‐way ANOVA. (C) Representative immunoblots of LAMP1 in NPCs from GD2a (upper blot) and GD3a (lower blot) that were treated with GZ667161, Ibiglustat, and Eliglustat as above. The graphs below each blot are a quantitation of LAMP1 expressed as fold‐change with respect to the corresponding untreated GD2 or GD3 values (mean ± SEM, n = 2, One‐way ANOVA). *P < 0.05, **P < 0.01, ***P < 0.001, ****P < 0.0001.
Fig. S5 GlcCer synthase inhibitors reverse mTOR hyperactivity and prevent lysosomal depletion in nGD neurons. (A) Differentiated WT (Control a) neurons, and GD2a neurons were either left untreated (NT), or treated with GZ667161 (GZ), Ibiglustat (IBI), or Eliglustat (ELI) as described in Materials and Methods. The cultures were then stained with Lysotracker (red), with antibodies to the neuronal marker MAP2 (magenta), and with DAPI (blue). (B) WT (Control a) neurons, and GD2a neurons that were either left untreated (NT) or treated as in A, above, were stained with antibodies to p‐mTOR (green), LAMP1 (red), MAP2 (magenta), and with DAPI (blue). For A and B: Magnification 40x. Scale bar, 25 μm. The plots at the right represent fold‐change in counts of Lysotracker puncti, and MFI of p‐mTOR and LAMP1 as indicated (mean ± SEM, n = 3). Control NT vs GD NT, t‐test; GD NT vs treated GD, one‐way ANOVA. *P < 0.05, **P < 0.01, ***P < 0.001, ****P < 0.0001.
Fig. S6 GlcCer synthase inhibitors reverse mTOR hyperactivity and prevent lysosomal depletion in nGD neurons. (A) Representative Western blots of p‐S6 and p‐4EBP1 in Control a neurons, and in GD2a neurons that were either left untreated (NT) or treated with GZ667161 (GZ), Ibiglustat (IBI), or Eliglustat (ELI) as described in Materials and Methods. In the graphs below the blot, p‐S6 and p‐4EBP1 levels are expressed as fold‐change compared to Control a (mean ± SEM, n = 3 for Control a and n = 4 for GD2a: data were compiled from neurons derived from 2 different hiPSC clones from the GD2a donor). (B) Western blots of p‐mTOR and p‐4EBP1 in Control a neurons, and in GD2b neurons treated as in A, above. In the graphs below, p‐mTOR and p‐4EBP1 levels are expressed as fold‐change compared to Control a (mean ± SEM, n = 3 for Control a and n = 4 for GD2b: data were compiled from neurons derived from 2 different hiPSC clones from the GD2b donor). Control NT vs GD NT, t‐test; GD NT vs treated GD, one‐way ANOVA. *P < 0.05, **P < 0.01, ***P < 0.001, ****P < 0.0001.
Fig. S7 Treatment of WT NPCs with CBE recapitulates the phenotypes seen in nGD neurons. (A‐C) HPLC‐MS/MS analysis of WT NPCs (Controls a, b and c) showing the levels of GlcSph, GlcCer, Cer and Sph in untreated (NT) or CBE‐treated conditions. Data are represented as fold‐change compared to NT for every lipid (mean ± SEM; n = 3 for Control a and b, n = 2 for Control c; t‐test; *P < 0.05, **P < 0.01 and ***P < 0.001, ns: non‐significant). (D) Lysotracker staining (red) of WT NPCs that were either left untreated or incubated with CBE as described in Materials and Methods. Nuclei are stained with DAPI (blue). Magnification 40x. Scale bar, 25 μm. Fold‐change in Lysotracker counts is plotted at the right of images (mean ± SEM, n = 3, t‐test; *P < 0.05, **P < 0.01).
Fig. S8 Treatment of WT neurons with CBE recapitulates mTOR hyperactivation and lysosomal depletion observed in GD neurons. (A) Control a and b (Con a and Con b) neurons that were either left untreated (NT) or incubated with CBE were stained with antibodies to p‐mTOR (green), LAMP1 (red), MAP2 (magenta), and with DAPI. (B). Control a and b neurons treated as above were stained with antibodies to p‐S6 (green), MAP2 (magenta), with Lysotracker (red), and with DAPI (blue). For A and B: Magnification 40x, Scale bar, 25 μm. (C) Left panel, quantitation of the images for Control a; Right panel, quantitation of the images for Control b. Fold‐change in Lysotracker counts, and in p‐mTOR, LAMP1, and p‐S6 MFI was calculated as described in Materials and Methods and plotted as mean ± SEM (n = 4). NT vs CBE, t‐test. *P < 0.05, **P < 0.01, ***P < 0.001, ****P < 0.0001.
Fig. S9 CBE treatment of WT neurons activates mTORC1. Immunoblot analysis of phosphorylated and total levels of mTOR, S6 and 4EBP1, in Control a (A), Control b (B), and Control c (C) neurons that were either left untreated (NT) or treated with CBE as described in Materials and Methods. The graphs below each immunoblot represent fold‐change in protein levels compared to the corresponding untreated Controls (mean ± SEM, n = 3). NT vs CBE, t‐test. *P < 0.05, **P < 0.01.
Fig. S10 Carmofur treatment reverses the mTOR/lysosomal phenotype in nGD NPCs and differentiated neurons. (A and B) Immunofluorescence staining of LAMP1 (A, red) and p‐mTOR (B, green) in Control a, GD2a and GD3a NPCs that were either left untreated (NT) or incubated with Carmofur (CAR) as described in Materials and Methods. The graphs next to the images in B represent quantitation of LAMP1 puncti (upper plot) and p‐mTOR MFI (lower plot) (mean ± SEM, n = 3). (C) Lysotracker (red), MAP2 (magenta), and DAPI (blue) staining of Control b, and GD3a differentiated neurons that were either left untreated or incubated with Carmofur. Graph at the right of images in C represents fold‐change of Lysotracker counts compared to untreated Control b (mean ± SEM, n = 3). For A, B and C: Magnification 40x. Scale bar, 25 μm. (D) Representative Western blot showing the levels of p‐mTOR, mTOR, p‐S6 and S6 in WT (Control b), and GD3a differentiated neurons that were either left untreated or incubated with Carmofur as above. The graphs to the right of WB represent fold‐change with respect to NT Control b (mean ± SEM, n = 3). Control NT vs GD NT and GD NT vs GD incubated with Carmofur, t‐test. *P < 0.05, **P < 0.01, ***P < 0.001, ****P < 0.0001.
Fig. S11 Exogenous GlcSph treatment activates mTOR and causes lysosomal depletion in WT neurons. WT Control b (A) and Control c (B) neurons were either left untreated (NT) or incubated with GlcSph as described in Materials and Methods. After incubation, the neurons were stained with Lysotracker (A, red), and with antibodies to p‐mTOR (B, green), LAMP1 (B, red), and MAP2 (A and B, magenta) as indicated in the figure. Nuclei were stained with DAPI (blue). Magnification 40x. Scale bar, 25 μm. The graphs below images represent fold‐change in Lysotracker counts, and LAMP1 and p‐mTOR MFI compared to the respective untreated Controls (mean ± SEM, n = 4). NT vs GlcSph, t‐test. *P < 0.05, ****P < 0.0001.
Fig. S12 mTOR inhibitors prevent mTOR hyperactivation and rescue lysosomal biogenesis in GD2 neuronal cells. (A) Control a and GD2a NPCs were either left untreated (NT) or incubated with the mTOR inhibitors INK128 or Torin1, followed by staining with Lysotracker (red, top panel), antibodies to p‐S6 (green, bottom panel), and with DAPI (blue). Magnification 40x. Scale bar, 25 μm. The graphs on the right of the images represent fold‐change in Lysotracker count and p‐S6 MFI compared to untreated Control a (mean ± SEM, n = 4, t‐test). (B) GD2a neurons were either left untreated (NT) or were incubated with INK128 for 24 hours as described in Materials and Methods. The cultures were then stained with Lysotracker (red), p‐S6 (green), MAP2 (magenta) and with DAPI (nuclei, blue). Magnification 40x. Scale bar, 25 μm. Fold‐change in Lysotracker count and p‐S6 MFI compared to the untreated GD2 is plotted on the right (mean ± SEM, n = 3, t‐test). (C) Representative immunoblot of LAMP1 from GD2a neurons that were either left untreated (NT) or incubated with the mTOR inhibitors INK128 and Torin1 as described above. The graph next to the immunoblot is a quantitation of LAMP1 expressed as fold‐change with respect to the untreated GD2 (mean ± SEM, n = 3, One‐way ANOVA). **P < 0.01, ***P < 0.001, ****P < 0.0001.
Fig. S13 Increased Annexin V staining in GD2 neurons, and in WT neurons treated with GlcSph. GD2 and WT NPCs were differentiated to neurons for 6 weeks. WT neurons were either left untreated (NT) or incubated with the indicated concentrations of GlcSph for 7 hours, whereas GD2 neurons were either left untreated (NT) or incubated with INK128 (1 nM) during the last 14 days of differentiation. The neurons were then stained with antibodies to Annexin V (green) and MAP2 (magenta). Nuclei were stained with DAPI (blue). The stained cells were analyzed by confocal microscopy. Magnification 40x. Scale bar, 50 μm. Fold‐change in mean fluorescence intensity (MFI) of Annexin V is plotted below the images (mean ± SEM, n = 3‐5, Students t‐test between the indicated groups).
Supplementary Table 1 List of hiPSC lines used in the study
Supplementary Table 2 Sphingolipid Standards
Supplementary Table 3 Sphingolipid SRM precursor to product ion transitions
ACKNOWLEDGMENT
This work was supported by grants from the Maryland Stem Cell Research Fund (MSCRF) #2018‐MSCRFD‐4246 (R.A.F.), #2019‐MSCRFD‐5037 (O.A.), and from the Children's Gaucher Research Fund (R.A.F.).
Srikanth MP, Jones JW, Kane M, et al. Elevated glucosylsphingosine in Gaucher disease induced pluripotent stem cell neurons deregulates lysosomal compartment through mammalian target of rapamycin complex 1. STEM CELLS Transl Med. 2021;10:1081–1094. 10.1002/sctm.20-0386
Funding information Children's Gaucher Research Fund; Maryland Stem Cell Research Fund (MSCRF), Grant/Award Numbers: 2019‐MSCRFD‐5037, 2018‐MSCRFD‐4246
DATA AVAILABILITY STATEMENT
All the data used for this study are presented in the main manuscript or in the Supporting Information.
REFERENCES
- 1. Farfel‐Becker T, Vitner EB, Kelly SL, et al. Neuronal accumulation of glucosylceramide in a mouse model of neuronopathic Gaucher disease leads to neurodegeneration. Hum Mol Genet. 2014;23(4):843‐854. [DOI] [PMC free article] [PubMed] [Google Scholar]
- 2. Nilsson O, Svennerholm L. Accumulation of glucosylceramide and glucosylsphingosine (psychosine) in cerebrum and cerebellum in infantile and juvenile Gaucher disease. J Neurochem. 1982;39(3):709‐718. [DOI] [PubMed] [Google Scholar]
- 3. Hallett PJ, Huebecker M, Brekk OR, et al. Glycosphingolipid levels and glucocerebrosidase activity are altered in normal aging of the mouse brain. Neurobiol Aging. 2018;67:189‐200. [DOI] [PMC free article] [PubMed] [Google Scholar]
- 4. Orvisky E, Sidransky E, McKinney CE, et al. Glucosylsphingosine accumulation in mice and patients with type 2 Gaucher disease begins early in gestation. Pediatr Res. 2000;48(2):233‐237. [DOI] [PubMed] [Google Scholar]
- 5. Sidransky E. Gaucher disease: complexity in a "simple" disorder. Mol Genet Metab. 2004;83(1‐2):6‐15. [DOI] [PubMed] [Google Scholar]
- 6. Mistry PK, Lopez G, Schiffmann R, Barton NW, Weinreb NJ, Sidransky E. Gaucher disease: progress and ongoing challenges. Mol Genet Metab. 2017;120(1‐2):8‐21. [DOI] [PMC free article] [PubMed] [Google Scholar]
- 7. Futerman AH, van Meer G. The cell biology of lysosomal storage disorders. Nat Rev Mol Cell Biol. 2004;5(7):554‐565. [DOI] [PubMed] [Google Scholar]
- 8. Frohbergh M, He X, Schuchman EH. The molecular medicine of acid ceramidase. Biol Chem. 2015;396(6‐7):759‐765. [DOI] [PubMed] [Google Scholar]
- 9. Ferraz MJ, Marques AR, Appelman MD, et al. Lysosomal glycosphingolipid catabolism by acid ceramidase: formation of glycosphingoid bases during deficiency of glycosidases. FEBS Lett. 2016;590(6):716‐725. [DOI] [PubMed] [Google Scholar]
- 10. Legler G. Glucosidases. Methods Enzymol. 1977;46:368‐381. [DOI] [PubMed] [Google Scholar]
- 11. Yamaguchi Y, Sasagasako N, Goto I, Kobayashi T. The synthetic pathway for glucosylsphingosine in cultured fibroblasts. J Biochem. 1994;116(3):704‐710. [DOI] [PubMed] [Google Scholar]
- 12. Balestrino R, Schapira AHV. Glucocerebrosidase and Parkinson disease: molecular, clinical, and therapeutic implications. Neuroscientist. 2018;24(5):540‐559. [DOI] [PubMed] [Google Scholar]
- 13. Ballabio A. Disease pathogenesis explained by basic science: lysosomal storage diseases as autophagocytic disorders. Int J Clin Pharmacol Ther. 2009;47(suppl 1):S34‐S38. [DOI] [PubMed] [Google Scholar]
- 14. Du TT, Wang L, Duan CL, et al. GBA deficiency promotes SNCA/alpha‐synuclein accumulation through autophagic inhibition by inactivated PPP2A. Autophagy. 2015;11(10):1803‐1820. [DOI] [PMC free article] [PubMed] [Google Scholar]
- 15. Kilpatrick K, Zeng Y, Hancock T, Segatori L. Genetic and chemical activation of TFEB mediates clearance of aggregated alpha‐synuclein. PLoS One. 2015;10(3):e0120819. [DOI] [PMC free article] [PubMed] [Google Scholar]
- 16. Moors T, Paciotti S, Chiasserini D, et al. Lysosomal dysfunction and alpha‐synuclein aggregation in Parkinson's disease: diagnostic links. Mov Disord. 2016;31(6):791‐801. [DOI] [PubMed] [Google Scholar]
- 17. Nixon RA. The role of autophagy in neurodegenerative disease. Nat Med. 2013;19(8):983‐997. [DOI] [PubMed] [Google Scholar]
- 18. Sun Y, Grabowski GA. Impaired autophagosomes and lysosomes in neuronopathic Gaucher disease. Autophagy. 2010;6(5):648‐649. [DOI] [PubMed] [Google Scholar]
- 19. Schondorf DC, Aureli M, McAllister FE, et al. iPSC‐derived neurons from GBA1‐associated Parkinson's disease patients show autophagic defects and impaired calcium homeostasis. Nat Commun. 2014;5:4028. [DOI] [PubMed] [Google Scholar]
- 20. Awad O, Sarkar C, Panicker LM, et al. Altered TFEB‐mediated lysosomal biogenesis in Gaucher disease iPSC‐derived neuronal cells. Hum Mol Genet. 2015;24(20):5775‐5788. [DOI] [PubMed] [Google Scholar]
- 21. Brown RA, Voit A, Srikanth MP, et al. mTOR hyperactivity mediates lysosomal dysfunction in Gaucher's disease iPSC‐neuronal cells. Dis Model Mech. 2019;12(10):dmm038596. [DOI] [PMC free article] [PubMed] [Google Scholar]
- 22. Martina JA, Chen Y, Gucek M, Puertollano R. MTORC1 functions as a transcriptional regulator of autophagy by preventing nuclear transport of TFEB. Autophagy. 2012;8(6):903‐914. [DOI] [PMC free article] [PubMed] [Google Scholar]
- 23. Menon D, Salloum D, Bernfeld E, et al. Lipid sensing by mTOR complexes via de novo synthesis of phosphatidic acid. J Biol Chem. 2017;292(15):6303‐6311. [DOI] [PMC free article] [PubMed] [Google Scholar]
- 24. Rabanal‐Ruiz Y, Korolchuk VI. mTORC1 and nutrient homeostasis: the central role of the lysosome. Int J Mol Sci. 2018;19(3):818. [DOI] [PMC free article] [PubMed] [Google Scholar]
- 25. Settembre C, Zoncu R, Medina DL, et al. A lysosome‐to‐nucleus signalling mechanism senses and regulates the lysosome via mTOR and TFEB. EMBO J. 2012;31(5):1095‐1108. [DOI] [PMC free article] [PubMed] [Google Scholar]
- 26. Yasuda M, Tanaka Y, Kume S, et al. Fatty acids are novel nutrient factors to regulate mTORC1 lysosomal localization and apoptosis in podocytes. Biochim Biophys Acta. 2014;1842(7):1097‐1108. [DOI] [PubMed] [Google Scholar]
- 27. Zoncu R, Bar‐Peled L, Efeyan A, Wang S, Sancak Y, Sabatini DM. mTORC1 senses lysosomal amino acids through an inside‐out mechanism that requires the vacuolar H(+)‐ATPase. Science. 2011;334(6056):678‐683. [DOI] [PMC free article] [PubMed] [Google Scholar]
- 28. Liu GY, Sabatini DM. mTOR at the nexus of nutrition, growth, ageing and disease. Nat Rev Mol Cell Biol. 2020;21(4):183‐203. [DOI] [PMC free article] [PubMed] [Google Scholar]
- 29. Guri Y, Colombi M, Dazert E, et al. mTORC2 promotes tumorigenesis via lipid synthesis. Cancer Cell. 2017;32(6):807‐823. [DOI] [PubMed] [Google Scholar]
- 30. Jacinto E, Loewith R, Schmidt A, et al. Mammalian TOR complex 2 controls the actin cytoskeleton and is rapamycin insensitive. Nat Cell Biol. 2004;6(11):1122‐1128. [DOI] [PubMed] [Google Scholar]
- 31. Kim LC, Cook RS, Chen J. mTORC1 and mTORC2 in cancer and the tumor microenvironment. Oncogene. 2017;36(16):2191‐2201. [DOI] [PMC free article] [PubMed] [Google Scholar]
- 32. Masui K, Harachi M, Cavenee WK, Mischel PS, Shibata N. mTOR complex 2 is an integrator of cancer metabolism and epigenetics. Cancer Lett. 2020;478:1‐7. [DOI] [PubMed] [Google Scholar]
- 33. Sarbassov DD, Guertin DA, Ali SM, Sabatini DM. Phosphorylation and regulation of Akt/PKB by the rictor‐mTOR complex. Science. 2005;307(5712):1098‐1101. [DOI] [PubMed] [Google Scholar]
- 34. Saxton RA, Sabatini DM. mTOR signaling in growth, metabolism, and disease. Cell. 2017;168(6):960‐976. [DOI] [PMC free article] [PubMed] [Google Scholar]
- 35. Yuan T, Lupse B, Maedler K, Ardestani A. mTORC2 signaling: a path for pancreatic beta cell's growth and function. J Mol Biol. 2018;430(7):904‐918. [DOI] [PubMed] [Google Scholar]
- 36. Napolitano G, Ballabio A. TFEB at a glance. J Cell Sci. 2016;129(13):2475‐2481. [DOI] [PMC free article] [PubMed] [Google Scholar]
- 37. Sardiello M, Palmieri M, di Ronza A, et al. A gene network regulating lysosomal biogenesis and function. Science. 2009;325(5939):473‐477. [DOI] [PubMed] [Google Scholar]
- 38. Panicker LM, Miller D, Awad O, et al. Gaucher iPSC‐derived macrophages produce elevated levels of inflammatory mediators and serve as a new platform for therapeutic development. Stem Cells. 2014;32(9):2338‐2349. [DOI] [PMC free article] [PubMed] [Google Scholar]
- 39. Panicker LM, Miller D, Park TS, et al. Induced pluripotent stem cell model recapitulates pathologic hallmarks of Gaucher disease. Proc Natl Acad Sci USA. 2012;109(44):18054‐18059. [DOI] [PMC free article] [PubMed] [Google Scholar]
- 40. Schindelin J, Arganda‐Carreras I, Frise E, et al. Fiji: an open‐source platform for biological‐image analysis. Nat Methods. 2012;9(7):676‐682. [DOI] [PMC free article] [PubMed] [Google Scholar]
- 41. Peng J, Gygi SP. Proteomics: the move to mixtures. J Mass Spectrom. 2001;36(10):1083‐1091. [DOI] [PubMed] [Google Scholar]
- 42. Peng B, Weintraub ST, Coman C, et al. A comprehensive high‐resolution targeted workflow for the deep profiling of sphingolipids. Anal Chem. 2017;89(22):12480‐12487. [DOI] [PubMed] [Google Scholar]
- 43. Cox TM. Eliglustat tartrate, an orally active glucocerebroside synthase inhibitor for the potential treatment of Gaucher disease and other lysosomal storage diseases. Curr Opin Investig Drugs. 2010;11(10):1169‐1181. [PubMed] [Google Scholar]
- 44. Lukina E, Watman N, Arreguin EA, et al. A phase 2 study of eliglustat tartrate (Genz‐112638), an oral substrate reduction therapy for Gaucher disease type 1. Blood. 2010;116(6):893‐899. [DOI] [PMC free article] [PubMed] [Google Scholar]
- 45. Mistry PK, Lukina E, Ben Turkia H, et al. Effect of oral eliglustat on splenomegaly in patients with Gaucher disease type 1: the ENGAGE randomized clinical trial. JAMA. 2015;313(7):695‐706. [DOI] [PMC free article] [PubMed] [Google Scholar]
- 46. Mistry PK, Lukina E, Ben Turkia H, et al. Outcomes after 18 months of eliglustat therapy in treatment‐naive adults with Gaucher disease type 1: the phase 3 ENGAGE trial. Am J Hematol. 2017;92(11):1170‐1176. [DOI] [PMC free article] [PubMed] [Google Scholar]
- 47. Marshall J, Sun Y, Bangari DS, et al. CNS‐accessible inhibitor of glucosylceramide synthase for substrate reduction therapy of neuronopathic Gaucher disease. Mol Ther. 2016;24(6):1019‐1029. [DOI] [PMC free article] [PubMed] [Google Scholar]
- 48. Judith Peterschmitt M, Gasser T, Isaacson S, et al. Safety, tolerability and pharmacokinetics of oral venglustat in Parkinson disease patients with a GBA mutation. Mol Genet Metab. 2019;126(2):S117. [Google Scholar]
- 49. Sardi SP, Viel C, Clarke J, et al. Glucosylceramide synthase inhibition alleviates aberrations in synucleinopathy models. Proc Natl Acad Sci USA. 2017;114(10):2699‐2704. [DOI] [PMC free article] [PubMed] [Google Scholar]
- 50. Fernandes HJ, Hartfield EM, Christian HC, et al. ER stress and autophagic perturbations lead to elevated extracellular alpha‐synuclein in GBA‐N370S Parkinson's iPSC‐derived dopamine neurons. Stem Cell Reports. 2016;6(3):342‐356. [DOI] [PMC free article] [PubMed] [Google Scholar]
- 51. Maor G, Rencus‐Lazar S, Filocamo M, Steller H, Segal D, Horowitz M. Unfolded protein response in Gaucher disease: from human to Drosophila . Orphanet J Rare Dis. 2013;8:140. [DOI] [PMC free article] [PubMed] [Google Scholar]
- 52. Suzuki T, Shimoda M, Ito K, et al. Expression of human Gaucher disease gene GBA generates neurodevelopmental defects and ER stress in Drosophila eye. PLoS One. 2013;8(8):e69147. [DOI] [PMC free article] [PubMed] [Google Scholar]
- 53. Vitner EB, Platt FM, Futerman AH. Common and uncommon pathogenic cascades in lysosomal storage diseases. J Biol Chem. 2010;285(27):20423‐20427. [DOI] [PMC free article] [PubMed] [Google Scholar]
- 54. Wu K, Xiu Y, Zhou P, Qiu Y, Li YA. New use for an old drug: carmofur attenuates lipopolysaccharide (LPS)‐induced acute lung injury via inhibition of FAAH and NAAA activities. Front Pharmacol. 2019;10:818. [DOI] [PMC free article] [PubMed] [Google Scholar]
- 55. Taguchi YV, Liu J, Ruan J, et al. Glucosylsphingosine promotes alpha‐synuclein pathology in mutant GBA‐associated Parkinson's disease. J Neurosci. 2017;37(40):9617‐9631. [DOI] [PMC free article] [PubMed] [Google Scholar]
- 56. Klionsky DJ, Abdelmohsen K, Abe A, et al. Guidelines for the use and interpretation of assays for monitoring autophagy (3rd edition). Autophagy. 2016;12(1):1‐222. [DOI] [PMC free article] [PubMed] [Google Scholar]
- 57. Yoshimori T, Yamamoto A, Moriyama Y, Futai M, Tashiro Y. Bafilomycin A1, a specific inhibitor of vacuolar‐type H(+)‐ATPase, inhibits acidification and protein degradation in lysosomes of cultured cells. J Biol Chem. 1991;266(26):17707‐17712. [PubMed] [Google Scholar]
- 58. Finkbeiner S. The autophagy lysosomal pathway and neurodegeneration. Cold Spring Harb Perspect Biol. 2020;12(3):a033993. [DOI] [PMC free article] [PubMed] [Google Scholar]
- 59. Martini‐Stoica H, Xu Y, Ballabio A, Zheng H. The autophagy‐lysosomal pathway in neurodegeneration: a TFEB perspective. Trends Neurosci. 2016;39(4):221‐234. [DOI] [PMC free article] [PubMed] [Google Scholar]
- 60. Murugesan V, Chuang WL, Liu J, et al. Glucosylsphingosine is a key biomarker of Gaucher disease. Am J Hematol. 2016;91(11):1082‐1089. [DOI] [PMC free article] [PubMed] [Google Scholar]
- 61. Lukas J, Cozma C, Yang F, et al. Glucosylsphingosine causes hematological and visceral changes in mice‐evidence for a pathophysiological role in Gaucher disease. Int J Mol Sci. 2017;18(10):2192. [DOI] [PMC free article] [PubMed] [Google Scholar]
- 62. Rolfs A, Giese AK, Grittner U, et al. Glucosylsphingosine is a highly sensitive and specific biomarker for primary diagnostic and follow‐up monitoring in Gaucher disease in a non‐Jewish, Caucasian cohort of Gaucher disease patients. PLoS One. 2013;8(11):e79732. [DOI] [PMC free article] [PubMed] [Google Scholar]
- 63. Magalhaes J, Gegg ME, Migdalska‐Richards A, Doherty MK, Whitfield PD, Schapira AH. Autophagic lysosome reformation dysfunction in glucocerebrosidase deficient cells: relevance to Parkinson disease. Hum Mol Genet. 2016;25(16):3432‐3445. [DOI] [PMC free article] [PubMed] [Google Scholar]
- 64. Blumenreich S, Barav OB, Jenkins BJ, Futerman AH. Lysosomal storage disorders shed light on lysosomal dysfunction in Parkinson's disease. Int J Mol Sci. 2020;21(14):4966. [DOI] [PMC free article] [PubMed] [Google Scholar]
- 65. Chu Y, Dodiya H, Aebischer P, Olanow CW, Kordower JH. Alterations in lysosomal and proteasomal markers in Parkinson's disease: relationship to alpha‐synuclein inclusions. Neurobiol Dis. 2009;35(3):385‐398. [DOI] [PubMed] [Google Scholar]
- 66. Dehay B, Bové J, Rodríguez‐Muela N, et al. Pathogenic lysosomal depletion in Parkinson's disease. J Neurosci. 2010;30(37):12535‐12544. [DOI] [PMC free article] [PubMed] [Google Scholar]
- 67. Mistry PK, Liu J, Sun L, et al. Glucocerebrosidase 2 gene deletion rescues type 1 Gaucher disease. Proc Natl Acad Sci USA. 2014;111(13):4934‐4939. [DOI] [PMC free article] [PubMed] [Google Scholar]
- 68. Schonauer S, Korschen HG, Penno A, et al. Identification of a feedback loop involving beta‐glucosidase 2 and its product sphingosine sheds light on the molecular mechanisms in Gaucher disease. J Biol Chem. 2017;292(15):6177‐6189. [DOI] [PMC free article] [PubMed] [Google Scholar]
- 69. Li Y, Xu Y, Benitez BA, et al. Genetic ablation of acid ceramidase in Krabbe disease confirms the psychosine hypothesis and identifies a new therapeutic target. Proc Natl Acad Sci USA. 2019;116(40):20097‐20103. [DOI] [PMC free article] [PubMed] [Google Scholar]
- 70. Miyatake T, Suzuki K. Globoid cell leukodystrophy: additional deficiency of psychosine galactosidase. Biochem Biophys Res Commun. 1972;48(3):539‐543. [DOI] [PubMed] [Google Scholar]
- 71. Cleland WW, Kennedy EP. The enzymatic synthesis of psychosine. J Biol Chem. 1960;235:45‐51. [PubMed] [Google Scholar]
- 72. Kim MJ, Jeon S, Burbulla LF, Krainc D. Acid ceramidase inhibition ameliorates alpha‐synuclein accumulation upon loss of GBA1 function. Hum Mol Genet. 2018;27(11):1972‐1988. [DOI] [PMC free article] [PubMed] [Google Scholar]
- 73. Mazzulli JR, Xu YH, Sun Y, et al. Gaucher disease glucocerebrosidase and alpha‐synuclein form a bidirectional pathogenic loop in synucleinopathies. Cell. 2011;146(1):37‐52. [DOI] [PMC free article] [PubMed] [Google Scholar]
- 74. Zulueta Diaz YLM, Caby S, Bongarzone ER, Fanani ML. Psychosine remodels model lipid membranes at neutral pH. Biochim Biophys Acta Biomembr. 2018;1860(12):2515‐2526. [DOI] [PubMed] [Google Scholar]
- 75. Perera RM, Zoncu R. The lysosome as a regulatory hub. Annu Rev Cell Dev Biol. 2016;32:223‐253. [DOI] [PMC free article] [PubMed] [Google Scholar]
- 76. Sengupta S, Peterson TR, Sabatini DM. Regulation of the mTOR complex 1 pathway by nutrients, growth factors, and stress. Mol Cell. 2010;40(2):310‐322. [DOI] [PMC free article] [PubMed] [Google Scholar]
- 77. Castellano BM, Thelen AM, Moldavski O, et al. Lysosomal cholesterol activates mTORC1 via an SLC38A9‐Niemann‐Pick C1 signaling complex. Science. 2017;355(6331):1306‐1311. [DOI] [PMC free article] [PubMed] [Google Scholar]
- 78. Dasgupta N, Xu YH, Li R, et al. Neuronopathic Gaucher disease: dysregulated mRNAs and miRNAs in brain pathogenesis and effects of pharmacologic chaperone treatment in a mouse model. Hum Mol Genet. 2015;24(24):7031‐7048. [DOI] [PMC free article] [PubMed] [Google Scholar]
- 79. Kinghorn KJ, Grönke S, Castillo‐Quan JI, et al. A Drosophila model of neuronopathic Gaucher disease demonstrates lysosomal‐autophagic defects and altered mTOR signalling and is functionally rescued by rapamycin. J Neurosci. 2016;36(46):11654‐11670. [DOI] [PMC free article] [PubMed] [Google Scholar]
Associated Data
This section collects any data citations, data availability statements, or supplementary materials included in this article.
Supplementary Materials
Appendix S1: Supplementary File.
Fig. S1 Generation of human iPSC‐derived NPCs and neurons. (A) Schematic showing directed differentiation of GD2 hiPSCs to neuronal progenitor cells (NPCs) and neurons. (B and C) Representative immunofluorescence images of control a and GD2a NPCs stained with antibodies to Musashi (B, green) and Sox1 (C, green). The nuclei were stained with DAPI (blue). Magnification 20x. (D) Representative immunofluorescence images of control a and GD2a neurons stained with Tuj1 (green) antibody. The nuclei were stained with DAPI (blue). Magnification 60x.
Fig. S2 Ceramide and Sphingosine levels in mutant NPC are not significantly elevated compared to control NPCs. The control and mutant NPC samples listed in the legend to Figure 1 were analyzed by HPLC‐MS/MS for the indicated species of Ceramide (Cer) (A‐E) and Sphingosine (Sph) (F). The plots represent fold‐change compared to the untreated Control a (mean ± SEM, n = 3). Control NT vs GD NT and GD NT vs treated GD, t‐test. *P < 0.05, **P < 0.01, ns: non‐significant.
Fig. S3 GlcCer synthase inhibitors prevent mTOR hyperactivation in GD NPCs. NPCs derived from untreated Controls a and b, and from GD2a and GD3a NPC that were either left untreated (NT) or treated with GZ667161 (GZ), Ibiglustat (IBI), or Eliglustat (ELI) as described in Materials and Methods, were stained for p‐mTOR (A, green) and p‐S6 (B, green), and with DAPI (blue). Magnification 40x. Scale bar, 25 μm. Plots at the right of A and B represent fold‐change in MFI of p‐mTOR and p‐S6 compared to Control a (mean ± SEM, n = 3). (C) Representative immunoblots of p‐S6 and S6 in Control a NPCs (Con), and in NPCs from GD2a (upper blot) and GD3a (lower blot) that were treated with GZ667161, Ibiglustat, and Eliglustat as above. The graphs below each blot show a quantitation of the results, in which differences in protein levels were expressed as fold‐change with respect to Control a (mean ± SEM, n = 3 for Control; n = 4 for GD2 and GD3; data were compiled from two different hiPSC clones of GD2a and GD3a donors). Control NT vs GD NT, t‐test; GD NT vs treated GD, one‐way ANOVA. *P < 0.05, **P < 0.01, ***P < 0.001, ****P < 0.0001.
Fig. S4 GlcCer synthase inhibitors restore lysosomal biogenesis in nGD NPCs. NPCs derived from untreated Controls a and b, and from GD2a and GD3a NPC that were either left untreated (NT) or treated with GZ667161 (GZ), Ibiglustat (IBI) or Eliglustat (ELI) as described in Materials and Methods, were stained with Lysotracker (A, red), or with antibodies to LAMP1 (B, red). Nuclei were labeled with DAPI (blue). Magnification 40x. Scale bar, 25 μm. Plots at the right of A and B represent fold‐change in Lysotracker and LAMP1 counts, respectively. The differences are expressed as fold‐change compared to Control a (mean ± SEM, n = 3). Control NT vs GD NT, t‐test; GD NT vs treated GD, one‐way ANOVA. (C) Representative immunoblots of LAMP1 in NPCs from GD2a (upper blot) and GD3a (lower blot) that were treated with GZ667161, Ibiglustat, and Eliglustat as above. The graphs below each blot are a quantitation of LAMP1 expressed as fold‐change with respect to the corresponding untreated GD2 or GD3 values (mean ± SEM, n = 2, One‐way ANOVA). *P < 0.05, **P < 0.01, ***P < 0.001, ****P < 0.0001.
Fig. S5 GlcCer synthase inhibitors reverse mTOR hyperactivity and prevent lysosomal depletion in nGD neurons. (A) Differentiated WT (Control a) neurons, and GD2a neurons were either left untreated (NT), or treated with GZ667161 (GZ), Ibiglustat (IBI), or Eliglustat (ELI) as described in Materials and Methods. The cultures were then stained with Lysotracker (red), with antibodies to the neuronal marker MAP2 (magenta), and with DAPI (blue). (B) WT (Control a) neurons, and GD2a neurons that were either left untreated (NT) or treated as in A, above, were stained with antibodies to p‐mTOR (green), LAMP1 (red), MAP2 (magenta), and with DAPI (blue). For A and B: Magnification 40x. Scale bar, 25 μm. The plots at the right represent fold‐change in counts of Lysotracker puncti, and MFI of p‐mTOR and LAMP1 as indicated (mean ± SEM, n = 3). Control NT vs GD NT, t‐test; GD NT vs treated GD, one‐way ANOVA. *P < 0.05, **P < 0.01, ***P < 0.001, ****P < 0.0001.
Fig. S6 GlcCer synthase inhibitors reverse mTOR hyperactivity and prevent lysosomal depletion in nGD neurons. (A) Representative Western blots of p‐S6 and p‐4EBP1 in Control a neurons, and in GD2a neurons that were either left untreated (NT) or treated with GZ667161 (GZ), Ibiglustat (IBI), or Eliglustat (ELI) as described in Materials and Methods. In the graphs below the blot, p‐S6 and p‐4EBP1 levels are expressed as fold‐change compared to Control a (mean ± SEM, n = 3 for Control a and n = 4 for GD2a: data were compiled from neurons derived from 2 different hiPSC clones from the GD2a donor). (B) Western blots of p‐mTOR and p‐4EBP1 in Control a neurons, and in GD2b neurons treated as in A, above. In the graphs below, p‐mTOR and p‐4EBP1 levels are expressed as fold‐change compared to Control a (mean ± SEM, n = 3 for Control a and n = 4 for GD2b: data were compiled from neurons derived from 2 different hiPSC clones from the GD2b donor). Control NT vs GD NT, t‐test; GD NT vs treated GD, one‐way ANOVA. *P < 0.05, **P < 0.01, ***P < 0.001, ****P < 0.0001.
Fig. S7 Treatment of WT NPCs with CBE recapitulates the phenotypes seen in nGD neurons. (A‐C) HPLC‐MS/MS analysis of WT NPCs (Controls a, b and c) showing the levels of GlcSph, GlcCer, Cer and Sph in untreated (NT) or CBE‐treated conditions. Data are represented as fold‐change compared to NT for every lipid (mean ± SEM; n = 3 for Control a and b, n = 2 for Control c; t‐test; *P < 0.05, **P < 0.01 and ***P < 0.001, ns: non‐significant). (D) Lysotracker staining (red) of WT NPCs that were either left untreated or incubated with CBE as described in Materials and Methods. Nuclei are stained with DAPI (blue). Magnification 40x. Scale bar, 25 μm. Fold‐change in Lysotracker counts is plotted at the right of images (mean ± SEM, n = 3, t‐test; *P < 0.05, **P < 0.01).
Fig. S8 Treatment of WT neurons with CBE recapitulates mTOR hyperactivation and lysosomal depletion observed in GD neurons. (A) Control a and b (Con a and Con b) neurons that were either left untreated (NT) or incubated with CBE were stained with antibodies to p‐mTOR (green), LAMP1 (red), MAP2 (magenta), and with DAPI. (B). Control a and b neurons treated as above were stained with antibodies to p‐S6 (green), MAP2 (magenta), with Lysotracker (red), and with DAPI (blue). For A and B: Magnification 40x, Scale bar, 25 μm. (C) Left panel, quantitation of the images for Control a; Right panel, quantitation of the images for Control b. Fold‐change in Lysotracker counts, and in p‐mTOR, LAMP1, and p‐S6 MFI was calculated as described in Materials and Methods and plotted as mean ± SEM (n = 4). NT vs CBE, t‐test. *P < 0.05, **P < 0.01, ***P < 0.001, ****P < 0.0001.
Fig. S9 CBE treatment of WT neurons activates mTORC1. Immunoblot analysis of phosphorylated and total levels of mTOR, S6 and 4EBP1, in Control a (A), Control b (B), and Control c (C) neurons that were either left untreated (NT) or treated with CBE as described in Materials and Methods. The graphs below each immunoblot represent fold‐change in protein levels compared to the corresponding untreated Controls (mean ± SEM, n = 3). NT vs CBE, t‐test. *P < 0.05, **P < 0.01.
Fig. S10 Carmofur treatment reverses the mTOR/lysosomal phenotype in nGD NPCs and differentiated neurons. (A and B) Immunofluorescence staining of LAMP1 (A, red) and p‐mTOR (B, green) in Control a, GD2a and GD3a NPCs that were either left untreated (NT) or incubated with Carmofur (CAR) as described in Materials and Methods. The graphs next to the images in B represent quantitation of LAMP1 puncti (upper plot) and p‐mTOR MFI (lower plot) (mean ± SEM, n = 3). (C) Lysotracker (red), MAP2 (magenta), and DAPI (blue) staining of Control b, and GD3a differentiated neurons that were either left untreated or incubated with Carmofur. Graph at the right of images in C represents fold‐change of Lysotracker counts compared to untreated Control b (mean ± SEM, n = 3). For A, B and C: Magnification 40x. Scale bar, 25 μm. (D) Representative Western blot showing the levels of p‐mTOR, mTOR, p‐S6 and S6 in WT (Control b), and GD3a differentiated neurons that were either left untreated or incubated with Carmofur as above. The graphs to the right of WB represent fold‐change with respect to NT Control b (mean ± SEM, n = 3). Control NT vs GD NT and GD NT vs GD incubated with Carmofur, t‐test. *P < 0.05, **P < 0.01, ***P < 0.001, ****P < 0.0001.
Fig. S11 Exogenous GlcSph treatment activates mTOR and causes lysosomal depletion in WT neurons. WT Control b (A) and Control c (B) neurons were either left untreated (NT) or incubated with GlcSph as described in Materials and Methods. After incubation, the neurons were stained with Lysotracker (A, red), and with antibodies to p‐mTOR (B, green), LAMP1 (B, red), and MAP2 (A and B, magenta) as indicated in the figure. Nuclei were stained with DAPI (blue). Magnification 40x. Scale bar, 25 μm. The graphs below images represent fold‐change in Lysotracker counts, and LAMP1 and p‐mTOR MFI compared to the respective untreated Controls (mean ± SEM, n = 4). NT vs GlcSph, t‐test. *P < 0.05, ****P < 0.0001.
Fig. S12 mTOR inhibitors prevent mTOR hyperactivation and rescue lysosomal biogenesis in GD2 neuronal cells. (A) Control a and GD2a NPCs were either left untreated (NT) or incubated with the mTOR inhibitors INK128 or Torin1, followed by staining with Lysotracker (red, top panel), antibodies to p‐S6 (green, bottom panel), and with DAPI (blue). Magnification 40x. Scale bar, 25 μm. The graphs on the right of the images represent fold‐change in Lysotracker count and p‐S6 MFI compared to untreated Control a (mean ± SEM, n = 4, t‐test). (B) GD2a neurons were either left untreated (NT) or were incubated with INK128 for 24 hours as described in Materials and Methods. The cultures were then stained with Lysotracker (red), p‐S6 (green), MAP2 (magenta) and with DAPI (nuclei, blue). Magnification 40x. Scale bar, 25 μm. Fold‐change in Lysotracker count and p‐S6 MFI compared to the untreated GD2 is plotted on the right (mean ± SEM, n = 3, t‐test). (C) Representative immunoblot of LAMP1 from GD2a neurons that were either left untreated (NT) or incubated with the mTOR inhibitors INK128 and Torin1 as described above. The graph next to the immunoblot is a quantitation of LAMP1 expressed as fold‐change with respect to the untreated GD2 (mean ± SEM, n = 3, One‐way ANOVA). **P < 0.01, ***P < 0.001, ****P < 0.0001.
Fig. S13 Increased Annexin V staining in GD2 neurons, and in WT neurons treated with GlcSph. GD2 and WT NPCs were differentiated to neurons for 6 weeks. WT neurons were either left untreated (NT) or incubated with the indicated concentrations of GlcSph for 7 hours, whereas GD2 neurons were either left untreated (NT) or incubated with INK128 (1 nM) during the last 14 days of differentiation. The neurons were then stained with antibodies to Annexin V (green) and MAP2 (magenta). Nuclei were stained with DAPI (blue). The stained cells were analyzed by confocal microscopy. Magnification 40x. Scale bar, 50 μm. Fold‐change in mean fluorescence intensity (MFI) of Annexin V is plotted below the images (mean ± SEM, n = 3‐5, Students t‐test between the indicated groups).
Supplementary Table 1 List of hiPSC lines used in the study
Supplementary Table 2 Sphingolipid Standards
Supplementary Table 3 Sphingolipid SRM precursor to product ion transitions
Data Availability Statement
All the data used for this study are presented in the main manuscript or in the Supporting Information.