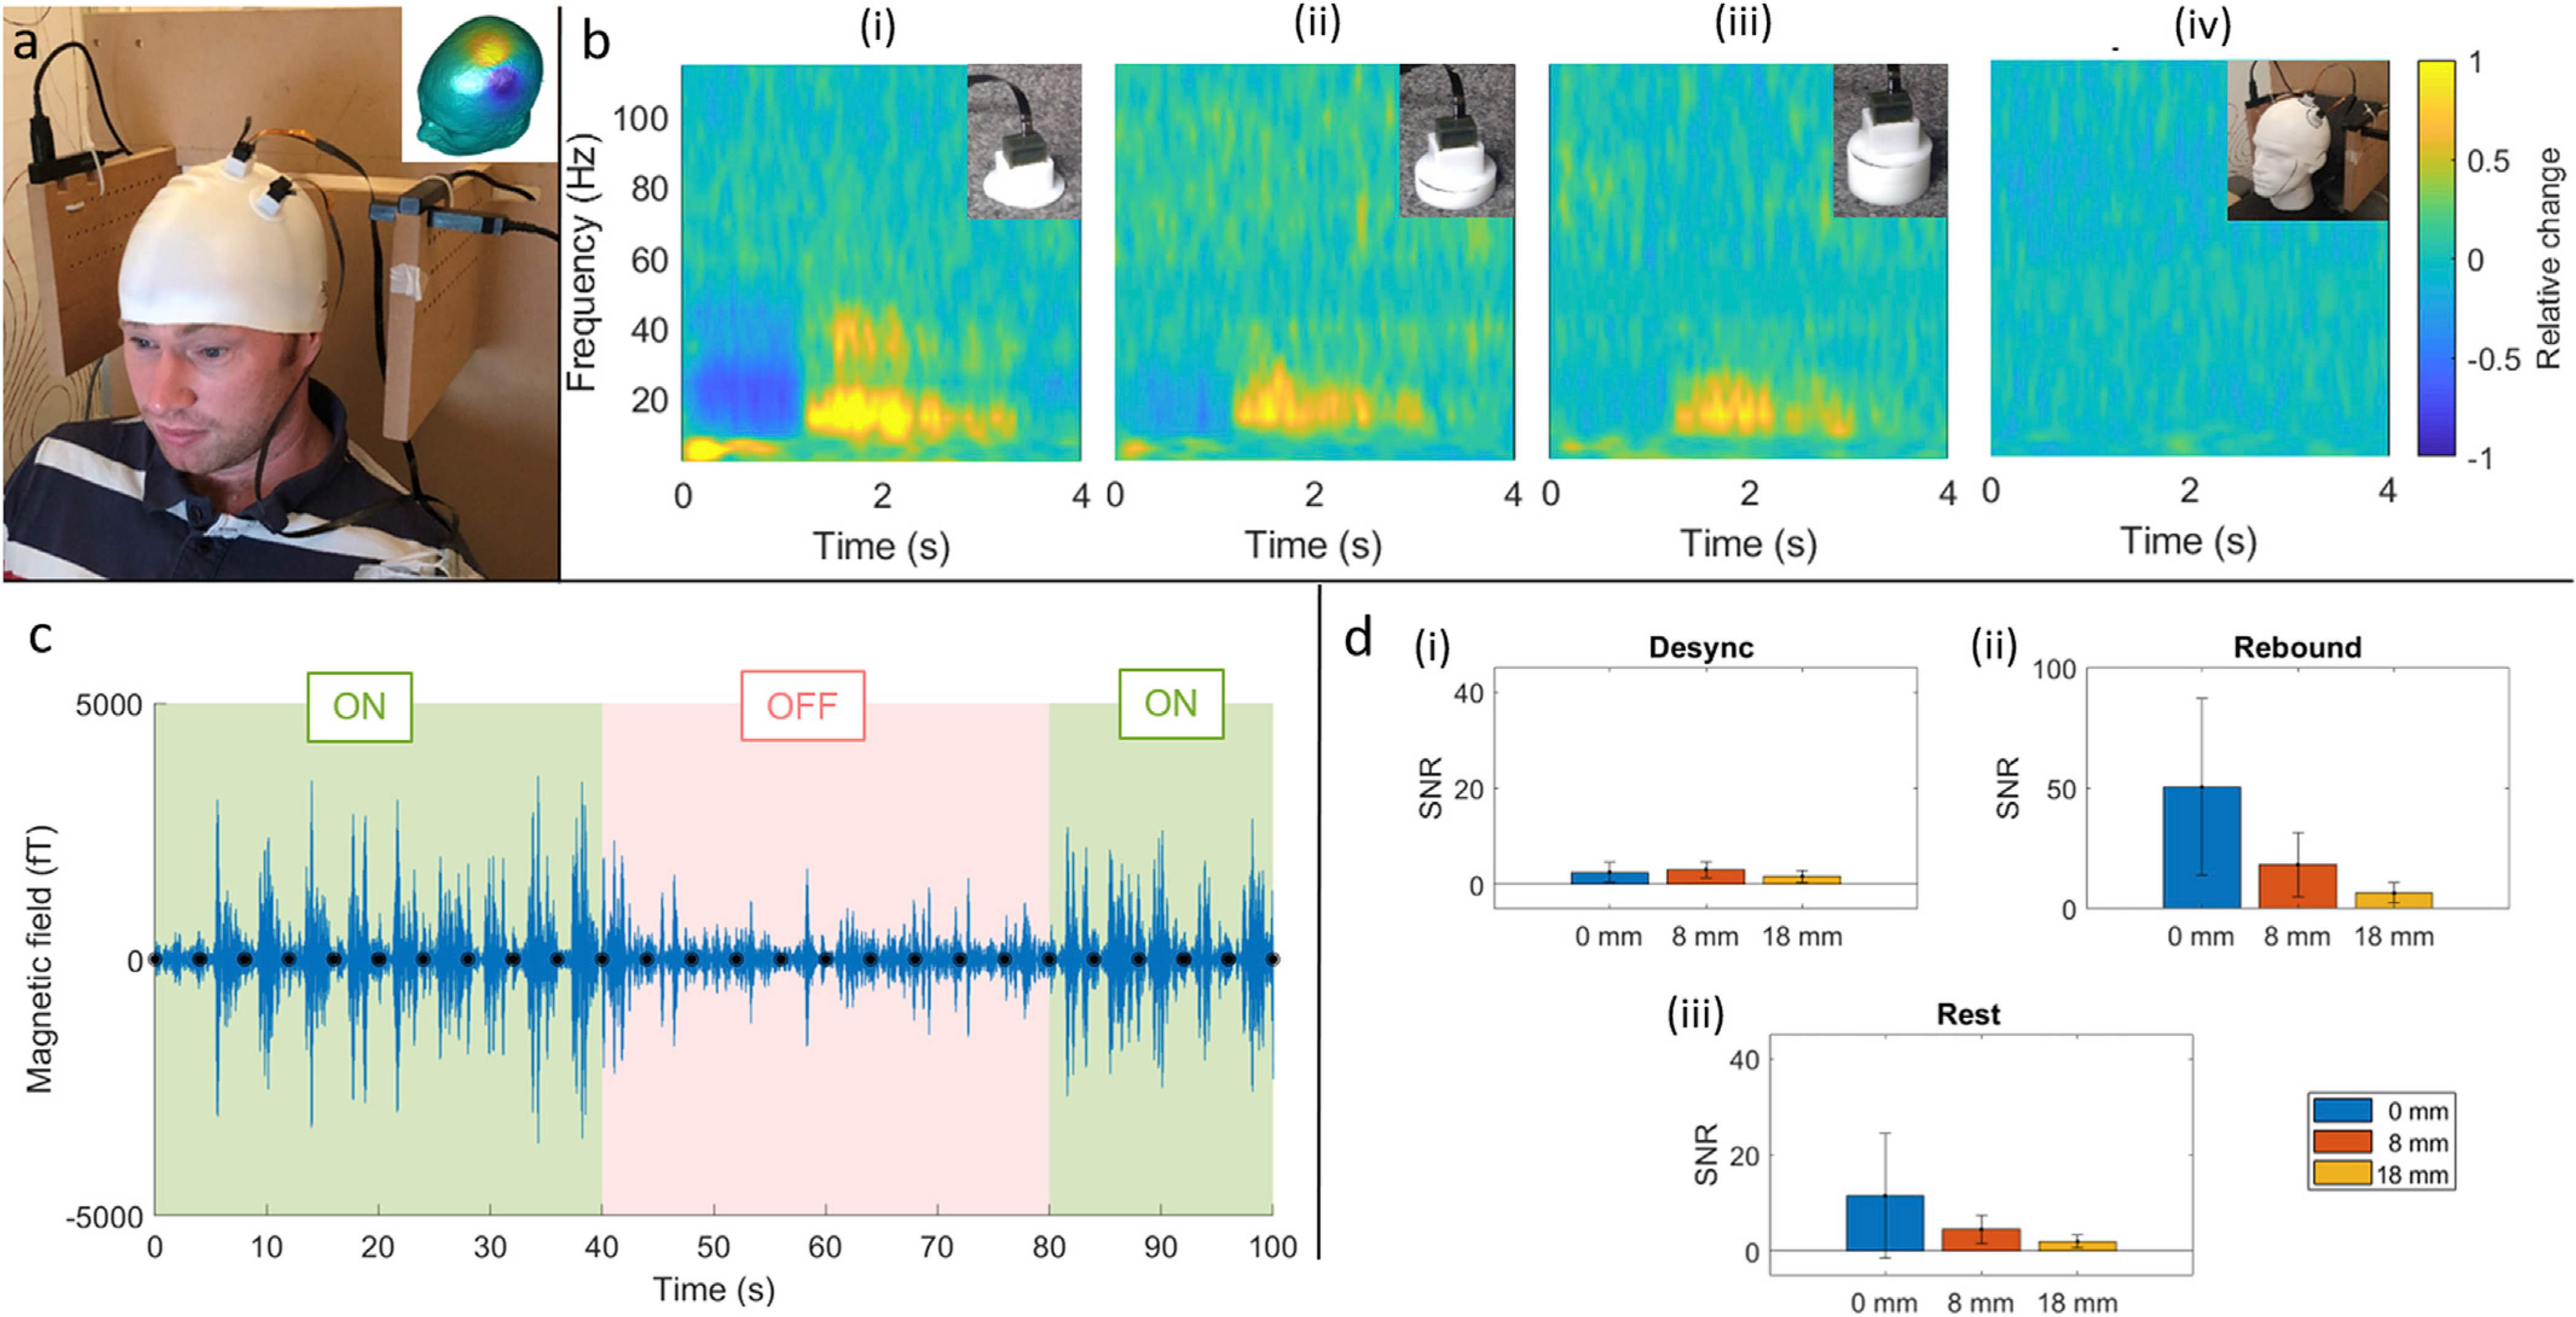
Fig. 2. Beta-band responses in primary motor cortex.

a) Experimental set-up; the Gen-2 OPMs were positioned on the scalp based on a field map from a previous cryogenic MEG experiment, which is shown inset. The 4 Gen-1 OPMs used in the reference array can be seen around the subject. b) TFSs showing oscillatory modulation with the sensors mounted at distances of 0 mm (i), 8 mm (ii) and 18 mm (iii) from the scalp surface. (iv) shows a phantom measurement for comparison. All results are extracted from a planar gradiometer formulation of the two sensors. c) Representative single-trial beta responses during task (green) and rest (pink) blocks. Note that the task blocks contains ten trials of finger abduction (marked with black circles). d) Quantification of the (single-trial) SNR during the movement-induced beta-band decrease (i), the beta rebound (ii) and at rest, i.e. resting beta-band level (iii). For magnetometer data, see Supplementary Material.
