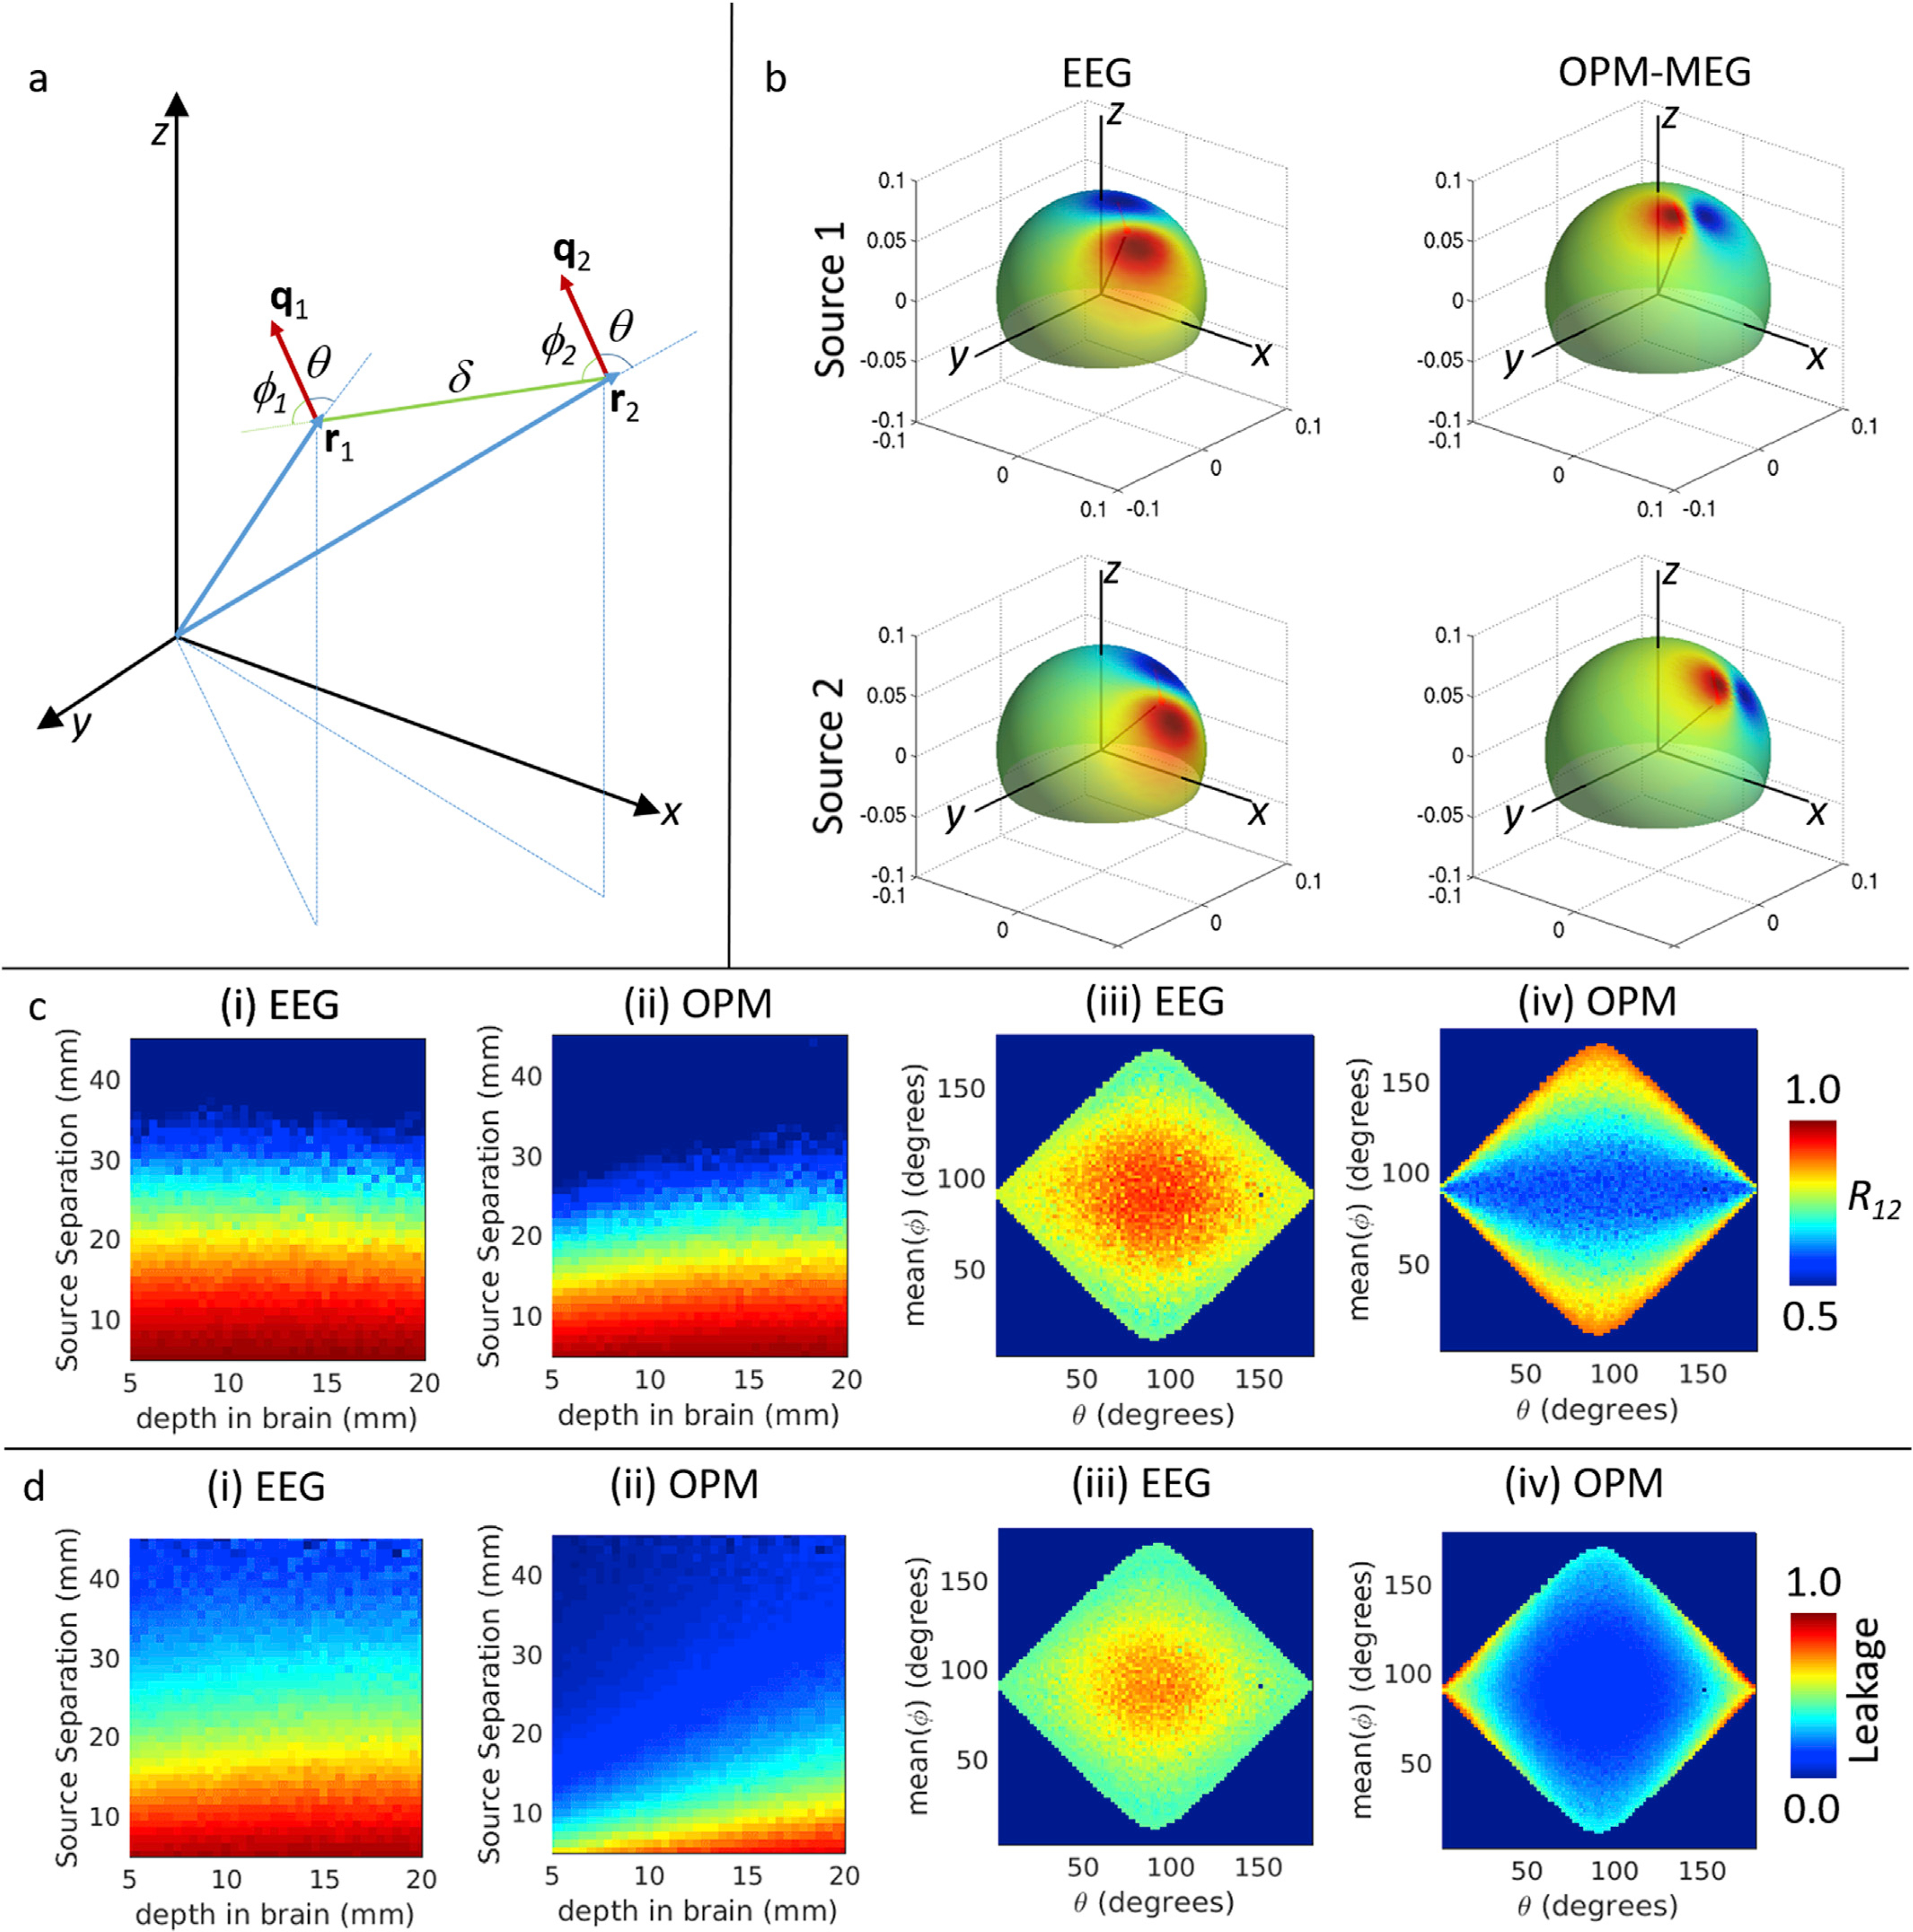
Fig. 8. Spatial resolution simulations.

a) Schematic diagram showing the two simulated sources. b) Example forward fields simulated for EEG (left) and OPM-MEG (right). Blue lines show source positions (r1 and r2 in (a)); red lines show source orientations (q1 and q2 in (a)). b) Upper plots show source 1, lower plots show source 2. Notice that in EEG field patterns are made diffuse by the low conductivity of the skull. However, field patterns measurable using OPM-MEG contain higher spatial frequencies. c) Parametric variation of spatial correlation of forward fields for sources 1 and 2 (i.e. R12). Left two panels show variation with source depth separation, for EEG (i) and OPM-MEG (ii). Right 2 panels show variation with θ (mean angle to radial) and φ. d) Parametric variation of estimated leakage (i.e. Δ) between sources 1 and 2. Panels as in (c). (See also Supplementary Material for results on conventional MEG.).
