Abstract
Background: This meta-analysis aims to estimate the power of walking stride length as a predictor of adverse clinical events in older adults. Methods: We searched all electronic databases until April 2021 for studies reporting stride length and other spatial gait parameters, including stride velocity, stride width, step width and stride variability, and compared them with clinical outcomes in the elderly. Meta-analyses of odds ratios (ORs) of effects of stride length on clinical outcomes used the generic inverse variance method and random model effects. Clinical outcomes were major adverse events (MAEs), physical disability and mortality. Results: Eleven cohort studies with 14,167 patients (mean age 75.4 ± 5.6 years, 55.8% female) were included in the analysis. At 33.05 months follow up, 3839 (27%) patients had clinical adverse events. Baseline stride length was shorter, WMD −0.15 (−0.19 to −0.11, p < 0.001), and stride length variability was higher, WMD 0.67 (0.33 to 1.01, p < 0.001), in fallers compared to non-fallers. Other gait parameters were not different between the two groups (p > 0.05 for all). Short stride length predicted MAE OR 1.36 (95% CI; 1.19 to 1.55, p < 0.001), physical disability OR 1.26 (95% CI; 1.11 to 1.44, p = 0.004) and mortality OR 1.69 (95% CI; 1.41 to 2.02, p < 0.001). A baseline normalized stride length ≤ 0.64 m was more accurate in predicting adverse clinical events, with summary sensitivity 65% (58–71%), specificity 72% (69–75%) and accuracy 75.5% (74.2–76.7%) compared to stride length variability 5.7%, with summary sensitivity 66% (61–70%), specificity 56% (54–58%) and accuracy 57.1% (55.5–58.6%). Conclusion: The results of this meta-analyses support the significant value of stride length for predicting life-threatening clinical events in older adults. A short stride length of ≤0.64 m accurately predicted clinical events, over and above other gait measures.
Keywords: stride length, adverse clinical events, older adult
1. Introduction
Advances in medical management of patients with various conditions, particularly cardiovascular conditions, have resulted in a significant increase in longevity [1,2]. This older population may, however, be limited by other medical problems, including arthro-skeletal stiffness and its consequences, e.g., physical disability and falls, which may lead to a decline in the functional capacity and quality of life as well as increased risk of dependence and institutionalization [3,4]. Physical disability also reflects difficulties that individuals may experience in interaction with society [5], which can lead to psychological disorders [6].
Physical activity/exercise is an essential disease-preventive measure, irrespective of age [7]. While standards and objective targets are well established, they might not necessarily apply to older people because of other various comorbidities or pre-existing chronic conditions [8]. Gait speed has been shown to be associated with better survival among older adults and to reflect health and functional status [9,10]. This study aims at assessing, in a meta-analysis format, the clinical relevance of gait measurements and their predictive value of falls, disabilities and even mortality in senior communities.
2. Methods
2.1. Study Design
This study was designed according to the guidelines of the 2009 preferred reporting items for systematic reviews and meta-analysis (PRISMA) statement and amendment to the Quality of Reporting of Meta-analyses (QUOROM) statement [11]. Because of the study design (meta-analysis), neither Institutional Review Board (IRB) approval nor patient informed consent was needed.
2.2. Search Strategy
Two reviewers searched all electronic databases (PubMed-Medline, EMBASE, Scopus, Google Scholar, the Cochrane Central Registry of Controlled Trials and ClinicalTrial.gov, accessed on 25 May 2021) until April 2021 using the key words “Stride length” OR “Stride variability” OR “spatial gait” AND “Clinical outcomes” OR “adverse clinical outcome” OR “Physical disability” OR “Mortality” OR “Dependency” OR “Institutionalization” OR “Falls” AND “Older adult population” OR “Older adult”. The wild-card term “*” was used to enhance the sensitivity of the search strategy. The literature search was limited to articles published in English and to human studies. No filters were applied during the search, and two reviewers (IB and MYH) independently evaluated each article. The remaining articles were obtained in full text and assessed by the same researchers.
2.3. Study Selection
Original studies were included if they met the following criteria: (a) investigate older adult population with baseline stride length, (b) report predictors of outcome, (c) enroll population of adults aged ≥ 65 years, and (d) have follow-up data. Exclusion criteria were (i) patients with physical and functional disability, (ii) insufficient statistical data to test predictive value, (iii) studies not in older adult population, (iv) no follow-up data, and (e) articles not published in English.
2.4. Clinical Outcome Measures
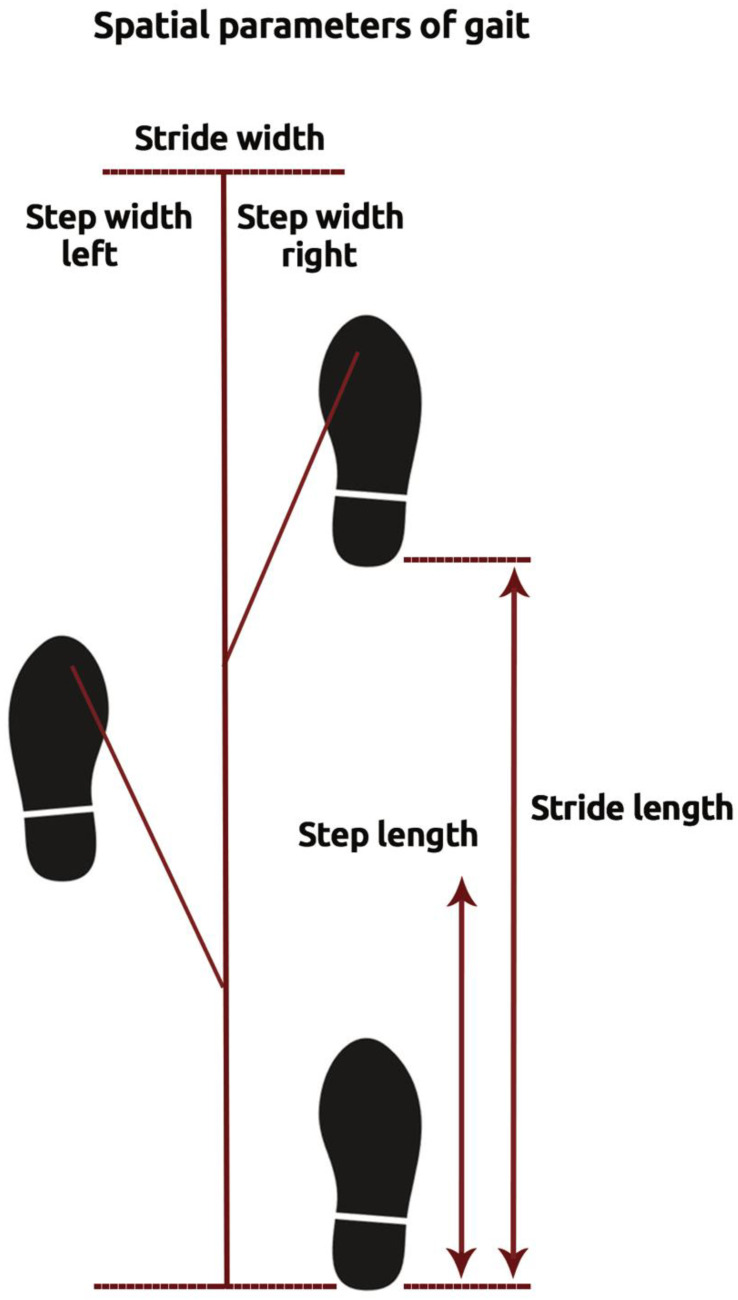
The primary endpoint was major adverse events (MAEs), defined as physical disability, falls, dependency, institutionalization, and mortality. Secondary endpoints were physical disability and mortality. Stride length was defined as the distance measured parallel to the line of progression, including two consecutive steps. Stride width was defined as side-to side distance between the heel of the current foot and heel of the next opposite foot. On the other hand, step width was determined as the distance between the outermost borders of two consecutive footprints (Figure 1). The standard deviation of the three variables (stride length) was used to represent the variability of the stride length [12]. Stride length was normalized to the subject’s height using the following formula [13]:
| Normalized Stride Length = Stride Length (cm)/Height (cm) |
Figure 1.
Illustration of spatial parameters of gait.
All endpoints were evaluated at the longest available follow-up according to individual study protocols.
2.5. Data Extraction
Eligible studies were reviewed, and the following data were extracted: (1) first author’s name; (2) year of publication; (3) study design; (4) baseline of stride length and outcome; (5) patients’ baseline characteristics; (6) follow-up duration; (7) age and gender of participants.
2.6. Quality Assessment
Assessment of risk of bias and applicability concerns in the included studies was evaluated by the same investigators using Newcastle-Ottawa Scale (NOS) for cohort studies. Three domains were evaluated with the following items: (1) Selection, (2) Comparability, and (3) Exposure (assessment of outcome). The risk of bias in each study was judged to be “good”, “fair”, or “poor” [14].
2.7. Statistical Analysis
The meta-analysis was conducted using Statistical analysis, performed using the RevMan (Review Manager (RevMan) Version 5.1, The Cochrane Collaboration, Copenhagen, Denmark), with two-tailed p < 0.05 considered as significant. Weighted mean differences (WMDs) and 95% confidence interval (CI) are presented as summary statistics. Mean and standard deviation (SD) values were estimated using the method described by Hozo et al. [15]. Meta-analyses were performed with random effects models, as heterogeneity of effects among studies was expected. The generic inverse variance method was used to combine log Odds Ratio (log OR) and standard errors of the log OR (SElogORs). The log ORs were adjusted for a common set of co-founders across studies, such as age and gender. Heterogeneity between studies was assessed using the Cochrane Q test and I2 statistic. As a guide, I2 < 25% indicated low, 25–50% moderate, and >50% high heterogeneity [15]. To assess baseline cut-offs of stride length and stride length variability that could predict adverse clinical events, we performed hierarchical summary receiver operating characteristic (ROC) analysis using the Rutter and Gatsonis model [16]. Summary sensitivity and specificity with 95% CI for individual studies based on true positive (TP), true negative (TN), false positive (FP), and false negative (FN) were computed using the diagnostic random-effects model [17]. Potential publication bias was assessed using visual inspections of Begg’s funnel plot asymmetry and Egger’s weighted regression test.
3. Results
3.1. Search Results and Trial Flow
The preliminary screening ruled out articles whose titles and/or abstracts were not relevant. Two hundred and two studies were considered as potentially relevant, and after a stringent selection process, 11 articles met the inclusion criteria [18,19,20,21,22,23,24,25,26,27,28]. A listing of the study selection procedure and flow chart is shown in Figure S1.
3.2. Characteristics of Included Studies
Eleven cohort studies covering an older adult population of 14,167 were included in the analysis, with a mean follow up duration of 33.05 months. The subjects’ mean age was 75.4 ± 5.6 years, 55.8% were females, and the mean stride length adjusted to height was 0.79 ± 0.4 m for males and 0.71 ± 0.3 m for females. The main characteristics of the studies included in the meta-analysis are presented in Table 1.
Table 1.
Main characteristics of studies included in the study.
| Study | Study | Country | Sample | Adverse | Inclusion | Exclusion | Clinical | Follow-up |
|---|---|---|---|---|---|---|---|---|
| (Year) | Design | Size | Events | Criteria | Criteria | Outcomes | (Months) | |
| Wolfson 1990 | Cohort | USA | 49 | 27 | Elderly | Unstable due to | Physical | 24 |
| (prospective) | population | dementia, terminal | disability | |||||
| study | illness, behavioral | |||||||
| or neurological | ||||||||
| problems | ||||||||
| Maki 1997 | Observational | USA | 75 | 43 | Elderly | Elderly population | MAE, | 12 |
| (prospective) | population | that failed to | physical | |||||
| study | able to | meet these | disability | |||||
| walk 10 m, | criteria | |||||||
| to understand | ||||||||
| verbal cues | ||||||||
| Woo 1999 | Cohort | China | 2032 | 1215 | Elderly | NR | MAE, | 36 |
| (prospective) | population | mortality | ||||||
| study | able to walk | |||||||
| unaided | ||||||||
| Verghese 2009 | Cohort | USA | 597 | 226 | Aged ≥ 70 | Audiovisual loss, | Physical | 20 |
| (prospective) | years | bed bound | disability | |||||
| study | due to illness, | |||||||
| institutionalization | ||||||||
| Blain 2010 | Cohort | France | 1300 | 410 | Aged ≥ 75 | Bilateral hip | Mortality | 96 |
| (prospective) | able to | replacement, | ||||||
| study | walk indepen- | previous | ||||||
| dently and having | hip fracture | |||||||
| cognitive | ||||||||
| health | ||||||||
| Reelick 2011 | Cohort | Netherlands | 60 | 38 | Elderly | Insufficient vision, | MAE, | 6 |
| (prospective) | population | MMS Examination | physical | |||||
| study | able to | score < 15, | disability | |||||
| walk 15 m | neurological | |||||||
| independently | disfunction | |||||||
| Hirsch 2012 | Cohort | USA | 4182 | 1901 | Elderly | Wheelchair bound | MAE, | 24 |
| (prospective) | population | or receiving | ||||||
| study | aged ≥ 75 | hospice treatment, | mortality | |||||
| study | radiotherapy, | |||||||
| chemotherapy | ||||||||
| Johansson | Observational | Sweden | 1350 | 148 | Elderly | No eligible | MAE, | 12 |
| 2016 | (prospective) | population | participant | physical | ||||
| study | age of exactly | was excluded | disability | |||||
| 70 years | ||||||||
| Rodríguez- | Cohort | Spain | 431 | 116 | Elderly | Participants who | MAE, | 60 |
| Molinero 2018 | (prospective) | population | were unable | physical | ||||
| study | aged ≥ 65 years | to walk | disability | |||||
| autonomously | ||||||||
| Gillain 2019 | Cohort | France | 105 | 35 | Elderly | History of falls, | MAE | 24 |
| (prospective) | aged ≥ 65 years | gait disorders, | ||||||
| study | living | Parkinson’s disease, | ||||||
| independently | hip or knee | |||||||
| at home | Prosthesis, etc. | |||||||
| Doi 2020 | Cohort | Japan | 4121 | 425 | Elderly | Having any | MAE, | 49.6 |
| (prospective) | population | dependency, ADL, | physical | |||||
| study | aged ≥ 65 years | stroke, Parkinson’s, | disability | |||||
| disease, etc. |
Abbreviations: MAE: major adverse events; ADL; Activities of Daily Living; m: meter.
3.3. Baseline Parameters of Gait in Individuals with and without Clinical Events
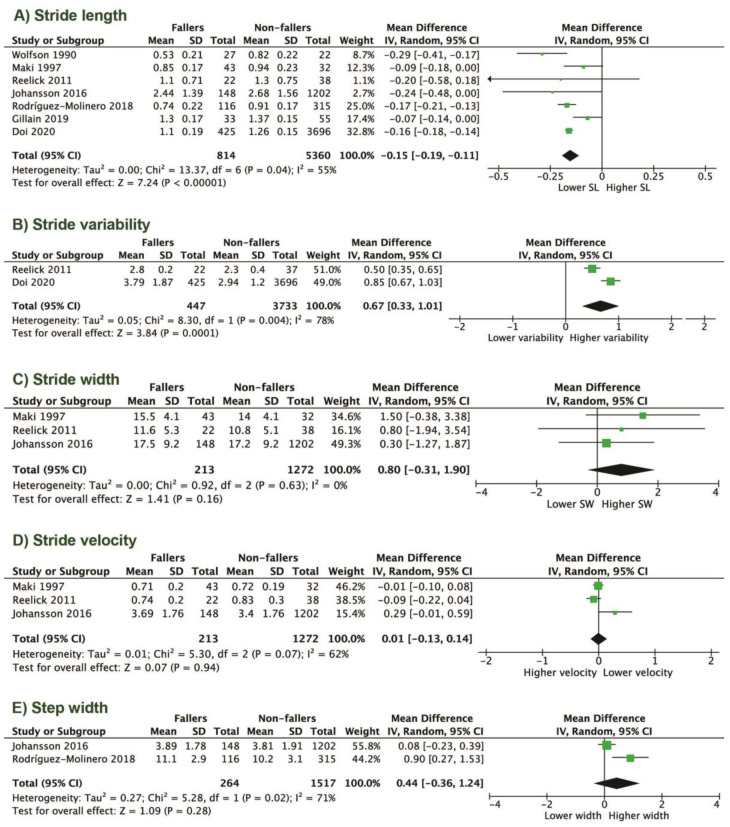
Of the 14,167 studied individuals, falls occurred in 1383 (9.76%). Seven of eleven studies analyzed the stride length in participants with and without falls. Baseline stride length was shorter, with a weighted mean difference (WMD) of −0.15 (−0.19 to −0.11, p < 0.001), and stride length variability was higher, with a WMD of 0.67 (0.33 to 1.01, p < 0.001) in fallers compared to non-fallers (Figure 2A,B). Overall daily physical activities were lower in fallers compared to non-fallers (data from three cohorts): 61.8 vs. 71.6%; RR 0.69, (CI 0.56–0.84; p = 0.0007; Figure S2). Other gait parameters, including stride velocity WMD 0.01 (−0.13 to 1.14, p = 0.94), stride width WMD 0.80 (−0.31 to 1.90, p = 0.16), and step width WMD 0.44 (−0.36 to 1.24, p = 0.28), were not different between the two groups (Figure 2C–E). In a sub-analysis based on gender, the stride length was longer and walking speed slower in males (p < 0.001 and p = 0.04, respectively) compared to females (Figure S3).
Figure 2.
Gait parameters in fallers compared to non-fallers: (A) stride length; (B) stride variability; (C) stride width; (D) stride velocity; (E) step width.
3.4. Predictors of Adverse Clinical Outcomes
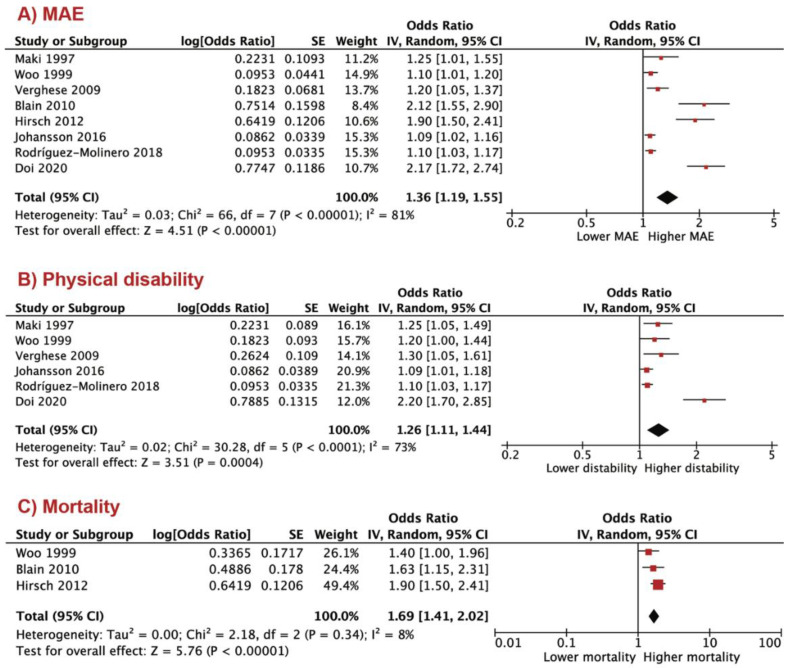
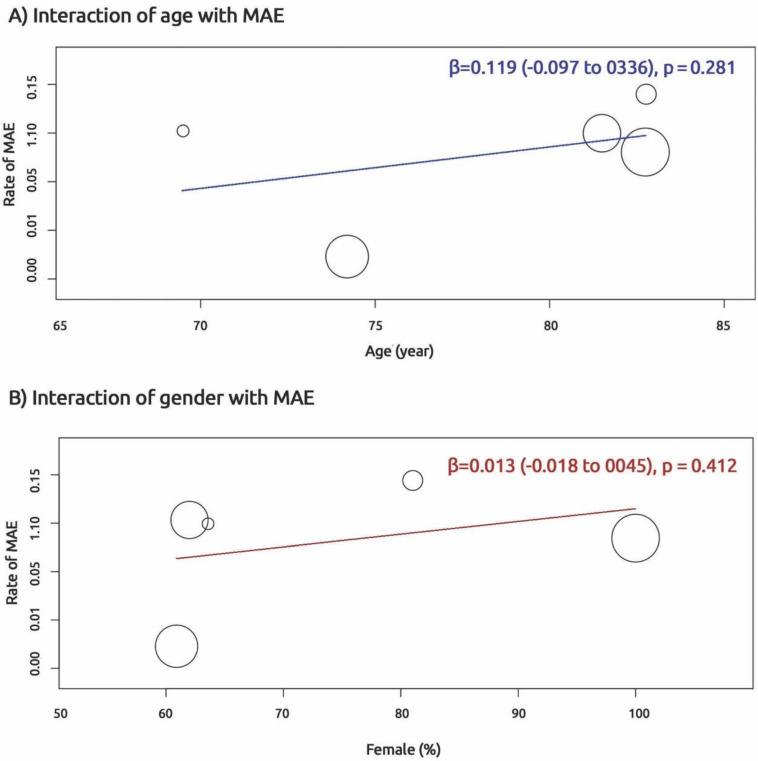
At follow up, 3839 (27%) patients had clinical adverse events. The shorter stride length predicted MAE OR 1.36 (95% CI; 1.19 to 1.55, p < 0.001), physical disability OR 1.26 (95% CI; 1.11 to 1.44, p = 0.004) and mortality OR 1.69 (95% CI; 1.41 to 2.02, p < 0.001; Figure 3A–C). To test interaction between demographic indices and MAE, we performed a meta-regression analysis. No interaction was found between MAE and age, β = 0.119 (−0.097 to 0.336, p = 0.281) as well as MAE and female gender β = 0.013 (−0.018 to 0.045, p = 0.412; Figure 4).
Figure 3.
Shorter stride length in predicting adverse clinical events: (A) major adverse event (MAE); (B) physical disability; (C) mortality.
Figure 4.
Interaction of age and gender with major adverse events (MAE).
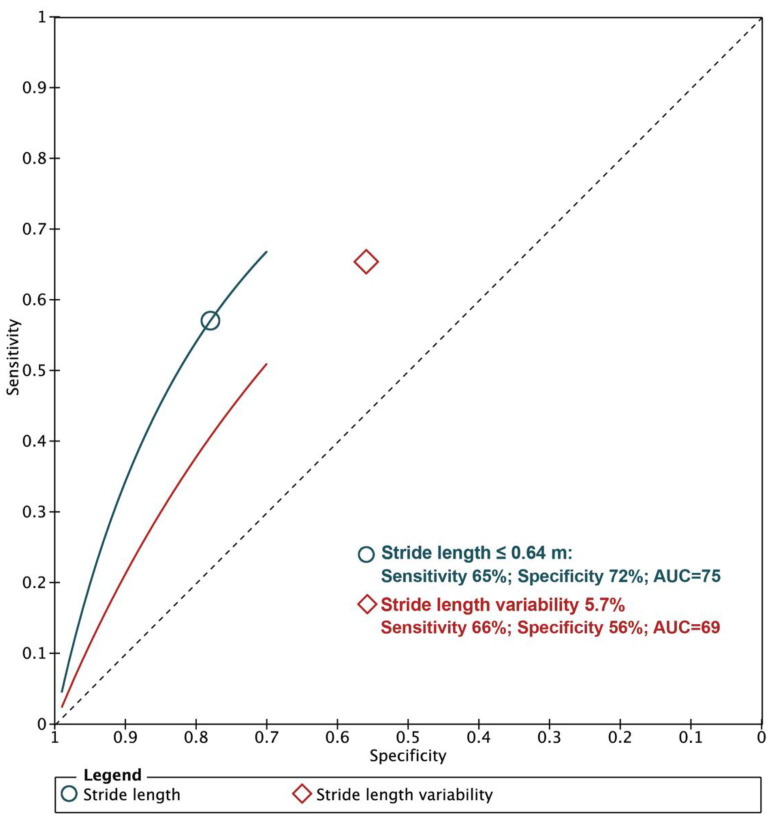
A baseline normalized stride length ≤ 0.64 m was more accurate in predicting the combined adverse clinical events, with a summary sensitivity of 65% (58–71%), a specificity of 72% (69–75%) and an accuracy of 75.5% (74.2–76.7%) compared to a stride length variability of 5.7%, with a summary sensitivity of 66% (61–70%), a specificity of 56% (54–58%) and an accuracy of 57.1% (55.5–58.6%; Figure 5).
Figure 5.
Diagnostic accuracy of stride length in predicting major adverse events (MAE).
3.5. Risk of Bias Assessment
Eight papers (73%) had good quality, and the remaining 27% had fair quality (Table S1). There was no evidence for publication bias based on the Begg’s rank correlation test and Egger’s test.
4. Discussion
4.1. Findings
To our knowledge, the current meta-analysis is the first to evaluate the effects of stride length on clinical outcomes in older adults. The results of this meta-analysis of 11 studies with 14,167 participants revealed the following: (a) baseline stride length was shorter and stride length variability was higher in the older population who developed adverse clinical events compared to those with no clinical events, while the other gait parameters were not different between groups; (b) the shorter stride length predicted MAE, physical disability and mortality in the older adults; (c) a baseline stride length ≤ 0.64 m had higher accuracy in predicting adverse clinical events compared to a stride length variability of 5.7%.
4.2. Data Interpretation
Many researchers have focused on associations between gait speed, physical disability and other adverse events in older adults [29,30,31]. It has been reported that slowing the walking speed reflects health and functional status and predicts survival [32,33]. However, gait is a complex neuromotor behavior, with many measurable facets in addition to velocity. It also has an intricate relationship with different aspects of the psychomotor system. In addition, other quantitative parameters of gait, such as swing phase, stride length and gait variability, demonstrated better predictive value of disability compared to speed alone [31,34]. Body balance is a crucial factor in maintaining healthy and safe walking and for avoiding falls. Shorter stride length and higher stride length variability are two important factors directly involved in the mechanisms of poor balance, which has been shown as a marker of low survival, physical disability and other adverse clinical events [34,35]. These parameters might indicate a certain body inability to improve or recover from future adverse events. Our results support this concept and strengthen further the importance of shorter stride length as a robust marker in predicting MAE, physical disability and mortality. In addition, our analysis proposes a summary cut-off value for stride length of 0.64 m with high accuracy compared with stride length variability in predicting clinical events; our suggestion for future direction is to establish cut-off values based on the demographic characteristics of each country.
4.3. Clinical Implications
Stride length and stride length variability, as important parameters of body balance during walking in older adults, can be a target for intervention through medical, rehabilitative and health-promoting behavioral strategies. These interventions should aim at maintaining long strides in order to sustain improved long-term physical function and survival in older adults.
4.4. Limitations
The most significant limitations of this meta-analysis are related to the limited number of available publications, although the population number in each study was satisfactory. We would have liked to report the different cut-offs of stride length according to different countries and different ethnicities, but these data were not consistently available in all included studies. We did not have control over various measurements of subjects’ gait but had no reason to doubt the reliability of the previously published data. The available data do not allow us to draw conclusions about the importance of medical intervention in stride length. Future studies may be required to determine the impact of intervention through medical, rehabilitation and health-promoting behavioral strategies on better clinical outcomes.
5. Conclusions
The results of this meta-analysis support the significant value of stride length in predicting life-threatening clinical events in older adults. A stride length of 0.64 m accurately predicts the occurrence of future clinical events and thus should provide potential guidance towards optimum individual exercise and support.
Supplementary Materials
The following are available online at https://www.mdpi.com/article/10.3390/jcm10122670/s1, Figure S1: Flow chart, Figure S2: Figure S3: Physical activity in fallers compared to non-fallers, Table S1: Assessment of risk of bias in the included studies using Newcastle-Ottawa Quality Assessment Scale (NOS) for cohort (observational) studies.
Author Contributions
M.Y.H.: Conceptualization and project administration; I.B., M.Y.H.: study design, methodology, data sorting, statistical analysis and writing the draft manuscript. All authors have read and agreed to the published version of the manuscript.
Funding
This research received no external funding.
Institutional Review Board Statement
Meta-analysis.
Informed Consent Statement
Meta-analysis.
Data Availability Statement
Meta-analysis.
Conflicts of Interest
No authors have any conflict of interest to declare.
Footnotes
Publisher’s Note: MDPI stays neutral with regard to jurisdictional claims in published maps and institutional affiliations.
References
- 1.Kennedy B.K., Pennypacker J.K. Drugs that modulate aging: The promising yet difficult path ahead. Transl. Res. 2014;163:456–465. doi: 10.1016/j.trsl.2013.11.007. [DOI] [PMC free article] [PubMed] [Google Scholar]
- 2.Sonntag W.E., Ungvari Z. GeroScience: Understanding the interaction of processes of aging and chronic diseases. AGE. 2016;38:377–378. doi: 10.1007/s11357-016-9953-7. [DOI] [PMC free article] [PubMed] [Google Scholar]
- 3.Motl R.W., McAuley E. Physical activity, disability, and quality of life in older adults. Phys. Med. Rehabil. Clin. N. Am. 2010;21:299–308. doi: 10.1016/j.pmr.2009.12.006. [DOI] [PubMed] [Google Scholar]
- 4.Battalio S.L., Jensen M.P., Molton I.R. Secondary health conditions and social role satisfaction in adults with long-term physical disability. Health Psychol. 2019;38:445–454. doi: 10.1037/hea0000671. [DOI] [PMC free article] [PubMed] [Google Scholar]
- 5.Ashok L., Shetty B., Mayya S., Chandrasekaran V., Kuvalekar K., Kamath R. Quality of life among persons with physical disability in udupi taluk: A cross sectional study. J. Fam. Med. Prim. Care. 2015;4:69–73. doi: 10.4103/2249-4863.152258. [DOI] [PMC free article] [PubMed] [Google Scholar]
- 6.Simning A., Kittel J., Conwell Y. Late-life depressive and anxiety symptoms following rehabilitation services in medicare beneficiaries. Am. J. Geriatr. Psychiatry. 2019;27:381–390. doi: 10.1016/j.jagp.2018.12.012. [DOI] [PMC free article] [PubMed] [Google Scholar]
- 7.Chodzko-Zajko W.J., Proctor D.N., Fiatarone Singh M.A., Minson C.T., Nigg C.R., Salem G.J., Skinner S.J. American college of sports medicine position stand. Exercise and physical activity for older adults. Med. Sci. Sports Exerc. 2009;41:1510–1530. doi: 10.1249/MSS.0b013e3181a0c95c. [DOI] [PubMed] [Google Scholar]
- 8.Zbrońska I., Mędrela-Kuder E. The level of physical activity in elderly persons with overweight and obesity. Roczniki Państwowego Zakładu Higieny. 2018;69:369–373. doi: 10.32394/rpzh.2018.0042. [DOI] [PubMed] [Google Scholar]
- 9.Studenski S. Gait speed and survival in older adults. JAMA. 2011;305:50–58. doi: 10.1001/jama.2010.1923. [DOI] [PMC free article] [PubMed] [Google Scholar]
- 10.Hall W.J. Update in geriatrics. Ann. Intern. Med. 2006;145:538–543. doi: 10.7326/0003-4819-145-7-200610030-00012. [DOI] [PubMed] [Google Scholar]
- 11.Moher D., Liberati A., Tetzlaff J., Altman D.G., Group P. Preferred reporting items for systematic reviews and meta-analyses: The PRISMA statement. BMJ. 2009;339:b2535. doi: 10.1136/bmj.b2535. [DOI] [PMC free article] [PubMed] [Google Scholar]
- 12.Herrero-Larrea A., Miñarro A., Narvaiza L., Gálvez-Barrón C., León N.G., Valldosera E., Felipe E., Valverde R.A., Kruse L., Sabater J.B., et al. Normal limits of home measured spatial gait parameters of the elderly population and their association with health variables. Sci. Rep. 2018;8:13193. doi: 10.1038/s41598-018-31507-1. [DOI] [PMC free article] [PubMed] [Google Scholar]
- 13.Hof A.L. Scaling gait data to body size. Gait Posture. 1996;4:222–223. doi: 10.1016/0966-6362(95)01057-2. [DOI] [Google Scholar]
- 14.Zeng X.-T., Zhang Y., Kwong J.S., Zhang C., Li S., Sun F., Niu Y., Du L. The methodological quality assessment tools for preclinical and clinical studies, systematic review and meta-analysis, and clinical practice guideline: A systematic review. J. Evid. Based Med. 2015;8:2–10. doi: 10.1111/jebm.12141. [DOI] [PubMed] [Google Scholar]
- 15.Hozo S.P., Djulbegovic B., Hozo I. Estimating the mean and variance from the median, range, and the size of a sample. BMC Med. Res. Methodol. 2005;5:13. doi: 10.1186/1471-2288-5-13. [DOI] [PMC free article] [PubMed] [Google Scholar]
- 16.Higgins J.P.T., Thompson S.G., Deeks J.J., Altman D.G. Measuring inconsistency in meta-analyses. BMJ. 2003;327:557–560. doi: 10.1136/bmj.327.7414.557. [DOI] [PMC free article] [PubMed] [Google Scholar]
- 17.Rutter C.M., Gatsonis C.A. A hierarchical regression approach to meta-analysis of diagnostic test accuracy evaluations. Stat. Med. 2001;20:2865–2884. doi: 10.1002/sim.942. [DOI] [PubMed] [Google Scholar]
- 18.Der Simonian R., Laird N. Meta-analysis in clinical trials. Control Clin. Trials. 1986;7:177–188. doi: 10.1016/0197-2456(86)90046-2. [DOI] [PubMed] [Google Scholar]
- 19.Wolfson L., Whipple R., Amerman P., Tobin J.N. Gait assessment in the elderly: A gait abnormality rating scale and its relation to falls. J. Gerontol. 1990;45:M12–M19. doi: 10.1093/geronj/45.1.M12. [DOI] [PubMed] [Google Scholar]
- 20.Maki B.E. Gait changes in older adults: Predictors of falls or indicators of fear? J. Am. Geriatr. Soc. 1997;45:313–320. doi: 10.1111/j.1532-5415.1997.tb00946.x. [DOI] [PubMed] [Google Scholar]
- 21.Woo J., Ho S.C., Yu A.L.M. Walking speed and stride length predicts 36 months dependency, mortality, and institutionalization in Chinese aged 70 and older. J. Am. Geriatr. Soc. 1999;47:1257–1260. doi: 10.1111/j.1532-5415.1999.tb05209.x. [DOI] [PubMed] [Google Scholar]
- 22.Verghese J., Holtzer R., Lipton R.B., Wang C. Quantitative gait markers and incident fall risk in older adults. J. Gerontol. A Biol. Sci. Med. Sci. 2009;64:896–901. doi: 10.1093/gerona/glp033. [DOI] [PMC free article] [PubMed] [Google Scholar]
- 23.Blain H., Carriere I., Sourial N., Berard C., Favier F., Colvez A., Bergman H. Balance and walking speed predict subsequent 8-year mortality independently of current and intermediate events in well-functioning women aged 75 years and older. J. Nutr. Health Aging. 2010;14:595–600. doi: 10.1007/s12603-010-0111-0. [DOI] [PubMed] [Google Scholar]
- 24.Reelick M.F., Kessels R.P.C., Faes M.C., Weerdesteyn V., Esselink R.A.J., Rikkert M.G.M.O. Increased intra-individual variability in stride length and reaction time in recurrent older fallers. Aging Clin. Exp. Res. 2011;23:393–399. doi: 10.1007/BF03337764. [DOI] [PubMed] [Google Scholar]
- 25.Hirsch C.H., Bůžková P., Robbins J.A., Patel K.V., Newman A.B. Predicting late-life disability and death by the rate of decline in physical performance measures. Age Ageing. 2011;41:155–161. doi: 10.1093/ageing/afr151. [DOI] [PMC free article] [PubMed] [Google Scholar]
- 26.Johansson J., Nordström A., Nordström P. Greater fall risk in elderly women than in men is associated with increased gait variability during multitasking. J. Am. Med. Dir. Assoc. 2016;17:535–540. doi: 10.1016/j.jamda.2016.02.009. [DOI] [PubMed] [Google Scholar]
- 27.Rodríguez-Molinero A., Herrero-Larrea A., Miñarro A., Narvaiza L., Gálvez-Barrón C., León N.G., Valldosera E., De Mingo E., Macho O., Aivar D., et al. The spatial parameters of gait and their association with falls, functional decline and death in older adults: A prospective study. Sci. Rep. 2019;9:1–9. doi: 10.1038/s41598-019-45113-2. [DOI] [PMC free article] [PubMed] [Google Scholar]
- 28.Gillain S., Boutaayamou M., Schwartz C., Dardenne N., Bruyère O., Brüls O., Croisier J.L., Salmon E., Reginster Y.E., Garrauxet G., et al. Gait symmetry in the dual task condition as a predictor of future falls among independent older adults: A 2-year longi-tudinal study. Aging Clin. Exp. Res. 2019;31:1057–1067. doi: 10.1007/s40520-019-01210-w. [DOI] [PubMed] [Google Scholar]
- 29.Doi T., Nakakubo S., Tsutsumimoto K., Kim M.-J., Kurita S., Ishii H., Shimada H. Spatio-temporal gait variables predicted incident disability. J. Neuroeng. Rehabil. 2020;17:1–7. doi: 10.1186/s12984-020-0643-4. [DOI] [PMC free article] [PubMed] [Google Scholar]
- 30.Inzitari M., Newman A.B., Yaffe K., Boudreau R., De Rekeneire N., Shorr R., Harris T.B., Rosano C. Gait speed predicts decline in attention and psychomotor speed in older adults: The health aging and body composition study. Neuroepidemiology. 2007;29:156–162. doi: 10.1159/000111577. [DOI] [PMC free article] [PubMed] [Google Scholar]
- 31.Van Kan G.A., Rolland Y., Andrieu S., Bauer J., Beauchet O., Bonnefoy M., Vellas B. Gait speed at usual pace as a predictor of adverse outcomes in community-dwelling older people. J. Nutr. Health Aging. 2009;13:881–889. doi: 10.1007/s12603-009-0246-z. [DOI] [PubMed] [Google Scholar]
- 32.Mortaza N., Abu Osman N.A., Mehdikhani N. Are the spatio-temporal parameters of gait capable of distinguishing a faller from a non-faller elderly? Eur. J. Phys. Rehabil. Med. 2014;50:677–691. [PubMed] [Google Scholar]
- 33.Waite L.M., Grayson D.A., Piguet O., Creasey H., Bennett H.P., Broe G.A. Gait slowing as a predictor of incident dementia: 6-year longitudinal data from the Sydney Older Persons Study. J. Neurol. Sci. 2005;229–230:89–93. doi: 10.1016/j.jns.2004.11.009. [DOI] [PubMed] [Google Scholar]
- 34.Hausdorff J.M., Rios D.A., Edelberg H.K. Gait variability and fall risk in community-living older adults: A 1-year prospective study. Arch. Phys. Med. Rehabil. 2001;82:1050–1056. doi: 10.1053/apmr.2001.24893. [DOI] [PubMed] [Google Scholar]
- 35.Verghese J., Wang C., Lipton R.B., Holtzer R., Xue X. Quantitative gait dysfunction and risk of cognitive decline and dementia. J. Neurol. Neurosurg. Psychiatry. 2007;78:929–935. doi: 10.1136/jnnp.2006.106914. [DOI] [PMC free article] [PubMed] [Google Scholar]
Associated Data
This section collects any data citations, data availability statements, or supplementary materials included in this article.
Supplementary Materials
Data Availability Statement
Meta-analysis.


