Abstract
Critical illness from tuberculosis (TB) bloodstream infection results in a high case fatality rate for people living with human immunodeficiency virus (HIV). Critical illness can lead to altered pharmacokinetics and suboptimal drug exposures. We enrolled adults living with HIV and hospitalized with sepsis, with and without meningitis, in Mbarara, Uganda that were starting first-line anti-TB therapy. Serum was collected two weeks after enrollment at 1-, 2-, 4-, and 6-h post-dose and drug concentrations quantified by validated LC-MS/MS methods. Non-compartmental analyses were used to determine total drug exposure, and population pharmacokinetic modeling and simulations were performed to determine optimal dosages. Eighty-one participants were enrolled. Forty-nine completed pharmacokinetic testing: 18 (22%) died prior to testing, 13 (16%) were lost to follow-up and one had incomplete testing. Isoniazid had the lowest serum attainment, with only 4.1% achieving a target exposure over 24 h (AUC0–24) of 52 mg·h/L despite appropriate weight-based dosing. Simulations to reach target AUC0–24 found necessary doses of rifampin of 1800 mg, pyrazinamide of 2500–3000 mg, and for isoniazid 900 mg or higher. Given the high case fatality ratio of TB-related critical illness in this population, an early higher dose anti-TB therapy should be trialed.
Keywords: TB bacteremia, sepsis, meningitis, HIV, pharmacokinetics, population modeling, simulation
1. Introduction
Critical illness, including sepsis from tuberculosis (TB) bloodstream infection or meningitis, is common among people living with HIV (PLWH) in TB prevalent settings [1,2]. Differing from populations elsewhere, in sub-Saharan Africa, Mycobacterium tuberculosis has been identified as the cause of 25–30% of bloodstream infections and is the leading cause of sepsis [3,4,5,6]. PLWH who develop sepsis from severe TB diseases are at a higher risk of dying compared to those without HIV [7]. Pharmacokinetics and pharmacodynamics (PK/PD) are important drivers of outcomes with TB treatment [8,9,10,11]. Among patients with pulmonary TB from South Africa, serum drug concentrations predicted key outcomes of microbiologic failure, death, or relapse [12]. In a separate study of PLWH and being treated for pulmonary TB in Uganda, the time to culture conversion (microbiological cure) was longer in patients with drug concentrations of isoniazid and rifampin that were below the expected peak concentrations [13]. These studies and others using various in vitro model systems have established target ranges for PK exposures of peak (Cmax) and total area under the concentration time curve (AUC0–24) for many anti-TB drugs [14,15]. Furthermore, increasing doses of first-line anti-TB drugs predictably increases serum exposures, and higher exposures can be targeted to improve microbial kill and cure [16,17].
Patients presenting with critical illness from other causes of sepsis often have decreased drug absorption, expanded drug volume of distribution, and altered drug–protein binding and/or oxidative metabolism that can result in significant PK variability [18]. Complicating our understanding of PK in TB-related critical illness is the considerable proportion that are treated empirically for TB after failing to respond to conventional antibacterials. PK exposures may differ among those with confirmed M. tuberculosis- related critical illness compared to those infected with more acutely pathogenic organisms, or when the causative pathogen is unknown.
Thus, in this prospective cohort, we enrolled PLWH presenting with sepsis that were initiating anti-TB treatment to determine steady state PK exposures of rifampin, isoniazid, pyrazinamide, and ethambutol. We created a population pharmacokinetic model with simulations to assess different dosing approaches to attain minimum serum targets for these first-line drugs and to determine if any differences in exposures existed among people confirmed with M. tuberculosis compared to those with a clinical diagnosis of TB only.
2. Results
A total of 81 patients were enrolled. There were 29 (36.3%) women and the median (interquartile range) age, weight, and MUAC (mid-upper arm circumference) were 36 (30–43.5) years, 52.5 (45.3–58) kgs, and 22 (20.4–24) cm, respectively (Table 1). Twenty-seven patients (33%) had concurrent meningitis. Seven (9%) had a prior history of TB. The median CD4 count was 169 cells/ml3 and 62 (76%) were on antiretroviral therapy (ART) prior to admission.
Table 1.
Demographic and clinical characteristics among people living with HIV, presenting with critical illness and treated for tuberculosis. MUAC: mid-upper-arm circumference. TB: Tuberculosis.
| Characteristic |
N (%) or Median (IQR) N = 81 |
|---|---|
| Age (years) | 36 (30–43.5) |
| Female | 29 (36.3%) |
| Weight (kg) | 52.5 (45.3–58) |
| MUAC (cm) | 22 (20.4–24) |
| CD4 count (cells/mL3) | 169 |
| Prior TB | 7 (9%) |
| Concurrent meningitis | 27 (33%) |
| Duration of Illness (days) | 30 (14–90) |
| Cough >2 weeks | 63 (79%) |
| Fever >2 weeks | 75 (94%) |
| Night sweats >2 weeks | 67 (86%) |
| Loss of appetite >2 weeks | 78 (96.3%) |
| Loss of wt >2 weeks | 48 (58.3%) |
From all the diagnostic tests, there were 36 patients with confirmed TB (6 by blood TAC testing) and 45 with clinical TB. The initial PK visit at two weeks after enrollment was performed only in 50 (61.7%) patients as 18 (22.2%) had died, 5 (6.2%) withdrew, and 8 (9.9%) were lost to follow-up. One other patient had incomplete serum collection, bringing the total number of patients included in the final PK analyses to 49 (26 with confirmed TB, 23 with clinical TB) (Table 2).
Table 2.
Vital status at week 2 pharmacokinetic testing. TB: Tuberculosis.
| Vital Status at Week 2 PK Testing | All N = 81 |
Confirmed TB N = 36 |
Clinical TB N = 45 |
|---|---|---|---|
| Survived (%N) | 49 (60%) | 26 (72%) | 23 (51%) |
| Sepsis | 32 | 21 | 11 |
| Meningitis | 17 | 5 | 12 |
| Died (%N) | 18 (23%) | 5 (14%) | 13 (29%) |
| Sepsis | 13 | 4 | 9 |
| Meningitis | 5 | 1 | 4 |
| Lost to follow-up, withdrew or incomplete PK testing (%N) | 14 (17%) | 5 (17%) | 9 (20%) |
| Sepsis | 9 | 5 | 4 |
| Meningitis | 5 | 0 | 5 |
2.1. Rifampin
A total of 172 non-zero concentration points from 49 patients were included for population modeling, with median (IQR) dosage, Cmax, and AUC0–24 of 10.1 (9–10.7) mg/kg, 3.8 (2.3–5.3) mg/L, and 21.7 (13.4–31.2) mg·h/L, respectively. Four (8.2%) patients reached serum Cmax target ≥ 8 mg/L and eight (16.3%) reached AUC0–24 target ≥35.4 mg h/L. There was moderate variability in the observed data.
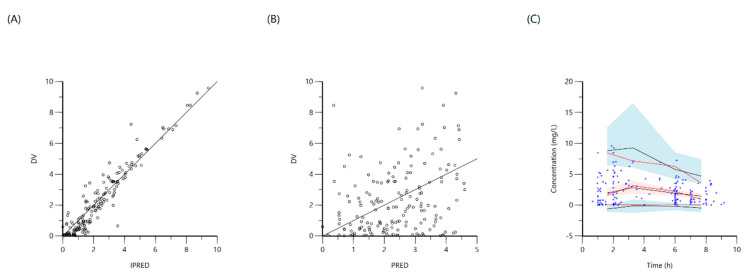
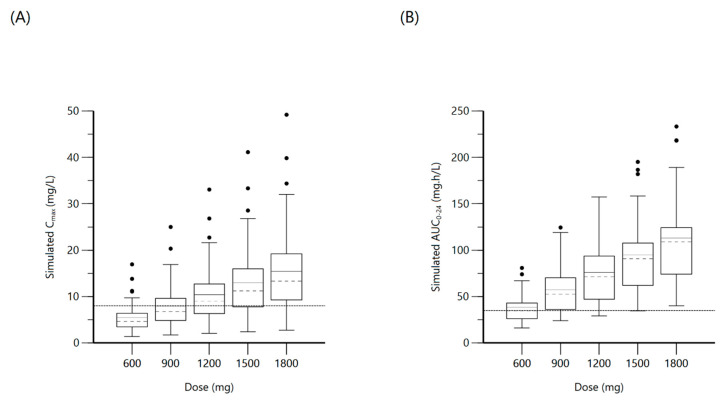
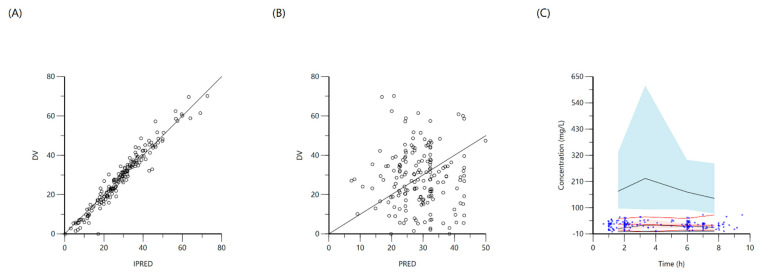
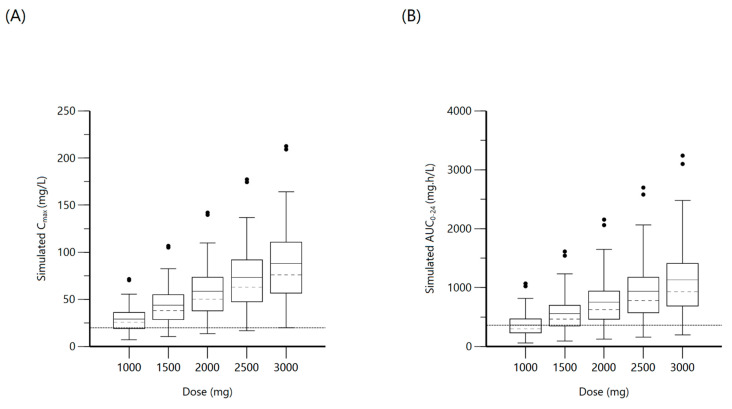
A one-compartment distribution model with a lag-time for oral absorption and an additive residual error was selected as a final model and provided a good description of the observed data. Residual variability was included on all parameters. Upon testing for covariates, weight was a significant covariate for clearance. The PK estimates along with interindividual variability for the final model are shown in Table 3. Goodness-of-fit plots and a visual predictive check (VPC) plot are shown in Figure 1. Individual patient simulations, done at 600, 900, 1200, 1500, and 1800 mg dose levels, are represented in Figure 2. The percentage of simulated subjects attaining the target Cmax of 8 mg/L and the target AUC0–24 of 35.4 mg·h/L are described in Table 4.
Table 3.
Pharmacokinetic estimates for the final models of rifampin, isoniazid, pyrazinamide, and ethambutol. Ka, absorption rate constant; V, volume of distribution in the central compartment; V2, volume of distribution of the peripheral compartment; Cl, systemic clearance; Cl2, intercompartmental clearance; Tlag, lag-time. %CV, coefficient of variation or precision; IIV, inter-individual variation.
| Drug | Parameter | Final Model | |
|---|---|---|---|
| Estimate (%CV) | IIV (Shrinkage) | ||
| Rifampin | Ka (1/h) | 0.3 (13.5) | 0.01 (0.9) |
| V (L) | 25.3 (33.3) | 3.2 (0.2) | |
| Cl (L/h) | 0.1 (49.6) | 0.2 (0.3) | |
| Tlag (h) | 0.9 (9.1) | 0.003 (0.8) | |
| Isoniazid | Ka (1/h) | 0.9 (0.9) | 0.9 (0.3) |
| V (L) | 2.9 (3) | 0.07 (0.6) | |
| V2 (L) | 32.5 (5.7) | 0.5 (0.7) | |
| Cl (L/h) | 9.2 (8.7) | 0.8 (0.1) | |
| Cl2 (L/h) | 9.6 (3) | 0.0001 (0.9) | |
| Tlag (h) | 0.4 (8.6) | 0.5 (0.5) | |
| Pyrazinamide | Ka (1/h) | 0.08 (13) | 0.1-0.11 |
| V (L) | 1.5 (16.3) | 0.9 (0.4) | |
| Cl (L/h) | 2.6 (14.5) | 0.4 (0.05) | |
| Tlag (h) | 0.2 (7.1) | 1.3 (0.4) | |
| Ethambutol | Ka (1/h) | 0.15 (21.8) | 0.6 (0.4) |
| V (L) | 75.17 (23.7) | 0.4 (0.1) | |
| Cl (L/h) | 51.6 (12.2) | 0.3 (0.3) | |
| Tlag (h) | 0.4 (12.3) | 0.6 (0.4) | |
Figure 1.
Goodness-of-fit plots for final population models of rifampin. Plot (A) represents individual predicted concentrations (IPRED) versus observed concentrations (DV) whereas, plot (B) represents population-predicted concentrations (PRED) versus observed concentrations (DV). Plot (C), Visual predictive check (VPC) for concentrations of rifampin versus time based on 1000 Monte Carlo simulations. Blue circles represent observed rifampin concentrations, solid red lines represent the 5th, 50th and 95th percentiles of the observed concentrations, solid black lines represent the 5th, 50th and 95th percentiles of the simulated concentrations, and the shaded area represents the 90% CI of the 5th, 50th and 95th percentiles of the simulated concentrations.
Figure 2.
Plot (A) represents simulated rifampin Cmax at various doses with the dashed line indicating the minimum threshold of 8 mg/L. Plot (B) represents simulated rifampin AUC0–24 at various doses with the dashed line indicating the minimum threshold of 35.4 mg·h/L.
Table 4.
Summary of pharmacokinetic measurements and percentage attaining target at various simulated doses. Cmax = peak serum concentration. AUC0–24 = serum total area under the concentration time curve. IQR= interquartile range.
| Drug | Simulated Dose (mg) | Target | Cmax (mg/L) | AUC0–24 (mg·h/L) | ||
|---|---|---|---|---|---|---|
| Median (IQR) | Attaining Target (%) | Median (IQR) | Attaining Target (%) | |||
| Rifampin | 600 | Cmax: 8 mg/L | 4.6 (3.4–6.4) | 16.30 | 34.5 (26.3–42.2) | 43.6 |
| 900 | 6.8 (4.8–9.6) | 34.7 | 52.3 (36.6–63.5) | 78 | ||
| 1200 | 9 (6.3–12.7) | 57.1 | 71.2 (48.1–84) | 92.7 | ||
| 1500 | AUC0–24: 35.4 mg·h/L | 11.2 (7.9–16) | 73.5 | 90.6 (66.7–105.6) | 97.7 | |
| 1800 | 13.3 (9.5–19.2) | 81.6 | 108.8 (79–123.9) | 100 | ||
| Isoniazid | 300 | Cmax: 3 mg/L | 0.9 (0.7–1) | 0 | 10.2 (8.7–11.8) | 0 |
| 450 | 1.3 (1.1–1.5) | 0 | 15.3 (13.1–17.7) | 0 | ||
| 600 | 1.7 (1.5–2) | 4.1 | 20.5 (17.4–23.6) | 2.3 | ||
| 750 | AUC0–24: 52 mg·h/L | 2.2 (1.8–2.5) | 8.2 | 25.6 (21.7–29-6) | 2.3 | |
| 900 | 2.6 (2.2–3.1) | 28.6 | 30.7 (26.1–35.5) | 4.5 | ||
| Pyrazinamide | 1000 | Cmax: 20 mg/L | 25.7 (19.1–36) | 69.4 | 303.8 (231.6–466.1) | 42.9 |
| 1500 | 38 (28.7–54.3) | 89.8 | 466 (351.1–702.1) | 71.4 | ||
| 2000 | 50.4 (38.1–72.6) | 91.8 | 624.7 (469.5–934.8) | 85.1 | ||
| 2500 | AUC0–24: 363 mg·h/L | 63.1 (47.4–90.8) | 96 | 778.5 (588–1167.8) | 89.6 | |
| 3000 | 75.8 (56.7–109.2) | 98 | 933 (706.6–1403.9) | 91.7 | ||
| Ethambutol | 800 | Cmax: 2 mg/L | 1.6 (1.2–2.2) | 32.6 | 13 (10–18.6) | |
| 1200 | 2.4 (1.7–3.3) | 63.2 | 19.5 (15–28) | |||
| 1600 | 3.2 (2.3–4.4) | 89.8 | 26 (20–37.1) | |||
| 2000 | 3.9 (2.9–5.5) | 93.8 | 32.5 (25–46.4) | |||
| 2400 | 4.7 (3.5–6.5) | 93.8 | 39 (30–55.7) | |||
2.2. Isoniazid
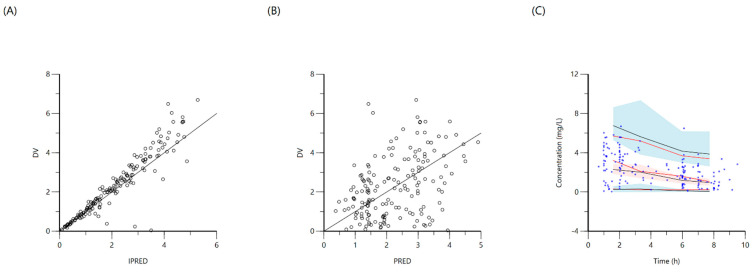
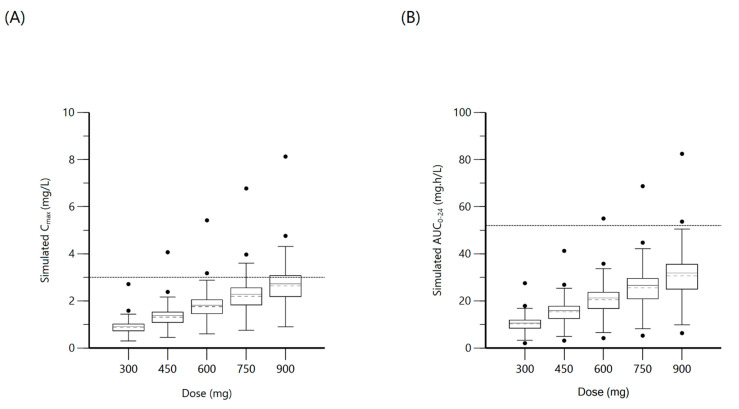
The population was described by a two-compartment model with a lag time for oral absorption, for a total of 173 non-zero concentration points. A proportional error model was used and the final model provided good description of observed data. Residual variability was included on all parameters. The median (IQR) dosage, Cmax, and AUC0–24 were 5 (4.5–5.4) mg/kg, 3.6 (2.3–4.6) mg/L and 22.5 (14.3–34) mg·h/L, respectively. Even with adequate weight-based dosing; only 4.10% reached the minimum AUC0–24 target of 52 mg·h/L and 63.3% reached Cmax target ≥ 3 mg/L. NAT2 genotypic testing was available in 32 (65.3%) patients, with 29 being of the slow–intermediate type and the remaining three were rapid metabolizers. There were no significant differences in Cmax or AUC0–24 values between the slow–intermediate type and the few rapid metabolizers, and thus the NAT2 genotype was not included among the covariates. Screening for age, sex, weight, MUAC, and TB diagnostic categorization yielded a significant covariate effect of MUAC on the volume of distribution of central compartment (V). The final two-compartment model had PK estimates as represented in Table 3. Goodness-of-fit plots and VPC are shown in Figure 3. Individual patient simulation was done at 300 mg, 450 mg, 600 mg, 750 mg, and 900 mg (Figure 4). The percentage of simulated subjects attaining the target Cmax of 3 mg/L and the target AUC0–24 of 52 mg·h/L are described in Table 4.
Figure 3.
Goodness-of-fit plots for final population models of isoniazid. Plot (A) represents individual predicted concentrations (IPRED) versus observed concentrations (DV), whereas plot (B) represents population-predicted concentrations (PRED) versus observed concentrations (DV). Plot (C), visual predictive check (VPC) for concentrations of isoniazid versus time based on 1000 Monte Carlo simulations. The blue circles represent observed isoniazid concentrations; solid red lines represent the 5th, 50th and 95th percentiles of the observed concentrations; solid black lines represent the 5th, 50th and 95th percentiles of the simulated concentrations; and the shaded area represent the 90% CI of the 5th, 50th and 95th percentiles of the simulated concentrations.
Figure 4.
Plot (A) represents simulated isoniazid Cmax at various doses with the dashed line indicating the minimum threshold of 3 mg/L. Plot (B) represents simulated isoniazid AUC0–24 at various doses with the dashed line indicating the minimum threshold of 52 mg·h/L.
2.3. Pyrazinamide
One-compartment distribution model with a lag-time for oral absorption and additive residual error was selected as a final model and provided a good description of the observed 173 concentration points. The residual variability was included on all parameters. The median (IQR) dosage, Cmax, and AUC0–24 were 25.4 (23–28) mg/kg, 34 (28.3–44) mg/L, and 351 (237.1–477.9) mg·h/L, respectively, with 87.8% reaching the Cmax threshold ≥ 20 mg/L and 38.8% reaching AUC0–24 target ≥ 363 mg·h/L. None of the covariates were significant. PK parameter estimates of the final model are shown in Table 3. Goodness-of-fit plots and VPC are shown in Figure 5. Individual patient simulation was completed at 1000 mg, 1500 mg, 2000 mg, 2500 mg, and 3000 mg dose levels (Figure 6). The percentage of simulated subjects attaining the target Cmax of 20 mg/L and the target AUC0–24 of 363 mg·h/L are described in Table 4.
Figure 5.
Goodness-of-fit plots for final population models of pyrazinamide. Plot (A) represents individual predicted concentrations (IPRED) versus observed concentrations (DV), whereas plot (B) represents population-predicted concentrations (PRED) versus observed concentrations (DV). Plot (C), visual predictive check (VPC) for concentrations of pyrazinamide versus time based on 1000 Monte Carlo simulations. Blue circles represent observed pyrazinamide concentrations, solid red lines represent the 5th, 50th and 95th percentiles of the observed concentrations, solid black lines represent the 5th, 50th and 95th percentiles of the simulated concentrations, and the shaded area represent the 90% CI of the 5th, 50th and 95th percentiles of the simulated concentrations.
Figure 6.
Plot (A) represents simulated pyrazinamide Cmax at various doses with the dashed line indicating the minimum threshold of 20 mg/L. Plot (B) represents simulated pyrazinamide AUC0–24 at various doses with the dashed line indicating the minimum threshold of 363 mg·h/L.
2.4. Ethambutol
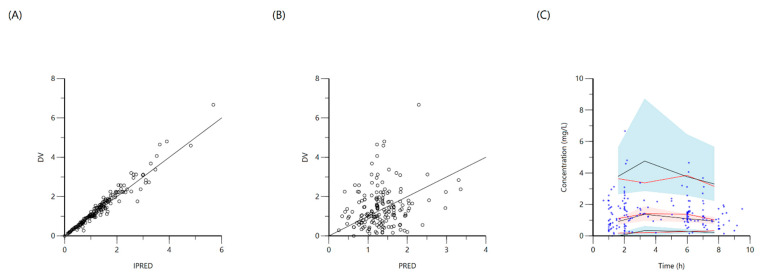
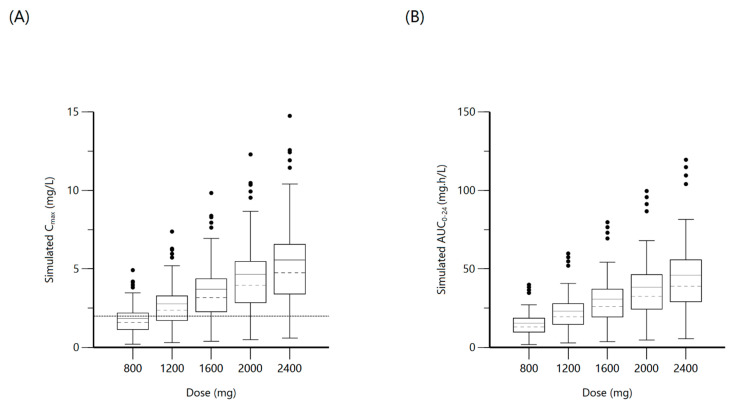
A total of 173 concentration points from 49 patients were included for population modeling, with a median (IQR) dosage of 18.4 (16.5–19.6) mg/L and 30.6% attained target Cmax ≥ 2 mg/L with median 1.8 (1.3–2.2) mg/L. The median AUC0–24 was 14.3 (10.6–26.6). A one-compartment distribution model with a lag-time for oral absorption and additive residual error was selected as a final model and provided a good description of the observed data. None of the covariates screened were significant. PK estimates and interindividual variability for the final model are shown in Table 3. Goodness-of-fit plots and VPC based on 1000 Monte Carlo simulations are shown in Figure 7. Individual patient simulation (Figure 8) was done at 800 mg, 1200 mg, 1600 mg, 2000 mg, and 2400 mg. As no target value has been described for ethambutol AUC0–24, only the percentage of simulated patients reaching target Cmax has been shown in Table 4.
Figure 7.
Goodness-of-fit plots for final population models of ethambutol. Plot (A) represents individual predicted concentrations (IPRED) versus observed concentrations (DV), whereas plot (B) represents population predicted concentrations (PRED) versus observed concentrations (DV). Plot (C), visual predictive check (VPC) for concentrations of ethambutol versus time based on 1000 Monte Carlo simulations. Blue circles represent observed ethambutol concentrations, solid red lines represent the 5th, 50th and 95th percentiles of the observed concentrations, solid black lines represent the 5th, 50th and 95th percentiles of the simulated concentrations, and the shaded areas represent the 90% CI of the 5th, 50th and 95th percentiles of the simulated concentrations.
Figure 8.
Plot (A) represents simulated ethambutol Cmax at various doses with the dashed line indicating the minimum threshold of 2 mg/L. Plot (B) represents simulated ethambutol AUC0–24 at various doses.
3. Discussion
PLWH and presenting with critical illness that were treated for TB had considerably altered PK with the majority failing to reach one or more PK targets for rifampin, isoniazid, pyrazinamide and ethambutol. To our knowledge, this is the first PK study of anti-TB drugs among PLWH with sepsis physiology from a TB endemic setting. Population PK modeling and individual patient simulation suggest necessary dosages to reach the target total serum exposure, AUC0–24, would require a tripling of the typical rifampin dose to 1800 mg, and a modest increase in pyrazinamide dosages of 2500 to 3000 mg. Surprisingly, simulating for a daily dose as high as 900 mg for isoniazid, only 4.5% reached the target AUC0–24. While the target AUC0–24 for ethambutol has not been established, dosing from 1600 and 2000 mg only modestly increased the proportion attaining a target peak concentration.
Importantly, nearly a quarter of all PLWH and those treated for TB-related critical illness died before reaching the two-week PK visit and presumed steady-state kinetics. An expected lower proportion of patients with confirmed TB died before the two-week PK visit compared to those without microbiological confirmation of TB. While the high and early case fatality rate is not dissimilar to other cohorts with HIV and critical illness in Uganda [19], we were unable to determine if there were PK differences among those with early mortality and those who survived to PK testing. Given that the pathophysiology of severe sepsis leads to altered plasma drug binding capabilities and decreased drug perfusion to tissues, and impaired metabolism and clearance due to liver and kidney injury [18], it is possible that those patients with early mortality may have had unexpectedly higher serum exposures than were measured in the cohort of survivors. Further studies of anti-TB PK in critical illness should assay drug concentrations within days of TB treatment initiation and again at a steady state.
Rifampin is a potent antituberculous drug that produces antimicrobial activity by inhibition of DNA-dependent RNA polymerase, and the absorption can be affected by the SLCO1B1 gene [20]. Isoniazid is rapidly absorbed from the gastrointestinal tract and the serum concentrations can be affected by the NAT2 phenotype classification [21]. Pyrazinamide is also readily absorbed, and all drugs act in a concentration-dependent manner; thus, higher serum exposures produce a greater antibacterial effect. However, the considerable PK variability observed in this cohort, and the high number failing to reach exposures for rifampin and isoniazid in particular, raise concern that even among those surviving critical illness, such low exposures may predispose to other longer term poor outcomes, such as acquired M. tuberculosis drug resistance, which have been more commonly observed with HIV co-infection [13,22]. It is therefore all the more important to determine if any measurable predictors at TB treatment initiation can predict PK exposures or improve upon a population PK model of anti-TB medications in PLWH and critical illness. In certain cohorts of ambulatory people with pulmonary TB, with or without HIV, drug dose, sex and low weight have been found to be important predictors of reduced rifampin and pyrazinamide exposure [23,24]. Isoniazid serum exposure has been better able to be explained by the NAT2 genotype and assignment of the phenotypic category (slow-intermediate and rapid metabolizers) in other cohorts due to its influence on isoniazid clearance [25], but not all patients in this study had NAT2 genotype testing, as this was a saliva test that required active patient participation, and only three participants were ultimately categorized as rapid metabolizers. We suspect the overall lack of covariate influence to be a result of too sparse a sampling strategy in a population with considerably altered physiology due to the sepsis state, and further models may be improved by more frequent sampling in the dosing interval. Furthermore, collection of biological markers for the extent of tissue damage such as lactate, which was only infrequently measured during routine care in this study, or immune profiles that may be more common in PLWH and disseminated TB disease, could be of further discriminatory benefit [26,27].
While this study advances our understanding about the extent of PK variability and under-dosing for rifampin and isoniazid in PLWH and critical illness, exposure targets are nonetheless extrapolated from in vitro models that have only been replicated in limited cohorts of ambulatory patients with pulmonary TB. Different exposure targets may be necessary for PLWH and critical illness from TB-related sepsis. Such targets may not be fully elucidated without controlled trials of immediate TB treatment among PLWH from TB-endemic settings that present with sepsis and who may not yet have a microbiologically confirmed diagnosis of TB, particularly if survival is the outcome of interest. To help design such studies, simulations were conducted for widely available dosages of each drug, with the highest median being 34 mg/kg of rifampin, 17 mg/kg of isoniazid, 57 mg/kg of pyrazinamide, and 45 mg/kg of ethambutol. Recent trials have demonstrated a tolerable use of higher doses of rifampin up to 40 mg/kg in pulmonary TB patients with mild to moderate related adverse effects [28,29,30]. Similarly, patients treated with higher isoniazid doses between 15 and 20 mg/kg have had improved outcomes with faster culture conversion in rifampin-resistant anti-TB regimens [31], yet the essentiality of isoniazid has been more difficult to demonstrate for rifampin-susceptible TB [32]. Lastly, while pyrazinamide would not appear to require a significant dose increase in this population of PLWH and critical illness in Uganda, a meta-analysis of 29 controlled studies suggested that doses up to 60 mg/kg of pyrazinamide did not lead to higher rates of hepatotoxicity [33].
In summary, death from critical illness among PLWH was common within the first two weeks of starting TB treatment, necessitating earlier interventions. Further studies of anti-TB PK in critical illness should measure the dynamics of drug concentrations from TB treatment initiation to steady-state and consider markers of tissue damage or severe immune perturbation as covariates. Regardless, PK modeling from this population of PLWH and critical illness suggest that higher doses of rifampin and considerably higher doses of isoniazid are required to reach conventional serum targets.
4. Materials and Methods
4.1. Patient Population
PLWH presenting with sepsis [34], defined as two or more systemic inflammatory response syndrome criteria and clinical suspicion of infection, with or without the additional clinical suspicion for TB meningitis as defined by the International TB Meningitis Workshop Consensus Case Definitions for TB Meningitis, and starting on first-line therapy for presumed drug-susceptible TB, were enrolled at Mbarara Regional Referral Hospital, Uganda. Males and non-pregnant females over the age of 18 were eligible to participate and informed consent was collected from patients who were alert, or from guardians in the case of patients presenting with altered levels of consciousness. A target of 80 consecutive patients meeting eligibility were enrolled in order for 50 people to undergo PK testing given expected mortality and loss to follow-up. The protocol was approved by institutional review boards of Mbarara University of Science and Technology, Uganda Council for Science and Technology, and the University of Virginia (ClinicalTrials.gov identifier NCT03559582, Charlottesville, VA, USA).
At study enrollment, TB diagnostics performed included sputum Xpert MTB/RIF, sputum mycobacterial cultures, mycobacterial blood cultures, and urine lipoarabinomannan (LAM). Most patients that could expectorate had more than one TB diagnostic performed. Whole blood was also collected for polymerase chain reaction (PCR)-based multiplexed TaqMan Array Card (TAC) to detect 43 common bacterial, fungal, viral, and parasitic targets, including M. tuberculosis. The TAC procedures are described in detail elsewhere [5,35]. TAC testing was performed in a batch and the results were not available for informing clinical care. Patients were categorized post hoc into two groups based upon availability of microbiology results: confirmed TB (TB identified by at least one diagnostic modality) or clinical TB (no diagnostic modality positive for TB). Antiretroviral therapy (ART) status and CD4 profiles, and other routine laboratory parameters were collected from medical charts if ordered by treating clinicians. Patients with suspicion of meningitis had cerebrospinal fluid tested to obtain a cell count profile prior to study entry. Prior to TB treatment initiation, ceftriaxone was the standard of care for empiric therapy of sepsis.
4.2. NAT2 Testing
N-acetyltransferase-2 (NAT2) phenotype (intermediate/slow versus rapid metabolizer) was also determined by NAT2 genotyping for potential influence on isoniazid kinetics. For NAT2 targets, saliva samples were collected when participants were able to participate for PCR testing of the host targets with targets procured from Thermo Fisher (Thermo Fisher, Waltham, MA, USA) in a custom-designed plate with primers and probes pre-assembled in each well. NAT2 targets included: c.341 (C/T; rs1801280), c.590 (A/G; rs1799930), and c.803 (A/G; rs1208). Individual NAT2 genotypes at positions c.341 and c.590 were combined into haplotypes and then converted to NAT2-predicted acetylator phenotypes of “rapid” or “intermediate/slow” according to the indicated phenotypes available at the database of human NAT2 alleles hosted at the Democritus University of Thrace (Vasilissis Sofias, Greece) (https://nat.mbg.duth.gr/, accessed 18 December 2020).
4.3. Anti-TB Therapy and PK Study Methods
Participants were empirically administered first-line anti TB regimen that included rifampin, isoniazid, pyrazinamide, and ethambutol as weight-based fixed-dose combinations once daily. The first PK visit was conducted two weeks after the patients were started on anti-TB therapy to allow for steady-state kinetics. Sparse sampling strategies were used to collect venous blood at 1-, 2-, 4-, and 6-h post-dose. Medication was administered orally as directly observed therapy for the PK visit. Once blood was collected, the vials were centrifuged to separate serum, which was immediately frozen at −80 °C until batch shipment to University of Florida, USA (Gainesville, VA, USA), where concentrations of all four drugs were quantified using validated liquid chromatography-tandem mass spectrometry procedures, including prior testing for confirmation of milligram quantity in fixed dose preparations [36]. The methods were validated over the concentration ranges 0.4 to 20 µg/ml for isoniazid, 0.5 to 50 µg/ml for rifampin, 2 to 100 µg/ml for pyrazinamide, and 0.2 to 10 µg/ml for ethambutol [37].
4.4. Population Pharmacokinetics, Model Development, and Simulation
Individual PK profiles for four drugs were estimated using a noncompartmental approach in Phoenix WinNonlin version 8.0 (Certara, Princeton, NJ, USA) and Cmax (maximal serum concentration) and AUC0–24 (areas under the serum concentration-time curve from time zero to 24 h, estimated in those with 6-h values within the elimination phase) were calculated and reported as median (interquartile range).
Population PK models were developed (separately for each drug) using a nonlinear mixed-effects modeling approach (Phoenix NLME), and a first-order conditional estimation-extended least squares algorithm was used for model development. One- and two-compartment distribution models with linear elimination and first-order absorption (with and without lag-time) were tested. Interindividual variability was included using exponential function. Additive, proportional, and combined residual error models were tested. Model selection was based on a visual inspection of model fits and diagnostic plots, precision of parameter estimates, and Akaike and Schwartz information criteria. Available covariates included age, sex, total body weight, mid-upper arm circumference (MUAC), TB diagnostic group (confirmed and unconfirmed), and for isoniazid modeling, the NAT2 phenotype (intermediate/slow versus rapid metabolizer). A stepwise covariate search run mode was used for the evaluation of covariates (p = 0.05 forward/p = 0.01 backward). Covariates were tested using an exponential function in multiplicative fashion. To evaluate the robustness of the final model, visual predictive checks based on 1000 Monte Carlo simulations were performed.
Next, the final models were used to generate simulated pharmacokinetic profiles for individual patients (using individual PK parameters and covariates; and assuming dose-independent PK) at various available doses. The doses for rifampin were 600 mg, 900 mg, 1200 mg, 1500 mg and 1800 mg; for isoniazid at 300 mg, 450 mg, 600 mg, 750 mg and 900 mg; for pyrazinamide at 1000 mg, 1500 mg, 2000 mg, 2500 mg and 3000 mg; and for ethambutol at 800 mg, 1200 mg, 1600 mg, 2000 mg and 2400 mg. Individual simulated profiles were used to calculate Cmax and AUC0–24. Box and whisker plots were used to illustrate simulated concentrations and the percentage of simulated patients attaining threshold exposure [15] for each drug.
Abbreviations
| ART | Anti-Retroviral Therapy |
| AUC | Area Under Curve |
| CD4 | Cluster of Differentiation 4 |
| CI | Confidence Interval |
| Cl | Systemic clearance |
| Cl2 | Intercompartmental clearance |
| Cmax | Maximum serum Concentration |
| CV | Coefficient of Variation |
| DV | Dependent Variable (observed concentrations) |
| HIV | Human Immunodeficiency Virus |
| IIV | Inter Individual Variability |
| IPRED | Individual Predicted Concentrations |
| IQR | Inter Quartile Range |
| Ka | Absorption rate constant |
| LAM | Lipoarabinomannan |
| LC-MS-MS | Liquid Chromatography-Mass Spectrometry-Mass Spectrometry |
| MUAC | Mid-Upper Arm Circumference |
| NAT2 | N-Acetyl Transferase 2 |
| NLME | Non-Linear Mixed Effects |
| PCR | Polymerase Chain Reaction |
| PD | Pharmacodynamic |
| PK | Pharmacokinetic |
| PLWH | People Living With HIV |
| PRED | Population Predicted Concentrations |
| TAC | Taqman Array Card |
| TB | Tuberculosis |
| V2 | Volume of distribution of the peripheral compartment |
| V | Volume of distribution in the central compartment |
| VPC | Visual Predictive Check |
Author Contributions
Conceptualization, C.M., C.C.M., E.R.H. and S.K.H.; methodology P.S.R., L.K., C.A.P., C.C.M., S.K.H., C.M.; validation, M.H.A.-S., C.A.P., S.P.; formal analysis, P.S.R. and L.K.; investigation, A.A.M., E.N., P.O., D.N., Y.B., R.A., S.P. and J.M.-A.; resources, J.M.-A. and C.M.; data curation, P.S.R. and J.G.; writing—original draft preparation, P.S.R., S.K.H.; writing—review and editing, P.S.R., A.A.M., E.N., P.O., D.N., Y.B., J.M.-A., R.A., C.A.P., M.H.A.-S., S.P., J.G., L.K., E.R.H., C.C.M., S.K.H. and C.M.; visualization, P.S.R.; supervision, S.K.H., C.M.; project administration, C.C.M.; funding acquisition, S.K.H. and E.R.H. All authors have read and agreed to the published version of the manuscript.
Funding
This research was funded by National Institutes of Health, grant numbers U01AI115594 and R01AI137080. The APC was funded by U01AI11559.
Institutional Review Board Statement
The study was conducted according to the guidelines of the Declaration of Helsinki, and approved by the Institutional Review Board of The University of Virginia (protocol code 18452 on 28 June 2016) and the Uganda Council for Science and Technology (on 10 June 2016).
Informed Consent Statement
Informed consent was obtained from all subjects involved in the study.
Data Availability Statement
The data presented in this study are available on request from the corresponding author. The data are not publicly available due to original data use agreements but may be available in the future.
Conflicts of Interest
The authors declare no conflict of interest. The funders had no role in the design of the study; in the collection, analyses, or interpretation of data; in the writing of the manuscript, or in the decision to publish the results.
Footnotes
Publisher’s Note: MDPI stays neutral with regard to jurisdictional claims in published maps and institutional affiliations.
References
- 1.Adhikari N.K., Fowler R.A., Bhagwanjee S., Rubenfeld G.D. Critical care and the global burden of critical illness in adults. Lancet. 2010;376:1339–1346. doi: 10.1016/S0140-6736(10)60446-1. [DOI] [PMC free article] [PubMed] [Google Scholar]
- 2.Rudd K.E., Johnson S.C., Agesa K.M., Shackelford K.A., Tsoi D., Kievlan D.R., Colombara D.V., Ikuta K.S., Kissoon N., Finfer S., et al. Global, regional, and national sepsis incidence and mortality, 1990–2017: Analysis for the Global Burden of Disease Study. Lancet. 2020;395:200–211. doi: 10.1016/S0140-6736(19)32989-7. [DOI] [PMC free article] [PubMed] [Google Scholar]
- 3.Barr D.A., Lewis J.M., Feasey N., Schutz C., Kerkhoff A.D., Jacob S.T., Andrews B., Kelly P., Lakhi S., Muchemwa L., et al. Mycobacterium tuberculosis bloodstream infection prevalence, diagnosis, and mortality risk in seriously ill adults with HIV: A systematic review and meta-analysis of individual patient data. Lancet Infect. Dis. 2020:742–752. doi: 10.1016/S1473-3099(19)30695-4. [DOI] [PMC free article] [PubMed] [Google Scholar]
- 4.Cummings M.J., O’Donnell M.R. Inverting the pyramid: Increasing awareness of mycobacterial sepsis in sub-Saharan Af-rica. Int. J. Tuberc. Lung Dis. 2015:1128–1134. doi: 10.5588/ijtld.14.0967. [DOI] [PMC free article] [PubMed] [Google Scholar]
- 5.Moore C.C., Jacob S.T., Banura P., Zhang J., Stroup S., Boulware D.R., Scheld W.M., Houpt E.R., Liu J. Etiology of Sepsis in Uganda using a Quantitative PCR-based TaqMan Array Card. Clin. Infect. Dis. 2019;68:266–272. doi: 10.1093/cid/ciy472. [DOI] [PMC free article] [PubMed] [Google Scholar]
- 6.Lewis J.M., Feasey N.A., Rylance J. Aetiology and outcomes of sepsis in adults in sub-Saharan Africa: A systematic review and meta-analysis. Crit. Care. 2019;23:212. doi: 10.1186/s13054-019-2501-y. [DOI] [PMC free article] [PubMed] [Google Scholar]
- 7.Van den Broek J., Mfinanga S., Moshiro C., O’Brien R., Mugomela A., Lefi M. Impact of human immunodeficiency virus infection on the outcome of treatment and survival of tuberculosis patients in Mwanza, Tanzania. Int. J. Tuberc. Lung Dis. 1998;2:547–552. [PubMed] [Google Scholar]
- 8.Weiner M., Burman W., Vernon A., Benator D., Peloquin C.A., Khan A., Weis S., King B., Shah N., Hodge T., et al. Low isoniazid concentrations and outcome of tuberculosis treatment with once-weekly isoniazid and rifapentine. Am. J. Respir. Crit Care Med. 2003;167:1341–1347. doi: 10.1164/rccm.200208-951OC. [DOI] [PubMed] [Google Scholar]
- 9.Weiner M., Benator D., Burman W., Peloquin C.A., Khan A., Vernon A., Jones B., Silva-Trigo C., Zhao Z., Hodge T., et al. Association between acquired rifamycin resistance and the pharmacokinetics of rifabutin and isoniazid among patients with HIV and tuberculosis. Clin. Infect. Dis. 2005;40:1481–1491. doi: 10.1086/429321. [DOI] [PubMed] [Google Scholar]
- 10.Tappero J.W., Bradford W.Z., Agerton T.B., Hopewell P., Reingold A.L., Lockman S., Oyewo A., Talbot E.A., Kenyon T.A., Moeti T.L., et al. Serum concentrations of antimycobacterial drugs in patients with pulmonary tuberculosis in Bot-swana. Clin Infect. Dis. 2005;41:461–469. doi: 10.1086/431984. [DOI] [PubMed] [Google Scholar]
- 11.Chideya S., Winston C.A., Peloquin C.A., Bradford W.Z., Hopewell P.C., Wells C.D., Reingold A.L., Kenyon T.A., Moeti T.L., Tappero J.W. Isoniazid, rifampin, ethambutol, and pyrazinamide pharmacokinetics and treatment outcomes among a predominantly HIV-infected cohort of adults with tuberculosis from Botswana. Clin. Infect. Dis. 2009;48:1685–1694. doi: 10.1086/599040. [DOI] [PMC free article] [PubMed] [Google Scholar]
- 12.Pasipanodya J.G., McIlleron H., Burger A., Wash P.A., Smith P., Gumbo T. Serum drug concentrations predictive of pul-monary tuberculosis outcomes. J. Infect. Dis. 2013;208:1464–1473. doi: 10.1093/infdis/jit352. [DOI] [PMC free article] [PubMed] [Google Scholar]
- 13.Sekaggya-Wiltshire C., von Braun A., Lamorde M., Ledergerber B., Buzibye A., Henning L., Musaazi J., Gutteck U., Denti P., de Kock M., et al. Delayed Sputum Culture Conversion in Tuberculosis-Human Immunodeficiency Vi-rus-Coinfected Patients with Low Isoniazid and Rifampicin Concentrations. Clin. Infect. Dis. 2018;67:708–716. doi: 10.1093/cid/ciy179. [DOI] [PMC free article] [PubMed] [Google Scholar]
- 14.Heysell S.K., Mtabho C., Mpagama S., Mwaigwisya S., Pholwat S., Ndusilo N., Gratz J., Aarnoutse R.E., Kibiki G.S., Houpt E.R. Plasma drug activity assay for treatment optimization in tuberculosis patients. Antimicrob. Agents Chemother. 2011:5819–5825. doi: 10.1128/AAC.05561-11. [DOI] [PMC free article] [PubMed] [Google Scholar]
- 15.Alffenaar J.C., Gumbo T., Dooley K.E., Peloquin C.A., Mcilleron H., Zagorski A., Cirillo D.M., Heysell S.K., Silva D.R., Migliori G.B. Integrating Pharmacokinetics and Pharmacodynamics in Operational Research to End Tuberculosis. Clin. Infect. Dis. 2020;70:1774–1780. doi: 10.1093/cid/ciz942. [DOI] [PMC free article] [PubMed] [Google Scholar]
- 16.Boeree M.J., Heinrich N., Aarnoutse R., Diacon A.H., Dawson R., Rehal S., Kibiki G.S., Churchyard G., Sanne I., Ntinginya N.E., et al. High-dose rifampicin, moxifloxacin, and SQ109 for treating tuberculosis: A multi-arm, multi-stage randomised controlled trial. Lancet Infect. Dis. 2017:39–49. doi: 10.1016/S1473-3099(16)30274-2. [DOI] [PMC free article] [PubMed] [Google Scholar]
- 17.Zuur M.A., Pasipanodya J.G., van S.D., van der Werf T.S., Gumbo T., Alffenaar J.C. Intermediate Susceptibility Dose-Dependent Breakpoints for High-Dose Rifampin, Isoniazid, and Pyrazinamide Treatment in Multidrug-Resistant Tu-berculosis Programs. Clin. Infect. Dis. 2018;67:1743–1749. doi: 10.1093/cid/ciy346. [DOI] [PubMed] [Google Scholar]
- 18.De P.P., Belpaire F.M., Buylaert W.A. Pharmacokinetic and pharmacodynamic considerations when treating patients with sepsis and septic shock. Clin. Pharmacokinet. 2002;41:1135–1151. doi: 10.2165/00003088-200241140-00002. [DOI] [PubMed] [Google Scholar]
- 19.Hazard R.H., Kagina P., Kitayimbwa R., Male K., McShane M., Mubiru D., Welikhe E., Moore C.C., Abdallah A. Effect of Empiric Anti-Mycobacterium tuberculosis Therapy on Survival Among Human Immunodeficiency Virus-Infected Adults Admitted With Sepsis to a Regional Referral Hospital in Uganda. Open Forum Infect. Dis. 2019;6:ofz140. doi: 10.1093/ofid/ofz140. [DOI] [PMC free article] [PubMed] [Google Scholar]
- 20.Horita Y., Alsultan A., Kwara A., Antwi S., Enimil A., Ortsin A., Dompreh A., Yang H., Wiesner L., Peloquin C.A. Evaluation of the Adequacy of WHO Revised Dosages of the First-Line Antituberculosis Drugs in Children with Tuberculo-sis Using Population Pharmacokinetic Modeling and Simulations. Antimicrob. Agents Chemother. 2018;62:e00008-18. doi: 10.1128/AAC.00008-18. [DOI] [PMC free article] [PubMed] [Google Scholar]
- 21.Alsultan A., Peloquin C.A. Therapeutic drug monitoring in the treatment of tuberculosis: An update. Drugs. 2014:839–854. doi: 10.1007/s40265-014-0222-8. [DOI] [PubMed] [Google Scholar]
- 22.Patel K.B., Belmonte R., Crowe H.M. Drug malabsorption and resistant tuberculosis in HIV-infected patients. N. Eng. J. Med. 1995;332:336–337. doi: 10.1056/NEJM199502023320518. [DOI] [PubMed] [Google Scholar]
- 23.Hemanth Kumar A.K., Kannan T., Chandrasekaran V., Sudha V., Vijayakumar A., Ramesh K., Lavanya J., Swaminathan S., Ramachandran G. Pharmacokinetics of thrice-weekly rifampicin, isoniazid and pyrazinamide in adult tuberculosis pa-tients in India. Int. J. Tuberc. Lung Dis. 2016:1236–1241. doi: 10.5588/ijtld.16.0048. [DOI] [PubMed] [Google Scholar]
- 24.McIlleron H., Rustomjee R., Vahedi M., Mthiyane T., Denti P., Connolly C., Rida W., Pym A., Smith P.J., Onyebujoh P.C. Reduced antituberculosis drug concentrations in HIV-infected patients who are men or have low weight: Implications for international dosing guidelines. Antimicrob. Agents Chemother. 2012:3232–3238. doi: 10.1128/AAC.05526-11. [DOI] [PMC free article] [PubMed] [Google Scholar]
- 25.Hong B.L., D’Cunha R., Li P., Al-Shaer M.H., Alghamdi W.A., An G., Peloquin C. A Systematic Review and Me-ta-analysis of Isoniazid Pharmacokinetics in Healthy Volunteers and Patients with Tuberculosis. Clin. Ther. 2020:e220–e241. doi: 10.1016/j.clinthera.2020.09.009. [DOI] [PubMed] [Google Scholar]
- 26.Subbarao S., Wilkinson K.A., van Halsema C.L., Rao S.S., Boyles T., Utay N.S., Wilkinson R.J., Meintjes G. Raised Ve-nous Lactate and Markers of Intestinal Translocation Are Associated With Mortality Among In-Patients With HIV-Associated TB in Rural South Africa. J. Acquir. Immune Defic. Syndr. 2015;70:406–413. doi: 10.1097/QAI.0000000000000763. [DOI] [PMC free article] [PubMed] [Google Scholar]
- 27.Schutz C., Barr D., Andrade B.B., Shey M., Ward A., Janssen S., Burton R., Wilkinson K.A., Sossen B., Fukutani K.F., et al. Clinical, microbiologic, and immunologic determinants of mortality in hospitalized patients with HIV-associated tu-berculosis: A prospective cohort study. PLoS Med. 2019;16:e1002840. doi: 10.1371/journal.pmed.1002840. [DOI] [PMC free article] [PubMed] [Google Scholar]
- 28.Te Brake L.H.M., de Jager V., Narunsky K., Vanker N., Svensson E.M., Phillips P.P.J., Gillespie S.H., Heinrich N., Hoelscher M., Dawson R., et al. Increased bactericidal activity but dose-limiting intolerability at 50 mg·kg-1 rifampicin. Eur. Respir. J. 2021:2000955. doi: 10.1183/13993003.00955-2020. [DOI] [PMC free article] [PubMed] [Google Scholar]
- 29.Dooley K.E. High-Dose Rifampin: Shall We Be Bolder? Am. J. Respir. Crit. Care Med. 2018;198:558–560. doi: 10.1164/rccm.201806-1140ED. [DOI] [PubMed] [Google Scholar]
- 30.Aarnoutse R.E., Kibiki G.S., Reither K., Semvua H.H., Haraka F., Mtabho C.M., Mpagama S.G., van den Boogaard J., Sumari-de Boer I.M., Magis-Escurra C., et al. Pharmacokinetics, Tolerability, and Bacteriological Response of Rifampin Administered at 600, 900, and 1200 Milligrams Daily in Patients with Pulmonary Tuberculosis. Antimicrob. Agents Chemother. 2017;61:e01054-17. doi: 10.1128/AAC.01054-17. [DOI] [PMC free article] [PubMed] [Google Scholar]
- 31.Walsh K.F., Vilbrun S.C., Souroutzidis A., Delva S., Joissaint G., Mathurin L., Ocheretina O., Cremieux P., Pape J.W., Koenig S.P. Improved Outcomes With High-dose Isoniazid in Multidrug-resistant Tuberculosis Treatment in Haiti. Clin. Infect. Dis. 2019;69:717–719. doi: 10.1093/cid/ciz039. [DOI] [PMC free article] [PubMed] [Google Scholar]
- 32.Diacon A., Miyahara S., Dawson R., Sun X., Hogg E., Donahue K., Urbanowski M., De Jager V., Fletcher C.V., Hafner R., et al. Assessing whether isoniazid is essential during the first 14 days of tuberculosis therapy: A phase 2a, open-label, randomised controlled trial. Lancet Microbe. 2020:e84–e92. doi: 10.1016/S2666-5247(20)30011-2. [DOI] [PMC free article] [PubMed] [Google Scholar]
- 33.Pasipanodya J.G., Gumbo T. Clinical and toxicodynamic evidence that high-dose pyrazinamide is not more hepatotoxic than the low doses currently used. Antimicrob. Agents Chemother. 2010:2847–2854. doi: 10.1128/AAC.01567-09. [DOI] [PMC free article] [PubMed] [Google Scholar]
- 34.Levy M.M., Fink M.P., Marshall J.C., Abraham E., Angus D., Cook D., Cohen J., Opal S.M., Vincent J.L., Ramsay G. SCCM/ESICM/ACCP/ATS/SIS. 2001 SCCM/ESICM/ACCP/ATS/SIS International Sepsis Definitions Conference. Crit. Care Med. 2003:1250–1256. doi: 10.1097/01.CCM.0000050454.01978.3B. [DOI] [PubMed] [Google Scholar]
- 35.Liu J., Ochieng C., Wiersma S., Ströher U., Towner J.S., Whitmer S., Nichol S.T., Moore C.C., Kersh G.J., Kato C., et al. Development of a TaqMan Array Card for Acute-Febrile-Illness Outbreak Investigation and Surveillance of Emerging Pathogens, Including Ebola Virus. J. Clin. Microbiol. 2016:49–58. doi: 10.1128/JCM.02257-15. [DOI] [PMC free article] [PubMed] [Google Scholar]
- 36.Justine M., Yeconia A., Nicodemu I., Augustino D., Gratz J., Mduma E., Heysell S.K., Kivuyo S., Mfinanga S., Peloquin C.A., et al. Pharmacokinetics of First-Line Drugs Among Children With Tuberculosis in Rural Tanzania. J. Pediatric. Infect. Dis. Soc. 2020;9:14–20. doi: 10.1093/jpids/piy106. [DOI] [PMC free article] [PubMed] [Google Scholar]
- 37.Heysell S.K., Moore J.L., Keller S.J., Houpt E.R. Therapeutic drug monitoring for slow response to tuberculosis treatment in a state control program, Virginia, USA. Emerg. Infect. Dis. 2010;16:1546–1553. doi: 10.3201/eid1610.100374. [DOI] [PMC free article] [PubMed] [Google Scholar]
Associated Data
This section collects any data citations, data availability statements, or supplementary materials included in this article.
Data Availability Statement
The data presented in this study are available on request from the corresponding author. The data are not publicly available due to original data use agreements but may be available in the future.


