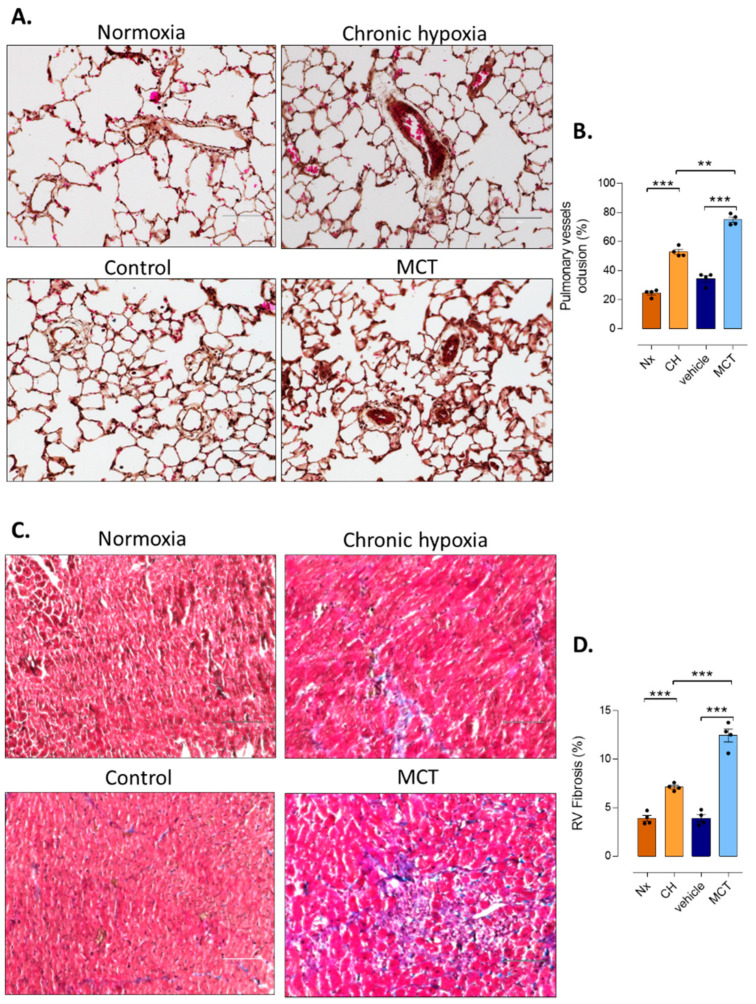
Figure 2.
Characterization of pulmonary vascular remodeling and RV fibrosis in CH-PH and MCT-PH rats and their respective controls. (A). Representative hematein–eosin–safran (HES) staining of the paraffin-embedded lung sections from the control, MCT, Vehicle, Chronic hypoxia (CH), and normoxia (Nx) groups. Scale bar = 100 μm. (B). Pulponary vessel occlusion (%) in the control, the control, MCT, Vehicle, CH and Nx groups (n = 4 different rats per condition). (C). Interstitial fibrosis was identified with trichrome Masson staining in the RV compartments of control, the control, MCT, Vehicle, CH, and Nx groups. Scale bar = 100 μm (D). Quantification of the percentage of fibrosis in RV tissues from control and MCT-exposed rats (n = 20 images per rat from 4 rats). t-tests were used after verification of normal distribution of values (Shapiro–Wilk normality test). Significance: ** p ≤ 0.01; *** p ≤ 0.001.

