

Abstract
In the era of artificial intelligence, the healthcare industry is undergoing tremendous innovation and development based on sophisticated AI algorithms. Focusing on diagnosis process and target disease, this study theoretically proposed an integrated model to optimize traditional medical expense system, and ultimately helps medical staff and patients make more reliable decisions. From the new perspective of total expense estimation and detailed expense analysis, the proposed model innovatively consists of two intelligent modules, with theoretical contribution. The two modules are SVM-based module and SOM-based module. According to the rigorous comparative analysis with two classic AI techniques, back propagation neural networks and random forests, it is demonstrated that the SVM-based module achieved better capability of total expense estimation. Meanwhile, by designing a two-stage clustering process, SOM-based module effectively generated decision clusters and corresponding cluster centers were obtained, that clarified the complex relationship between detailed expense and patient information. To achieve practical contribution, the proposed model was applied to the diagnosis process of coronary heart disease. The real data from a hospital in Shanghai was collected, and the validity and accuracy of the proposed model were verified with rigorous experiments. The proposed model innovatively optimized traditional medical expense system, and intelligently generated reliable decision-making information for both total expense and detailed expense. The successful application on the target disease further indicates that this model is a user-friendly tool for medical expense control and therapeutic regimen strategy.
Keywords: Artificial intelligence algorithm, System optimization, Medical expense, Disease diagnosis, Health care management
Introduction
In recent years, the healthcare industry has received more and more attention, especially with the global health incident, COVID-19 (coronavirus disease 2019). High-quality healthcare management is the foundation of human health and well-being, even boosts the economic development (Costa and Godinho Filho 2016). In the era of big data, massive medical data is generated with complex features. Advanced data analysis is required to develop an effective healthcare system. Nowadays, artificial intelligence (AI) is leading an innovative paradigm shift to healthcare area with the excellent capabilities of data acquisition and analysis (Wong et al. 2017). In fact, mimicking human cognitive abilities is the distinguishing feature of AI algorithms, and they even supersede human experts in certain areas. In the healthcare industry, numerous studies and business practices indicated that the medical decisions would be improved by employing AI algorithms, and results are more accurate and valid than human experience and intuition (Yu et al. 2018). As a result, AI algorithms are increasingly applied to various healthcare activities/scenarios with a proliferation of innovations, such as diagnosis of disease, hospital logistics, medical equipment failure detection, medical process optimization, etc.
A growing proportion of the world’s population suffers from various illness today, especially for the elderly population, and the economic burden of such patients has become increasingly high. Therefore, an important area in healthcare to which AI algorithms can be applied is medical expense system. Both medical staff and patients would benefit from an outstanding medical expense system for more accurate and reliable decisions (Kuo et al. 2019), especially in disease diagnosis process. Coronary heart disease (CHD), or coronary artery disease, is a common affliction of the elderly. CHD is a narrowing of the blood vessels that supply blood and oxygen to the heart, and it is the most common type of heart disease that causes a large number of deaths every year. Usually, a proper surgery (e.g. stent) is essential for CHD therapy. With effective medical expense system in CHD diagnosis process, medical staff would provide optimal therapeutic regimen and equipment selection decisions for geriatric patients. Meanwhile, old patients would participate in the decision-making process based on their financial conditions. In fact, CHD therapy always involves expensive surgical equipment. Therefore, optimizing CHD medical expense system to obtain valid information is an important research question. Based on these considerations, this study focuses on the issue of CHD medical expense system optimization, and the data objects are old patients over sixty years old. However, the factors affecting CHD medical expense are complex, and their relationship is chaotic with a non-linear characteristic. Extracting valid variables for CHD is a key but challengeable task. In addition, with the rapid development of healthcare system, such as electronic health records (EHRs) and hospital information system (HIS), tremendous history data is generated. The raw data is always disorder with chaotic information, such as individual features, assay results, textual data, numerical data, image data, etc. Making use of these “big data” is the guarantee of accurate healthcare decisions, and effective management insights are further generated (Pramanik et al. 2017). As a result, a novel AI-based model for target disease is on demand. This research innovatively optimizes medical expense system in diagnosis process from two perspectives, total medical expense estimation and detailed medical expense analysis. With rigorous comparative analysis of different AI algorithms, support vector machine (SVM) (Bai et al. 2015) and self-organizing maps (SOM) (Creput et al. 2012) are introduced in this research. The former is a powerful prediction tool, and the latter is well-known for clustering capability.
To sum up, this study focuses on medical expense system optimization in diagnosis process, and an integrated model is theoretically developed with two intelligent modules by using artificial intelligence algorithms. To achieve practical value, the presented model is applied to coronary heart disease (CHD). The real data from a hospital in Shanghai is collected. The remainder of this paper is organized as follows. First, relevant literature is reviewed in Sect. 2. The intelligent integrated model is investigated in Sect. 3. The explanations of input/output variables and datasets are reported in Sect. 4. The experiments and results are given in Sect. 5, and the conclusions are summarized in Sect. 6.
Literature review
Two streams of relevant studies have been reviewed as follows, specifically, optimization of medical expense system and artificial intelligence algorithms in healthcare.
Optimization of medical expense system
Medical expense analysis (MEA) becomes an important topic in the domains of politics, economics and society (Chai et al. 2018), optimizing traditional medical expense system with advanced AI algorithms is therefore a crucial issue. Patients would make more appropriate financial decisions by using the system, and the cost of healthcare organizations could be controlled effectively.
Cao et al. (2020) predicted medical expense for gastric cancer based on process mining, and they changed the original dynamic-service-flow-net into a dynamic-medical-path-net by taking the repetition times of nodes into account. The results showed that their AI based method outperforms conventional methods. Similarly, Kuo et al. (2019) developed a medical cost forecasting model for acute hepatitis patients in emergency room considering the uncertainty and hesitation in human being's thinking. The model was built with genetic algorithm-based intuitionistic fuzzy neural network, and the computational results showed that the GA-IFNN is more efficient than conventional algorithms. Differently, Kim and Park (2019) investigated the issue of improving prediction of high-cost healthcare users, and AI-based data mining models were employed, including random forest and neural network. They found that medical check-up data improve cost-based prediction models marginally and medical check-up data can be a viable alternate data source to diagnosis data in predicting high-cost users. Focusing on the issue of predictive reliability and validity of hospital cost analysis, Son et al. (2020) proposed a new method by using genetic algorithm (GA) and artificial neural network (ANN). The experiment results showed that their method achieved better accuracy. From these previous researches, it is demonstrated that AI-based techniques achieve satisfied performance and they are thus adequate for optimizing medical expense system. However, the object of CHD expense system is the elderly, optimizing input/output variables is a necessary task with rigorous sample selection process. From the perspective of statistics, Eyarajah et al. (2020) proposed empirical likelihood methods based on influence function and Jackknife techniques to construct confidence intervals for quantile medical costs with censored data. Their proposed methods were observed to have better finite-sample performances than existing methods. Likewise, Maneerat and Niwitpong (2020) considered the medical care costs data with a high proportion of zero items of two inpatient groups. The Bayesian credible interval-based uniform-beta prior (BCIh-UB) is proposed and compared with the generalized confidence interval (GCI), fiducial GCI (FGCI), etc. Two sets of medical care costs data were used to verify the efficacy of BCIh-UB. Meanwhile, Morid et al. (2019) aimed to design and assess a method to leverage individuals' temporal data for predicting their healthcare cost. They first used patients' temporal data in their fine-grain form as opposed to coarse grain form, then evaluated the effectiveness of different types of temporal features based on cost information, visit information and medical information. Akiyama and Abraham (2017) concentrated on another aspect, and conducted comparative cost–benefit analysis of tele-homecare for community-dwelling elderly in Japan. They compared different operational models, including non-government and government-supported funding.
By observation of previous papers, it is found that most previous studies focused on traditional disease diagnosis issue. However, there is not enough discussion on medical expense, especially for CHD. Not only that, a reliable medical expense system should solve both total expense issue and detailed expense issue, with same medical data source. It motivated us to innovatively optimize traditional medical expense system from two perspectives, by integrating two intelligent modules. Second, three main techniques were applied in previous research, and they are AI algorithms, statistical methods, and operational research models. Many studies showed that AI algorithms outperform other techniques with satisfied results. With this consideration, AI algorithms were introduced to optimize traditional system. Meanwhile, the capabilities of various AI algorithms are different. Hence, identifying the most appropriate AI algorithm for CHD is required with comparative analysis. Additionally, CHD is a high-incidence disease of the elderly. The factors affecting expense would differ from other diseases. Therefore, a new model for CHD should be developed by optimizing input/output variables and sample selection. These are the innovation drivers for this research.
Artificial intelligence algorithms in healthcare
Nowadays, the society has entered the era of artificial intelligence. AI-based algorithms are changing every aspect of people’s lives, especially in the healthcare domain. Facing the severe epidemic COVID-19, AI and machine learning technologies played a vital role for healthcare systems (van der Schaar et al. 2021). In fact, various AI-based algorithms were developed to enhance the performance of healthcare fields. In summary, three healthcare fields have been investigated in-depth, basic biomedical research (e.g. prediction of transcription factor binding sites and simulation of molecular dynamics), translational research (e.g. prediction of chemical toxicity and drug–target prioritization), and clinical practice (e.g. interpretation of patient genomes and patient risk stratification for primary prevention) (Yu et al. 2018). From previous research, it is demonstrated that there are two powerful AI-based algorithms for healthcare management, self-organizing maps (SOM) and support vector machine (SVM).
SVM is a widely used machine learning technique-based pattern classification technique available nowadays. The primary aim of this technique is to project nonlinear separable samples onto another higher dimensional space by using different types of kernel functions. Yan et al. (2019) designed a novel kernel-free nonlinear SVM for semi-supervised classification in disease diagnosis, and the main idea is to classify data points into two classes by constructing two nonparallel quadratic surfaces. The proposed method could handle five benchmarking disease diagnosis problems well. Likewise, Huang et al. (2019) proposed an intelligent data-driven model for disease diagnosis based on SVM, and the model was applied to a case of cough variant asthma (CVA). The model could not only improve the diagnosis accuracy, but identify the most important factors affecting CVA. Meanwhile, Gao et al. (2019) focused on cough detection, several test attributes (like peak expiratory flow) were modeled by decision tree and SVM. The experimental results showed that fractional exhaled nitric oxide and percentage of eosinophils have a great effect on cough diagnosis. Du et al. (2019) aimed at solving the problem of deterioration of the generalization ability caused by SVM, and proposed a regression prediction method based on SVM ensemble learning. The method was applied to the scenario of medical examination scheduling, and the results indicated that the it could effectively reduce the computational complexity and improve the prediction accuracy. According to these previous studies, it is demonstrated that SVM was a use-friendly tool to determine whether patients were infected with diseases. However, medical expense is another important aspect during disease diagnosis process, and it is a key factor affecting decision-making for both patients and medical staff. With this consideration, this paper attempts to enhance the expense estimation ability of expense system by employing SVM algorithm.
SOM is the most popular artificial neural network algorithm in the unsupervised learning category. It is famous for the capability of solving difficult high-dimensional and nonlinear problems, and the topology-conserving mapping could be achieved by SOM. Yin et al. (2019) proposed an improved self-organizing competitive network (WSOM) algorithm based on the weighted selection of the initial connection, and the model was applied to venous thromboembolism (VTE). The results showed that WSOM could effectively screen explanatory variables for postoperative early warning of VTE, while also improving the accuracy of the postoperative early warning of VTE. Nilashi et al. (2020) presented a newly developed method for application in remote tracking of parkinson's disease progression. They used a SOM-based clustering approach to improve the accuracy and scalability of prediction, and nine clusters were detected with the best SOM map quality for clustering. Concentrating on the issue of accurate identification of human phosphorylated proteins, Cui and Ding (2020) first trained two supervised kernel self-organizing maps (SKSOMs), the two trained SKSOMs were than ensembled to perform the final prediction. This study demonstrated a new sensitive avenue to identify human phosphorylated proteins and could be readily extended to recognize phosphorylated proteins for other species. To overcome the problem of medical image information retrieval and video thumbnail extraction, Pinto et al. (2021) studied a content-based image retrieval (CBIR) and a content-based video retrieval (CBVR) technique using clustering algorithms based on SOM. Their study indicated that tumor and cancer could be easily deducted comparing the images with normal to the images with diseases, and the unsupervised nature of SOM has made the software more robust. With these previous researches, the excellent clustering ability of SOM motivates us to optimize medical expense system by classifying patients into different groups. Based on appropriate medical expense attributes and historical data, different patient clusters could be obtained. Obviously, patients’ individual characteristics and corresponding expense characteristics would be distinctive for each cluster. The cluster division results therefore provide critical information for decision-making in diagnosis process, and a wealth of managerial insights could be acquired.
Proposed integrated model
In this section, an integrated model is developed to optimize medical expense system in diagnosis process. Focusing on both total expense estimation and detailed expense analysis, the model is integrated of two intelligent modules, SVM-based module and SOM-based module. The schematic of this model is shown in Fig. 1. In a word, the proposed integrated model could make use of medical information to achieve optimal expense control strategy and therapeutic regimen strategy.
Fig. 1.

The schematic of the proposed model
The SVM-based module is built for regression prediction with the basic concept of SVM (Bai et al. 2015). Suppose that the data set is . Here, x denotes the core variables affecting total CHD medical expense, and y denotes total expense. The comprehensive explanation of all variables is provided in Sect. 4. The concept of SVM-based module is to search for a function f(x) that deviates from y by a value no greater than ϵ for each training point x, and at the same time is as flat as possible, see Fig. 2. Similar to classification problem, the purpose here is also to minimize error, individualizing the hyperplane which maximizes the margin. Notice that, part of the error is tolerated with epsilon.
Fig. 2.

The core concept of SVM regression
The problem of this module is initially represented as follow,
| 1 |
| 2 |
The constant C in Eq. (1) is the box constraint, and it is a positive numeric value. The function of C is to control the penalty imposed on observations that lie outside the epsilon margin as well as help to prevent overfitting.
The slack variables and are then introduced based on the “soft margin” concept in classification problem. Objective function is hence built with slack variables, see Eq. (3).
| 3 |
The Lagrange function is built with Lagrange multipliers , , ,
| 4 |
The corresponding dual problem is obtained, see Eq. (5).
| 5 |
Meanwhile, the problem is constrained by Karush–Kuhn–Tucker (KKT) complementarity conditions, see Eq. (6), to achieve optimal solutions. The problem is finally represented as Eq. (7) with the results of b and w.
| 6 |
| 7 |
However, certain regression problems cannot adequately be explained with a linear model. As a result, nonlinear kernel functions are introduced that transforms data into a higher dimensional feature space to make it possible to perform the linear separation. The problem is then represented as Eqs. (8) and (9) in nonlinear situation, with KKT complementarity conditions.
| 8 |
| 9 |
In fact, there are different types of kernel function, such as Gaussian kernel function and Polynomial kernel function.
| 10 |
| 11 |
Based on the theory of SOM (D'Urso et al. 2020), the SOM-based module is built for expense clustering analysis. In this module, the data of detailed medical expense is denoted by an n-dimensional vector X in the input layer (see Fig. 3). X = [X1, X2, X3, …, Xn], n is the number of variables (detailed medical expense items), also the number of input neurons. It is also assumed that there are j neurons in the output layer (or the competition layer, see Fig. 3), and j is related to the maximum number of final clusters.
Fig. 3.
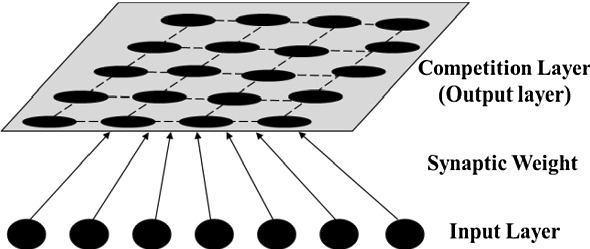
The basic concept of SOM
Notice that, the neurons in input layer are directly connected to the neurons in output layer. There is no hidden layer. Hence, each output neuron is connected to the input vector X via an n-dimensional weight vector W = [W1, W2, W3, …, Wn]. Besides, neurons in output layer are arranged in form of a topological architecture, and two-dimensional architecture is employed.
First, this module randomly initializes weight vectors. At the same time, the learning rate (αt) and radius of neighbourhood (Rt) are assigned the starting values.
According to the weight vectors, a best matching unit (BMU) is selected for each input vector. In other words, this module calculates Euclidean distance (EUD), expressed as dj, between input neurons and output neuron j by Eq. (12). Here, Wij means the ith weight of the jth output neuron.
| 12 |
Based on EUD between input vector and output neuron’s weight vector, the best matching neuron is defined as winner, expressed by j*, that achieves the minimum distance among dj. It means that the winner is the neuron whose weight vector is the most similar to input vector. Meanwhile, (Cx, Cy) is the topological coordinates of the winner.
| 13 |
This module then updates the weight W between input layer and output layer. This updating towards input sample is related to learning rate (αt) and neighborhood size. The learning rate gradually decreases with the iteration step index t. With weight vector Wij(t) of the winning neuron at iteration t, the updated weight vector Wij(t + 1) at iteration t + 1 is computed by Eq. (14).
| 14 |
| 15 |
| 16 |
In Eq. (14), is the neighborhood coefficient.
In Eq. (15), Rt represents the neighborhood radius and rj represents the neighborhood distance.
In Eq. (16), (Xj, Yj) means the topological coordinates of the jth output neuron.
The above process would continue until convergence (i.e. no noticeable changes in the weights) or the pre-defined number of training cycles is satisfied. In addition, the learning rate and the neighborhood radius would be decreased in each iteration by Eq. (17). Here, αc and Rc are the corresponding decreasing coefficients for learning rate and neighborhood radius, respectively.
| 17 |
Description of data and variables
The proposed integrated model is applied to the diagnosis of coronary heart disease (CHD). The experiment platform is Intel Core i5-5200U CPU, Windows 10 (64 bit), 4 GB RAM. All empirical data is from a real hospital in Shanghai, China. This hospital was founded in 1864 by French Consuls, and it is one of the largest and the earliest western medicine hospitals in China. There are 48 departments and 53 wards, 8 out of which are national key clinic disciplines, including cardiology department. Based on the cooperation with medical staff in cardiology department, medical data from 2017 to 2019 is collected.
Data and variables for SVM-based module
The SVM-based module is adequate to estimate total expense of CHD. In order to acquire effective and reasonable variables, preliminary work is required. First, the variables appearing in previous literature were carefully analyzed and summarized. Based on the literature research results, several interviews with related medical staff were conducted by using Delphi method. This method allowed healthcare experts to work toward a mutual agreement. Therefore, this rigorous empirical study process ensured the validity of variables, and 8 variables were extracted for SVM-based module. Table 1 provides the descriptive statistics analysis for the five numerical variables.
Total Expense. This variable is the overall expense that patients would afford during CHD therapy. The optimized medical expense system intelligently estimates total expense in CHD diagnosis process, and further helps patients and medical staff to make reliable decisions. It is the single output variable.
Gender. Male or female. Number 1 and 0 are employed to distinguish them.
Age. This is a numerical variable. It is noticed that most CHD patients are the aged. Hence, this research only collected the data from patients over sixty years old.
Hospital length of stay (HLOS). This is a numerical variable. During diagnosis process, medical staff should provide CHD patients the possible HLOS information based on patients' condition (economic condition and physical condition).
Month. It represents the month when patient is admitted to be hospitalized. In fact, month is also the indicator of season, it therefor affects patient’s physical condition (especially for old patients) as well as medical expense (e.g. hospitalization fee). There are 12 months during a year. The month of admission is denoted as 1, and other months are marked as 0.
Type of surgery (TOS). For CHD patients, stent is a common surgery type. Besides, CHD is the main factor resulting in arrhythmia (e.g. bradycardia), and pacemaker is another common surgery type. Hence, this research focuses on these two surgery types, stent and pacemaker. Obviously, surgery type determines medical expense, TOS is thus a key factor affecting total medical expense. Number 1 and 0 are employed to distinguish them as well.
Quantity of surgical equipment (QOSE). This is a numerical variable. In this study, pacemaker and stent are two main equipment for CHD surgery, and their quantities are various based on diagnosis results. More equipment is used, more medical expense would be required. Equipment quantity is an important factor affecting total expense.
Level of surgical equipment (LOSE). This research further considers the variable of LOSE. In fact, the price of surgical equipment is always high for CHD therapy, and there are different levels of surgical equipment in healthcare market. According to expert interviews, patients could choose the appropriate one based on their financial conditions. The unit price is introduced to represent LOSE, and it is a numerical variable. Equipment level is another crucial factor affecting total expense.
Table 1.
The descriptive statistics analysis for five numerical variables (before normalization)
| Numerical variable | Maximum | Minimum | Mean | Median |
|---|---|---|---|---|
| Total expense | 99,958.00 | 20,663.26 | 57,441.51 | 53,927.69 |
| Age | 98.00 | 60.00 | 72.07 | 70.00 |
| Hospital length of stay (HLOS) | 35.00 | 1.00 | 6.38 | 5.00 |
| Quantity of surgical equipment (QOSE) | 4.00 | 1.00 | 1.38 | 1.00 |
| Level of surgical equipment (LOSE) | 81,672.00 | 4763.00 | 21,953.18 | 17,200.00 |
The unit of Total Expense is CNY, the unit of Age is year, the unit of HLOS is day, the unit of QOSE is number, the unit of LOSE is CNY
Meanwhile, the correlation test was conducted among the four numerical input variables, and the Pearson correlation coefficient values are given in Table 2. The results show that these numerical input variables are significantly independent, that meets the principle.
Table 2.
The Pearson correlation test results
| Age | HLOS | QOSE | LOSE | |
|---|---|---|---|---|
| Age | 1.0000 | 0.2221 | − 0.0910 | 0.2588 |
| HLOS | 0.2221 | 1.0000 | 0.0032 | 0.0522 |
| QOSE | − 0.0910 | 0.0032 | 1.0000 | − 0.2753 |
| LOSE | 0.2588 | 0.0522 | − 0.2753 | 1.0000 |
For sample selection, there are 2100 samples in total after removing the samples with incomplete data and outliers. In addition, based on the principle of this module, two data groups are required, training data group and testing data group. As a result, all samples were randomly divided into two groups. Specifically, training data group with 1600 samples and testing data group with 500 samples. Further, all data was normalized to avoid the effect of dimensions and units, see Eq. (18).
| 18 |
Here, Dnew is the normalization data. D is the original data. Dmin is the minimum value of the corresponding variable, and Dmax is maximum value of the corresponding variable.
Data and variables for SOM-based module
The SOM-based module is adequate to analyze detailed medical expense. According to the results of empirical study in Sect. 4.1. There are 6 main items involved in total medical expense of CHD. Specifically, (1) Hospitalization fee, (2) Treatment fee, (3) Examination fee, (4) Assay fee, (5) Material fee and (6) Medicine fee.
More importantly, the preliminary data analysis indicated that material fee accounts for a large proportion of total expense. It obviously has a remarkable influence on total expense with maximum weight. With this consideration, a two-step clustering process was designed for the SOM-based module. Step one, all data was clustered with material fee item, resulting in primary clusters. Step two, for each primary cluster, the corresponding data was then clustered with other five items, resulting in secondary clusters. Consequently, total cluster quantity would be the number of primary clusters multiplies the number of secondary clusters. Precise clusters were then generated by this rigorous two-step clustering process, and each cluster has its own characteristics. As a result, more accurate and reliable decision insights would be obtained based on such cluster information.
Experiments and results
Experiments and results analysis of SVM-based module
First, the proposed integrated model could estimate total medical expense by SVM-based module, see Eqs. (1) to (11). In order to validate the superiority of the proposed model, contrastive analysis was conducted among SVM-based module and two classic AI techniques, back propagation neural networks (BPNN) and random forests (RF). In addition, their estimation capabilities were evaluated by a common indicator RMSE (root mean square error), see Eq. (19). Where, m is the sample number, De is the estimated data, Dr is the actual data. In terms of RMSE value, both normalization value and inverse-normalization value were computed in this research.
| 19 |
-
Total medical expense estimation by BPNN and RF
BPNN and RF were employed to make a comparison with SVM-based module. BPNN is a common AI approach for estimation/prediction issues, and it uses error back-propagation to modify internal network weights after each training epoch (Rumelhart et al. 1986). RF approach is also a common tool to solve estimation/prediction issues, and it consists of individual decision trees that operates as an ensemble (Breiman 2001). To ensure the validity of comparison results, the same input/output variables and data that used for SVM-based module was introduced for BPNN and RF as well. Table 3 provides key parameters for BPNN and RF, and corresponding RMSE values are given in Table 5.
Total medical expense estimation by SVM-based module
As discussed above, there are 7 variables as the inputs of SVM-based module, Gender, Age, Hospital length of stay (HLOS), Month, Type of surgery (TOS), Quantity of surgical equipment (QOSE) and Level of surgical equipment (LOSE). Total Expense is the output of SVM-based module. The key parameters for this module are provided in Tables 4, and 5 shows the corresponding RMSE values.
Table 3.
The key parameters for BPNN and RF
| Key parameters for BPNN | |||
| Input neurons | 20 | Output Neurons | 1 |
| Hidden layers | 1 | Optimizer | adam |
| Hidden neurons | 4 | Learning Rate | 0.001 |
| Loss function | mse | Validation Split | 0.1 |
| Dropout (hidden layer) | 0.1 | Batch Size | 50 |
| Activation function (hidden layer) | relu | Epochs | 10,000 |
| Activation function (output layer) | Sigmoid | ||
| Key parameters for RF | |||
| The number of mtry | 6 | The number of trees | 500 |
Table 5.
Estimation performance evaluation
| SVM-based module | BPNN | RF | |
|---|---|---|---|
| RMSE (normalization) | 0.0459 | 0.0583 | 0.0665 |
| RMSE (inverse-normalization) | 3636.9459 | 4624.8852 | 5273.7238 |
Table 4.
The key parameters for SVM-based module
| Key parameter | Value or type |
|---|---|
| The set type of SVM | nu-SVR |
| The set type of kernel function | Radial basis function |
| The optimal objective value of the dual SVM problem | − 123.480819 |
| The bias term in the decision function | − 0.378418 |
| The number of support vectors and bounded support vectors | 827 and 773 |
| The number of iterations | 2136 |
According to the results acquired from above experiments, useful conclusions are summarized,
By checking both normalization RMSE and inverse-normalization RMSE value, it is clear that SVM-based module outperforms the other two algorithms (BPNN and RF) with the minimum RMSE value. It indicates that the proposed model achieves satisfied estimation performance for CHD total medical expense.
Considering the inverse-normalization RMSE value is more appropriate to reflect real deviation of total medical expense, this index was analyzed further. It was then compared with median value and average value of total expense, see Table 1. It is found that the inverse-normalization RMSE value of SVM-based module (3636.9459) only accounts for 6.33% of average value (57,441.51) and 6.74% of median value (53,927.69). The small ratios further demonstrate that the proposed model achieves outstanding estimation performance with insignificant deviation. It is thus adaptive for medical expense system optimization.
Experiments and results analysis of SOM-based module
Second, detailed medical expense is analyzed by SOM-based module of proposed integrated model, see Eqs. (12) to (17). As discussed above, a certain number of precise clusters would be intelligently obtained by a rigorous two-step clustering process, specifically, primary cluster step and secondary cluster step. By using SOM-based module, 5 primary clusters were generated with material fee in step one, 4 secondary clusters were generated for each primary cluster with the other 5 expense items in step two, hospitalization fee, treatment fee, examination fee, assay fee and medicine fee. As a result, the total cluster quantity is 20 that is 4 (secondary clusters) multiplies 5 (primary clusters). Table 6 shows key parameters, and Table 7 gives the clustering results (cluster centers) of SOM-based module.
Table 6.
The key parameters for SOM-based module
| Parameter | Value (primary cluster step) |
Value (secondary cluster step) |
|---|---|---|
| Input neurons | 1 | 5 |
| Output neurons | 1 × 5 | 1 × 4 |
| Neighborhood | 3 | 1 |
| Learning rate | 0.1 | 0.1 |
| Neighborhood reduction | 0.99 | 0.99 |
| Learning rate reduction | 0.99 | 0.99 |
| The minimum of learning rate | 0.001 | 0.001 |
| Epochs | 10 | 10 |
Table 7.
Results of SOM-based module (cluster centers)
| No. of secondary cluster | Material fee | Hospitalization fee | Treatment fee | Examination fee | Assay fee | Medicine fee | Quantity | |
|---|---|---|---|---|---|---|---|---|
|
Primary Cluster 1 |
1 | 38,956.53 | 2603.83 | 3250.88 | 3304.82 | 5022.54 | 3821.26 | 104 |
| 2 | 38,956.53 | 1383.94 | 2570.47 | 2310.50 | 3807.64 | 1936.20 | 231 | |
| 3 | 38,956.53 | 482.91 | 2097.20 | 2269.58 | 3181.67 | 1460.71 | 344 | |
| 4 | 38,956.53 | 292.43 | 2035.66 | 1888.72 | 2540.70 | 1248.91 | 482 | |
|
Primary Cluster 2 |
5 | 43,161.78 | 312.00 | 2422.68 | 1822.30 | 2770.95 | 1414.54 | 85 |
| 6 | 43,161.78 | 446.78 | 2533.37 | 2482.32 | 3277.37 | 1666.83 | 64 | |
| 7 | 43,161.78 | 1234.89 | 3119.01 | 3146.73 | 4114.24 | 2919.23 | 33 | |
| 8 | 43,161.78 | 2926.62 | 4289.77 | 3419.75 | 5878.81 | 7027.49 | 16 | |
|
Primary Cluster 3 |
9 | 49,801.43 | 364.10 | 2296.77 | 2423.92 | 2804.00 | 1496.26 | 81 |
| 10 | 49,801.43 | 455.98 | 2381.40 | 1676.46 | 2541.17 | 1461.64 | 90 | |
| 11 | 49,801.43 | 864.65 | 2753.62 | 2073.04 | 3533.24 | 2254.55 | 74 | |
| 12 | 49,801.43 | 1836.33 | 3343.02 | 2890.19 | 5005.73 | 5798.79 | 23 | |
|
Primary Cluster 4 |
13 | 57,919.54 | 1875.86 | 3259.96 | 4729.38 | 5242.10 | 4509.80 | 21 |
| 14 | 57,919.54 | 947.52 | 2735.70 | 3032.20 | 3738.90 | 2291.22 | 60 | |
| 15 | 57,919.54 | 502.66 | 2384.71 | 2233.47 | 3145.12 | 1530.20 | 66 | |
| 16 | 57,919.54 | 401.34 | 2384.73 | 1730.60 | 2346.31 | 1597.02 | 130 | |
|
Primary Cluster 5 |
17 | 65,875.12 | 3629.18 | 7034.76 | 5532.20 | 7155.37 | 12,286.37 | 34 |
| 18 | 65,875.12 | 1803.93 | 4417.25 | 3229.24 | 4547.50 | 3877.01 | 123 | |
| 19 | 65,875.12 | 941.47 | 3401.73 | 2340.72 | 3351.80 | 1980.45 | 158 | |
| 20 | 65,875.12 | 632.68 | 2605.05 | 2064.43 | 2774.09 | 1235.52 | 404 |
Due to the clustering superiority of SOM-based module, cluster centers in each cluster were intelligently generated based on the principle of SOM, see center values in Table 7. It means samples in each cluster are close to their centers. For instance, the material fee value of each sample is close to 43,161.78 in primary cluster 2, the treatment fee value of each sample is close to 2381.40 in secondary cluster 10, and the assay fee value of each sample is close to 2774.09 in secondary cluster 20. As a result, each cluster has its own characteristics. On the one hand, it is clear that the detailed expense characteristic of each cluster differs significantly, especially the cluster center value. On the other hand, the corresponding patients in each cluster also have distinct characteristic. Consequently, detailed expense information in each cluster is associated with inpatients’ medical information, that creates a database of detailed expense and patients’ information. To be specific, with inpatients’ information, the corresponding cluster would be identified with detailed expense characteristics. Hence, the complex relationship between detailed expense and patients’ information would be clear based on the clustering results, and it efficiently helps patients and medical staff to make more accurate and reliable decisions. In fact, the availability of valid databases is a powerful tool for better healthcare decisions (Cesari et al. 2018), especially in diagnosis process. Meanwhile, with increasing inpatient quantity, the relationship between detailed expense and patients’ information would be more precise. In a word, this SOM-based module would generate decision clusters intelligently and clarify the relationship between detailed expense and patients’ information, it is definitely a use-friendly tool for medical expense system optimization.
Conclusions
In artificial intelligence era, AI algorithms facilitate major decisions determined by massive data, especially in the healthcare industry. Concentrating on medical expense system optimization, an integrated model was developed for CHD diagnosis process, with theoretical contribution. On the one hand, total medical expense was effectively estimated by SVM-based module. With rigorous contrastive analysis, the proposed model achieved better prediction performance than the other two classic AI techniques, back propagation neural networks and random forests. On the other hand, the SOM-based module was successfully used for the clustering analysis of detailed medical expense. Precise clusters were obtained by two-step clustering process, specifically, primary clusters and secondary clusters. These clusters reflect the clear relationship between detailed expense and patients’ information. The decisions of detailed expense would be more accurate based on patients’ information. According to the experiments with real medical data, it is demonstrated that the integrated model could be successfully applied to CHD diagnosis, with practical contribution. As a result, this integrated model is adequate for medical expense system optimization. For future study, variables and parameters could be optimized further to adapt various diseases or situations.
Acknowledgements
This study is supported by four projects: Clinic management and optimization project of Shanghai Shenkang hospital development center (SHDC12017623); Hospital management and development project of SJTU (CHDI-2019-B-14); Shanghai young teachers training program (ZZslg20009); National natural science foundation of China (51906169).
Footnotes
The pre-work of this paper is a conference paper, A two-stage medical expenses estimation model for inpatients during diagnosis process under artificial intelligence environment, 14th International Conference on Algorithmic Aspects in Information and Management, 2020.
Publisher's Note
Springer Nature remains neutral with regard to jurisdictional claims in published maps and institutional affiliations.
References
- Akiyama M, Abraham C. Comparative cost-benefit analysis of tele-homecare for community-dwelling elderly in Japan: non-government versus government supported funding models. Int J Med Inform. 2017;104:1–9. doi: 10.1016/j.ijmedinf.2017.04.017. [DOI] [PubMed] [Google Scholar]
- Bai YQ, Han X, Chen T, Yu H. Quadratic kernel-free least squares support vector machine for target diseases classification. J Comb Optim. 2015;30(4):850–870. doi: 10.1007/s10878-015-9848-z. [DOI] [Google Scholar]
- Breiman L. Random forests. Mach Learn. 2001;45(1):5–32. doi: 10.1023/A:1010933404324. [DOI] [Google Scholar]
- Cao YZ, Guo YL, She Q, Zhu JW, Li B (2020) Prediction of medical expenses for gastric cancer based on process mining. Concurr Comput Pract Exp
- Cesari U, De Pietro G, Marciano E, Niri C, Sannino G, Verde L. A new database of healthy and pathological voices. Comput Electr Eng. 2018;68:310–321. doi: 10.1016/j.compeleceng.2018.04.008. [DOI] [Google Scholar]
- Chai J, Xing LM, Zhou YH, Li S, Lai KK, Wang SY. Impact of healthcare insurance on medical expense in China: new evidence from meta-analysis. Soft Comput. 2018;22(16):5201–5213. doi: 10.1007/s00500-017-2928-5. [DOI] [Google Scholar]
- Creput JC, Hajjam A, Koukam A, Kuhn O. Self-organizing maps in population based metaheuristic to the dynamic vehicle routing problem. J Comb Optim. 2012;24(4):437–458. doi: 10.1007/s10878-011-9400-8. [DOI] [Google Scholar]
- Cui BL, Ding Y. Accurate identification of human phosphorylated proteins by ensembling supervised kernel self-organizing maps. Mol Inform. 2020;39(7):1900141. doi: 10.1002/minf.201900141. [DOI] [PubMed] [Google Scholar]
- Du Y, Yu H, Li ZJ (2019) Research of SVM ensembles in medical examination scheduling. J Combin Optim
- D'Urso P, De Giovanni L, Massari R. Smoothed self-organizing map for robust clustering. Inf Sci. 2020;512:381–401. doi: 10.1016/j.ins.2019.06.038. [DOI] [Google Scholar]
- Eyarajah E, Wei GH, Qin GS. Influence function-based empirical likelihood for inference of quantile medical costs with censored data. Stat Methods Med Res. 2020;29(7):1913–1934. doi: 10.1177/0962280219880573. [DOI] [PubMed] [Google Scholar]
- Gao W, Bao WP, Zhou X. Analysis of cough detection index based on decision tree and support vector machine. J Comb Optim. 2019;37(1):375–384. doi: 10.1007/s10878-017-0236-8. [DOI] [Google Scholar]
- Huang H, Gao W, Ye CM (2019) An intelligent data-driven model for disease diagnosis based on machine learning theory. J Combin Optim
- Kim YJ, Park H. Improving prediction of high-cost health care users with medical check-up data. Big Data. 2019;7(3):163–175. doi: 10.1089/big.2018.0096. [DOI] [PubMed] [Google Scholar]
- Kuo RJ, Cheng WC, Lien WC, Yang TJ. Application of genetic algorithm-based intuitionistic fuzzy neural network to medical cost forecasting for acute hepatitis patients in emergency room. J Intell Fuzzy Syst. 2019;37(4):5455–5469. doi: 10.3233/JIFS-190554. [DOI] [Google Scholar]
- Maneerat P, Niwitpong SA. Comparing medical care costs using bayesian credible intervals for the ratio of means of delta-lognormal distributions. Intern J Uncertain Fuzziness Knowl Based Syst. 2020;28:51–68. doi: 10.1142/S021848852040005X. [DOI] [Google Scholar]
- Morid MA, Sheng ORL, Kawamoto K, Ault T, Dorius J, Abdelrahman S. Healthcare cost prediction: leveraging fine-grain temporal patterns. J Biomed Inform. 2019;91:103113. doi: 10.1016/j.jbi.2019.103113. [DOI] [PubMed] [Google Scholar]
- Nilashi M, Ahmadi H, Sheikhtaheri A, Naemi R, Alotaibi R, Alarood AA, Munshi A, Rashid TA, Zhao J (2020) Remote tracking of Parkinson's disease progression using ensembles of deep belief network and self-organizing map. Expert Syst Appl 159
- Pinto J, Jain P, Kumar T. A content based image information retrieval and video thumbnail extraction framework using SOM. Multimed Tools Appl. 2021;80:16683–16709. doi: 10.1007/s11042-020-10227-7. [DOI] [Google Scholar]
- Pramanik MI, Lau RYK, Demirkan H, Azad MAK. Smart health: big data enabled health paradigm within smart cities. Expert Syst Appl. 2017;87:370–383. doi: 10.1016/j.eswa.2017.06.027. [DOI] [Google Scholar]
- Rumelhart DE, Hinton GE, Williams RJ. Learning representations by back-propagating errors. Nature. 1986;323(6088):533–536. doi: 10.1038/323533a0. [DOI] [Google Scholar]
- Son L, Ciaramella A, Thu DT, Staiano A, Tuan TM, Hai PV. Predictive reliability and validity of hospital cost analysis with dynamic neural network and genetic algorithm. Neural Comput Appl. 2020;32(18):15237–15248. doi: 10.1007/s00521-020-04876-w. [DOI] [Google Scholar]
- van der Schaar M, Alaa AM, Floto A, Gimson A, Scholtes S, Wood A, McKinney E, Jarrett D, Lio P, Ercole A. How artificial intelligence and machine learning can help healthcare systems respond to COVID-19. Mach Learn. 2021;110(1):1–14. doi: 10.1007/s10994-020-05928-x. [DOI] [PMC free article] [PubMed] [Google Scholar]
- Wong BN, Ho GTS, Tsui E. Development of an intelligent e-healthcare system for the domestic care industry. Ind Manag Data Syst. 2017;117(7):1426–1445. doi: 10.1108/IMDS-08-2016-0342. [DOI] [Google Scholar]
- Yan X, Zhu HM, Luo J (2019) A novel kernel-free nonlinear SVM for semi-supervised classification in disease diagnosis. J Combin Optim
- Yin S, Chang J, Pan HL, Mao HZ, Wang M (2019) Early warning of venous thromboembolism after surgery based on self-organizing competitive network. J Combin Optim
- Yu KH, Beam AL, Kohane IS. Artificial intelligence in healthcare. Nat Biomed Eng. 2018;2(10):719–731. doi: 10.1038/s41551-018-0305-z. [DOI] [PubMed] [Google Scholar]