Abstract
Although high-throughput RNA sequencing (RNA-seq) has greatly advanced small non-coding RNA (sncRNA) discovery, the currently widely used complementary DNA library construction protocol generates biased sequencing results. This is partially due to RNA modifications that interfere with adapter ligation and reverse transcription processes, which prevent the detection of sncRNAs bearing these modifications. Here, we present PANDORA-seq (panoramic RNA display by overcoming RNA modification aborted sequencing), employing a combinatorial enzymatic treatment to remove key RNA modifications that block adapter ligation and reverse transcription. PANDORA-seq identified abundant modified sncRNAs—mostly transfer RNA-derived small RNAs (tsRNAs) and ribosomal RNA-derived small RNAs (rsRNAs)—that were previously undetected, exhibiting tissue-specific expression across mouse brain, liver, spleen and sperm, as well as cell-specific expression across embryonic stem cells (ESCs) and HeLa cells. Using PANDORA-seq, we revealed unprecedented landscapes of microRNA, tsRNA and rsRNA dynamics during the generation of induced pluripotent stem cells. Importantly, tsRNAs and rsRNAs that are downregulated during somatic cell reprogramming impact cellular translation in ESCs, suggesting a role in lineage differentiation.
High-throughput RNA sequencing (RNA-seq) has substantially facilitated the discovery of functional small noncoding RNAs (sncRNAs) over the past decade. Traditional construction of complementary DNA (cDNA) libraries for deep sequencing of sncRNAs is based on adapter ligation to the 3′ and 5′ small RNAs, which is followed by reverse transcription. This protocol has been proven to be efficient for many small RNA species that have a 5′ phosphate (5′-P) and 3′ hydroxyl (3′-OH) (Fig. 1a), such as microRNAs (miRNAs)1. However, this protocol has inherent problems when encountering sncRNAs bearing specific RNA modifications, including 3′ terminal modifications such as 3′-phosphate (3′-P) and 2’,3′-cyclic phosphate (2’3′-cP) that block the adapter ligation process2, and RNA methylations such as m1A, m3C, m1G and m2 2G that interfere with reverse transcription3-5. sncRNAs bearing one or more of these modifications are often inefficiently and incompletely converted into cDNAs, leading to challenges with their detection and quantitation by deep sequencing. This problem is particularly severe for highly modified sncRNAs such as transfer RNA-derived small RNAs (tsRNAs) and ribosomal RNA-derived small RNAs (rsRNAs)6,7, because their precursors (tRNAs and rRNAs) are known to harbour a diversity of RNA modifications8-10 and because 3′-P or 2’3′-cP is commonly implemented during the biogenesis of tsRNAs and rsRNAs2,11,12.
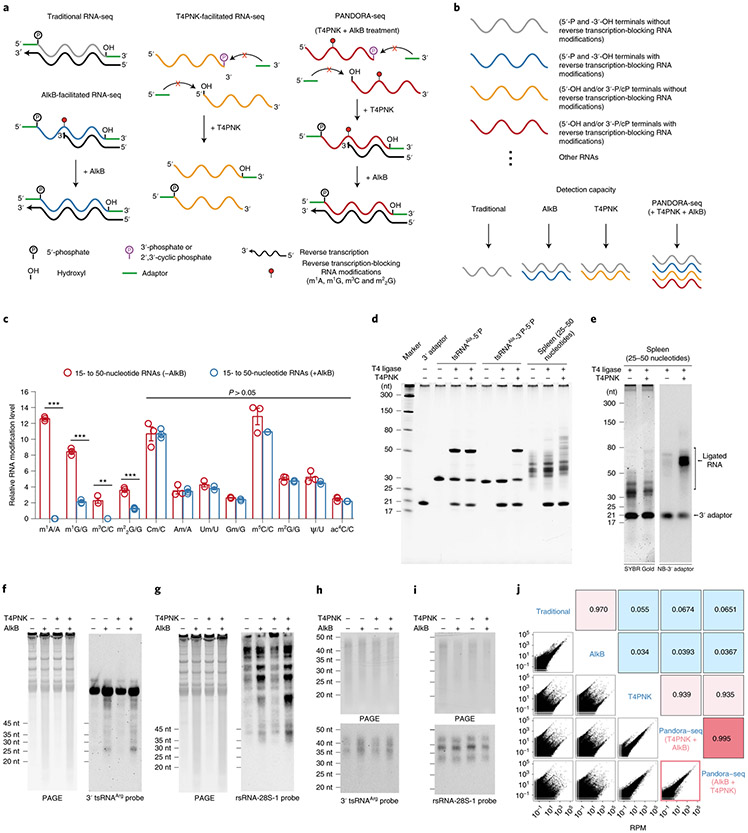
Fig. 1 ∣. Schematic overview, validation of AlkB and T4PNK enzyme activity, and protocol optimization of PANDORA-seq.
a, Schematics of the RNA properties (terminal and internal modifications) and key steps (adapter ligation and reverse transcription) of traditional RNA-seq, AlkB-facilitated RNA-seq, T4PNK-facilitated RNA-seq and PANDORA-seq. b, Schematic of the detection capacities of the abovementioned RNA-seq protocols from a small RNA pool. c, Demethylation activity of m1A, m1G, m3C and m22G with or without AlkB treatment of 15- to 50-nucleotide RNA fractions from mouse tissue (liver), as revealed by LC-MS/MS (n = 3 biologically independent samples). The data represent means ± s.e.m. Statistical significance was determined by two-sided multiple t-test (**P < 0.01; ***P < 0.001). d, Validation of improvements in 3′ terminal ligation following T4PNK treatment in synthesized tsRNAs and small RNA fractions extracted from mouse tissue (spleen). nt, nucleotides. e, Northern blot analysis of the 3′ adapter sequence to show, semi-quantitatively, improvement in the number of adapters being ligated before and after treatment with T4PNK. f–i, The improved treatment protocol minimized the potential artificial increase in tsRNAs and rsRNAs due to de novo degradation of tRNAs and rRNAs. In f and g, AlkB treatment on total RNAs (from HeLa cells) resulted in increased tsRNA (f) and rsRNA products (g), as observed by increased RNA smear (left) and by northern blots (right). In h and i, northern blot analyses of tsRNAs (h) and rsRNAs (i) after AlkB and/or T4PNK treatment on pre-size-selected RNA fractions (15- to 50-nucleotide RNA from HeLa cells) did not result in further degradation. For d–i, similar results were obtained in three independent experiments. j, Comparison of the PANDORA-seq results using treatment with either T4PNK first and AlkB second (T4PNK + AlkB) or AlkB first and T4PNK second (AlkB + T4PNK) in HeLa cells (15- to 50-nucletide RNA) showed highly consistent results (Spearman’s correlation; ρ = 0.995). Correlation coefficients for comparisons between other protocols are also provided. Statistical source data, precise P values and unprocessed blots are provided in the source data.
To discover the modified sncRNAs that escaped traditional RNA-seq, enzymatic treatment protocols have been developed to address specific RNA modifications. For example, treatments with the dealkylating enzyme α-ketoglutarate-dependent hydroxylase (AlkB) and its mutant forms have been introduced to demethylate RNA modifications (for example, m1G, m1A, m3C and m22G) to enable reverse transcription (Fig. 1a)3-5, and T4 polynucleotide kinase (T4PNK) has been used to convert the 3′-P or 2’3′-cP into 3′-OH and to add a 5′-terminal phosphate (5′-P), thus facilitating adapter ligation for RNA-seq of small13 and large14 RNAs (Fig. 1a). While these methods can reveal the sequence of specific sncRNAs bearing targeted modifications, each of these treatments alone cannot capture modified sncRNAs beyond their individual enzymatic capacity and therefore are not able to reveal a full sncRNA spectrum. In addition, the bioinformatics analyses of sncRNAs are currently evolving from focusing on miRNAs1 to other potentially important sncRNA species, including the emerging tsRNAs6,10,15,16 and rsRNAs17-19 that can now be systematically analysed along with miRNAs and PIWI-interacting RNAs (piRNAs) using our recently developed software20.
To test whether a combinatorial use of enzymatic treatments can overcome both adapter ligation and reverse transcription obstacles and reveal a more in-depth composition of sncRNAs, we developed PANDORA-seq (panoramic RNA display by overcoming RNA modification aborted sequencing) (Fig. 1a,b). Our method, coupled with our improved small RNA bioinformatics pipelines (see Methods), is based on consecutive enzymatic treatments of the small RNA fraction (15–50 nucleotides) with T4PNK and AlkB to provide stepwise optimization that improves both adapter ligation and reverse transcription during cDNA library construction, respectively (Fig. 1a). Systematic comparison with existing sncRNA-seq methods demonstrated that PANDORA-seq outperformed both traditional sequencing and individual AlkB or T4PNK treatments by more extensively and accurately uncovering previously unidentified modified sncRNAs in a wide range of mouse and human tissues and cells. PANDORA-seq also revealed unprecedented miRNA, tsRNA and rsRNA dynamics during the reprogramming of somatic cells to induced pluripotent stem cells (iPSCs), guiding us to probe their function during embryonic stem cell (ESC) differentiation. Together, PANDORA-seq and the sncRNA repertoire across different lineages open the avenue for future exploration of the hidden layer of functional sncRNAs in other biological and disease conditions.
Results
Enzyme validation and protocol optimization for PANDORA-seq.
We developed PANDORA-seq by leveraging a combination of two enzymatic treatments that can overcome distinct RNA modifications that either prevent reverse transcription (by AlkB treatment) or adapter ligation (by T4PNK treatment) (Fig. 1a). To this end, we first generated AlkB enzyme using a previously reported plasmid with codon optimization21. Then, we tested its enzymatic efficacy in removing RNA methylations using a high-throughput RNA modification quantitation platform based on liquid chromatography-tandem mass spectrometry (LC-MS/MS) that we developed previously17,22. The AlkB efficiency was tested by treating the 15- to 50-nucleotide RNA fraction extracted from mouse liver, followed by LC-MS/MS examination. As a result, the AlkB treatment efficiently removed m1A and m3C and also significantly decreased m1G and m22G to ~20% of their original levels (Fig. 1c). Our AlkB plasmid (see Methods) has sequence differences at the amino terminus compared with a previously reported AlkB4, but generated similar efficacy in removing m1A, m3C and m1G, demonstrating expected enzymatic activity.
The enzymatic efficacy of T4PNK in converting 3′-P and 2’3′-CP into 3′-OH was also tested in regard to its impact in facilitating RNA adapter ligation. As shown in Fig. 1d, synthetic tsRNAs with 3′-P cannot be ligated using T4 ligase, while T4PNK treatment of these 3′-P tsRNAs enabled a high ligation efficiency similar to that of the synthetic 3′-OH tsRNA (Fig. 1d). We further tested the effect of T4PNK on the 25- to 50-nucleotide RNA fraction recovered from mouse tissues, which is expected to contain 5′ tsRNAs bearing a 2’3′-cP end such as those generated by angiogenin-mediated cleavage of tRNA2. As an example, using RNAs from the mouse spleen (Fig. 1d), we found that while T4 ligase alone worked poorly on the untreated samples, T4PNK treatment substantially increased the overall adapter ligation efficiency (Fig. 1e), demonstrating T4PNK’s effect in improving adapter ligation for small RNA cDNA library construction.
Notably, although AlkB and T4PNK are not supposed to have ribonuclease activity, and despite the addition of RNase inhibitor during the enzymatic treatment, we noticed that when treating total RNA from tissues or cells, AlkB can cause detectable RNA degradation, as revealed by increased RNA smear in the small RNA region and increased levels of tsRNAs and rsRNAs detected by northern blots (Fig. 1f,g). This phenomenon might be due to the demethylation effect of AlkB on tRNAs and rRNAs, which results in altered RNA structure and increased fragmentation of tRNAs and rRNAs23. This effect will generate additional tsRNAs and rsRNA in the small RNA library as an artefact, which has not been addressed in previous publications using AlkB treatment3,4. To circumvent this problem, we optimized the protocol by applying a pre-size-selection procedure to first obtain the 15- to 50-nucleotide small RNA fraction from the total RNA and then performed enzymatic treatments on this 15- to 50-nucleotide RNA fraction. This procedure pre-eliminated the sources (that is, tRNAs and rRNAs) that generate artificial tsRNAs and rsRNAs from degradation and, importantly, the treatment of AlkB and/or T4PNK in the 15- to 50-nucleotide fraction did not cause further degradation of tsRNAs and rsRNAs (Fig. 1h,i).
We also tested the potential impact of the treatment order of AlkB and T4PNK by comparing the RNA-seq results for the treatment order of AlkB first and T4PNK second (AlkB + T4PNK) versus T4PNK first and AlkB second (T4PNK + AlkB) in HeLa cells. The results showed a high degree of correlation (ρ = 0.995; Fig. 1j) between both treatment orders, indicating that the order of treatment does not result in major differences. With the enzymatic validation and protocol optimization above, we established PANDORA-seq by first size-selecting the 15- to 50-nucleotide RNA fraction, followed by enzymatic treatment in the order T4PNK + AlkB, as applied to all other tissue or cell samples.
PANDORA-seq reveals a tsRNA- and rsRNA-enriched sncRNA landscape.
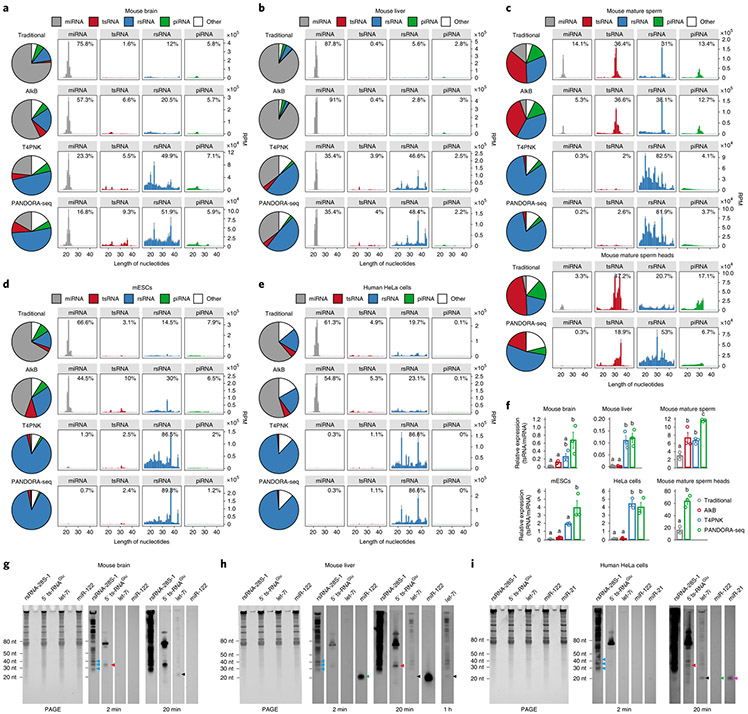
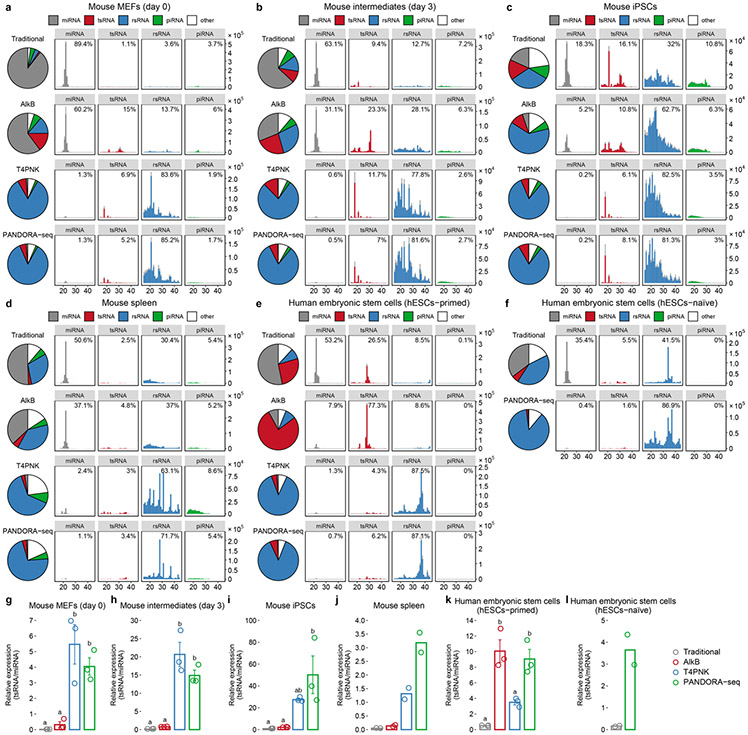
We assessed the outcome of PANDORA-seq in a variety of mouse and human tissue and cell types, including mouse brain, liver, spleen and mature sperm (and sperm heads), mouse ESCs (mESCs), human ESCs in primed and naive24 states, HeLa cells and cells during the reprogramming of mouse embryonic fibroblasts (MEFs) into iPSCs25. Three biological repeats were included for most tissues or cell types, but two biological repeats were included for the mouse spleen and naive hESC samples. The read summaries and differentially expressed sncRNAs between individual protocols are presented in Supplementary Table 1. sncRNA sequence distribution, as exemplified in mouse brain, liver, mature sperm, mESCs and HeLa cells (Fig. 2a-e) (see Extended Data Fig. 1 for the other tissue and cell types), revealed that while miRNAs are the dominant sncRNAs detected by traditional RNA-seq (except in mature sperm and sperm heads, as was previously known26), the treatment with AlkB and T4PNK substantially increased the reads of tsRNAs and rsRNAs in distinct patterns (Fig. 2a-e), and PANDORA-seq showed an overall enhanced effect compared with each treatment alone. Due to the abundantly increased rsRNA reads after T4PNK or PANDORA-seq treatment, which consumed the relative reads of tsRNAs and miRNAs (Fig. 2a-e), we further separately analysed the relative tsRNA/miRNA ratio under different treatment protocols (Fig. 2f and Extended Data Fig. 1g-l), which showed clearer effects of each treatment on tsRNA discovery. Notably, mature sperm heads contained the highest concentration of tsRNAs and showed the highest tsRNA/miRNA ratio across all samples examined under PANDORA-seq (Fig. 2c,f).
Fig. 2 ∣. Read summaries and length distributions of different sncRNA categories under traditional RNA-seq, AlkB-facilitated RNA-seq, T4PNK-facilitated RNA-seq and PANDORA-seq.
a–e, Comparison of different protocols in five representative tissue or cell types (from a total of 11; the results for the other tissue and cell types are provided in Supplementary Fig. 1): mouse brain (a), mouse liver (b), mouse mature sperm and mature sperm heads (c), mESCs (d) and HeLa cells (e). The results show a dynamic landscape of sncRNAs detected by different methods and across different tissue and cell types. The data represent means ± s.e.m. f, Relative tsRNA/miRNA ratios under different protocols (n = 3 biologically independent samples per bar). Different letters above the bars indicate a statistically significant difference (P < 0.05). Same letters indicate P ≥ 0.05. Statistical significance was determined by two-sided one-way ANOVA with uncorrected Fisher’s LSD test. All data are plotted as means ± s.e.m. g–i, The relative expression levels of miRNAs, tsRNAs and rsRNAs, as revealed by PANDORA-seq, were validated by northern blots. The results for mouse brain (g), mouse liver (h) and HeLa cells (i) are shown. For g–i, similar results were obtained in three independent experiments. Blue arrowheads point to rsRNA-28S-1, red arrowheads point to 5′ tsRNAGlu, black arrowheads point to let-7i, green arrowheads point to miR-122 and purple arrowheads point to miR-21. Statistical source data, precise P values and unprocessed blots are provided in the source data.
The abundant expression of rsRNAs revealed by PANDORA-seq is surprising, yet the results represent the in vivo situation. The relative expression levels of representative miRNA, tsRNA and rsRNA were further validated by northern blots in mouse brain, liver and HeLa cells (Fig. 2g-i). The abundant expression of tsRNAs and rsRNAs has also been detected previously in mouse sperm by northern blots17,27. Notably, certain miRNAs, such as miR-122, remain highly expressed in the liver compared with tsRNAs and rsRNAs (Fig. 2h), resonating with their crucial role in liver function28. A further examination of the relative efficiencies across different northern blot probes (that is, rsRNA-28S-1, 5′ tsRNAGlu, let-7i, miR-122 and miR-21) (Extended Data Fig. 2) enabled better semi-quantitative analysis of the relative levels of the examined sncRNAs in the tissues and cells by northern blot signal (Fig. 2g-i), again supporting the abundant existence of rsRNAs and tsRNAs compared with miRNAs, consistent with the result of PANDORA-seq.
Notably, our bioinformatics pipeline discovered appreciable piRNA reads from non-germ-cell mouse samples (Fig. 2a-e and Extended Data Fig. 1a-f). Since the annotation of piRNAs was based on the two existing publicly available piRNA databases29,30 but not the PIWI pulldown experiments of each tissue, the accuracy of the piRNA annotation largely depends on the quality of the databases. In fact, cautions are exercised in our analyses regarding the true identity of these piRNAs in mice: if one to three mismatches are allowed, the annotation rate of piRNAs (but not other types of sncRNAs) dramatically decreases and many piRNAs are annotated in other sncRNA categories (Extended Data Fig. 3), which puts the identity of these piRNAs in doubt. We avoided further analyses of piRNAs in the following results but focused on the other categories of sncRNAs that could be annotated reliably (for example, miRNAs, tsRNAs and rsRNAs).
miRNAs, tsRNAs and rsRNAs respond distinctly to PANDORA-seq.
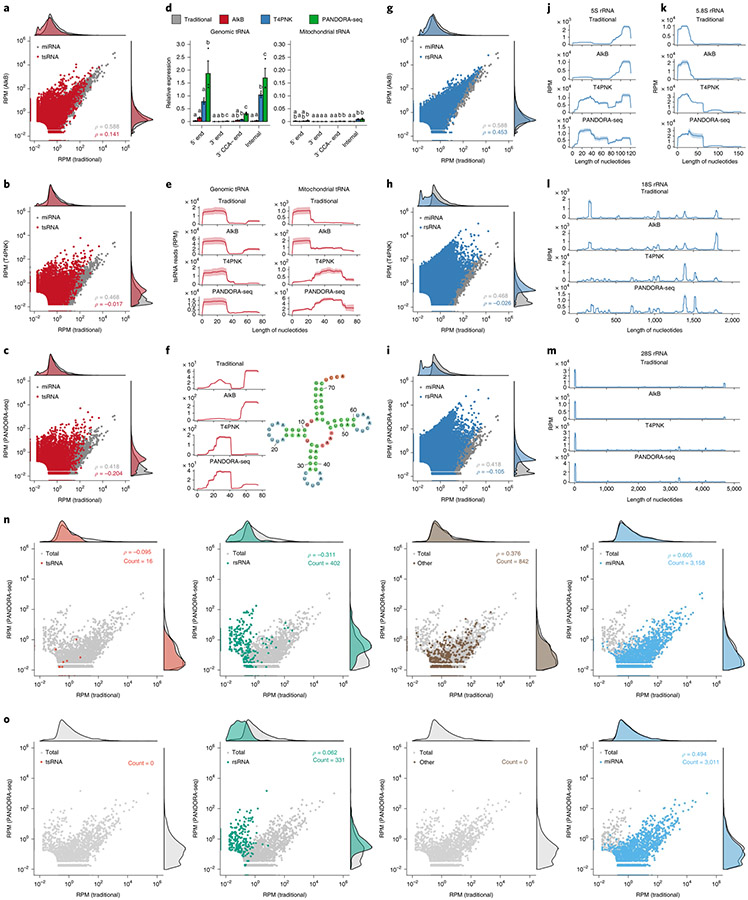
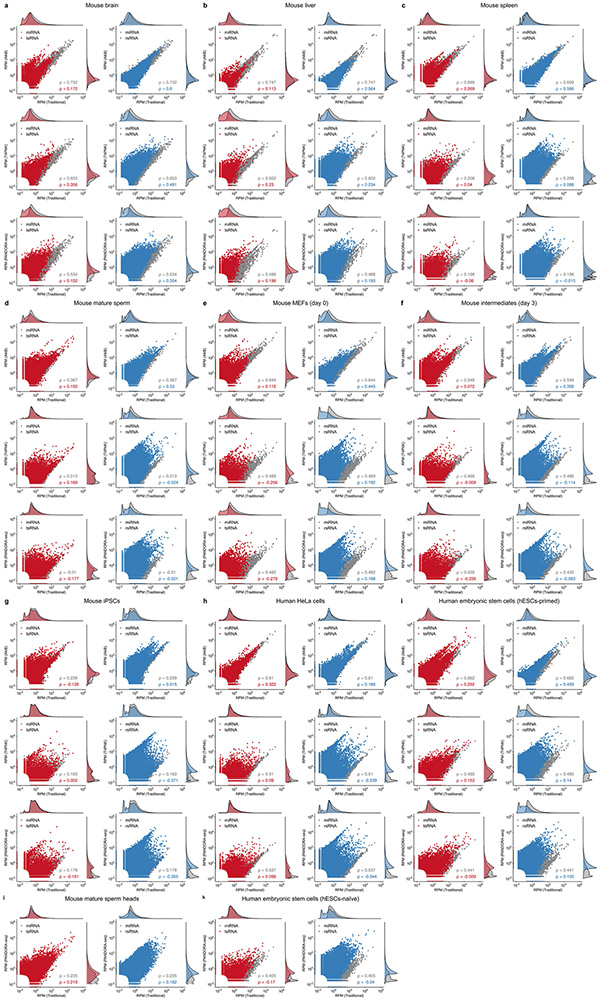
Next, we separately analysed the response of miRNAs, tsRNAs and rsRNAs upon T4PNK, AlkB and PANDORA-seq (T4PNK + AlkB) treatments. Using mESCs (Fig. 3a-m) as an example (see Extended Data Fig. 4 for other tissue and cell types), miRNA profiles were generally not dramatically changed after the enzymatic treatments, as shown in the correlations for traditional versus AlkB (Fig. 3a), traditional versus T4PNK (Fig. 3b) and traditional versus PANDORA-seq (T4PNK + AlkB) (Fig. 3c). This is consistent with the well-defined biogenesis pathways of miRNAs, which result in 5′-P and 3′-OH termini, and the fact that miRNA populations are less modified than tsRNA and rsRNA populations17.
Fig. 3 ∣. Dissecting the effects of AlkB, T4PNK and PANDORA-seq on different sncRNA populations in ESCs.
a–c, Scatter plots comparing profile changes in tsRNAs (red dots) and miRNAs (grey dots) detected using AlkB versus traditional (a), T4PNK versus traditional (b) and PANDORA-seq versus traditional protocols (c). ρ is the Spearman’s correlation coefficient. d, tsRNA responses to AlkB, T4PNK and PANDORA-seq in regard to different origins (5′ tsRNA, 3′ tsRNA, 3′ tsRNA-CCA end and internal tsRNAs). The y axes represent the relative expression level compared with total reads of miRNA (n = 3 biologically independent samples per bar). Different letters above the bars indicate statistically significant differences (P < 0.05). Same letters indicate P ≥ 0.05. Statistical significance was determined by two-sided one-way ANOVA with uncorrected Fisher’s LSD test. All data are plotted as means ± s.e.m. e, Overall length mapping showing the distribution of relative tsRNA reads from mature genomic (left) and mitochondrial (right) tRNA under different RNA-seq protocols. f, Dynamic response to different RNA-seq protocols (left) of a representative individual tsRNA (mouse tRNA-Gln-TTG-2; pictured right). g–i, Scatter plots comparing profile changes in rsRNAs (blue dots) and miRNAs (grey dots) detected using the following protocols: AlkB versus traditional (g), T4PNK versus traditional (h) and PANDORA-seq versus traditional (i). j–m, Comparison of rsRNA-generating loci by rsRNA mapping data on 5S rRNA (j), 5.8S rRNA (k), 18S rRNA (l) and 28S rRNA (m), detected using different RNA-seq protocols. n,o, Many of the previously annotated miRNAs from miRBase that showed upregulation under PANDORA-seq could also be annotated to other sncRNA categories, as exemplified in mESCs (n) and primed hESCs (o). The mapping plots in e, f and j–m are presented as means ± s.e.m. Statistical source data and precise P values are provided in the source data.
Compared with miRNAs, tsRNAs are sensitive to both AlkB and T4PNK, as demonstrated by the correlation pattern, with a substantial number of tsRNAs showing upregulation after each treatment alone or after PANDORA-seq treatment (T4PNK + AlkB) in mESCs (Fig. 3a-c) and similarly in other tissue and cell types (Extended Data Fig. 4). These results resonate with the fact that some reverse transcription-blocking RNA modifications in tsRNAs can be removed by AlkB, and that the 3′-P and 2’3′-cP termini of tsRNAs can be converted to 3′-OH by T4PNK to improve adapter ligation efficiency.
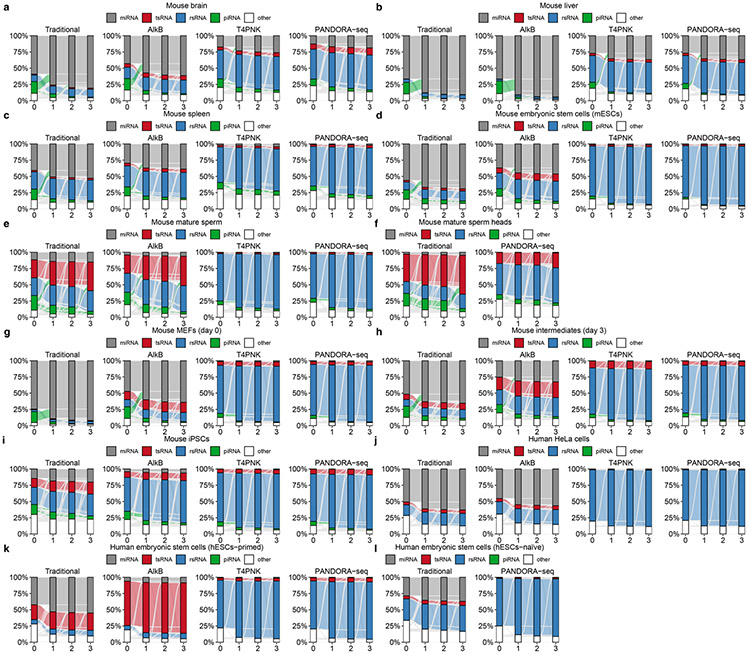
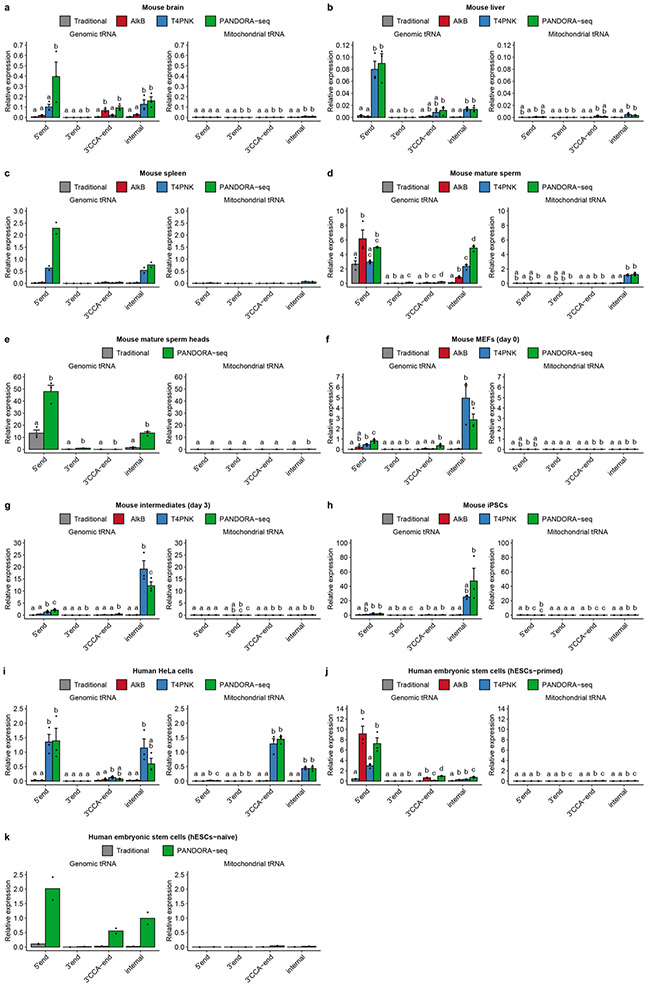
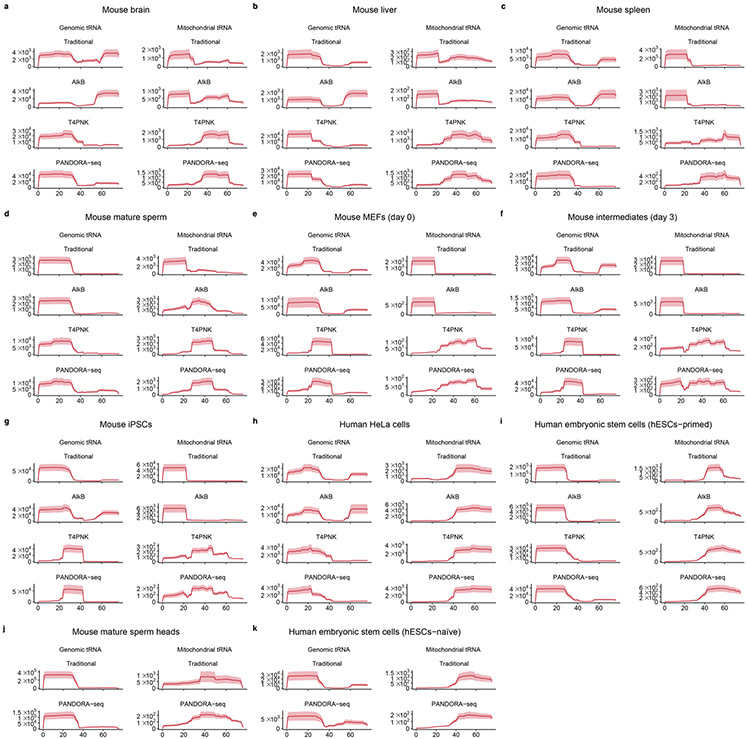
Notably, compared with the effects of AlkB and T4PNK treatment alone, a combinatorial effect of PANDORA-seq is observed when examining the relative expression of tsRNAs of different origins (5′ tsRNAs, 3′ tsRNAs, 3′ tsRNAs with a CCA end and internal tsRNAs) in mESCs (Fig. 3d; see Extended Data Fig. 5 for other tissue and cell types). The overall mapping of all tsRNAs on a tRNA length scale revealed the preferential loci from which tsRNAs are derived from the full-length tRNA under different protocols (Fig. 3e). In addition to the overall mapping analyses, individual tsRNAs have distinct responses, as exemplified in Fig. 3f (data on tsRNA mapping to each kind of tRNA in all tissue and cell types are provided in Supplementary Fig. 1). In contrast, mitochondrial tRNAs showed an overall different tsRNA production pattern compared with that of genomic tsRNAs (Fig. 3d,e), possibly because mitochondrial tRNAs bear different RNA modifications and structures31 that result in a differential cleavage pattern (see Extended Data Figs. 5 and 6 for the tsRNA mapping data in other tissue and cell types).
Compared with tsRNAs, rsRNAs are less sensitive to AlkB treatment but show a dramatic increase after T4PNK treatment (Fig. 3g-i), suggesting that many rsRNAs contain either a 3′-P or 2’3′-cP that can be converted to 3′-OH, or a 5′-OH that can be converted to 5′-P. Detailed mapping data of rsRNAs showed the specific loci of different ribosomal RNAs from which they are derived (as exemplified by 5S, 5.8S 18S and 28S rRNAs in Fig. 3j-m; data for 45S rRNA and mitochondria-encoded 12S and 16S rRNAs are provided in Supplementary Fig. 2), and the different effects between protocols can be visualized. Notably, PANDORA-seq further increased rsRNA detection compared with T4PNK alone, demonstrating that these sncRNAs harbour both adapter ligation-preventing terminal modifications and reverse transcription-blocking internal modifications. The rsRNA mapping data for other tissue and cell types are provided in Supplementary Fig. 2.
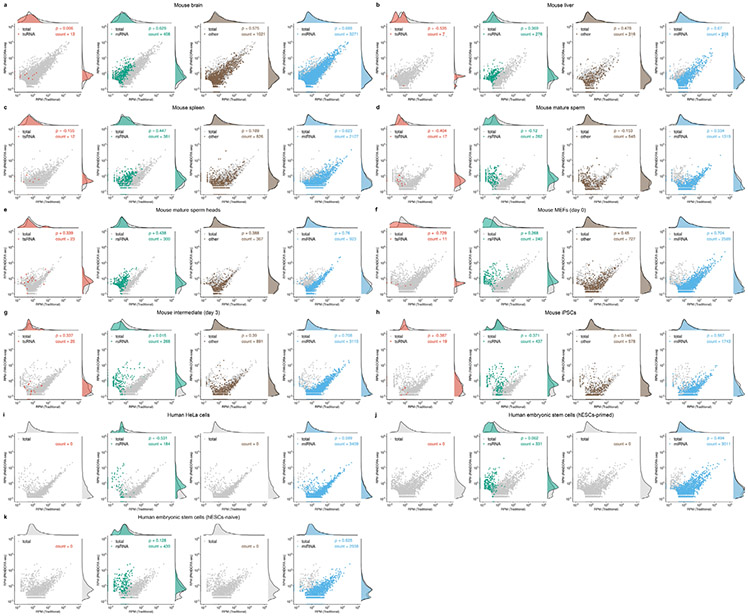
Interestingly, while the majority of miRNAs (annotated in miR-Base) are not responsive to AlkB and T4PNK treatment, a small portion of them indeed showed a significant upregulation in their relative expression levels following the PANDORA-seq protocol. Further analyses revealed that most of these distinct miRNA sequences can in fact be annotated to other sncRNA categories, with the majority of them annotated to rsRNAs in both mESCs and hESCs (Fig. 3n,o). Similar observations are also shown in other tissue and cell types (Extended Data Fig. 7 and Supplementary Table 2), suggesting that these miRNAs are distinct from canonical miRNAs and await further evaluation in miRBase.
PANDORA-seq reveals tissue- and cell-specific tsRNA and rsRNA patterns.
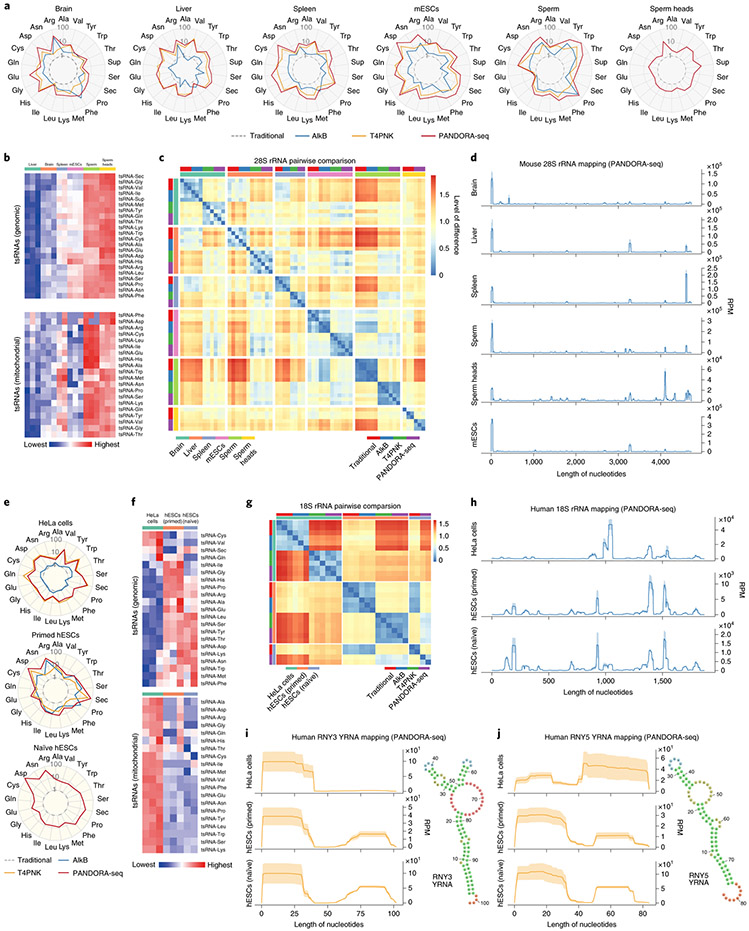
Using PANDORA-seq, we further analysed the expression patterns of tsRNAs and rsRNAs across six tissue and cell types in mice (brain, liver, spleen, mESCs, sperm and sperm heads) (Fig. 4a-d) and three cell types in humans (HeLa cells, primed hESCs and naive hESCs) (Fig. 4e-j). The radar plot of each tissue or cell type shows the relative response of each tsRNA subcategory to AlkB, T4PNK and PANDORA-seq treatment compared with the traditional protocol (the levels of tsRNA were normalized to total miRNA reads), revealing tissue- and cell-specific patterns (Fig. 4a,e). Notably, PANDORA-seq increased the relative levels of a majority of tsRNA subcategories to a greater extent compared with AlkB or T4PNK treatment alone (Fig. 4a,e). The heatmaps of genomic and mitochondrial tsRNAs further show the relative amount of each tsRNA subcategory (normalized with total miRNA reads) across mouse (Fig. 4b) and human (Fig. 4f) tissue and cell types.
Fig. 4 ∣. Tissue- and cell type-specific expression of tsRNAs and rsRNAs in mice and humans.
a, Radar plots showing the different sensitivities of five different mouse tissue or cell types in regard to different RNA-seq protocols. The numbers (1, 10 and 100) on the radius represent log values. b, Heatmaps showing the tsRNA (genomic and mitochondrial) relative expression levels (normalized to total miRNA levels and based on a log2-transformed scale in the row direction) of five different mouse tissue or cell types, as detected by PANDORA-seq. c, Pairwise comparison matrix showing the overall expression pattern difference of rsRNAs (derived from 28S rRNAs) under different RNA-seq protocols across five mouse tissue or cell types. Blue represents more similarity and red more difference. d, Comparison of rsRNA-generating loci from mouse 28S rRNA revealed distinct patterns across tissue and cell types. e, Radar plots showing the different sensitivities of three different human cell types in regard to different RNA-seq protocols. The numbers (1, 10 and 100) on the radius represent log values. f, Heatmaps showing the tsRNA (genomic and mitochondrial) relative expression levels (normalized to total miRNA levels and based on a log2-transformed scale in the row direction) of three different human cell types, as detected by PANDORA-seq. g, Pairwise comparison matrix showing the overall expression pattern difference of rsRNAs (derived from 18S rRNAs) identified using different RNA-seq protocols across three human cell types. Blue represents more similarity and red more difference. h, Comparison of rsRNA-generating loci from human 18S rRNA revealed distinct patterns across tissue and cell types. i,j, Exemplary human ysRNAs (RNY3 (i) and RNY5 (j)) that are differentially expressed between different cell types, as determined by PANDORA-seq. The mapping plots in d, h, i and j are presented as means ± s.e.m.
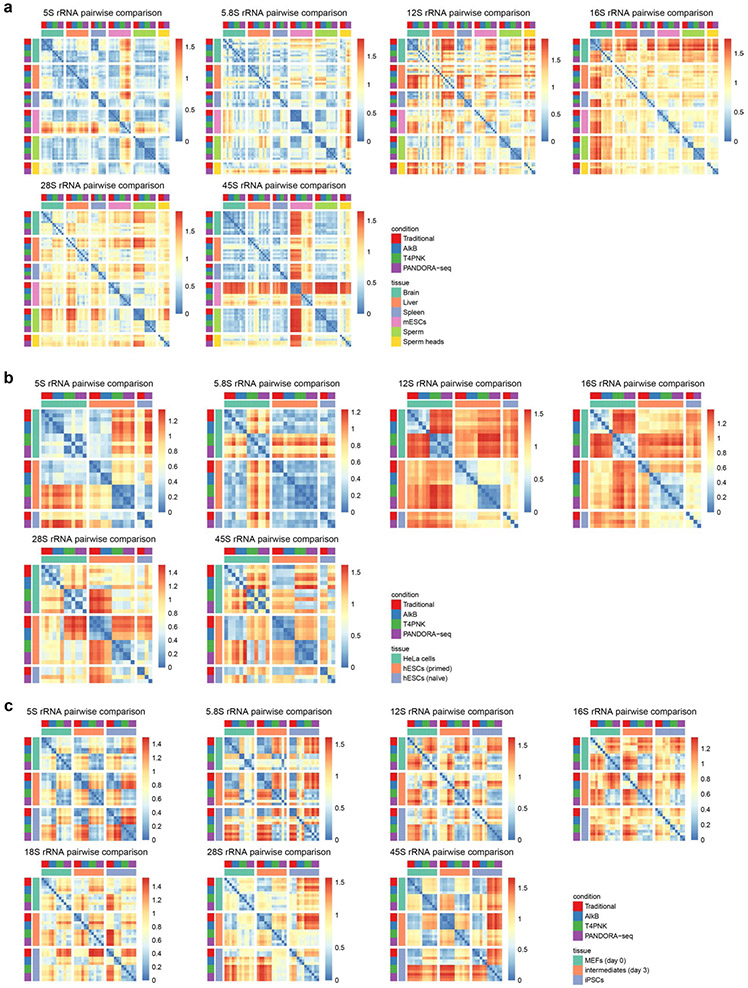
The mapping and overall comparative expression patterns of rsRNAs across different protocols and tissue or cell types are summarized according to their origin from individual ribosomal RNAs (that is, 5S, 5.8S, 18S, 28S, 45S and mitochondria-encoded 12S and 16S rRNAs) in Extended Data Fig. 8 and Supplementary Fig. 2. Overall coverage similarity comparison matrices (Fig. 4c,g) and detailed rsRNA mapping data (Fig. 4d,h) are presented using rsRNAs from 28S and 18S rRNA as examples, from which the distinct expression patterns of rsRNAs across tissue and cell types can be visualized and compared.
In addition to tsRNAs and rsRNAs, human and mouse samples also contain sncRNAs derived from YRNAs, which are defined as YRNA-derived small RNAs (ysRNAs) (Supplementary Fig. 3). ysRNAs have been reported to be involved in immunological processes32 and could be harnessed as disease markers along with tsRNAs and rsRNAs19. Our PANDORA-seq revealed that ysRNAs are differentially expressed between HeLa cells, primed hESCs and naive hESCs (Fig. 4i,j and Supplementary Fig. 3) and their biogenesis and functions await further exploration.
PANDORA-seq uncovers sncRNA dynamics during iPSC induction.
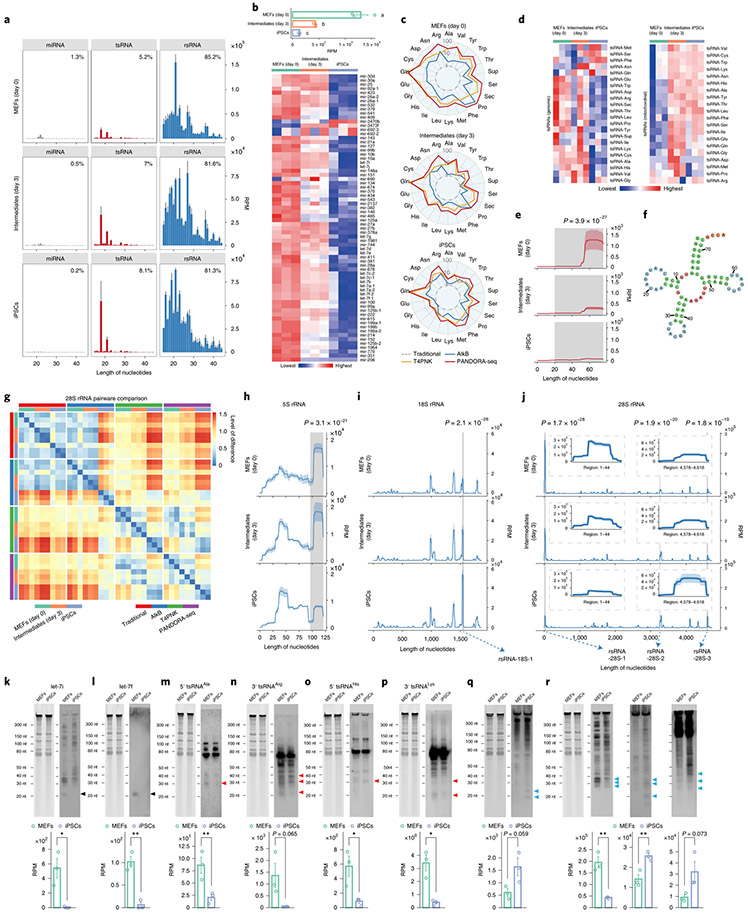
Finally, we used PANDORA-seq to explore the sncRNA dynamics during transcription factor-mediated somatic cell reprogramming to pluripotency. The levels of miRNAs, tsRNAs and rsRNAs showed dynamic changes during the reprogramming process: MEFs (day 0), reprogramming intermediates (day 3) and stably derived iPSCs (Fig. 5a). An overall decrease in the miRNA level during reprogramming was evident by PANDORA-seq (Fig. 5b). The overall tsRNA and rsRNA profiles between different protocols and across different stages are summarized for tsRNAs and rsRNAs in Fig. 5c,g and Extended Data Fig. 8. Heatmap analyses (Fig. 5d) and exemplary tsRNA loci mapping (Fig. 5e,f) showed a dynamic tsRNA expression pattern during the reprogramming process by PANDORA-seq. The rsRNA comparison matrix (Fig. 5g) showed that PANDORA-seq reveals more dynamic changes in expression patterns across different stages compared with traditional RNA-seq. Representative rsRNAs from 5S, 18S and 28S rRNAs (Fig. 5h-j) showed statistically significant changes in expression levels during the reprogramming process. Selected individual miRNAs, tsRNAs and rsRNAs between MEFs and iPSCs were validated by northern blots (Fig. 5k-r), with overall consistency with the PANDORA-seq results (Fig. 5k-r) but less consistency with the results of traditional RNA-seq (Supplementary Table 3).
Fig. 5 ∣. PANDORA-seq reveals that tsRNAs and rsRNAs are dynamically regulated during MEF reprogramming to iPSCs (day 0) to intermediate (day 3) and iPSC stages.
a, Dynamic changes in sncRNA distribution during iPSC reprogramming from MEFs (day 0) to intermediate (day 3) and iPSC stages (means ± s.e.m.), as determined by PANDORA-seq. b, Bar plot (top) and heatmap (bottom) showing miRNA expression changes (based on RPM values) during cell reprogramming using PANDORA-seq. c, Radar plots showing the different sensitivities of MEFs, intermediate stages and iPSCs in regard to different RNA-seq protocols. d, Heatmaps showing tsRNA (genomic and mitochondrial) expression levels (based on RPM values) during cell reprogramming using PANDORA-seq. e,f, Dynamic changes (e) of a representative tsRNA (tRNA-Arg-ACG-1; pictured in f) during the reprogramming process, as determined by PANDORA-seq. g, Pairwise comparison matrix showing the correlation of rsRNAs (derived from 28S rRNA) under different RNA-seq protocols during cell reprogramming. Blue signifies more similarity and red more difference. Note that PANDORA-seq revealed a more dynamic change across different stages than traditional RNA-seq. h–j, Comparison of rsRNA-generating loci by rsRNA mapping data on 5S rRNA (h), 18S rRNA (i) and 28S rRNA (j) under PANDORA-seq, showing dynamic changes during the reprogramming process. In e and h–j, the shaded peaks are marked with the significance value for the comparison between MEFs and iPSCs, as determined by two-way ANOVA. The mapping plots in e and h–j are presented as means ± s.e.m. The highlighted windows in i and j show the detailed read mappings of rsRNA-18S-1 (i) and rsRNA-28S-1, -2 and -3 (j), which were used for northern blot validation in q and r (see arrows). k–r, Northern blot examination of representative sncRNAs (let-7i (k), let-7f (l), 5′ tsRNAAla (m), 3′ tsRNAArg (n), 5′ tsRNAHis (o), 3′ tsRNALys (p), rsRNA-18S-1 (q) and rsRNA-28S-1, -2 and -3 (r)) was performed in MEFs and iPSCs. The northern blot signals (similar results were obtained in three independent experiments) showed overall consistency with their corresponding sequencing reads in MEFs and iPSCs, as revealed by PANDORA-seq (n = 3 biologically independent samples per bar). Black arrowheads, miRNAs; red arrowheads, tsRNAs; blue arrowheads, rsRNAs. The data represent means ± s.e.m. Statistical significance was determined by two-sided Student’s t-test (*P < 0.05; **P < 0.01). Statistical source data, precise P values and unprocessed blots are provided in the source data.
The results that many miRNAs and tsRNAs are downregulated during iPSC reprogramming are consistent with previous reports that decreased levels of miRNAs33 and tsRNAs34 are associated with mESC pluripotency (some tsRNAs showing upregulation by PANDORA-seq are actually expressed at low levels below the detection limit by northern blots). The changes of rsRNAs during reprogramming are more dynamic, depending on the loci from which they are derived (Fig. 5h-j,q,r).
tsRNAs and rsRNAs impact mESC differentiation.
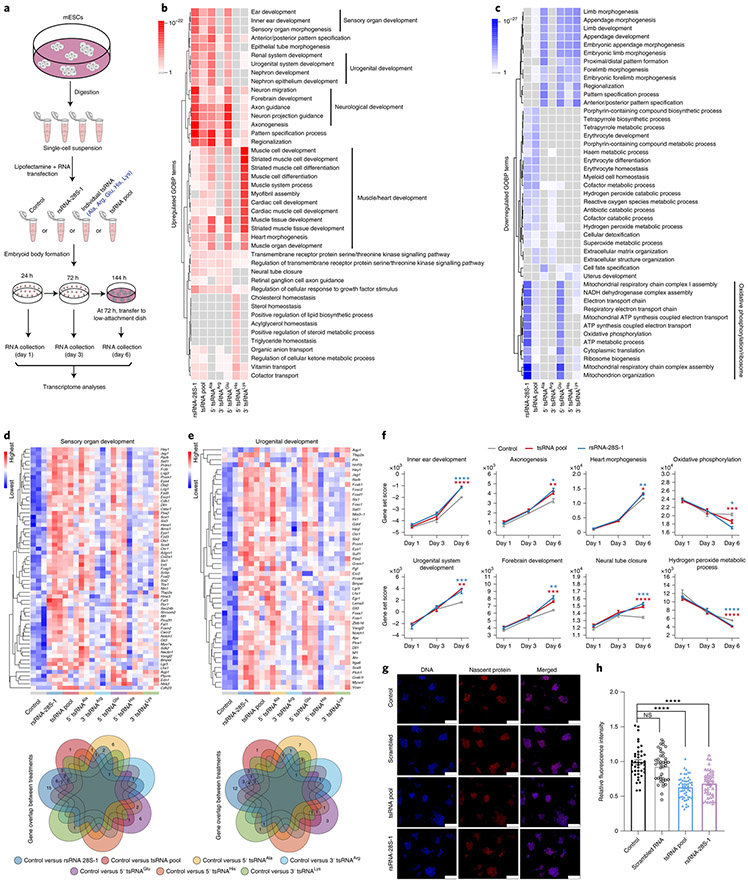
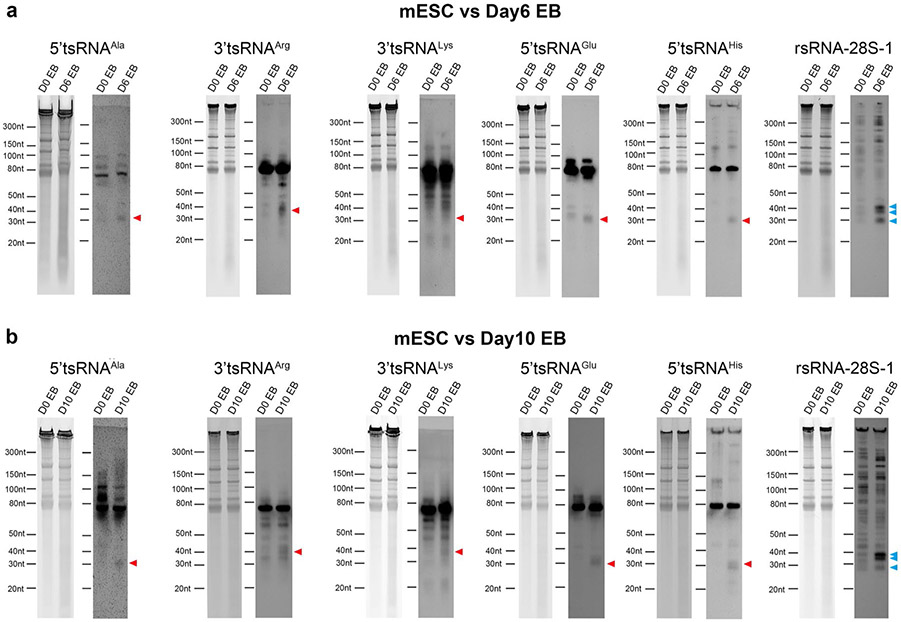
The tsRNAs (Ala, Arg, Glu, His and Lys) and rsRNA-28S-1 showing downregulation during iPSC reprogramming by PANDORA-seq were further examined by northern blots during mESC differentiation in an embryoid body formation assay. The northern blot results showed a trend of upregulation for all of these tsRNA and rsRNA candidates during embryoid body differentiation on days 6 and 10 (Extended Data Fig. 9), suggesting that these tsRNAs and rsRNAs may play a functional role in mESC differentiation. To test this hypothesis, we transfected different types of tsRNA and rsRNA (that is, rsRNA-28S-1, individual 5′ tsRNAAla, 3′ tsRNAArg, 5′ tsRNAGlu, 5′ tsRNAHis, 3′ tsRNALys and a pool of the five abovementioned tsRNAs) into mESCs followed by embryoid body formation. We then performed transcriptomic RNA-seq/bioinformatics analyses of embryoid bodies at days 1, 3 and 6 after transfection (Fig. 6a), during which we did not detect significant morphological changes during embryoid body formation after any of the tsRNA or rsRNA transfections.
Fig. 6 ∣. Transfection of tsRNA or rsRNA impacts mESC lineage differentiation and cell translation.
a, Schematic of the procedure of tsRNA/rsRNA transfection (that is, rsRNA-28S-1, 5′ tsRNAAla, 3′ tsRNAArg, 5′ tsRNAGlu, 5′ tsRNAHis, 3′ tsRNALys and a pool of the five aforementioned tsRNAs (tsRNA pool)), followed by embryoid body formation and transcriptome RNA-seq at days 1, 3 and 6 after transfection. b,c, Top-ranked upregulated (b) and downregulated GOBP terms (c) in day 6 embryoid bodies after each tsRNA/rsRNA transfection compared with the control. d,e, Expression heatmaps of the differentially expressed genes from the representative GOBP terms sensory organ development (d) and urogenital development (e). Similar analyses for other pathways are shown in Extended Data Fig. 10a-d. The Venn diagram beneath each heatmap shows the numbers of overlapped dysregulated genes under different tsRNA/rsRNA transfections. f, Gene set score analyses of the representative GOBP terms during days 1, 3 and 6 of embryoid body differentiation under control, rsRNA-28S-1 or pooled tsRNA transfection (n = 3 biologically independent samples at each time point). Statistical significance was determined by two-sided one-way ANOVA (*P < 0.05; **P < 0.01; ***P < 0.001; ****P < 0.0001). Data represent means ± s.e.m. g,h, Global translational assay results. Representative pictures of nascent protein syntheses (g) and protein synthesis rates 24 h after transfection of the control (vehicle only; n = 40), scrambled RNA (n = 41), rsRNA-28S-1 (n = 44) and pooled tsRNA (n = 54) (h) are shown. Scale bars in g, 100 μm. The ESC clones were from three independent biological experiments. Statistical significance was determined by two-sided one-way ANOVA (****P < 0.0001). NS, not significant. Data represent means ± s.e.m. Statistical source data and precise P values are provided in the source data.
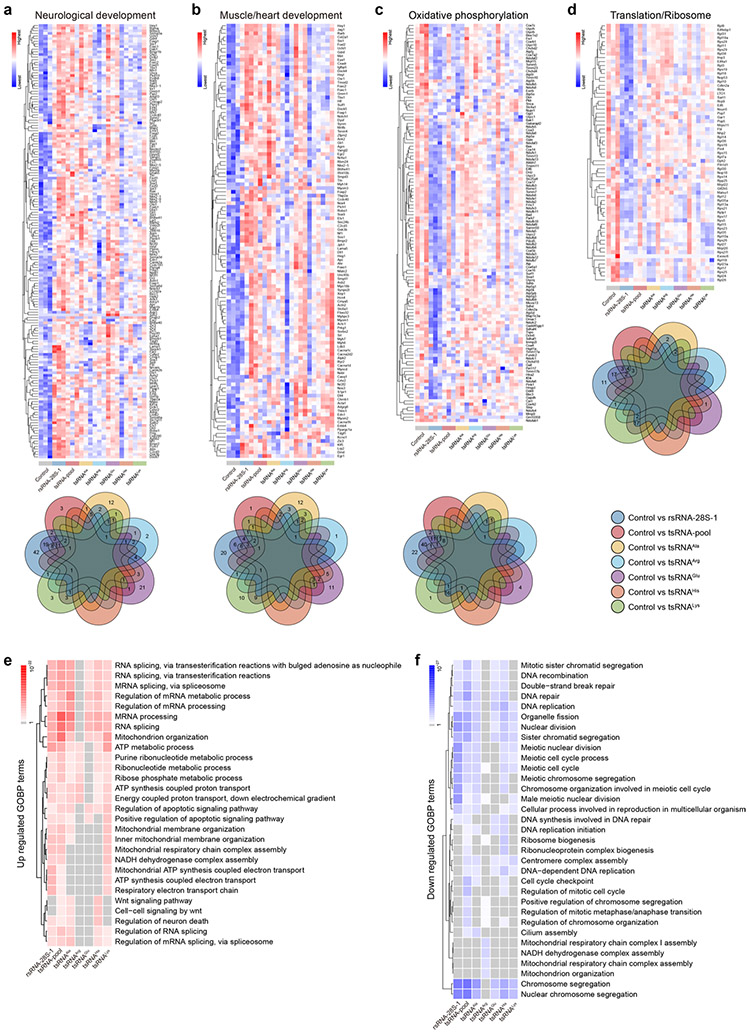
Gene Ontology analyses on the altered messenger RNAs (mRNAs) (Supplementary Table 4) suggested that transfection of rsRNA-28S-1 or the tsRNA pool significantly promoted lineage differentiation in day 6 embryoid bodies, including the promotion of endoderm (for example, inner ear development), mesoderm (for example, urogenital and muscle/heart development) and ectoderm (for example, neurological development) (Fig. 6b). While we observed different effects of individual tsRNA transfections, transfection of the tsRNA pool showed an overall combinatory effect (Fig. 6b). It is interesting that transfection of rsRNA-28S-1 or the tsRNA pool had a similar overall effect in promoting lineage differentiation (Fig. 6b) despite their distinct sequences. This could be due to the fact that transfections of both rsRNA-28S-1 and the tsRNA pool have a strong effect in downregulating the mitochondria oxidative phosphorylation and translation/ ribosome pathways (Fig. 6c), as the alteration of oxidative phosphorylation can act as an overarching factor to change cell metabolism and affect cell lineage progression35. Moreover, the promotion of embryonic forebrain development has been shown to be associated with downregulation of ribosome/translation pathways36, consistent with our observation. Individual genes involved in the highlighted pathways in Fig. 6b,c are further shown in heatmaps and the overlapping changes between each transfection (Fig. 6d,e and Extended Data Fig. 10a-d), further supporting the discoveries at the pathway level and providing a gene resource for future in-depth investigations.
Next, we generated a day 1 to day 3 to day 6 developmental view of the overall trend of the selected key pathway shown in Fig. 6b,c, in which we applied an algorithm to compute gene set scores using the rank-weighted gene expression of individual samples37, with a higher level representing an overall upregulation of a specific Gene Ontology biological process (GOBP) term (Fig. 6f and Supplementary Table 5). The results recapitulate the conclusion that the main lineage effects appear at day 6 while the effects are minimal at day 1 (Fig. 6f). Indeed, the transcriptomic changes on day 1 (from any of the tsRNA or rsRNA transfection groups) were mostly sporadic and the altered genes did not group into clusters in Gene Ontology analyses under the same criteria we used for the differentially expressed genes on days 3 and 6 (Fig. 6b,c and Extended Data Fig. 10e,f). This suggests that tsRNA and rsRNA transfection does not directly disrupt mRNA, but may regulate translational processes15. The embyoid body differentiation effect observed on day 6 would represent the outcome of a cascade reaction during early translational programming38 that results in stem cell differentiation39. Using a translational assay measuring the nascent protein synthesis, we indeed found that transfection of rsRNA-28S-1 or the tsRNA pool in mESCs reduced the translation rate (Fig. 6g,h). Although the exogenous transfection of tsRNAs and rsRNAs may not precisely represent the relative tsRNA and rsRNA quantity and modification status in vivo, these proof-of-principle functional data may open future opportunities to investigate how such translational programming may affect cell differentiation.
Discussion
In addition to well-characterized miRNAs and piRNAs1,40, the study of other classes of sncRNAs, such as tsRNAs and rsRNAs, is gaining momentum10,16,20,41,42. The generation of tsRNAs and rsRNAs by cleaving tRNA and rRNA may represent one of the most ancient small RNA biogenesis pathways, as it exists in all life domains, including archaea, bacteria and eukaryotes16,20. tsRNAs and rsRNAs can exist under physiological conditions and can respond sensitively to various environmental stressors17,18,43-51 that are actively involved in translational regulation52-55, retrotransposon control56,57, epigenetic inheritance17,22,58-60 and even cross-kingdom regulation between prokaryotes and eukaryotes61. In particular, RNA modifications in tsRNAs and rsRNAs create additional layers of information regarding secondary structure and binding potential, directing an exciting area of exploration62,63. In contrast, the complicated RNA modification landscapes have caused problems in sncRNA high-throughput analyses, as they interfere with RNA-seq library preparation and prevent the detection of tsRNAs and rsRNAs bearing certain modifications.
PANDORA-seq was developed to tackle these problems by improving both adapter ligation and reverse transcription during RNA-seq library construction, and it shows major advantages. (1) Our single and combinational use of T4PNK and AlkB treatments not only enabled the theoretical and practical identification of previously undetected modified sncRNAs, but also delineated the sncRNAs that respond to different treatments, from which their RNA modification conditions can be partially deduced. (2) Importantly, the northern blot-validated PANDORA-seq results in different tissue and cell types (Fig. 2) and during reprogramming (Fig. 5) allowed for discovery of an unprecedented landscape – that miRNAs are in fact not the majority sncRNA population in many tissue and cell types. (3) The pre-size-selection procedure corrected the false positive detection of tsRNAs and rsRNAs that can be induced by AlkB treatment on total RNAs (Fig. 1f-i), which has previously been overlooked3. (4) Our updated sncRNA analysis pipeline based on SPORTS1.1 (ref. 20) (see Methods) provided direct mapping visualization of tsRNAs and rsRNAs in regard to their sources (tRNAs and rRNAs) and can easily be used for comparison between different protocols and samples, which may provide the benchmark for future sncRNA analyses. (5) Results from PANDORA-seq also provided a knowledge basis for updating the information in miRBase, including re-evaluation of miRNA identity according to sequence origin (for example, sequences that can alternatively be matched to rsRNAs) and modification features judged by their sensitivity to PANDORA-seq (Fig. 3n,o).
Data obtained from PANDORA-seq also provide additional interpretations of previous studies. For example, we and others have demonstrated that injection of 30- to 40-nucleotide fractions of sperm RNAs from high-fat-diet-treated mice can induce metabolic phenotypes in the offspring17,22,58, which could be due to the effect of tsRNAs, because tsRNAs were the dominant sncRNAs previously detected in 30- to 40-nucleotide fractions by traditional RNA-seq. However, PANDORA-seq revealed that the rsRNAs are, in fact, more abundant in 30- to 40-nucleotide RNA fractions from mature sperm (note that the levels of 30- to 40-nucleotide rsRNAs in mature sperm heads are similar to those of tsRNAs) (Fig. 2c); therefore, the phenotypic outcome of injecting 30- to 40-nucleotide RNA fractions could be a combinatorial effect from both tsRNAs and rsRNAs and may relate to their function in cell fate regulation in the early embryo, as exemplified in mESCs (Figs. 5 and 6).
PANDORA-seq has limitations and leaves room for future improvement. For example, there are other potential terminal modifications in tsRNAs, or remaining amino acids attached to a tsRNA end that may interfere with adapter ligation2,64, or other tRNA modifications (for example, ms2i6A) that interfere with reverse transcription65, which could be further addressed through additional enzymatic treatment. PANDORA-seq may also be improved to enable an all-liquid-based protocol66 to avoid repeated RNA extraction after enzymatic treatments. Meanwhile, maintaining RNA integrity during every process is essential, as degradation of tRNAs and rRNAs may lead to artificial generation of tsRNAs and rsRNAs.
Nonetheless, PANDORA-seq opens the Pandora’s box of sncRNAs, especially the hidden world of tsRNAs and rsRNAs, which was previously underexplored. The biogenesis and functions of tsRNAs and rsRNAs, as well as the regulatory roles of various RNA modifications, warrant future extensive investigations in different systems.
Methods
Animals.
Animal experiments were conducted under the protocol and approval of the institutional animal care and use committees of the University of California, Riverside, the University of Nevada, Reno and the Institute of Zoology, Chinese Academy of Sciences, China. Mice were given access to food and water ad libitum and were maintained on a 12 h light/12 h dark artificial lighting cycle. Mice were housed in cages at a temperature of 22–25 °C, with 40–60% humidity.
Tissue preparation.
Male C57BL/6J mice aged 9–10 weeks were sacrificed individually and brains, livers and spleens were harvested and frozen in liquid nitrogen. Frozen tissues were pulverized in liquid nitrogen for RNA isolation or were stored at −80 °C.
Sperm isolation.
Mature sperm were released from the cauda epididymis of 9-week-old C57BL/6J male mice into 5 ml phosphate-buffered saline (PBS) and incubated at 37 °C for 15 min, after which the sperm were filtered using a 40-μm cell strainer to remove the tissue debris. The sperm were then incubated with somatic cell lysis buffer (0.1% sodium dodecyl sulfate (SDS) and 0.5% Triton X in nuclease-free H2O) for 40 min on ice to eliminate somatic cell contamination. Sperm were then pelleted by centrifugation at 600g for 5 min. Then, the sperm pellet was resuspended and washed in 10 ml PBS and centrifuged twice at 600g for 5 min. The precipitation was performed for the RNA isolation procedure.
Sperm head isolation.
Sperm head isolation was based on our previous publication26. Mature sperm were released from the cauda epididymis of male mice into 5 ml PBS and incubated at 37 °C for 15 min, after which the sperm were then filtered using a 40-μm cell strainer to remove tissue debris. After centrifugation at 3,000g for 5 min, the sperm were then incubated with lysis buffer (10 mM Tris-HCl (pH 8.0), 10 mM EDTA, 50 mM NaCl, 2% SDS and 7.5% proteinase K) for 15 min at room temperature, followed by centrifugation at 3,000g for 5 min. The pellet (mostly sperm heads) was collected, resuspended, washed in 10 ml PBS and centrifuged at 600g for 5 min, repeated twice. The precipitation was examined under microscopy for sperm head purity (>99%) before being processed for RNA extraction.
Mouse ESCs.
E14 mouse ESCs were kindly provided by A. Smith (Stem Cell Institute, Cambridge, United Kingdom). Cells were cultured on gelatin-coated plates in N2B27 supplemented with 2iLIF (1 μM MEK inhibitor PD0325901 (Stem Cell Institute), 3 μM GSK3 inhibitor CHIR99021 (Stem Cell Institute) and 10 ng ml−1 leukaemia inhibitory factor (LIF; Stem Cell Institute)) at 37 °C under 21% O2 and 5% CO2. The N2B27 medium comprised a 1:1 mix of DMEM/F-12 (21331-020; Thermo Fisher Scientific) and Neurobasal A (10888-022; Thermo Fisher Scientific) supplemented with 1% vol/vol B-27 (10889-038; Thermo Fisher Scientific), 0.5% vol/vol N-2 (homemade), 100 μM β-mercaptoethanol (31350-010; Thermo Fisher Scientific), penicillin-streptomycin (15140122; Thermo Fisher Scientific) and GlutaMAX (35050061; Thermo Fisher Scientific). The N-2 supplement contained DMEM/F-12 medium (21331-020; Thermo Fisher Scientific), 2.5 mg ml−1 insulin (I9287; Sigma–Aldrich), 10 mg ml−1 apo-transferrin (T1147; Sigma–Aldrich), 0.75% Bovine Albumin Fraction V (15260037; Thermo Fisher Scientific), 20 μg ml−1 progesterone (p8783; Sigma–Aldrich), 1.6 mg ml−1 putrescine dihydrochloride (P5780; Sigma–Aldrich) and 6 μg ml−1 sodium selenite (S5261; Sigma–Aldrich).
Human ESCs.
The UK Stem Cell Bank Steering Committee approved all of the hESC experiments. All of the experiments complied with the UK Code of Practice for the Use of Human Stem Cell Lines. The hESC line used was H9, which was kindly provided by L. Vallier (Stem Cell Institute), within an agreement with WiCell. Unless otherwise stated, hESCs were maintained in a humidified incubator set at 37 °C under 21% O2 and 5% CO2.
Cells were passaged using Accutase, which was added for 3 min at 37 °C before being diluted in DMEM/F-12 and centrifuged. Cells were then plated in their appropriate medium supplemented with 10 μM ROCK inhibitor Y-27632 (72304; STEMCELL Technologies). The ROCK inhibitor was removed after 24 h.
Primed hESCs.
Conventional primed hESCs were either cultured on growth factor-reduced Matrigel (Corning)-coated dishes or on irradiated CF-1 MEFs (ASF-1201; AMS Biotechnology). For the Matrigel coating, a 16% Matrigel solution in DMEM/F-12 was incubated for 2 h at room temperature. When cultured on Matrigel, primed hESCs were cultured in mTeSR1 (85850; STEMCELL Technologies), with the medium changed every 24 h. When cultured on MEFs, primed hESCs were cultured in primed medium consisting of DMEM/F-12 (21331-020; Thermo Fisher Scientific) supplemented with 100 μM β-mercaptoethanol (31350-010; Thermo Fisher Scientific), penicillin-streptomycin (15140122; Thermo Fisher Scientific), GlutaMAX (35050061; Thermo Fisher Scientific), MEM Non-Essential Amino Acids (11140035; Thermo Fisher Scientific) and 20% vol/vol KnockOut Serum Replacement (10828010; Thermo Fisher Scientific). This was supplemented with 12 ng ml−1 bFGF2 (Stem Cell Institute) before use.
Naive hESCs.
To convert hESCs into a naive state, the protocol published by A. Smith’s laboratory was used24. At 24 h before beginning the resetting protocol, hESCs were plated on MEFs in primed medium. Once reset, cells were maintained in N2B27 supplemented with T2iLGö (1 μM CHIR (Stem Cell Institute), 1 μM PD03 (Stem Cell Institute), 10 ng ml−1 recombinant human LIF (Stem Cell Institute) and 2 μM Gö (2285; Tocris) under hypoxic conditions (5% O2, 5% CO2 and 37 °C).
Induction of iPSCs.
To derive iPSCs, we used a well-established reprogrammable mouse system that allows reproducible kinetics during this process25,67. MEFs were derived from transgenic embryos harbouring two copies of a doxycycline-inducible polycistronic transcription factor cassette (Col1a1::tetOP-OKSM) and a constitutive M2rtTA driver with or without the Oct4-EGFP reporter. Cells were first expanded in DMEM media supplemented with 10% foetal bovine serum (FBS), 100 U ml−1 penicillin, 100 μg ml−1 streptomycin, sodium pyruvate (1 mM), l-glutamine (4 mM), 0.1 mM β-mercaptoethanol and 50 μg ml−1 sodium ascorbate at 37 °C under normal oxygen levels (21% O2). MEFs were then trypsinized and plated under reprogramming culture conditions by adding 1,000 U ml−1 LIF, 50 μg ml−1 sodium ascorbate and 2 μg ml−1 doxycycline to ESC media (knockout DMEM supplemented with 15% FBS, 100 U ml−1 penicillin, 100 μg ml−1 streptomycin, 1 mM sodium pyruvate, 4 mM l-glutamine and 0.1 mM β-mercaptoethanol). Specifically, cells were plated at a density of 2 million, 300,000 and 60,000 cells per 10-cm plate to collect day 0 uninduced MEFs, day 3 reprogramming intermediates and established iPSC cultures, respectively. Doxycycline was replenished every 48 h to sustain expression of the OKSM transcription factors. To establish iPSCs, doxycycline and ascorbic acid were withdrawn at day 5 of reprogramming and cells were cultured for another 5 d to ensure formation of Col1a1::tetOP-OKSM transgene-independent iPSC colonies. iPSC lines were derived from three independent MEF lines. To reduce epigenetic memory, transgene-independent iPSCs were passaged for an additional five passages and pre-plated for 30 min at 37 °C. Isolated iPSCs were then analysed for Oct4-GFP expression using flow cytometry and microscopy. Cell pellets for each time point (day 0, day 3 and established iPSCs) were collected and resuspended in TRIzol at a concentration of 10 million cells per ml for subsequent RNA isolation.
Embryoid body assay from ESCs.
Mouse ESCs containing an Oct4-GFP reporter were incubated at 37 °C under 5% CO2, passaged every 2 d in gelatin-coated culture dishes and maintained in stem cell media consisting of KO-DMEM (Gibco; 10829) supplemented with 15% FBS (Gibco; 10437; Lot-2190737RP), 2 mM GlutaMAX (Gibco; 35050), 100 U ml−1 penicillin (Gibco; 15140), 100 μg ml−1 streptomycin (Gibco; 15140), non-essential amino acids (100 μM each; Gibco; 11140), 55 μM β-mercaptoethanol (Gibco; 21985) and 1,000 U ml−1 LIF.
Embryoid bodies were formed as previously described68. ESCs were trypsinized using 0.25% trypsin-EDTA (Gibco; 25200), rinsed twice with Dulbecco’s PBS (Gibco; 14190) and resuspended in stem cell media without LIF at 32,000 cells per ml. The cell suspension was then aliquoted into 25-μl drops (800 cells per drop) onto petri dish lids. The lids were then replaced onto a petri dish containing 10 ml Dulbecco’s PBS to form hanging drops and incubated for 72 h. Hanging drops were then transferred to suspension culture in ultra-low-attachment 60-mm plates (Corning; 3261) with 6 ml stem cell media, excluding LIF, for up to 3 d. Embryoid bodies were collected from hanging drops at 24 and 72 h and from suspension cultures at day 6 (see below).
tsRNA and rsRNA transfections.
ESCs were transfected at the onset of embryoid body formation as hanging drops. The transfection protocol was adapted for hanging drop embryoid bodies from the reverse transfection protocol, as described previously69. Briefly, transfection mixtures containing 1.2 μM respective RNA (see below) and 30 μl ml−1 Lipofectamine Stem Reagent were incubated for 15 min at room temperature in unmodified DMEM (Gibco; 10313). After incubation, ESCs in single-cell suspension with stem cell media (excluding LIF and antibiotics) were added to each transfection mixture to make final concentrations of 32,000 cells per ml, 200 nM total RNA and 5 μl ml−1 Lipofectamine Stem Reagent. The ESC transfection mixture was then used for the embryoid body differentiation assay. Day 1 and day 3 collections were taken after 24 and 72 h incubation of hanging drops, and day 6 collections were taken after an additional 72 h incubation in suspension culture by low-attachment culture dish (Corning; 3261).
For each transfection, three independent replicates were performed. Vehicle-only transfection was used as a control. The transfection group included one of the following RNA suspensions: rsRNA-28S-1, 5′ tsRNAAla, 3′ tsRNAArg, 5′ tsRNAGlu, 5′ tsRNAHis, 3′ tsRNALys or a tsRNA pool containing the abovementioned five tsRNAs, making a total of 24 samples per time point collection (days 1, 3 and 6).
rsRNA-28S-1 represents a mixture of three sequences of different lengths (27, 30 and 37 nucleotides) mixed together equally. Each transfected sncRNA contained two forms, which attached either a hydroxy group or a phosphate group in the 3′ terminal of the synthesized sequence. The total RNA concentration for each transfection group was 200 nM. The transfected tsRNA/rsRNA sequences were as follows: 5′ tsRNAAla (5′P-rGrGrGrGrGrUrGrUrArGrCrUrCrArGrUrGrGrUrArGrArGrCrGrCrGrUrGrC-3′OH and 5′P-rGrGrGrGrGrUrGrUrArGrCrUrCrArGrUrGrGrUrArGrArGrCrGrCrGrUrGrC-3′P); 5′ tsRNAHis (5′P-rGrCrCrGrUrGrArUrCrGrUrArUrArGrUrGrGrUrUrArGrUrArCrUrCrUrGrCrG-3′OH and 5′P-rGrCrCrGrUrGrArUrCrGrUrArUrArGrUrGrGrUrUrArGrUrArCrUrCrUrGrCrG-3′P); 5′ tsRNAGlu (5′P-rUrCrCrCrUrGrGrUrGrGrUrCrUrArGrUrGrGrUrUrArGrGrArUrUrCrGrGrCrGrCrUrC-3′OH and 5′P-rUrCrCrCrUrGrGrUrGrGrUrCrUrArGrUrGrGrUrUrArGrGrArUrUrCrGrGrCrGrCrUrC-3′P); 3′ tsRNAArg (5′P-rUrCrGrArCrUrCrCrUrGrGrCrUrGrGrCrUrCrGrCrCrA-3′OH and 5′P-rUrCrGrArCrUrCrCrUrGrGrCrUrGrGrCrUrCrGrCrCrA-3′P); 3′ tsRNALys (5′P-rArGrGrGrUrUrCrArArGrUrCrCrCrUrGrUrUrCrGrGrGrCrGrCrCrA-3′OH and 5′P-rArGrGrGrUrUrCrArArGrUrCrCrCrUrGrUrUrCrGrGrGrCrGrCrCrA-3′P); and rsRNA-28S-1 (5′P-rArGrArCrGrUrGrGrCrGrArCrCrCrGrCrUrGrArArUrUrUrArArGrC-3′OH (27 nucleotides), 5′P-rArGrArCrGrUrGrGrCrGrArCrCrCrGrCrUrGrArArUrUrUrArArGrC-3′P (27 nucleotides), 5′P-rCrGrCrGrArCrCrUrCrArGrArUrCrArGrArCrGrUrGrGrCrGrArCrCrCrGrCrUrGrArArU-3′OH (35 nucleotides), 5′P-rCrGrCrGrArCrCrUrCrArGrArUrCrArGrArCrGrUrGrGrCrGrArCrCrCrGrCrUrGrArArU-3′P (35 nucleotides), 5′P-rCrGrCrGrArCrCrUrCrArGrArUrCrArGrArCrGrUrGrGrCrGrArCrCrCrGrCrUrGrArArUrUrU-3′OH (37 nucleotides) and 5′P-rCrGrCrGrArCrCrUrCrArGrArUrCrArGrArCrGrUrGrGrCrGrArCrCrCrGrCrUrGrArArUrUrU-3′P (37 nucleotides)).
mESC transfection and global protein synthesis assay.
Before transfection, we seeded 3,000 ESCs per well in 96-well plates coated with 0.1% gelatin and incubated them overnight (~16 h) with mESC medium. The transfection complex was prepared as follows: 0.4 μl respective RNA (100 μM) with 4 μl Lipofectamine Stem Reagent and 20 μl Opti-MEM was mixed by vortexing and incubated at room temperature for 15 min. The media was discarded and 180 μl new mESC media (excluding antibiotics) was added to the wells. The lipofectamine–RNA transfection complex was added to the wells and incubated for 24 h at 37 °C under 5% CO2. For each transfection, three independent replicates were used. Vehicle-only transfection was used as a control. The transfection group included one of the following RNA suspensions: scrambled small RNAs, the tsRNA pool or rsRNA-28S-1.
The global protein synthesis assay was performed with the Protein Synthesis Assay Kit (ab235634; Abcam), per the manufacturer’s instructions. Briefly, the media was replaced with fresh complete mESC media containing 1 × Protein Label. Incubation was performed for 2 h at 37 °C under 5% CO2. Then, the culture media was removed and the cells were rinsed with PBS. Fixative solution (100 μl) was added to each well and the cells were incubated for 15 min at room temperature, protected from light. The cells were washed with wash buffer and incubated with 100 μl permeabilization buffer for 10 min at room temperature. The cells were then incubated with 1× reaction cocktail for 30 min, protected from light at room temperature, then washed again. A 1× dilution of DAPI DNA stain was prepared and 100 μl was added per well. The cells were incubated for 20 min at room temperature. The DAPI staining solution was aspirated and replaced with PBS. Then, the samples were analysed by fluorescence microscopy (Lecia DM8 system) with excitation and emission at 440/490 and 540/580 nm, respectively. The intensity of the red signal represented the relative quantity of nascent peptide. The intensity of the sample image was processed and extracted using Fuji (ImageJ) software.
Cell lines.
HeLa cells were purchased from the American Type Culture Collection (ATCC; catalogue number CCL-2). HeLa cells were cultured in DMEM medium with 10% FBS and incubated at 37 °C under 5% CO2. Total RNA was harvested when the confluency reached ~95% in a 100-mm culture dish.
RNA isolation.
TRIzol reagent (1 ml; Invitrogen; 15596018) was added to a microtube with pulverized tissues or collected cells and vortexed uniformly. Then, the sample was incubated at room temperature for 5 min. Chloroform (200 μl; Alfa Aesar; J67241) was added per ml of sample, vortexed for 15 s, then incubated at room temperature for 2 min and centrifuged for 15 min at 12,000g (4 °C). The aqueous phase was pooled in a microtube and combined with an equal volume of isopropanol (Fisher Scientific; BP2618-212). After gently mixing and incubating at room temperature for 10 min, the tube was centrifuged for 10 min at 12,000g (4 °C). After removing the supernatant, the precipitation was washed with 1 ml 75% ethanol (Koptec; V1001), then centrifuged for 5 min at 7,500g (4 °C). Then, the supernatant was removed and air-dried for 5 min and the precipitation was resuspended in nuclease-free water, quantified and stored at −80 °C or used for further processing.
Isolation of specified-size RNA from total RNAs.
The RNA sample, mixed with an equal volume of 2× RNA loading dye (New England Biolabs; B0363S), was incubated at 75 °C for 5 min. The mixture was loaded into 15% (wt/vol) urea polyacrylamide gel (10 ml mixture containing 7 M urea (Invitrogen; AM9902), 3.75 ml Acrylamide/Bis 19:1, 40% (Ambion; AM9022), 1 ml 10× TBE (Invitrogen; AM9863), 1 g l−1 ammonium persulfate (Sigma–Aldrich; A3678-25G) and 1 ml l−1 TEMED (Thermo Fisher Scientific; BP150-100)). The gel was run in a 1× TBE running buffer at 200 V until the bromophenol blue reached the bottom of the gel. After staining with SYBR Gold solution (Invitrogen; S11494), gel that contained small RNAs of 15–50 nucleotides was excised based on small RNA ladders (New England Biolabs (N0364S) and Takara (3416)) and eluted in 0.3 M sodium acetate (Invitrogen; AM9740) and 100 U ml−1 RNase inhibitor (New England Biolabs; M0314L) overnight at 4 °C. The sample was then centrifuged for 10 min at 12,000g (4 °C). The aqueous phase was mixed with pure ethanol, 3 M sodium acetate and linear acrylamide (Invitrogen; AM9520) at a ratio of 3:9:0.3:0.01. Then, the sample was incubated at −20 °C for 2 h and centrifuged for 25 min at 12,000g (4 °C). After removing the supernatant, the precipitation was resuspended in nuclease-free water, quantified and stored at −80 °C or used for further processing.
Expression and purification of Escherichia coli AlkB.
The E. coli AlkB gene was cloned into the NdeI/BamHI site of the pET28a(+) plasmid. The constructed plasmid was transformed in the E. coli BL21(DE3) strain to express the AlkB protein with a tag of six histidines at the amino terminal. The E. coli was cultured in lysogeny broth medium containing 50 μg ml−1 kanamycin. The medium, with 1 mM isopropyl β-d-1-thiogalactopyranoside added, was incubated at 37 °C for 3 h. The AlkB protein was purified using an Ni-NTA Superflow column and stored in a buffer containing 20 mM Tris-HCl (pH 8.0), 50% glycerol, 0.2 M NaCl and 2 mM dithiothreitol at −80 °C. The purity of the AlkB protein was detected by 12% SDS-polyacrylamide gel electrophoresis (PAGE). The enzyme activity was confirmed by treating RNA with AlkB, followed by LC-MS/MS analysis to quantify the modified nucleosides.
The AlkB gene sequence used in this study was: 5′-CTGGACCTGTTCGCGGATGCGGAGCCGTGGCAGGAACCGCTGGCGGCGGGTGCGGTTATCCTGCGTCGTTTCGCGTTTAACGCGGCGGAGCAACTGATCCGTGACATTAACGATGTGGCGAGCCAGAGCCCGTTTCGTCAAATGGTTACCCCGGGTGGCTACACCATGAGCGTGGCGATGACCAACTGCGGTCACCTGGGTTGGACCACCCACCGTCAGGGTTACCTGTATAGCCCGATCGACCCGCAAACCAACAAGCCGTGGCCGGCGATGCCGCAGAGCTTCCACAACCTGTGCCAACGTGCGGCGACCGCGGCGGGTTACCCGGACTTTCAGCCGGATGCGTGCCTGATTAACCGTTATGCGCCGGGTGCGAAGCTGAGCCTGCACCAAGACAAAGATGAGCCGGATCTGCGTGCGCCGATCGTTAGCGTGAGCCTGGGTCTGCCGGCGATTTTCCAGTTTGGTGGCCTGAAGCGTAACGACCCGCTGAAACGTCTGCTGCTGGAGCACGGCGATGTGGTTGTGTGGGGTGGCGAAAGCCGTCTGTTCTACCACGGTATCCAGCCGCTGAAAGCGGGCTTTCACCCGCTGACCATTGACTGCCGTTATAACCTGACCTTCCGTCAAGCGGGTAAGAAAGAA-3′
Quantification of modified nucleosides in RNA molecules by LC-MS/MS.
A total of 1 μg 15- to 50-nucleotide RNA from mouse liver was incubated with 0.2 U nuclease P1 (Sigma–Aldrich) and 60 μl 50 mM NH4OAc (pH 5.3) in a microtube at 50 °C for 3 h. Then, a sample with 0.04 U phosphodiesterase I (USB) added was incubated at 37 °C for 2 h. After adding 2 U alkaline phosphatase (Sigma–Aldrich), the sample was incubated at 37 °C for 2 h. The mixture was moved into Nanosep centrifugal devices with 3K Omega membrane (PALL; OD003C35) and centrifuged for 20 min at 5,000g (4 °C). The liquid phase was lyophilized and stored at −80 °C. Then, the sample was dissolved in 70 μl 2 mM ammonium acetate with 175 ng ml−1 guanosine (13C, 15N). Afterwards, 65 μl of the solution was injected into the LC-MS/MS system. The solution was separated using an Agilent 1200 HPLC system and then detected using an API 4000 QTRAP mass spectrometer (Applied Biosystems) using positive electrospray ionization. The following mass transitions were monitored: m/z 244.1 to 112.1 for cytidine (C); m/z 268.1 to 136.2 for adenosine (A); m/z 284.1 to 152.2 for guanosine (G); m/z 245.0 to 113.1 for uridine (U); m/z 282.1 to 150.2 for 1-methyladenosine (m1A); m/z 298.1 to 166.1 for 1-methylguanosine (m1G); m/z 258.0 to 126.0 for 3-methylcytidine (m3C); m/z 312.1 to 180.2 for N2,N2-dimethylguanosine (m22G); m/z 258.1 to 112.1 for 2′-O-methylcytidine (Cm); m/z 282.1 to 136.2 for 2′-O-methyladenosine (Am); m/z 259.1 to 113.1 for 2′-O-methyluridine (Um); m/z 298.1 to 152.1 for 2′-O-methylguanosine (Gm); m/z 258.1 to 126.1 for 5-methylcytidine (m5C); m/z 298.1 to 166.1 for N2-methylguanosine (m2G); m/z 245.2 to 125.1 for pseudouridine (Ψ); and m/z 286.1 to 154.1 for N4-acetylcytidine (ac4C). The nucleoside concentration was quantified according to the standard curve running for the same batch of samples. The ratios of m1A/A, Am/A, m1G/G, m2 2G/G, Gm/G, m2G/G, m3C/C, Cm/C, m5C/C, ac4C/C, Um/U and Ψ to U were subsequently calculated.
Treatment of RNA with AlkB.
The RNA was incubated in 50 μl reaction mixture containing 50 mM HEPES (pH 8.0) (Gibco (15630080) and Alfa Aesar (J63578)), 75 μM ferrous ammonium sulfate (pH 5.0), 1 mM α-ketoglutaric acid (Sigma–Aldrich; K1128-25G), 2 mM sodium ascorbate, 50 mg l−1 bovine serum albumin (Sigma–Aldrich; A7906-500G), 4 μg ml−1 AlkB, 2,000 U ml−1 RNase inhibitor and 200 ng RNA at 37 °C for 30 min. Then, the mixture was added into 500 μl TRIzol reagent to perform the RNA isolation procedure.
Treatment of RNA with T4PNK.
The RNA was incubated in 50 μl reaction mixture containing 5 μl 10× PNK buffer (New England Biolabs; B0201S), 1 mM ATP (New England Biolabs; P0756S), 10 U T4PNK (New England Biolabs; M0201L) and 200 ng RNA at 37 °C for 20 min. Then, the mixture was added into 500 μl TRIzol reagent to perform the RNA isolation procedure.
RNA adapter ligation capability identification.
The synthetic RNA with a 3′-OH end or a 3′-P end, or 25- to 50-nucleotide RNA from mouse spleen were performed in the experiment. Then, 50 ng RNA, dissolved in 5.5 μl nuclease-free water mixed with 0.5 μl 10 μM 3′ SR adapter (Takara; sequence: 5′-(rApp)-AGATCGGAAGAGCACACGTCT(NH2)-3′) and 2 μl 50% PEG 8000 (New England Biolabs; B1004), was incubated at 70 °C for 2 min. Following this, the sample was immediately incubated on ice for 5 min. Next, 1 μl 10× T4 ligase reaction buffer (New England Biolabs; B0216L) and 1 μl T4 RNA Ligase 2, truncated KQ (New England Biolabs; M0373L) were added to the sample, which was mixed well. After incubation at 25 °C for 1 h and 75 °C for 5 min, the sample was run on 15% (wt/vol) urea polyacrylamide gel, followed by northern blot using the anti-3′ SR adapter probe (Takara; sequence: 5′-(DIG)-AGACGTGTGCTCTTCCGATCT-3′) to detect the ligation outcome of the input RNAs.
Northern blot.
Total RNA was extracted from mouse tissues and cell lines using TRIzol reagents, per the manufacturer’s instructions. RNA was separated by 10% urea-PAGE gel stained with SYBR Gold, and immediately imaged, then transferred to positively charged nylon membranes (Roche; 11417240001) and ultraviolet crosslinked with an energy of 0.12 J. Membranes were pre-hybridized with DIG Easy Hyb solution (Roche; 11603558001) for 1 h at 42 °C. To detect miRNAs, tsRNAs and rsRNAs in the total RNA and 15- to 50-nucleotide small RNAs, membranes were incubated overnight (12–16 h) at 42 °C with DIG-labelled oligonucleotide probes synthesized by Integrated DNA Technologies as follows: rsRNA-28s-1 (5′-DIG-ATTCAGCGGGTCGCCACGTCT); rsRNA-28s-2 (5′-DIG-GGTCCGCACCAGTTCT); rsRNA-28s-3 (5′-DIG-CGCCAGGTTCCACACGAACGT); rsRNA-18s-1 (5′-DIG-AGGCACACGCTGAGCCAGTCAGT); 5′ tsRNAGlu (5′-DIG-AACCACTAGACCACCAGGGA); 5′ tsRNAAla (5′-DIG-GCACGCGCTCTACCACTG); 5′ tsRNAHis (5′-DIG-AGTACTAACCACTATACGATCACGG); 3′ tsRNAArg (5′-DIG-TGGCGAGCCAGCCAGGAGTCGA); 3′ tsRNALys (5′-DIG-TGGCGCCCGAACAGGGACTT); let-7i (5′-DIG-CAGCACAAACTACTACCTCA); let-7f (5′-DIG-AACTATACAATCTACTACCTCA); miR-122 (5′-DIG-AAACACCATTGTCACACTCCA); miR-21 (5′-DIG-TCAACATCAGTCTGATAAGCTA); 3′ adapter probe (5′-DIG-AGACGTGTGCTCTTCCGATCT).
Small RNA northern blot probe efficiency assay.
Synthetic RNA sequences complementary to northern blot probes (that is, rsRNA-28s-1, 5′ tsRNAGlu, let-7i, mir-122 and mir-21) were synthesized by Integrated DNA Technologies as follows: Syn-rsRNA-28s-1 (/5Phos/rArGrArCrGrUrGrGrCrGrArCrCrCrGrCrUrGrArArUrUrU); Syn-5′ tsRNAGlu (/5Phos/rUrCrCrCrUrGrGrUrGrGrUrCrUrArGrUrGrGrUrUrArGrGrArUrUrCrGrGrCrGrCrU); Syn-let-7i (/5Phos/rUrGrArGrGrUrArGrUrArGrUrUrUrGrUrGrCrUrGrUrU); Syn-miR-122 (/5Phos/rUrGrGrArGrUrGrUrGrArCrArArUrGrGrUrGrUrUrU); Syn-miR-21 (/5Phos/rUrArGrCrUrUrArUrCrArGrArCrUrGrArUrGrUrUrGrArC).
Small RNA library construction and deep sequencing.
The RNA segment was separated by PAGE, then a 15- to 45-nucleotide stripe was selected and recycled. The adapters were obtained from the NEBNext Small RNA Library Prep Set for Illumina (New England Biolabs; E7330S) and ligated sequentially. First, we added a 3′ adapter system under the following reaction conditions: 70 °C for 2 min and 25 °C for 1 h or 16 °C for 18 h (for sperm heads). Second, we added a reverse transcription primer under the following reaction conditions: 75 °C for 5 min, 37 °C for 15 min and 15 °C for 15 min. Third, we added a 5′ adapter mix system under the following reaction conditions: 70 °C for 2 min and 25 °C for 1 h. First-strand cDNA synthesis was performed under the following reaction conditions: 70 °C for 2 min and 50 °C for 1 h. PCR amplification with PCR Primer Cocktail and PCR Master Mix was performed to enrich the cDNA fragments under the following conditions: 94 °C for 30 s; 11–22 cycles of 94 °C for 15 s, 62 °C for 30 s and 70 °C for 15 s; 70 °C for 5 min; and hold at 4 °C. Then, the PCR product was purified from PAGE gel. The qualified libraries were amplified on cBot to generate the cluster on the flow cell. The amplified flow cell was sequenced using the SE50 strategy on the Illumina system by BGI. For sperm heads, the qualified libraries were amplified and sequenced using the SE75 strategy on the Illumina system by the University of California, San Diego IGM Genomics Center.
Quality control of small RNA-seq data.
The resulting sequencing reads were processed according to the standard quality control criteria: (1) reads containing N; (2) reads containing more than four bases with a quality score < 10; (3) reads containing more than six bases with a quality score < 13; (4) reads with 5′ primer contaminants or without 3′ primer; (5) reads without the insert tag; (6) reads with ploy A; and (7) reads shorter than 15 nucleotides and longer than 44 nucleotides. The sequencing data analyses were performed on the clean reads after data filtration.
Small RNA annotation and analyses for PANDORA-seq data.
RNAs of 15–50 nucleotides were subject to the PANDORA-seq protocol. Small RNA sequences were annotated using the software SPORTS1.1 (updated from SPORTS1.0)20 with one mismatch tolerance (SPORTS1.1 parameter setting: −M 1). Reads were mapped to the following individual non-coding RNA databases sequentially: (1) the miRNA database miRBase 21 (ref. 70); (2) the genomic tRNA database GtRNAdb71; (3) the mitochondrial tRNA database mitotRNAdb72; (4) the rRNA and YRNA databases assembled from the National Center for Biotechnology Information nucleotide and gene database; (5) the piRNA databases, including piRBase29 and piRNABank30; and (6) the non-coding RNAs defined by Ensembl73 and Rfam 12.3 (ref. 74). The tsRNAs were annotated based on both pre-tRNA and mature tRNA sequences. Mature tRNA sequences were derived from the GtRNAdb and mitotRNAdb sequences using the following procedures: (1) predicted introns were removed; (2) a CCA sequence was added to the 3′ ends of all tRNAs; and (3) a G nucleotide was added to the 5′ end of histidine tRNAs. The tsRNAs were categorized into four types based on the origin of the tRNA loci: 5′ tsRNA (derived from the 5′ end of pre-/mature tRNA); 3′ tsRNA (derived from the 3′ end of pre-tRNA); 3′ tsRNA-CCA end (derived from the 3′ end of mature tRNA); and internal tsRNAs (not derived from 3′ or 5′ loci of tRNA). For the rsRNA annotation, we mapped the small RNAs to the parent rRNAs in an ascending order of rRNA sequence length to ensure a unique annotation of each rsRNA (for example, the rsRNAs mapped to 5.8S rRNA would not be further mapped to the genomic region overlapped by 5.8S and 45S rRNAs).
Differentially expressed sncRNA analysis.
Pairwise comparison of differentially expressed sncRNAs (average reads per million (RPM) > 0.1 in the compared treatments) among different RNA treatments was performed using the R package DEGseq75 with a normalized RPM fold change > 2 and P < 0.05.
Atypical miRNA analysis.
Here, we focused on the miRNAs identified by either traditional RNA-seq or PANDORA-seq (mean RPM > 0.1) that can perfectly match to the miRBase (SPORTS1.1 parameter setting: −M 0). These miRNAs were re-mapped to the other small RNA databases with one mismatch tolerance (SPORTS1.1 parameter setting: −M 1), which potentially yielded an alternative annotation.
Small RNA secondary structure prediction.
The tRNA secondary structure information was obtained from the GtRNAdb, while the YRNA secondary structure was predicted using the RNAfold tool in the ViennaRNA package76 with default settings. The RNA secondary structure visualization was performed using the forna tool in the ViennaRNA package.
rsRNA coverage similarity comparison matrix.
To calculate the overall rsRNA coverage similarity pairwise comparison among samples, a sensitive method was performed. For one specific rRNA with length n, we assumed that the rsRNA coverage level of locus i in sample X is xi and the coverage level in sample Y is yi. The rsRNA mapping similarity level between the two samples can be described as:
The lower r value indicates that samples X and Y are more similar in rsRNA coverage, while the higher r value represents the opposite.
Identification of RNA mapping peaks.
The peak searching algorithm was modified from the findpeaks function in the R pracma package (version 1.9.9; https://www.rdocumentation.org/packages/pracma/versions/1.9.9/topics/findpeaks). Briefly, a new parameter gradient was added to the original algorithm for RNA peak identification. The expression significance of the RNA mapping region between traditional treatment and PANDORA-seq treatment was analysed by two-way analysis of variance (ANOVA).
mRNA library construction, RNA-seq and quality control.
Transcriptome libraries were constructed using the NEBNext Ultra RNA Library Prep Kit for Illumina (New England Biolabs; E7530L) following the manufacturer’s recommendations. For each RNA library, six G base pairs (raw data) were generated on the Illumina system. The resulting sequencing reads were processed using standard quality control criteria: (1) reads containing adapters; (2) reads containing N > 10% (N represents bases that cannot be determined); and (3) reads containing low-quality (Q score ≤ 5) bases that represent over 50% of the total bases. The data sequencing analyses were performed on the clean reads after data filtration. The mRNA library preparation, quality examination and RNA-seq processes were performed by Novogene.
Transcriptome data annotation.
RNA sequences were annotated using kallisto77 with Ensembl mouse cDNA annotation information (GRCm38). The expression level of each gene was normalized to transcripts per kilobase million.
Functional enrichment analysis.
We employed the edgeR78 tool to identify the differentially expressed genes between the control and treated groups during mESC differentiation. The TMM algorithm was used for read count normalization and effective library size estimation79. The genes with a false discovery rate < 0.05 and a fold change > 1.5 were deemed differentially expressed. The enriched biological process terms of differentially expressed genes were obtained using the R package clusterProfiler80, setting a q value threshold of 0.005 for statistical significance. Only the gene sets with ≥2 differentially genes were retained.
GOBP gene set score.
We applied the FAIME algorithm37 to assign a gene set score for each GOBP term. The FAIME algorithm calculated gene set scores based on the rank-weighted gene expression of individual samples, which converts each sample’s transcriptomic data into pathway-/gene set-based information. A higher gene set score indicates an overall increase in the abundance of the genes within the given GOBP term.
Statistics and reproducibility.
The statistical tests and biological repeats for the RNA-seq samples, LC-MS/MS and northern blot validations are described in the figure captions or Methods. All of the correlation analyses were performed using the Spearman’s rank correlation test to generate the correlation coefficient (ρ). Multiple t-tests were performed using GraphPad Prism for the statistical analyses of RNA modification dynamics of 15- to 50-nucleotide RNA fractions from mouse liver after AlkB treatment. Fisher’s least significant difference (LSD) test was performed for statistical analysis of the different origins of the tsRNAs/miRNA expression ratio under different treatments among mouse and human tissues and cells, miRNA expression during the cell reprogramming using PANDORA-seq, and statistical analysis of representative GOBP terms during days 1, 3 and 6 of embryoid body differentiation under control, rsRNA-28S-1 and pooled tsRNA transfection. Two-way ANOVA was performed for statistical analysis of tsRNA/rsRNA mapping peaks between MEFs and iPSCs on the corresponding RNA loci. Student’s t-test was performed for statistical analysis of the expression level of the northern blot probe targeting small RNAs between MEFs and iPSCs, as well as gene set score comparison for GOBP terms between controls and different RNA transfections. Dunnett’s multiple comparisons test was performed using GraphPad Prism for statistical analysis of protein synthesis rates after ESC transfection of scrambled RNA, rsRNA-28S-1 and pooled tsRNA. The radar plots were generated using the radarchart function in the R package fmsb based on a log10-transformed scale. The RNA relative expression heatmaps were generated using the heatmap.2 function in the R package gplots based on a log2-transformed scale. For each small RNA mapping plot, we included a shaded band to indicate the standard error of the mean (s.e.m.). The rRNA coverage similarity comparison matrices were generated using the pheatmap function in the R package pheatmap.
Reporting Summary.
Further information on research design is available in the Nature Research Reporting Summary linked to this article.
Data availability
RNA-seq datasets have been deposited in the Gene Expression Omnibus under the accession code GSE144666. LC-MS/MS data have been deposited in Figshare (https://figshare.com/articles/dataset/_/14033003). All other data supporting the findings of this study are available from the corresponding authors upon reasonable request. Source data are provided with this paper.
Code availability
The sncRNA annotation pipeline SPORTS1.1 is available from GitHub (https://github.com/junchaoshi/sports1.1). The scripts used for data processing and statistical analysis were written in Perl or R and are available upon reasonable request.
Extended Data
Extended Data Fig. 1 ∣. Reads summary and length distributions of different sncRNA category under Traditional RNA-seq, AlkB-facilitated RNA-seq, T4PNK-facilitated RNA-seq, and PANDORA-seq.
Showing Reads summary and length distributions of different sncRNA category in six tissue/cell types that are not shown in Fig. 3 because of space limitation. (a-c) Cells during mouse somatic cell reprogramming to iPSC: (a) MEFs (day 0), (b) intermediates (day 3), (c) iPSCs; (d) mouse spleen, (e) primed human embryonic stem cells (hESCs-primed), and (f) naïve human embryonic stem cells (hESCs-naïve) (g-l) the relative tsRNA/miRNA ratio under different protocols. for g,h,I,k, mean ± SEM, n=3 biologically independent samples in each bar; for j,l, n=2 biologically independent samples in each bar; different letters above bars indicate statistical difference, P < 0.05; same letters indicate P ≥ 0.05 (two-sided, one-way ANOVA, uncorrected Fisher’s LSD test). Statistical source data and the precise P values are provided in Source Data Extended Data Fig. 1.
Extended Data Fig. 2 ∣. Evaluation of Northern blot probe efficiency on synthesized targets (that is, rsRNA-28S-1, 5′tsRNAGlu, let-7i, mir-122, mir-21).
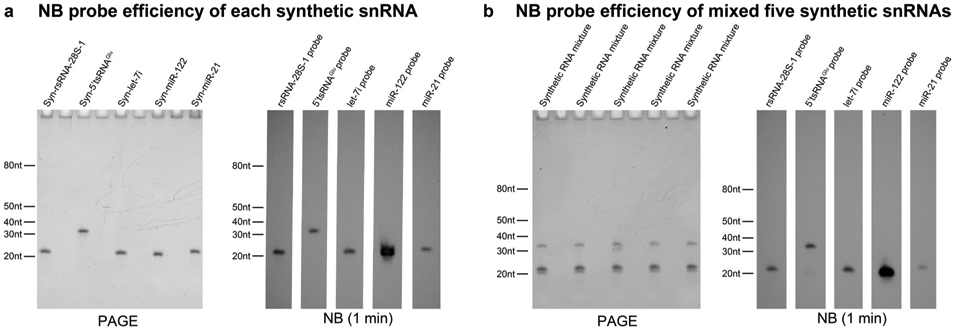
The Northern blot probes used for each target are the same as used in main Fig. 2g-i. a, each synthetic sncRNAs are individually loaded on PAGE followed by Northern blots analyses. b, the five synthetic sncRNAs were mixed together with the amount tested in (a) and then equally separated and loaded on PAGE followed by Northern blots analyses. The relative efficiency of each NB probe can be shown: the probe efficiency between let-7i, tsRNAGlu and rsRNA-28 are similar; the probe for mir-122 is highest, while the probe for mir-21 has the lowest efficiency. Similar results were obtained in 3 independent experiments. The unprocessed blots are provided in Source Data Extended Data Fig. 2.
Extended Data Fig. 3 ∣. Annotation of mouse piRNA in non-germ cell tissue/cell types is not stable when 1–3 mismatches are allowed.
When 1–3 mismatches are allowed for sncRNAs matching, the piRNA annotation rate (but not other sncRNAs types) show significant decrease in mouse tissue/cell types (a) mouse brain, (b) mouse liver, (c) mouse spleen, (d) mouse embryonic stem cells, (e) mouse mature sperm, (f) mouse mature sperm heads, (g) mouse MEFs (day 0), (h) mouse intermediate cells (day 3), (i) mouse iPSCs. Very few piRNAs were annotated for human cell lines (j) human HeLa cells, (k) human hESCs-primed, and (l) human hESCs-naïve. These data suggest the annotated piRNAs in non-germ cell tissue/cell types could be due to database quality issue and their true identity awaits to be verified.
Extended Data Fig. 4 ∣. Scattered plot comparison of profile changes in tsRNAs and rsRNAs compared to miRNAs under different treatment protocol.
Scattered plot comparison of profile changes in tsRNAs (red dots) and rsRNAs (blue dots) compared to miRNAs (gray dots) under AlkB vs traditional, T4PNK vs traditional and PANDORA-seq vs traditional in (a) mouse brain, (b) mouse liver, (c) mouse spleen, (d) mouse mature sperm, (e) mouse MEFs (day 0), (f) mouse intermediate cells (day 3), (g) mouse iPSCs, (h) human HeLa cells, (i) human hESCs-primed, (j) mouse mature sperm heads, and (k) human hESCs-naïve.
Extended Data Fig. 5 ∣. The tsRNA responses to AlkB, T4PNK and PANDORA-seq in regard to different tsRNA origin (5′tsRNA, 3′tsRNA, 3′tsRNA with CCA end, and internal tsRNAs).
a, mouse brain, (b) mouse liver, (c) mouse spleen, (d) mouse mature sperm, (e) mouse mature sperm heads, (f) mouse MEFs (day 0), (g) mouse intermediate cells (day 3), (h) mouse iPSCs, (i) human HeLa cells, (j) human hESCs-primed, and (k) human hESCs-naïve. For a-b,d-j, data are plotted as mean ± SEM (n=3 biologically independent samples in each bar); for c,k, n=2 biologically independent samples in each bar. Different letters above bars indicate statistical difference, P < 0.05; same letters indicate P ≥ 0.05 (two-sided, one-way ANOVA, uncorrected Fisher’s LSD test). Statistical source data and the precise P values are provided in Source Data Extended Data Fig. 5.
Extended Data Fig. 6 ∣. Overall length mapping of tsRNA reads in genomic and mitochondrial tRNA under different RNA-seq protocol.
Overall mapping of all tsRNAs on a tRNA length scale revealed the preferential loci from which tsRNAs are derived from the mature full tRNA under traditional protocol and different enzymatic treatments. a, mouse brain, (b) mouse liver, (c) mouse spleen, (d) mouse mature sperm, (e) mouse MEFs (day 0), (f) mouse intermediate cells (day 3), (g) mouse iPSCs, (h) human HeLa cells, (i) human hESCs-primed, (j) mouse mature sperm heads, and (k) human hESCs-naïve. Mapping plots are presented as mean ± SEM.
Extended Data Fig. 7 ∣. The miRNAs that showing sensitive response to PANDORA-seq are in fact rsRNAs.
Previously annotated miRNAs from miRbase that showing upregulation under PANDORA-seq could also annotated to rsRNAs (with one mismatch tolerance), as shown in (a) mouse brain, (b) mouse liver, (c) mouse spleen, (d) mouse mature sperm, (e) mouse mature sperm heads, (f) mouse MEFs (day 0), (g) mouse intermediate cells (day 3), (h) mouse iPSCs, (i) human HeLa cells, and (j) human hESCs-naïve.
Extended Data Fig. 8 ∣. The pairwise comparison matrices showing the differential expression pattern of rsRNAs under different RNA-seq protocol across tissues and cells.
a, Pairwise comparison matrices for six mouse tissue/cell types, including 5S rRNA, 5.8S rRNA, mitochondrial 12S rRNA, mitochondrial 16S rRNA, 28S rRNA and 45S rRNA. Color bar: from blue (more similar) to red (more different). b, Pairwise comparison matrices for three human cell types, including 5S rRNA, 5.8S rRNA, mitochondrial 12S rRNA, mitochondrial 16S rRNA, 28S rRNA and 45S rRNA. Color bar: from blue (more similar) to red (more different). c, Pairwise comparison matrices for during mouse iPSC reprogramming, including 5S rRNA, 5.8S rRNA, mitochondrial 12S rRNA, mitochondrial 16S rRNA, 18S rRNA, 28S rRNA and 45S rRNA. Color bar: from blue (more similar) to red (more different).
Extended Data Fig. 9 ∣. Northern blot analyses of tsRNA/rsRNA (that is, tsRNAAla, tsRNAArg, tsRNAGlu, tsRNAHis, tsRNALys and rsRNA-28S-1) changes during mESC to EB differentiation.
a, mESC vs Day6 EB; (b) mESC vs Day10 EB. Red arrowhead: tsRNAs; Blue arrowhead: rsRNAs. Similar results were obtained in 3 independent experiments for rsRNA-28S-1; and in 2 independent experiments for tsRNAAla, tsRNAArg, tsRNAGlu, tsRNAHis, and tsRNALys. The unprocessed blots are provided in Source Data Extended Data Fig. 9.
Extended Data Fig. 10 ∣. Expression heatmap of the differentially expressed genes from representative GOBP terms in Day6 and Enriched GOBP terms of differential expressed genes in Day3 EBs after tsRNA/rsRNA transfection.
a,b,c,d, Expression heatmap of the differentially expressed genes from the representative GOBP terms in Day3 EBs from Fig. 6b,c: (a) Neurological development; (b) Muscle/heart development; (c) Oxidative phosphorylation; (d) Translation/ribosome. Venn-diagram beneath each heatmap shows the numbers of overlapped dysregulated genes under different tsRNA/rsRNA transfection. e, Top-ranked upregulated GOBP terms in Day3 EBs after each tsRNA/rsRNA transfection compared to control. f, Top-ranked downregulated GOBP terms in Day3 EBs after each tsRNA/rsRNA transfection compared to control.
Supplementary Material
Acknowledgements
We thank T. Lowe at the University of California, Santa Cruz for early discussion on the project, and Z. Li from the Shanghai Institute of Nutrition and Health, Chinese Academy of Sciences for assistance with operating the mass spectrometer. This work is in part supported by MOST (2019YFA0802600 to Ying Zhang (Chinese Academy of Sciences) and Yunfang Zhang; 2018YFC1004500 to Ying Zhang (Chinese Academy of Sciences) and M.Y.), startup funds from the University of California, Riverside (to Q.C. and S.C.) and the NIH (R01HD092431 to Q.C.; R01ES032024 to Q.C. and T.Z.; P50HD098593 to T.Z. and Q.C.; R35GM128854 to L. Zhao). This work includes data generated at the University of California, San Diego IGM Genomics Center funded by the NIH (P30DK063491, P30CA023100 and P30DK120515). Q.Z. is funded by the NSFC (31630037). Ying Zhang (University of California, Riverside) is funded by a State Scholarships Fund (201908500039). Yunfang Zhang is funded by the NSFC (82022029) and the Natural Science Foundation of Chongqing (cstc2019jcyjjqX0010). M.Y. is funded by the NSFC (31670830) and is a fellow of the Innovative Research Team of High-Level Local Universities in Shanghai. M.S. is funded by an Advanced EMBO fellowship. K.M. is funded by a BBSRC scholarship. Work in the laboratory of M.Z.-G. is funded by the Wellcome Trust (207415/Z/17/Z), ERC (669198) and Open Philanthropy. R.F. is supported by UC Riverside’s Eugene Cota-Robles Fellowship.
Footnotes
Competing interests
The authors declare no competing interests.
Extended data is available for this paper at https://doi.org/10.1038/s41556-021-00652-7.
Supplementary information The online version contains supplementary material available at https://doi.org/10.1038/s41556-021-00652-7.
Peer review information Nature Cell Biology thanks the anonymous reviewers for their contribution to the peer review of this work.
Online content
Any methods, additional references, Nature Research reporting summaries, source data, extended data, supplementary information, acknowledgements, peer review information; details of author contributions and competing interests; and statements of data and code availability are available at https://doi.org/10.1038/s41556-021-00652-7.
Publisher’s note Springer Nature remains neutral with regard to jurisdictional claims in published maps and institutional affiliations.
References
- 1.Bartel DP Metazoan microRNAs. Cell 173, 20–51 (2018). [DOI] [PMC free article] [PubMed] [Google Scholar]
- 2.Honda S et al. Sex hormone-dependent tRNA halves enhance cell proliferation in breast and prostate cancers. Proc. Natl Acad. Sci. USA 112, E3816–E3825 (2015). [DOI] [PMC free article] [PubMed] [Google Scholar]
- 3.Cozen AE et al. ARM-seq: AlkB-facilitated RNA methylation sequencing reveals a complex landscape of modified tRNA fragments. Nat. Methods 12, 879–884 (2015). [DOI] [PMC free article] [PubMed] [Google Scholar]
- 4.Zheng G et al. Efficient and quantitative high-throughput tRNA sequencing. Nat. Methods 12, 835–837 (2015). [DOI] [PMC free article] [PubMed] [Google Scholar]
- 5.Dai Q, Zheng G, Schwartz MH, Clark WC & Pan T Selective enzymatic demethylation of N2,N2-dimethylguanosine in RNA and its application in high-throughput tRNA sequencing. Angew. Chem. Int. Ed. Engl 56, 5017–5020 (2017). [DOI] [PMC free article] [PubMed] [Google Scholar]
- 6.Zhang X, Cozen AE, Liu Y, Chen Q & Lowe TM Small RNA modifications: integral to function and disease. Trends Mol. Med 22, 1025–1034 (2016). [DOI] [PMC free article] [PubMed] [Google Scholar]
- 7.Chen Q, Yan W & Duan E Epigenetic inheritance of acquired traits through sperm RNAs and sperm RNA modifications. Nat. Rev. Genet 17, 733–743 (2016). [DOI] [PMC free article] [PubMed] [Google Scholar]
- 8.Sergiev PV, Aleksashin NA, Chugunova AA, Polikanov YS & Dontsova OA Structural and evolutionary insights into ribosomal RNA methylation. Nat. Chem. Biol 14, 226–235 (2018). [DOI] [PubMed] [Google Scholar]
- 9.Phizicky EM & Hopper AK tRNA biology charges to the front. Genes Dev. 24, 1832–1860 (2010). [DOI] [PMC free article] [PubMed] [Google Scholar]
- 10.Schimmel P The emerging complexity of the tRNA world: mammalian tRNAs beyond protein synthesis. Nat. Rev. Mol. Cell Biol 19, 45–58 (2018). [DOI] [PubMed] [Google Scholar]
- 11.Akiyama Y et al. Multiple ribonuclease A family members cleave transfer RNAs in response to stress. Preprint at biorxiv 10.1101/811174 (2019). [DOI] [Google Scholar]
- 12.Shigematsu M, Kawamura T & Kirino Y Generation of 2′,3′-cyclic phosphate-containing RNAs as a hidden layer of the transcriptome. Front. Genet 9, 562 (2018). [DOI] [PMC free article] [PubMed] [Google Scholar]
- 13.Akat KM et al. Detection of circulating extracellular mRNAs by modified small-RNA-sequencing analysis. JCI Insight 5, e127317 (2019). [DOI] [PMC free article] [PubMed] [Google Scholar]
- 14.Giraldez MD et al. Phospho-RNA-seq: a modified small RNA-seq method that reveals circulating mRNA and lncRNA fragments as potential biomarkers in human plasma. EMBO J. 38, e101695 (2019). [DOI] [PMC free article] [PubMed] [Google Scholar]
- 15.Shi J, Zhang Y, Zhou T & Chen Q tsRNAs: the Swiss Army knife for translational regulation. Trends Biochem. Sci. 44, 185–189 (2019). [DOI] [PMC free article] [PubMed] [Google Scholar]
- 16.Su Z, Wilson B, Kumar P & Dutta A Noncanonical roles of tRNAs: tRNA fragments and beyond. Annu. Rev. Genet. 54, 47–69 (2020). [DOI] [PMC free article] [PubMed] [Google Scholar]
- 17.Zhang Y et al. Dnmt2 mediates intergenerational transmission of paternally acquired metabolic disorders through sperm small non-coding RNAs. Nat. Cell Biol. 20, 535–540 (2018). [DOI] [PMC free article] [PubMed] [Google Scholar]
- 18.Natt D et al. Human sperm displays rapid responses to diet. PLoS Biol. 17, e3000559 (2019). [DOI] [PMC free article] [PubMed] [Google Scholar]
- 19.Gu W et al. Peripheral blood non-canonical small non-coding RNAs as novel biomarkers in lung cancer. Mol. Cancer 19, 159 (2020). [DOI] [PMC free article] [PubMed] [Google Scholar]
- 20.Shi J, Ko EA, Sanders KM, Chen Q & Zhou T SPORTS1.0: a tool for annotating and profiling non-coding RNAs optimized for rRNA- and tRNA-derived small RNAs. Genom. Proteom. Bioinf 16, 144–151 (2018). [DOI] [PMC free article] [PubMed] [Google Scholar]
- 21.Trewick SC, Henshaw TF, Hausinger RP, Lindahl T & Sedgwick B Oxidative demethylation by Escherichia coli AlkB directly reverts DNA base damage. Nature 419, 174–178 (2002). [DOI] [PubMed] [Google Scholar]
- 22.Chen Q et al. Sperm tsRNAs contribute to intergenerational inheritance of an acquired metabolic disorder. Science 351, 397–400 (2016). [DOI] [PubMed] [Google Scholar]
- 23.Pan T Modifications and functional genomics of human transfer RNA. Cell Res. 28, 395–404 (2018). [DOI] [PMC free article] [PubMed] [Google Scholar]
- 24.Guo G et al. Epigenetic resetting of human pluripotency. Development 144, 2748–2763 (2017). [DOI] [PMC free article] [PubMed] [Google Scholar]
- 25.Cheloufi S et al. The histone chaperone CAF-1 safeguards somatic cell identity. Nature 528, 218–224 (2015). [DOI] [PMC free article] [PubMed] [Google Scholar]
- 26.Peng H et al. A novel class of tRNA-derived small RNAs extremely enriched in mature mouse sperm. Cell Res. 22, 1609–1612 (2012). [DOI] [PMC free article] [PubMed] [Google Scholar]
- 27.Chu C et al. A sequence of 28S rRNA-derived small RNAs is enriched in mature sperm and various somatic tissues and possibly associates with inflammation. J. Mol. Cell. Biol 9, 256–259 (2017). [DOI] [PubMed] [Google Scholar]
- 28.Valdmanis PN et al. RNA interference-induced hepatotoxicity results from loss of the first synthesized isoform of microRNA-122 in mice. Nat. Med 22, 557–562 (2016). [DOI] [PMC free article] [PubMed] [Google Scholar]
- 29.Zhang P et al. piRBase: a web resource assisting piRNA functional study. Database (Oxf.) 2014, bau110 (2014). [DOI] [PMC free article] [PubMed] [Google Scholar]
- 30.Sai Lakshmi S & Agrawal S piRNABank: a web resource on classified and clustered PIWI-interacting RNAs. Nucleic Acids Res. 36, D173–D177 (2008). [DOI] [PMC free article] [PubMed] [Google Scholar]
- 31.Suzuki T & Suzuki T A complete landscape of post-transcriptional modifications in mammalian mitochondrial tRNAs. Nucleic Acids Res. 42, 7346–7357 (2014). [DOI] [PMC free article] [PubMed] [Google Scholar]
- 32.Hizir Z, Bottini S, Grandjean V, Trabucchi M & Repetto E RNY (YRNA)-derived small RNAs regulate cell death and inflammation in monocytes/macrophages. Cell Death Dis. 8, e2530 (2017). [DOI] [PMC free article] [PubMed] [Google Scholar]
- 33.Viswanathan SR, Daley GQ & Gregory RI Selective blockade of microRNA processing by Lin28. Science 320, 97–100 (2008). [DOI] [PMC free article] [PubMed] [Google Scholar]
- 34.Krishna S et al. Dynamic expression of tRNA-derived small RNAs define cellular states. EMBO Rep. 20, e47789 (2019). [DOI] [PMC free article] [PubMed] [Google Scholar]
- 35.Zhang J et al. Metabolism in pluripotent stem cells and early mammalian development. Cell Metab. 27, 332–338 (2018). [DOI] [PubMed] [Google Scholar]
- 36.Chau KF et al. Downregulation of ribosome biogenesis during early forebrain development. eLife 7, e36998 (2018). [DOI] [PMC free article] [PubMed] [Google Scholar]
- 37.Yang X et al. Single sample expression-anchored mechanisms predict survival in head and neck cancer. PLoS Comput. Biol 8, e1002350 (2012). [DOI] [PMC free article] [PubMed] [Google Scholar]
- 38.Genuth NR & Barna M The discovery of ribosome heterogeneity and its implications for gene regulation and organismal life. Mol. Cell 71, 364–374 (2018). [DOI] [PMC free article] [PubMed] [Google Scholar]
- 39.Li D & Wang J Ribosome heterogeneity in stem cells and development. J. Cell Biol. 219, e202001108 (2020). [DOI] [PMC free article] [PubMed] [Google Scholar]
- 40.Ozata DM, Gainetdinov I, Zoch A, O’Carroll D & Zamore PD PIWI-interacting RNAs: small RNAs with big functions. Nat. Rev. Genet 20, 89–108 (2019). [DOI] [PubMed] [Google Scholar]
- 41.Lambert M, Benmoussa A & Provost P Small non-coding RNAs derived from eukaryotic ribosomal RNA. Noncoding RNA 5, 16 (2019). [DOI] [PMC free article] [PubMed] [Google Scholar]
- 42.Wei H et al. Profiling and identification of small rDNA-derived RNAs and their potential biological functions. PLoS ONE 8, e56842 (2013). [DOI] [PMC free article] [PubMed] [Google Scholar]
- 43.Thompson DM, Lu C, Green PJ & Parker R tRNA cleavage is a conserved response to oxidative stress in eukaryotes. RNA 14, 2095–2103 (2008). [DOI] [PMC free article] [PubMed] [Google Scholar]
- 44.Liao JY et al. Both endo-siRNAs and tRNA-derived small RNAs are involved in the differentiation of primitive eukaryote Giardia lamblia. Proc. Natl Acad. Sci. USA 111, 14159–14164 (2014). [DOI] [PMC free article] [PubMed] [Google Scholar]
- 45.Lambertz U et al. Small RNAs derived from tRNAs and rRNAs are highly enriched in exosomes from both Old and New World Leishmania providing evidence for conserved exosomal RNA packaging. BMC Genomics 16, 151 (2015). [DOI] [PMC free article] [PubMed] [Google Scholar]
- 46.Garcia-Silva MR et al. Extracellular vesicles shed by Trypanosoma cruzi are linked to small RNA pathways, life cycle regulation, and susceptibility to infection of mammalian cells. Parasitol. Res. 113, 285–304 (2014). [DOI] [PubMed] [Google Scholar]
- 47.Fricker R et al. A tRNA half modulates translation as stress response in Trypanosoma brucei. Nat. Commun 10, 118 (2019). [DOI] [PMC free article] [PubMed] [Google Scholar]
- 48.Zinskie JA et al. Iron-dependent cleavage of ribosomal RNA during oxidative stress in the yeast Saccharomyces cerevisiae. J. Biol. Chem 293, 14237–14248 (2018). [DOI] [PMC free article] [PubMed] [Google Scholar]
- 49.Yamasaki S, Ivanov P, Hu GF & Anderson P Angiogenin cleaves tRNA and promotes stress-induced translational repression. J. Cell Biol 185, 35–42 (2009). [DOI] [PMC free article] [PubMed] [Google Scholar]
- 50.Lee SR & Collins K Starvation-induced cleavage of the tRNA anticodon loop in Tetrahymena thermophila. J. Biol. Chem 280, 42744–42749 (2005). [DOI] [PubMed] [Google Scholar]
- 51.Andersen KL & Collins K Several RNase T2 enzymes function in induced tRNA and rRNA turnover in the ciliate Tetrahymena. Mol. Biol. Cell 23, 36–44 (2012). [DOI] [PMC free article] [PubMed] [Google Scholar]
- 52.Kuscu C et al. tRNA fragments (tRFs) guide Ago to regulate gene expression post-transcriptionally in a Dicer-independent manner. RNA 24, 1093–1105 (2018). [DOI] [PMC free article] [PubMed] [Google Scholar]
- 53.Luo S et al. Drosophila tsRNAs preferentially suppress general translation machinery via antisense pairing and participate in cellular starvation response. Nucleic Acids Res. 46, 5250–5268 (2018). [DOI] [PMC free article] [PubMed] [Google Scholar]
- 54.Kim HK et al. A transfer-RNA-derived small RNA regulates ribosome biogenesis. Nature 552, 57–62 (2017). [DOI] [PMC free article] [PubMed] [Google Scholar]
- 55.Gebetsberger J, Wyss L, Mleczko AM, Reuther J & Polacek N A tRNA-derived fragment competes with mRNA for ribosome binding and regulates translation during stress. RNA Biol. 14, 1364–1373 (2017). [DOI] [PMC free article] [PubMed] [Google Scholar]
- 56.Schorn AJ, Gutbrod MJ, LeBlanc C & Martienssen R LTR-retrotransposon control by tRNA-derived small RNAs. Cell 170, 61–71. e11 (2017). [DOI] [PMC free article] [PubMed] [Google Scholar]
- 57.Martinez G, Choudury SG & Slotkin RK tRNA-derived small RNAs target transposable element transcripts. Nucleic Acids Res. 45, 5142–5152 (2017). [DOI] [PMC free article] [PubMed] [Google Scholar]
- 58.Sarker G et al. Maternal overnutrition programs hedonic and metabolic phenotypes across generations through sperm tsRNAs. Proc. Natl Acad. Sci. USA 116, 10547–10556 (2019). [DOI] [PMC free article] [PubMed] [Google Scholar]
- 59.Sharma U et al. Biogenesis and function of tRNA fragments during sperm maturation and fertilization in mammals. Science 351, 391–396 (2016). [DOI] [PMC free article] [PubMed] [Google Scholar]
- 60.Zhang Y, Shi J, Rassoulzadegan M, Tuorto F & Chen Q Sperm RNA code programmes the metabolic health of offspring. Nat. Rev. Endocrinol 15, 489–498 (2019). [DOI] [PMC free article] [PubMed] [Google Scholar]
- 61.Ren B, Wang X, Duan J & Ma J Rhizobial tRNA-derived small RNAs are signal molecules regulating plant nodulation. Science 365, 919–922 (2019). [DOI] [PubMed] [Google Scholar]
- 62.Lewis CJ, Pan T & Kalsotra A RNA modifications and structures cooperate to guide RNA–protein interactions. Nat. Rev. Mol. Cell Biol 18, 202–210 (2017). [DOI] [PMC free article] [PubMed] [Google Scholar]
- 63.Frye M, Harada BT, Behm M & He C RNA modifications modulate gene expression during development. Science 361, 1346–1349 (2018). [DOI] [PMC free article] [PubMed] [Google Scholar]
- 64.Raabe CA, Tang TH, Brosius J & Rozhdestvensky TS Biases in small RNA deep sequencing data. Nucleic Acids Res. 42, 1414–1426 (2014). [DOI] [PMC free article] [PubMed] [Google Scholar]
- 65.Wei FY et al. Cdk5rap1-mediated 2-methylthio modification of mitochondrial tRNAs governs protein translation and contributes to myopathy in mice and humans. Cell Metab. 21, 428–442 (2015). [DOI] [PubMed] [Google Scholar]
- 66.Li L, Dai H, Nguyen AP & Gu W A convenient strategy to clone modified/unmodified small RNA and mRNA for high throughput sequencing. RNA 16, 218–222 (2019). [DOI] [PMC free article] [PubMed] [Google Scholar]
- 67.Stadtfeld M, Maherali N, Borkent M & Hochedlinger K A reprogrammable mouse strain from gene-targeted embryonic stem cells. Nat. Methods 7, 53–55 (2010). [DOI] [PMC free article] [PubMed] [Google Scholar]
- 68.Behringer R, Gertsenstein M, Nagy KV & Nagy A Differentiating mouse embryonic stem cells into embryoid bodies by hanging-drop cultures. Cold Spring Harb. Protoc 10.1101/pdb.prot092429 (2016). [DOI] [PubMed] [Google Scholar]
- 69.Schaniel C et al. Delivery of short hairpin RNAs—triggers of gene silencing—into mouse embryonic stem cells. Nat. Methods 3, 397–400 (2006). [DOI] [PubMed] [Google Scholar]
- 70.Kozomara A & Griffiths-Jones S miRBase: annotating high confidence microRNAs using deep sequencing data. Nucleic Acids Res. 42, D68–D73 (2014). [DOI] [PMC free article] [PubMed] [Google Scholar]
- 71.Chan PP & Lowe TM GtRNAdb 2.0: an expanded database of transfer RNA genes identified in complete and draft genomes. Nucleic Acids Res. 44, D184–D189 (2016). [DOI] [PMC free article] [PubMed] [Google Scholar]
- 72.Juhling F et al. tRNAdb 2009: compilation of tRNA sequences and tRNA genes. Nucleic Acids Res. 37, D159–D162 (2009). [DOI] [PMC free article] [PubMed] [Google Scholar]
- 73.Yates A et al. Ensembl 2016. Nucleic Acids Res. 44, D710–D716 (2016). [DOI] [PMC free article] [PubMed] [Google Scholar]
- 74.Nawrocki EP et al. Rfam 12.0: updates to the RNA families database. Nucleic Acids Res. 43, D130–D137 (2015). [DOI] [PMC free article] [PubMed] [Google Scholar]
- 75.Wang L, Feng Z, Wang X, Wang X & Zhang X DEGseq: an R package for identifying differentially expressed genes from RNA-seq data. Bioinformatics 26, 136–138 (2010). [DOI] [PubMed] [Google Scholar]
- 76.Lorenz R et al. ViennaRNA Package 2.0. Algorithms Mol. Biol 6, 26 (2011). [DOI] [PMC free article] [PubMed] [Google Scholar]
- 77.Bray NL, Pimentel H, Melsted P & Pachter L Near-optimal probabilistic RNA-seq quantification. Nat. Biotechnol 34, 525–527 (2016). [DOI] [PubMed] [Google Scholar]
- 78.Robinson MD, McCarthy DJ & Smyth GK edgeR: a Bioconductor package for differential expression analysis of digital gene expression data. Bioinformatics 26, 139–140 (2010). [DOI] [PMC free article] [PubMed] [Google Scholar]
- 79.Robinson MD & Oshlack A A scaling normalization method for differential expression analysis of RNA-seq data. Genome Biol. 11, R25 (2010). [DOI] [PMC free article] [PubMed] [Google Scholar]
- 80.Yu G, Wang LG, Han Y & He QY clusterProfiler: an R package for comparing biological themes among gene clusters. OMICS 16, 284–287 (2012). [DOI] [PMC free article] [PubMed] [Google Scholar]
Associated Data
This section collects any data citations, data availability statements, or supplementary materials included in this article.
Supplementary Materials
Data Availability Statement
RNA-seq datasets have been deposited in the Gene Expression Omnibus under the accession code GSE144666. LC-MS/MS data have been deposited in Figshare (https://figshare.com/articles/dataset/_/14033003). All other data supporting the findings of this study are available from the corresponding authors upon reasonable request. Source data are provided with this paper.


