

Abstract
Hearing loss is a heterogeneous disorder thought to affect brain reorganization across the lifespan. Here, structural alterations of the brain due to hearing loss are assessed by using unique effect size metrics based on Cohen’s d and Hedges’ g. These metrics are used to map coordinates of gray matter (GM) and white matter (WM) alterations from bilateral congenital and acquired hearing loss populations. A systematic review and meta-analysis revealed m = 72 studies with structural alterations measured with magnetic resonance imaging (MRI) (bilateral = 64, unilateral = 8). The bilateral studies categorized hearing loss into congenital and acquired cases (n = 7,445) and control cases (n = 2,924), containing 66,545 datapoint metrics. Hearing loss was found to affect GM and underlying WM in nearly every region of the brain. In congenital hearing loss, GM decreased most in the frontal lobe. Similarly, acquired hearing loss had a decrease in frontal lobe GM, albeit the insula was most decreased. In congenital, WM underlying the frontal lobe GM was most decreased. In congenital, the right hemisphere was more negatively impacted than the left hemisphere; however, in acquired, this was the opposite. The WM alterations most frequently underlined GM alterations in congenital hearing loss, while acquired hearing loss studies did not frequently assess the WM metric. Future studies should use the endophenotype of hearing loss as a prognostic template for discerning clinical outcomes.
Keywords: Sensorineural hearing loss, Structural MRI, DTI, Bilateral hearing loss, Unilateral hearing loss
1. Introduction
Hearing loss is a disorder of heterogeneous etiology (Morton and Nance, 2006) and considered the fourth leading impairment and disability for children and adults in the Global Burden of Disease, affecting approximately 466 million worldwide (GBD 2017 Disease and Injury Incidence and Prevalence Collaborators 2018, Cunningham and Tucci, 2017). General hearing screening tests (i.e. auditory brainstem responses and distortion product otoacoustic emissions) can improve identification of infants born with hearing impairments (Morton and Nance, 2006), but positive predictive value of the examinations is often low, missing up to 15% of children (Thompson et al., 2001). Here, clinicians implore using a battery of clinical tests to assist in the early identification of hearing loss (Kral and O’Donoghue (2010) to improve neurocognitive outcomes (Kral et al., 2016). In adults, untreated hearing loss results in higher total health care costs (Reed et al., 2019), is a risk factor for cognitive decline (Lin, 2013), and negatively affects economic indicators for the individual and society (Huddle et al., 2017). Clearly, for both children and adults, improved diagnostic assays in young patients and better interventions for patients as they age are needed (Ferguson et al., 2017).
Neuroimaging with MRI provides an accurate and reproducible assessment (Nichols et al., 2017) for discerning the structural alterations of hearing loss (Tarabichi et al., 2018, Ratnanather, 2020). However, its diagnostic ability for hearing screening in children and adults has not yet been widely employed (Feng et al., 2018, Ropers et al., 2019). One of the current drawbacks is the lack of a comprehensive assessment of the structural manifestations in hearing loss (Tarabichi et al., 2018, Simon et al., 2020, Ratnanather, 2020). The limiting factors are the structural endophenotype of hearing loss is diverse and no consensus/consummate review has been developed or conducted. Nevertheless, the central mechanisms of hearing loss are thought to affect white matter (WM) tracts leading from the 8th cranial nerve to subcortical nuclei (i.e. cochlear) (Moore et al., 1994) and onward to the primary auditory cortices (i.e. Heschl’s gyri), (Tarabichi et al., 2018, Ratnanather, 2020) where hearing loss is thought to affect gray matter (GM) (Feng et al., 2018). Early onset hearing loss affects the central auditory system, (Kral and O’Donoghue, 2010, Kral et al., 2016, Kral and Sharma, 2012) and later on in life, the cortical auditory processing areas are recruited by the visual system when they lose input (i.e. due to auditory deprivation). Although these timepoints are known, the progression of hearing loss and a definitive structural phenotype are unknown. Moreover, the diversity of brain alterations in hearing loss is heterogeneous and current studies present a wide variability of measurements making interpolation and generalization difficult (Kral and O’Donoghue, 2010, Kral et al., 2016, Tarabichi et al., 2018). A central remaining question is how does the structure of the brain change over time in hearing loss? What is the reorganization in WM and GM over critical developmental periods? The first structural studies of hearing loss (Moore et al., 1994, Moore et al., 1997) gave significant clues and current neuroimaging techniques with MRI (Tarabichi et al., 2018, Ratnanather, 2020) provide a unique ability to capture development periods, in order to answer these questions. Here we hope to bridge some of these limitations in the field by developing a consensus and structural endophenotype for acquired and congenital hearing loss.
This study aims to fill these gaps by developing a quantitative consensus and structural endophenotype for acquired and congenital hearing loss by conducting a comprehensive systematic review, meta-analysis and meta-regression of the structural manifestations of hearing loss throughout the lifespan (Fig. 1). First, a systemic review and meta-analysis was performed using GM and WM structural alterations to create effect size measures by region of interest. Second, heterogeneity of GM and WM metrics were determined to assess hearing loss variability. Third, region of interest (ROI) brain coordinate mapping was used to determine where and how hearing loss alters brain structure. Fourth, a meta-regression was implemented from data in infants to adults, throughout the human lifespan, to show the structural trajectory of hearing loss. Lastly, a probabilistic map of the hearing loss endophenotype was created by spatially backprojecting the effect sizes to the brain. Clinically, knowing where hearing loss occurs, the progression of structural changes over the lifespan and being able to track in an unbiased fashion in children and adults is of crucial importance.
Fig. 1.

Meta-analysis experimental design. a) Flow chart. Literature search illustrating data extraction from the studies to create effect sizes (Data in Brief Figure 1 Figure Flow Diagram). b) Meta-regression. The meta-regression was used to determine the GM and WM trajectories associated with hearing loss. The metrics were GM and WM for congenital and acquired populations in comparison to their respective controls by age. Heterogeneity plots were constructed: Forrest, Baujat, QQ plot, Galbriat plot, Scatter plot (bubble plot). The forest plot used Hedges’ g with Test for Heterogeneity χ2, Cochran’s Q and I2. c) MNI coordinate mapping (ALE, mKDA, SDM). Diagrammatic flow of MNI coordinate mapping procedures using anatomical likelihood estimation and multilevel kernel density analysis. First MNI coordinates were derived and thresholded. Second, Monte Carlo iterations were used for calculating Gaussian probability densities (ALE) or spherical radii (mKDA) or peak effect size differences (SDM) which were used for deriving clustering. Post-processing procedures included FEWR control and FDR used for developing final output image maps of ROI in hearing loss.
2. Methods
We followed the Preferred Reporting Items for Systematic Reviews and Meta-Analyses of Individual Participant Data (PRISMA Guidelines). The review followed the checklist enumerations as outlined by the Organization for Human Brain Mapping Committee on Best Practices in Data Analysis and Sharing (COBIDAS; http://www.humanbrainmapping.org/cobidas. Fig. 1) (Nichols et al., 2017). All analyses for the present study used custom Matlab scripts (2017a: The Mathworks, Natick, USA) and R. The manuscript is completely reproducible, replicable, and amendable for future iterations, with a ‘hit-enter’ repeatability, considered the gold-standard (Nichols et al., 2017). For details of the methods, please see the Data in Brief.
2.1. Eligibility criteria and study search
Criteria for study eligibility were peer-reviewed publications in any language involving human participants with hearing loss who underwent structural MRI neuroimaging of the brain. We identified potentially eligible studies using PubMed, Google Scholar and Scopus. Bilateral hearing loss (BHL) and unilateral hearing loss (UHL) of any degree (mild, moderate, severe and profound) were included in the literature search. For the quantitative portions of the analysis, UHL was excluded due to the small number of studies (n ≈ 10; see Data in Brief) and not to bias the results due to side of hearing. Therefore, the final inclusion criteria were any MRI studies of BHL (Fig. 1a and Data in Brief Fig. 1 Flow Diagram). All information from the studies was tabulated into ISA-tab formatted CSV data descriptors by manual data entry (meta_sideDeaf.csv; Checked by two authors FAMM and JTR; Figs. 1 and 2). The unit of analysis for the present manuscript was the study, in addition to region of interest and GM and WM metric information tabulated from the study as described in the Data Acquisition section. All datapoint metrics from the study were categorized (MNI parameters and scanning sequence, etc) and assessed.
Fig. 2.
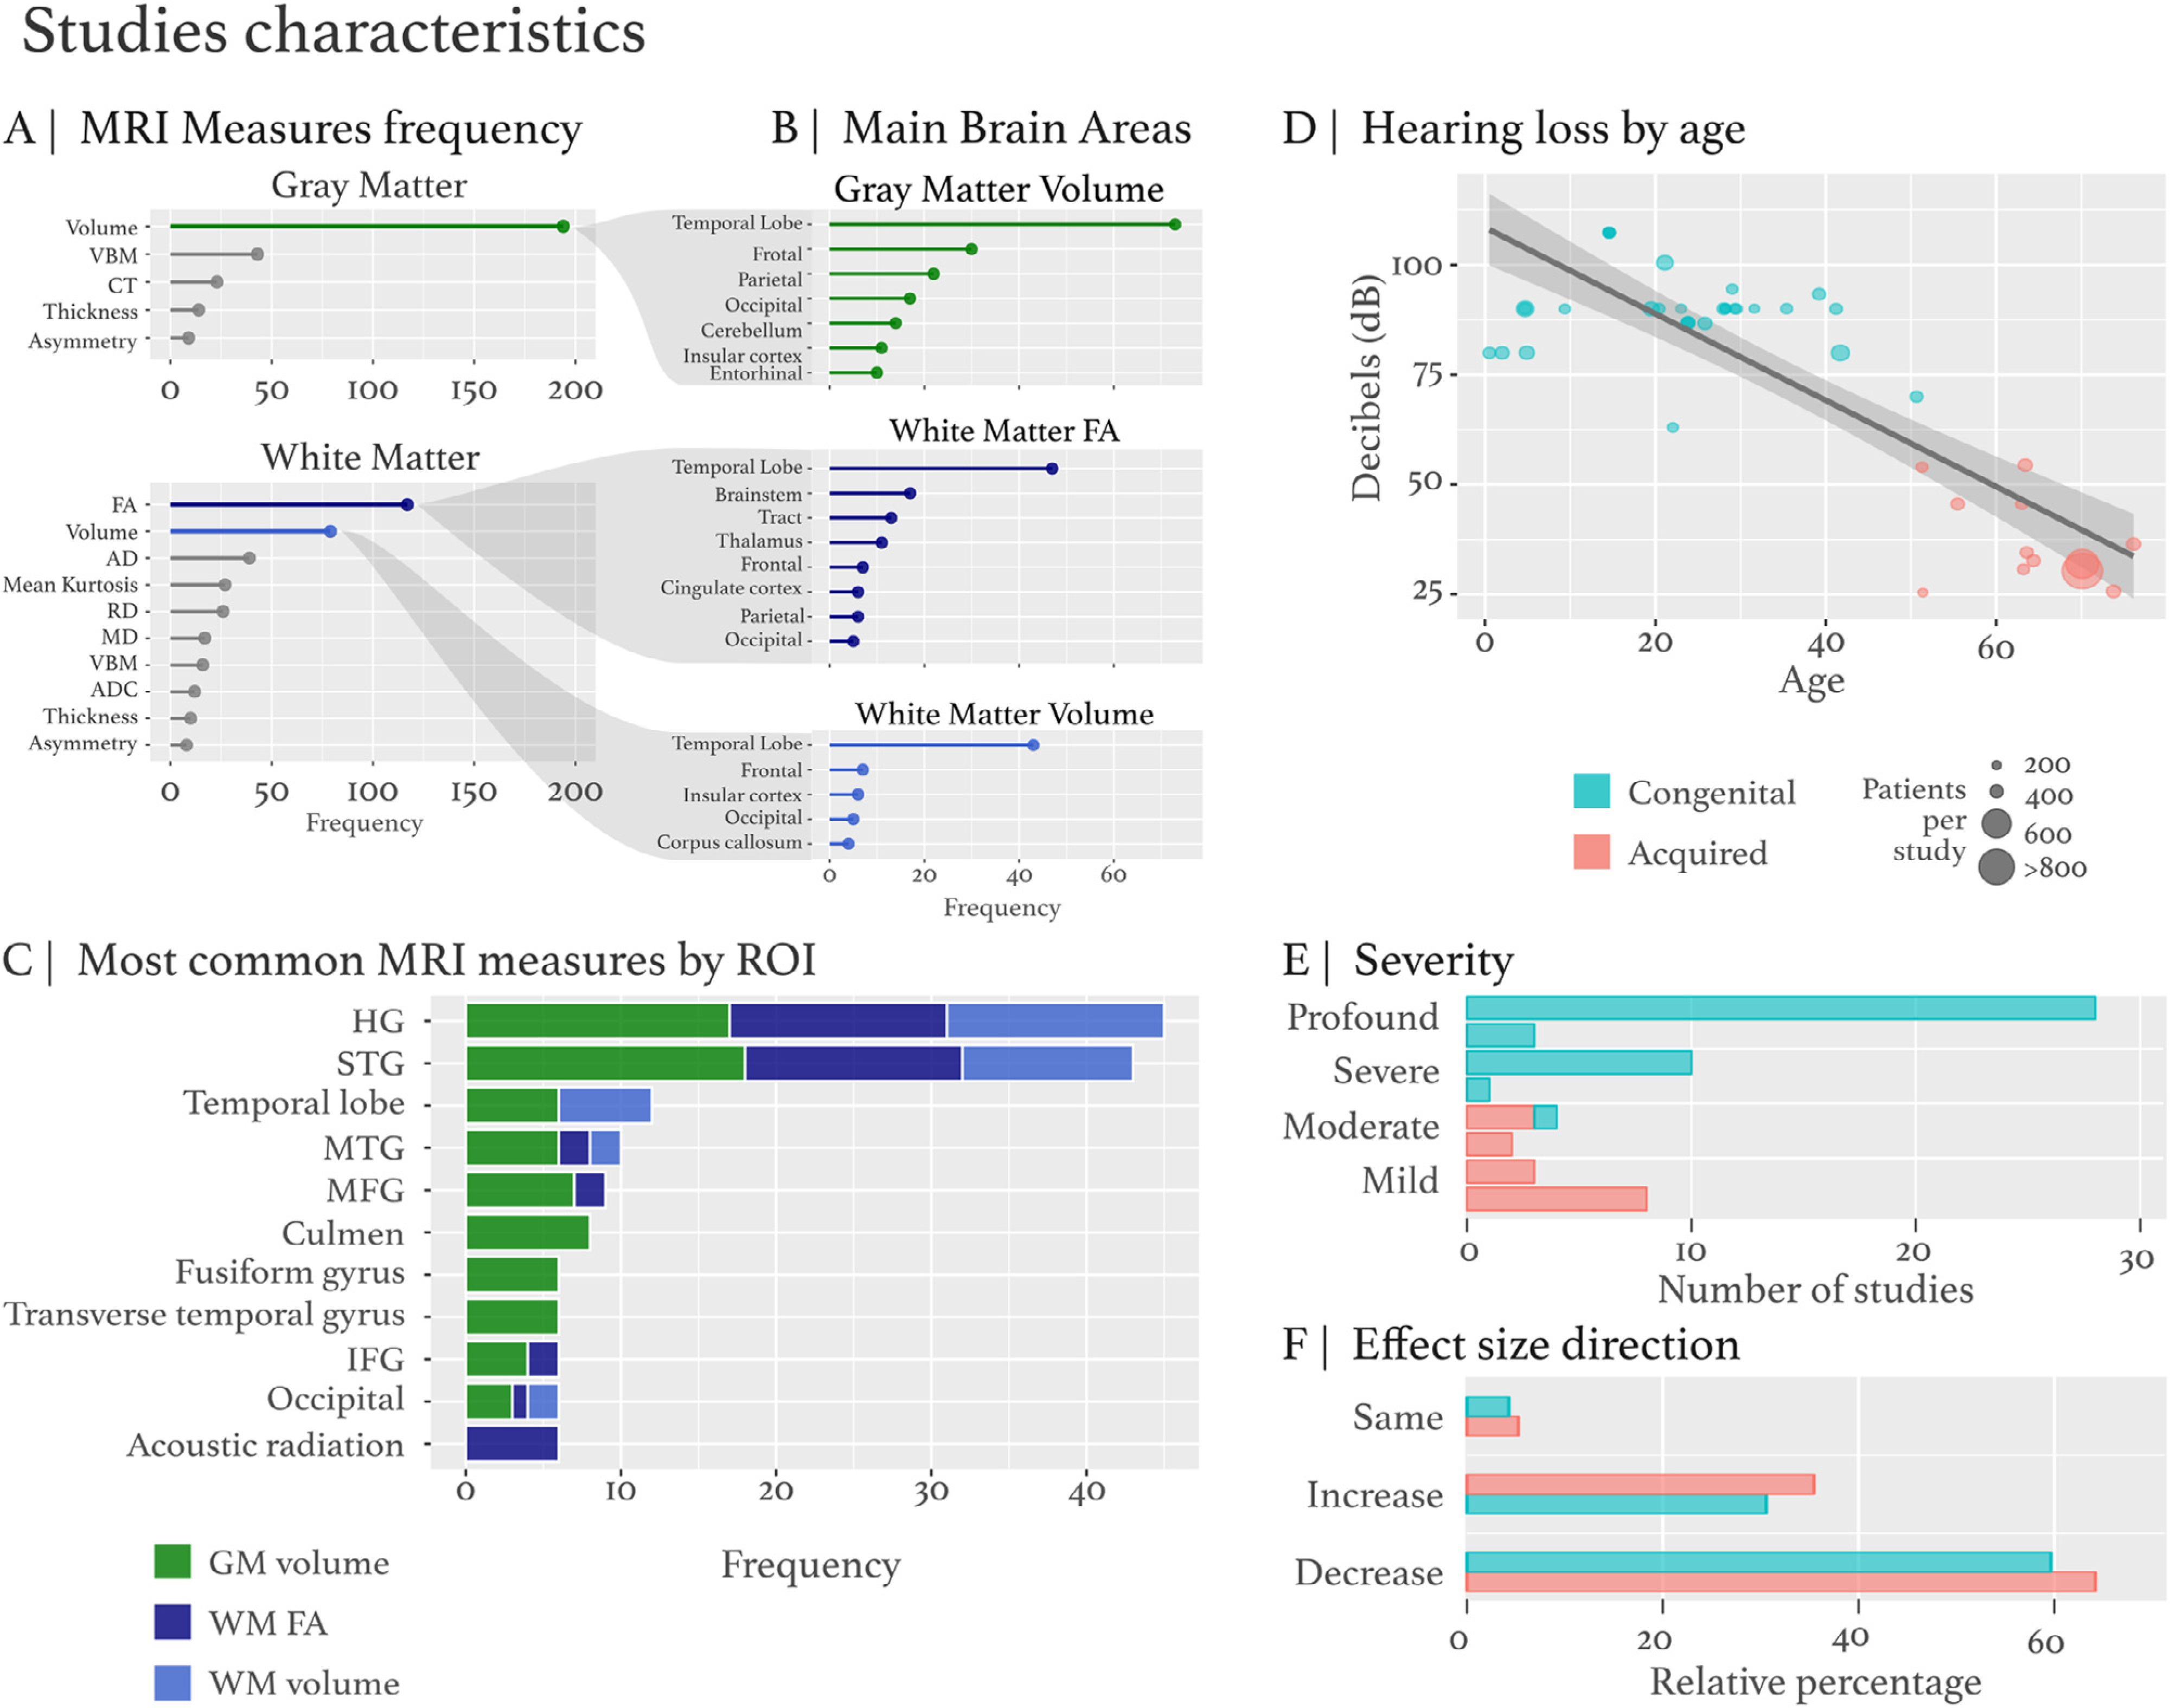
Study characteristics. The GM and WM data metrics were extracted from studies (see meta_sideDeaf.csv for all variables). A) The metrics GM and WM characteristics were used to derive variables (DTI, cortical thickness, volume, etc) and segregated by ROI. B) The ROI segregation has three main metric types GM volume, WM FA and WM volume based on the preponderance of these metrics included in the studies. C) The most common MRI measures by ROI frequency (GM volume – green, WM FA - dark blue, WM volume – light blue). D) Hearing loss by age. The regression plot has decibels (dB) hearing loss on the y-axis and age on the x-axis. Congenital is represented by blue and acquired is represented by red, while population size is dictated by size of the circle. A histogram plot represents the study size compared to other studies. E) Hearing loss severity: mild, moderate, severe, profound hearing loss categories. F) Effect size direction. The effect size direction indicates an increase, decrease or same compared to control effect size alteration for a relative ROI metric.
2.2. Regions of interest in hearing loss
The MNI coordinate mapping analysis was composed of general coordinate-based anatomic likelihood estimation (ALE), multi-level kernel density analysis (mKDA), and Seed-based Differential Mapping (SDM). ALE investigates where location probabilities reflect spatial uncertainty associated with the foci of each experiment overlap. mKDA tests how many foci are reported close to any individual voxel. These theoretical differences, that ALE evaluates probabilities of localization, whereas mKDA uses experimental foci counts, allow two different and precise interpretations of the resultant MNI coordinate maps. The SDM analysis is a combination of the methodology and assumptions of ALE and mKDA, using effect sizes and a representation of both positive and negative differences in the same structural brain map. Two levels of structure were assessed: 1) ROIs grouped under a cortical region (i.e. lobar region such as the left frontal lobe) and 2) areas spatially distant (ie. Heschl’s gyrus and occipital pole).
2.3. Meta-regression of GM and WM trajectories across the lifespan in hearing loss
To determine the GM and WM trajectories across the lifespan associated with hearing loss, a random effects meta-regression was performed using Cohen’s d or Hedges’ g, and the variability estimated with the standard deviation. The specific question for this procedure was: how do GM and WM alterations change in hearing loss over the lifespan? The multivariate meta-regression covaried age and sample size = n with GM or WM metrics by ROI.
2.4. Heterogeneity of gray matter and white matter
To determine heterogeneity among measures (GM and WM metrics) between experiments, heterogeneity plots (forest plot, Baujat plot, Funnel plot, Galbraith plot and bubble plot) were constructed using the R metafor package. Heterogeneity determines the dispersion of a particular measure due to variability or uncertainty. The question for these procedures was: how does heterogeneity in a particular GM or WM metric affect generalizability to the ROI in hearing loss?
2.5. Backprojection visualization of ROI mapping to create hearing loss endophenotype
Acquired and congenital multivariate meta-regression models by brain area were calculated. Random effects models covaried by main brain area were fitted to obtain the weights of left and right ROIs with GM or WM metrics. The resultant effect size estimates were backprojected to the respective brain area to create a meta-analytic endophenotype of hearing loss for GM and WM (Waskom et al., 2021). Here the effect size was visualized on the cortical surface with the meta-regression estimate per ROI derived from the meta-analysis (Waskom et al., 2021). Brain surface visualization and surface projection was done using SurfStat (Worsley et al., 2009) merging lobe mapping with an annotation file.
2.6. Research questions
The main research question was, what are the structural manifestations of hearing loss? The strategy followed a four-pronged approach. First, we assessed where general and specific GM and WM alterations occur in hearing loss. Second, we assessed general and specific ROI GM and WM lifespan trends in hearing loss. Third, we wanted to understand the heterogeneity attributed to GM or WM by general and specific ROI. Lastly, we created a novel effect size meta-regression backplotting the alterations in hearing loss to a cortical surface in MNI coordinates, in order to visualize a possible endophenotype of hearing loss.
3. Results
The literature search identified approximately n = 4,305 studies concerning structural assessments of hearing loss. Approximately n = 64 studies were identified as assessing structural alterations (n = 42 congenital, n = 19 acquired, and n = 3 mixed) containing 66,545 variable datapoints. Bilateral studies were divided into: VBM or volumetry (n = 36), cortical thickness (CT: n = 5), and DTI (n = 17), mixed/multi-modality (n = 6), and studies with duplicated data, albeit not identical analyses (n = 5). Our effect size assessment utilized n = 64 studies. From these studies, n = 27 studies reported MNI coordinates (n = 6 acquired, n = 21 congenital).
3.1. Regions of interest in hearing loss – congenital versus acquired
The ALE analysis shows that congenital and acquired hearing loss have overlapping ROI and separate clusters unique to their respective etiologies (Fig. 3; top 10 clusters reported in the Data in Brief). For acquired hearing loss, the ALE random effects analysis was not significant. For congenital hearing loss, the ALE random effects analysis had a maximum ALE score ≤ 0.05349994, p = 3.263727E-18. The ALE for congenital hearing loss had n = 271 foci (n = 23 experiments) of at least 50 mm3 from n = 873 MRI datapoints. The main cluster of significance for congenital hearing loss was 4840 mm3 from (−54,−34,−8) to (−32,−14,18) centered at (−43.7,−24,6.6) with the extrema at (−40,−26,8). This spanned the left superior temporal gyrus (STG), GM, and Brodmann area 13 (p = 0.05349994). For WM, the ALE random effects analysis had a maximum ALE score ≤ 0.03449566, p = 4.7408683E-12. The ALE had n = 126 foci (n = 20 experiments) of at least 50 mm3 from n = 1095 MRI datapoints. The main cluster of significance for WM was 3976 mm3 from (36,−28,−8) to (66,−2,16) centered at (52.1,−18.5,2.2) with the extrema at (56,−18,2). This spanned the right STG, GM, and Brodmann area 22 (p = 0.032029673). For GM, the ALE random effects analysis had a maximum ALE score ≤ 0.0223162, p = 3.794739E-26. The ALE had n = 214 foci (n = 22 experiments) of at least 50 mm3 from n = 1173 MRI datapoints. The main cluster of significance for GM was 2584 mm3 from (−52,−32,0) to (−34,−12,18) centered at (−43.1,−23.5,8.6) with the extrema at (−42,−22,10). This spanned the left insula, GM, and Brodmann area 13 (p = 0.0223162). For pediatric hearing loss, the ALE random effects analysis had a maximum ALE score ≤ 0.016416313, p = 4.584331E-6. The ALE had n = 89 foci (n = 10 experiments) of at least 50 mm3 from n = 428 MRI datapoints. The main cluster of significance for pediatric hearing loss was 1024 mm3 from (−54,−26,−8) to (−42,−16,10) centered at (−48,−21.1,1) with the extrema at (−48,−22,4). This spanned the left STG, GM, and Brodmann area 22 (p = 0.016416313). For adult hearing loss, the ALE random effects analysis had a maximum ALE score ≤ 0.036899723, p = 1.3218109E-13. The ALE had n = 110 foci (n = 14 experiments) of at least 50 mm3 from n = 747 MRI datapoints. The main cluster of significance for adult hearing loss was 2224 mm3 from (42,−26,−8) to (60,−12,12) centered at (51.2,−19.3,2.8) with the extrema at (48,−20,4). This spanned the right STG, GM, and Brodmann area 13 (p = 0.031063354). For aged-adult hearing loss, the ALE random effects analysis had a maximum ALE score ≤ 0.015340902, p = 6.494829E-6. The ALE had n = 118 foci (n = 7 experiments) of at least 50 mm3 from n = 331 MRI datapoints. The main cluster of significance for aged-adult hearing loss was 1056 mm3 from (−50,−26,2) to (−36,−12,16) centered at (−44.2,−17.4,8.7) with the extrema at (−46,−14,6). This spanned the left insula, GM, and Brodmann area 13 (p = 0.014480419).
Fig. 3.

Anatomic likelihood estimate analysis - ALE random effects analysis. The ALE random effects analysis revealed highly significant clusters for congenital and adults, resulting from GM. A) Congenital was significant with left and right (BA13), and right (BA22) superior temporal gyrus GM clusters. B) The acquired ALE random effects analysis was not significant, albeit blobs were apparent. C) The GM ALE random effects analysis was significant for the left insula GM (BA13). D) The WM ALE random effects analysis was significant for several clusters under GM in the right superior temporal gyrus (BA22 and BA13) and several clusters under GM in the left superior temporal gyrus (BA22 and BA41). E) The pediatric ALE random effects analysis was significant for two clusters located in the left superior temporal gyrus GM (BA22). F) The adult ALE random effects analysis was significant for a cluster in the right and left superior temporal gyrus GM (BA13) in addition to a cluster in the transverse temporal gyrus GM (Heschl’s BA41). G) The aged-adult ALE random effects analysis was significant for two clusters in the left insula GM (BA13) and one cluster in the left sub-lobar claustrum GM.
3.2. mKDA
For congenital and acquired hearing loss, the mKDA contrast analysis found bilateral alterations in Heschl’s gyrus (Fig. 4). In congenital hearing loss, an alteration in Heschl’s gyrus was found bilaterally with two clusters passing p < 0.001 (in orange) and 6 passing p < 0.01 (in red). In acquired hearing loss, no significant clusters were found. The congenital hearing loss assessments yielded more cluster analyses due to more MNI coordinates reported for a larger number of studies. Similar to ALE, mKDA shows that congenital and acquired hearing loss have overlapping ROIs and separate clusters and blobs unique to their respective etiologies. No significant clusters were found for acquired GM. Acquired WM had 3 significant height thresholded clusters. No significant clusters were found for congenital GM, whereas congenital WM had 2 significant height thresholded clusters. In the pediatric group, one significant height thresholded cluster was found in left Heschl’s gyrus. In the adult group, 2 significant height thresholded clusters were found bilaterally in Heschl’s gyrus with 1 cluster passing p < 0.001 (in orange) and 4 clusters passing p < 0.01 (in red). In the aged-adult group, no significant clusters were found. See the mKDA tables in the Data in Brief for all clusters, as several additional clusters of interest were found.
Fig. 4.
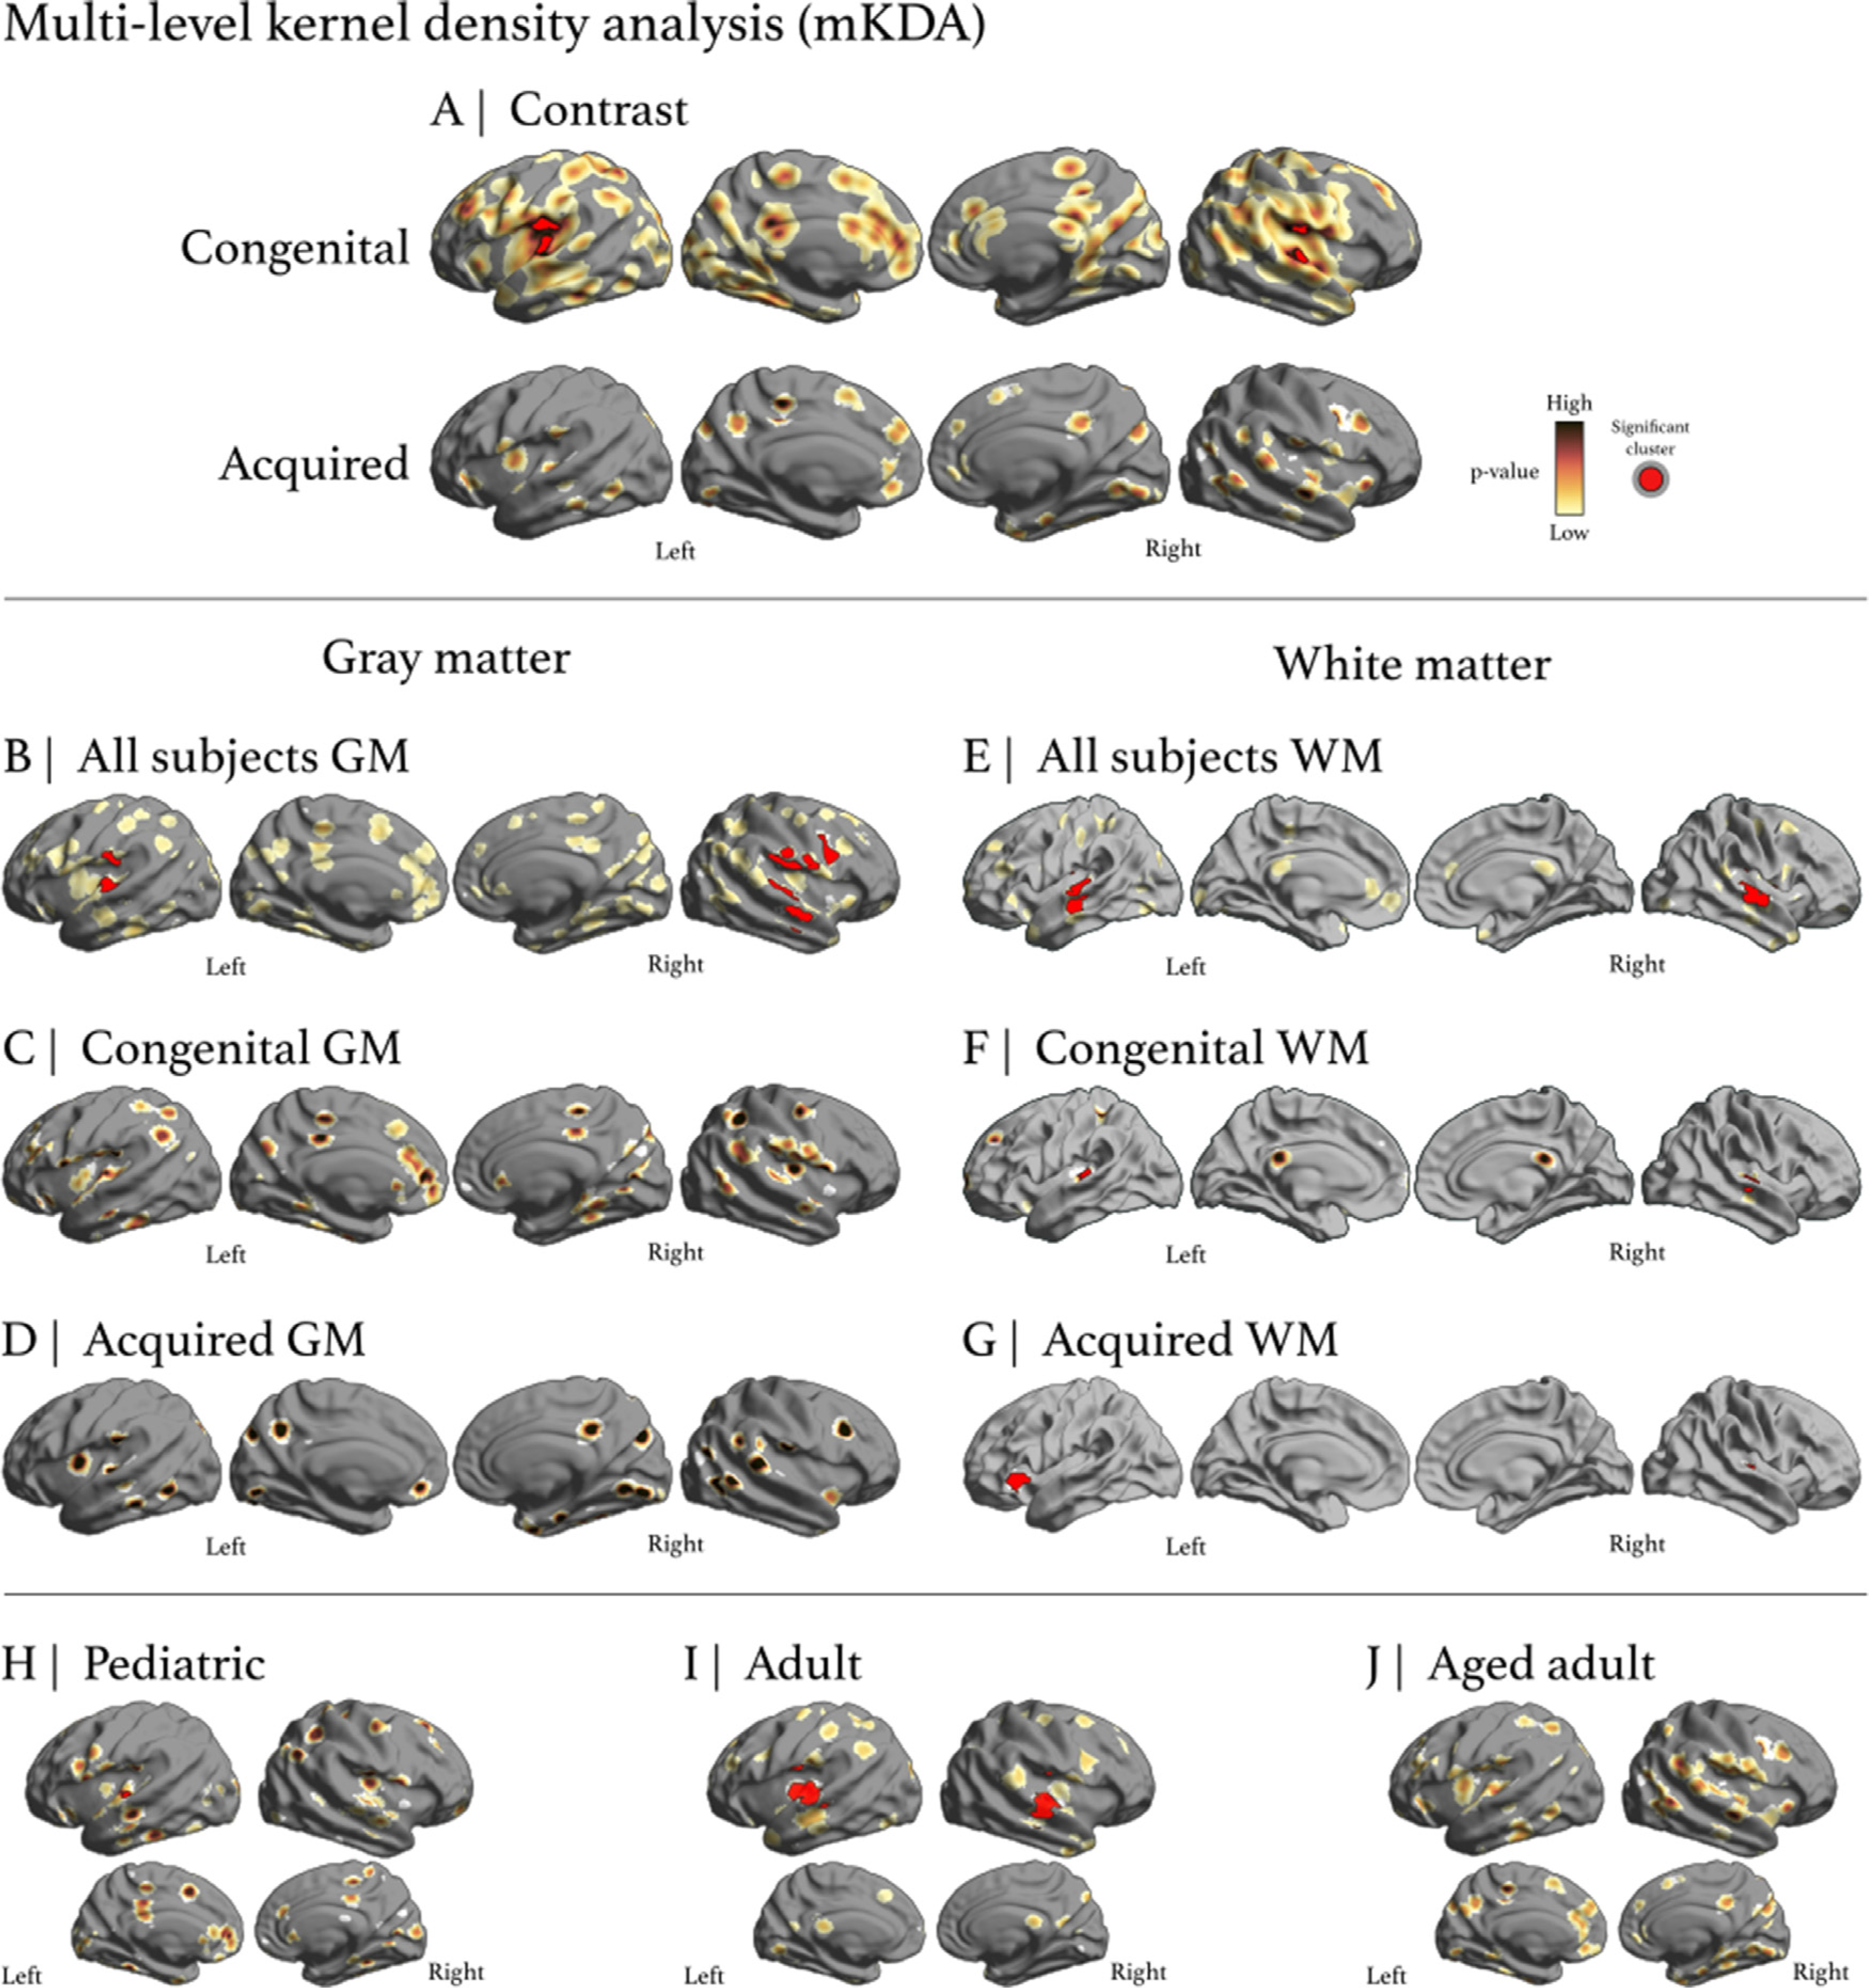
Multi-level kernel density analysis. A) mKDA results for congenital and acquired hearing loss. Circumscribing Heschl’s gyrus in congenital, two clusters passed p < 0.001 (in orange) and 6 passed p < 0.01 (in red), while no blobs formed clusters in acquired. B) and E) A composite endophenotype of GM and WM alterations, respectively. C) No significant clusters were found for congenital GM whereas F) congenital WM had 2 significant height thresholded clusters. D) No significant clusters were found for acquired GM and G) acquired WM had 3 significant height thresholded clusters. H) The pediatric group had one significant height thresholded cluster in left Heschl’s gyrus. I) The adult group had 2 significant height thresholded clusters in bilateral Heschl’s gyrus. J) The aged adult group did not have significant clusters.
3.3. SDM
For congenital and acquired hearing loss, the SDM contrast analysis found Heschl’s gyrus alterations bilaterally (Fig. 5). Over 80 regions were identified as being impacted in the congenital group analysis and 5 regions were identified as being impacted in the acquired group analysis. In congenital hearing loss, regions surrounding and including Heschl’s gyrus, such as Brodmann areas 21, 22, and 38, were found to be impacted. In acquired hearing loss, similar regions, such as Brodmann areas 37, 42, and 48, were found to be impacted. In confirming the mKDA results, both etiologies have both distinct clusters and overlapping clusters that were found to be significant. In the pediatric group, 9 clusters were found to exhibit an increase and 4 were found to exhibit a decrease. In the adult group, 2 clusters were found to exhibit an increase and 4 were found to exhibit a decrease. In the aged-adult group, 11 clusters were found to exhibit an increase and 4 clusters were found to exhibit a decrease. All of the SDM clusters found to be significant are reported in the Data in Brief.
Fig. 5.
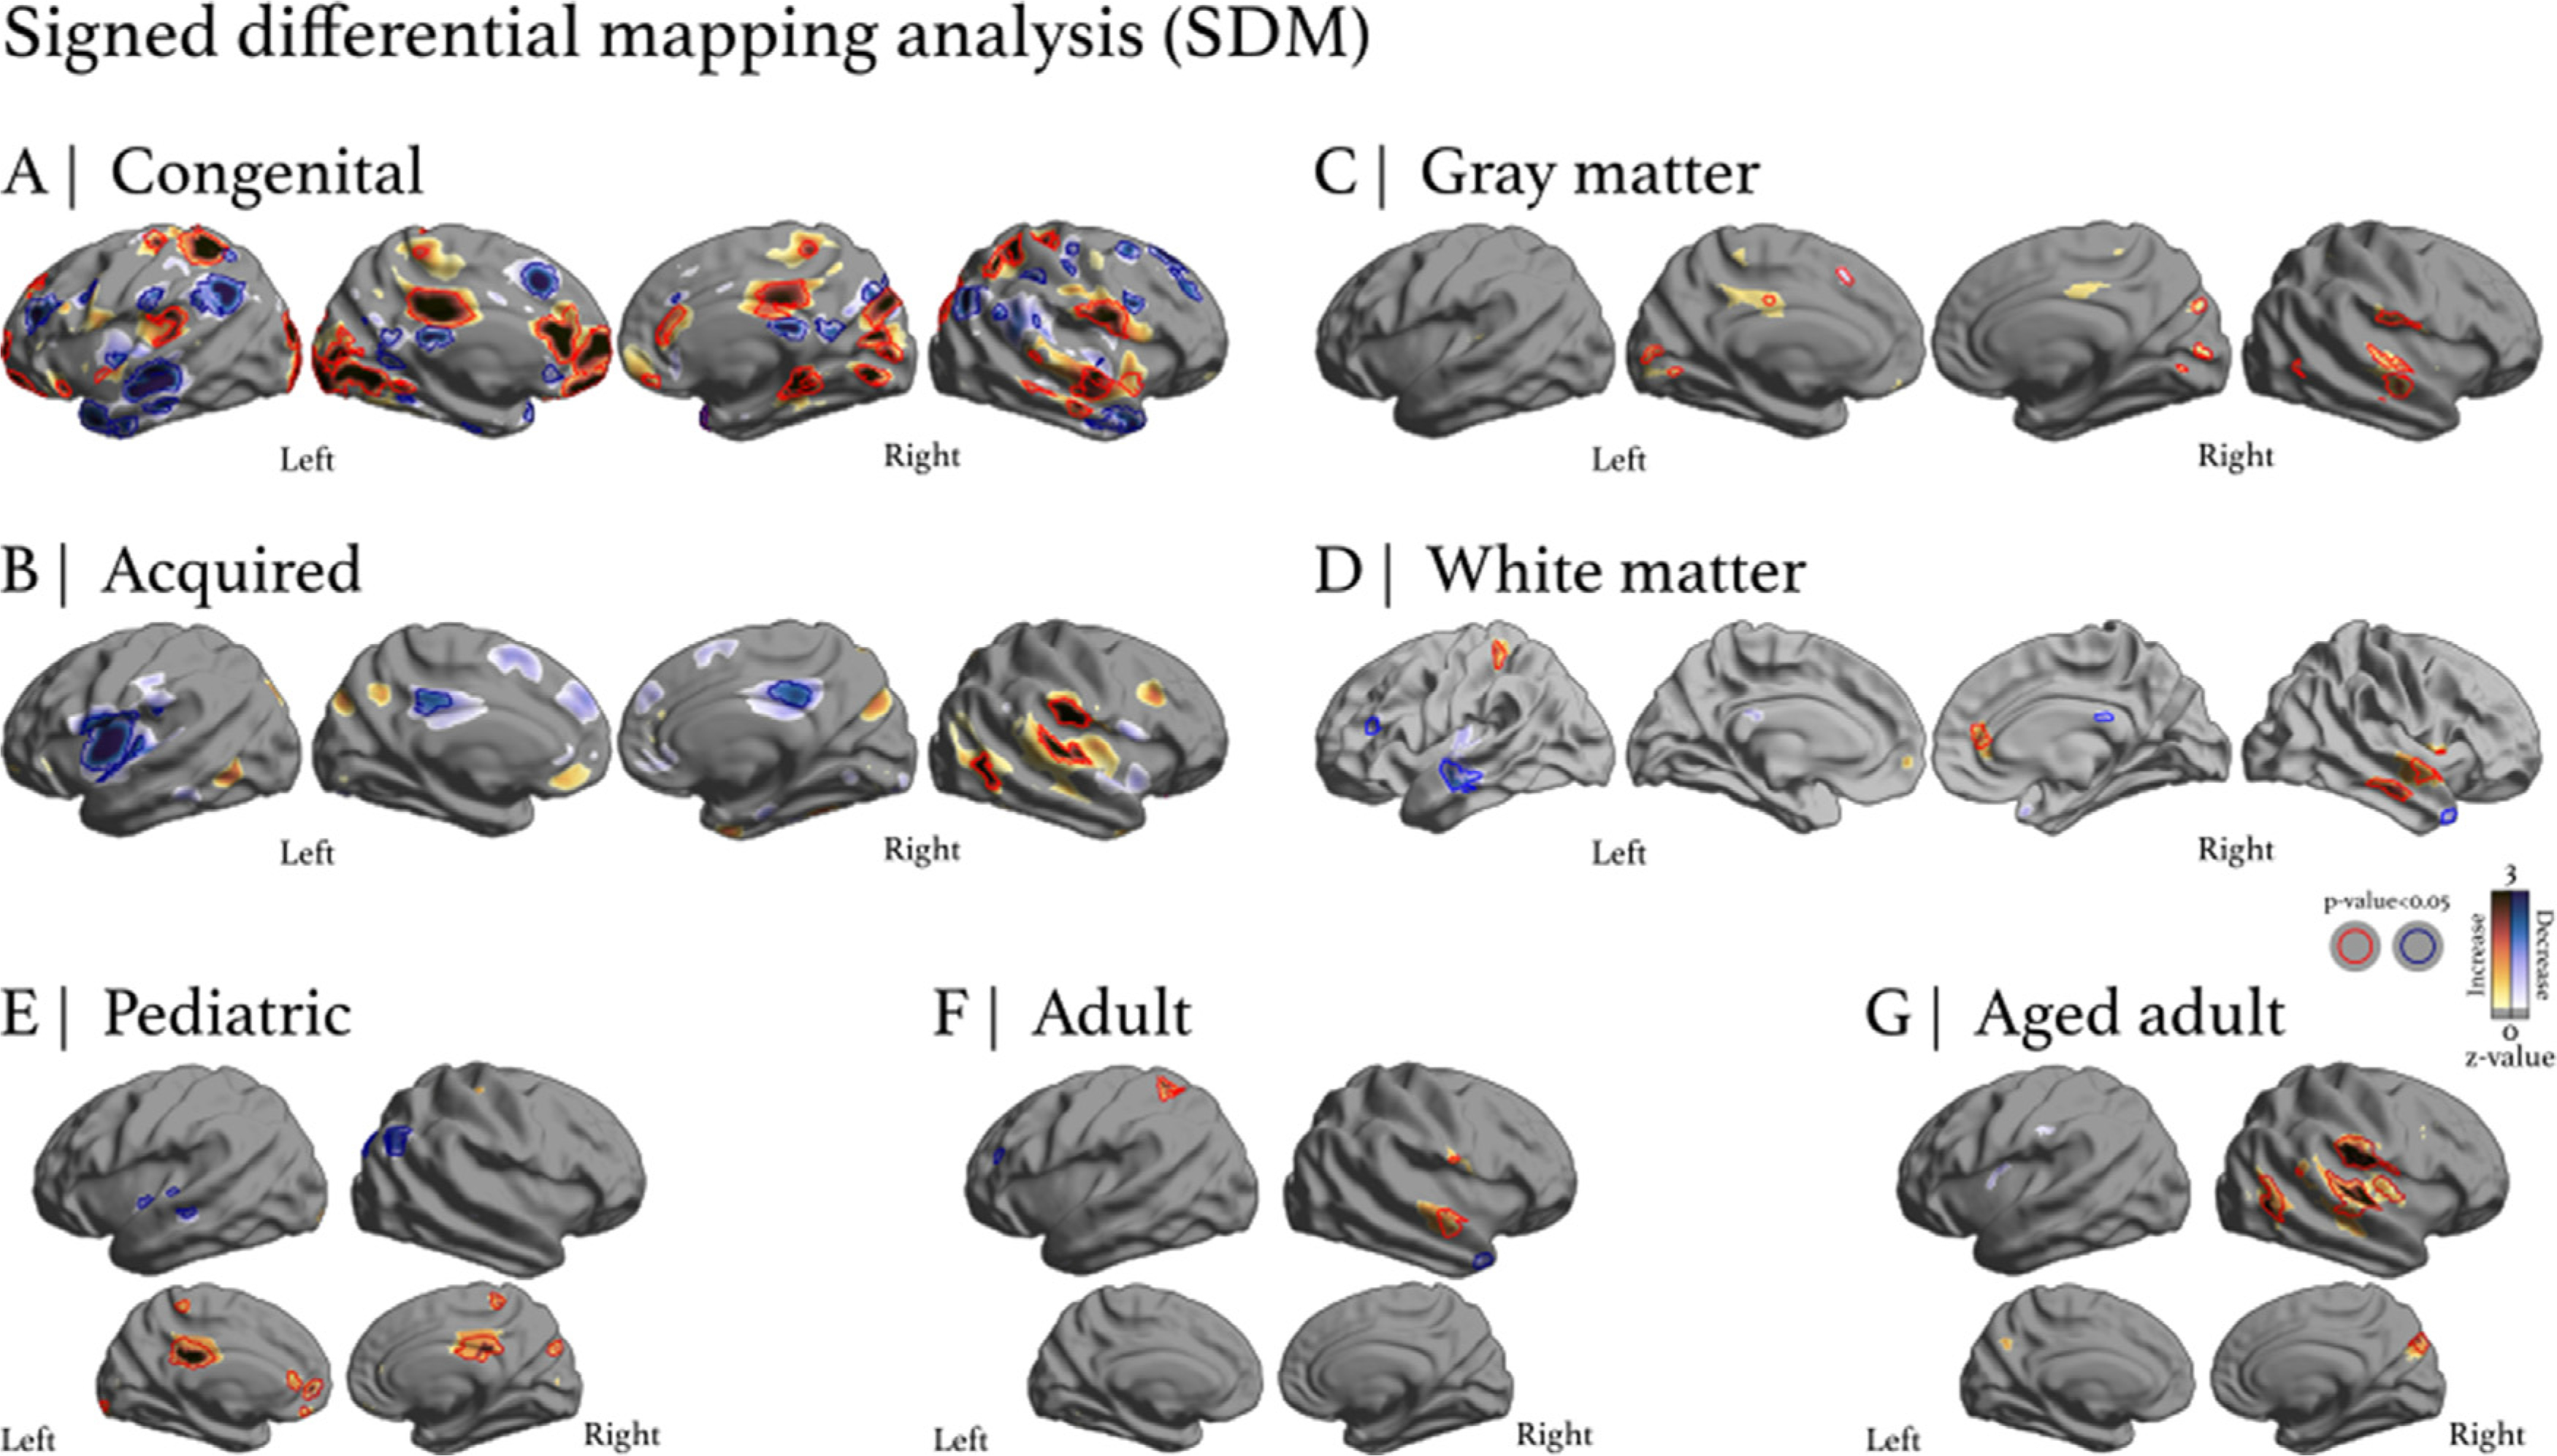
Signed differential mapping analysis. The colorbar yellow-red-black represents positive differences (a positive or increase change from control) while the colorbar teal-blue-black represents negative differences (a negative or decrease change from control). Regions circumscribed in red correspond to statistically significant (p < 0.05) increases and regions circumscribed in blue correspond to statistically significant (p < 0.05) decreases. A) Congenital hearing loss analysis found several regions (80 coordinates) with significant clusters, including auditory regions. B) Acquired hearing loss analysis found fewer regions were significant (5 coordinates in total) compared to the congenital analysis, and these differences were more localized around auditory regions. C) GM analysis found 9 coordinates exhibiting a significant change, most of them increases. D) WM analysis found 12 coordinates exhibiting a significant change, with 5 being increases and 7 being decreases. E) Pediatric group analysis found 13 coordinates exhibiting significant changes, most of them increases in GM. F) Adult group analysis found 6 coordinates exhibiting significant changes in GM. G) Aged adult analysis found 15 coordinates exhibiting significant changes, most of them increases in GM. All of the SDM clusters found to be significant are reported in the Data in Brief.
3.4. Structural effects throughout the lifespan
Significant regressions were observed for the left GM volume by age, and right WM fractional anisotropy (FA) by age (Fig. 6). For left GM volume by age, the correlation was r = −0.27 (t = −2.62, p = 0.0103), with a change in Hedges’ g by age of −0.0246 (t = −2.5795, p = 0.0116, se = 0.095). For right WM FA by age, the correlation was r = −0.55 (t = −4.04, p = 0.0002), with a change in Hedges’ g by age of −0.0138 (t = −3.9910, p = 0.0003 se = 0.0035). For the left GM volume and right WM FA regressions, a decrease by age of −0.0246 g and −0.0138 g per year was found, respectively. The other regressions had more heterogeneity in the dataset and datapoints were dispersed.
Fig. 6.

Meta-regression of structural changes by age for GM and WM of the left or right hemisphere. The significant regressions were left GM volume by age and right WM FA by age. For left GM volume by age, the correlation was r = −0.27 (t = −2.62, p = 0.0103), with a change in Hedges’ g by age of −0.0246 (t = −2.5795, p = 0.0116, se = 0.095). For right WM FA by age, the correlation was r = −0.55 (t = −4.04, p = 0.0002), with a change in Hedges’ g by age of −0.0138 (t = −3.9910, p = 0.0003). For the left GM volume regression and right WM FA regression, a decrease by age of −0.0246 g and −0.0138 g per year was found, respectively. The other regressions had more heterogeneity in the dataset and datapoints were dispersed.
3.5. Heterogeneity of hearing loss – dispersion and diversity
Forest plots of hearing loss demonstrate considerable heterogeneity in the studies. The GM volume for congenital hearing loss had a Hedges’ g of −0.26 (RE model was highly significant: Q113 = 1340.91, p = 0.00, I2 = 93.0%), indicating a decrease in global brain GM (Fig. 7). However, the dataset was considerably dispersed with the right hemisphere more negatively impacted (Hedges’ g of −0.60, RE model Q44 = 462.78, p = 0.00, I2 = 92.7%) than the left hemisphere (Hedges’ g of −0.04, RE model Q68 = 841.43, p = 0.00, I2 = 92.8%). The GM volume for acquired hearing loss had a Hedges’ g of −0.73 (RE model was highly significant: Q55 = 635.10, p = 0.00, I2 = 98.8%), indicating a decrease in global brain GM (Fig. 8). However, the dataset was considerably dispersed with the right hemisphere less negatively impacted (Hedges’ g of −0.55, RE model Q31 = 387.62, p = 0.00, I2 = 98.4%) than the left hemisphere (Hedges’ g of −0.98, RE model Q23 = 244.83, p = 0.00, I2 = 98.5%). The WM volume for congenital hearing loss had a Hedges’ g of −0.59 (RE model was highly significant: Q62 = 728.29, p = 0.00, I2 = 91.4%), indicating a decrease in global brain WM (Fig. 9). However, the dataset was considerably dispersed with the right hemisphere more negatively impacted (Hedges’ g of −0.65, RE model Q26 = 246.51, p = 0.00, I2 = 89.6%) than the left hemisphere (Hedges’ g of −0.55, RE model Q35 = 479.82, p = 0.00, I2 = 92.6%). The WM FA for congenital hearing loss had a Hedges’ g of −0.75 (RE model was highly significant: Q43 = 69.00, p = 0.01, I2 = 39.0%), indicating a decrease in global brain WM (Fig. 10). However, the dataset was considerably dispersed with the right hemisphere more negatively impacted (Hedges’ g of −0.86, RE model Q28 = 15.12, p = 0.98, I2 = 0.0%) than the left hemisphere (Hedges’ g of −0.54, RE model Q14 = 50.14, p = 0.00, I2 = 73.9%). The general trend for the forest plots of heterogeneity was GM and WM for both the left and right hemispheres were negatively affected by hearing loss; however, considerable datapoint dispersion and variability exists.
Fig. 7.

Forest plot of Congenital GM volume effect by ROI for left or right hemisphere. Right and Left refer to the brain hemispheres. Region of interest (ROI). Confidence interval (CI). Refer to Methods for explanation of other parameters. Overall, there was a decrease in global brain GM, but the dataset was considerably dispersed with the right hemisphere more negatively impacted than the left hemisphere.
Fig. 8.

Forest plot of Acquired GM volume effect by ROI for left or right hemisphere. Overall, there was a decrease in global brain GM, but the dataset was considerably dispersed with the right hemisphere less negatively impacted than the left hemisphere.
Figure 9.

Forest plot of Congenital WM volume effect by ROI for left or right hemisphere. Overall, there was a decrease in global brain WM, but, the dataset was considerably dispersed with the right hemisphere more negatively impacted than the left hemisphere.
Fig. 10.

Forest plot of Congenital WM FA effect by ROI for left or right hemisphere. Overall, there was a decrease in global brain WM, but, the dataset was considerably dispersed with the right hemisphere more negatively impacted than the left hemisphere.
3.6. Endophenotype of hearing loss – altered GM/WM asymmetry patterns
The endophenotype of hearing loss is diverse, dispersed and largely determined by GM alterations (Fig. 11). The frontal lobe GM volume decreased severely in congenital and acquired hearing loss. The model test of moderators was significant for GM volume for congenital hearing loss (QM16 = 48.63, p < 0.0001) with significant residual heterogeneity (QE98 = 1048.28, p < 0.0001) (Fig. 11A). In congenital hearing loss, the right frontal lobe and right parietal GM volume were significantly decreased (−2.56 and −1.11, respectively), while that in the temporal lobe was affected to a lesser extent (−0.54), despite the latter being the most reported ROI. Both cerebellar lobes showed a significant increase in volume (left = 0.90, right = 1.68). The model test of moderators was significant for GM volume for acquired hearing loss (QM15 = 29.35, p < 0.05) with significant residual heterogeneity (QE41 = 412.31, p < 0.0001) (Fig. 11B). In acquired hearing loss, the left frontal GM volume was significantly decreased (−1.14), along with the right frontal lobe (−1.44). The model test of moderators was significant for congenital hearing loss with WM volume (QM13 = 50.92, p < 0.0001) with significant residual heterogeneity (QE50 = 462.69, p < 0.0001) (Fig. 11C). Left and right frontal lobes WM (−1.34 and −2.3, respectively), and the left and right temporal lobes WM (−0.47 and −0.55, respectively) were significantly different. The model test of moderators was significant for congenital hearing loss with WM FA (QM11 = 168.31, p < 0.0001) with non-significant residual heterogeneity (QE50 = 40.58, p < 0.17) (Fig. 11D). For WM FA in congenital hearing loss, the right and left temporal lobe were significantly decreased (−0.69 and −0.83, respectively). Funnel and Bajut plots illustrate outliers and dispersion in the dataset, which was considerable across the variables for GM and WM. The endophenotype of hearing loss at every stage of life affects cortical GM/WM trajectories, is heterogeneous, and changes GM/WM patterns compared to control populations.
Fig. 11.

Meta-regression estimate of the endophenotype of congenital and acquired hearing loss. Here we constructed an effect size based map from our model estimators. A) Congenital GM volume was significantly decreased QM16 = 48.63, p < 0.0001 with significant residual heterogeneity QE98 = 1048.28, p < 0.0001. The largest ROI examined was the temporal lobe. B) Acquired GM was significantly decreased in GM volume QM15 = 29.35, p < 0.05 with significant residual heterogeneity QE41 = 412.31, p < 0.0001. C) Congenital WM volume was significantly decreased QM13 = 50.92, p < 0.0001 with significant residual heterogeneity QE50 = 462.69, p < 0.0001. D) Congenital WM FA was significantly decreased QM11 = 168.31, p < 0.0001 with non-significant residual heterogeneity QE50 = 40.58, p < 0.17, indicating more homogeneity. Funnel and Bajut plots illustrate outliers and dispersion in the dataset, which was considerable across the variables for GM and WM, and the barplot indicates ROI contributions. The endophenotype of hearing loss at every stage affects cortical asymmetries, is heterogeneous, and changes GM/WM patterns compared to control populations.
4. Discussion
The purpose of the study was to discern the resultant endophenotype of hearing loss across the lifespan. To do so, we conducted a meta-analysis and meta-regression of the lifespan effects of hearing loss. We found that the endophenotype of hearing loss is heterogeneous, determined by GM alterations, and results in widespread impact to the brain of pediatric, adult and aged-adult populations, regardless of whether the etiology is congenital or acquired (Fig. 11). The analysis revealed four interesting general features of hearing loss which will be discussed in more detail below. 1) Hearing loss impact on the brain is multi-focal and not limited to the temporal lobe (in fact, it affects the frontal lobe more). 2) Hearing loss severely affects all populations (pediatric, adult and aged-adult); however, GM in the congenital hearing loss population is most affected. 3) heterogeneity in hearing loss contributes most to some metrics; for example, canceling out attributions (increases and decreases) in the presumed effect of GM in the temporal lobe. 4) The endophenotype is unique; resembling a diffuse brain disorder, impacting structures differently depending on auditory input and compensatory mechanisms.
4.1. Pediatric
There is a large focus on the pediatric population as they are most at risk to the consequences of hearing loss. Recently, several very well conducted studies have assessed profound bilateral sensorineural hearing loss (SNHL) in pediatric cohorts. Smith et al. (2011) used morphometry (1 yrs ± 2.6 yrs, mean ± SD) and found hearing loss resulted in increased GM and decreased WM in the anterior Heschl’s gyrus. This contradicts the GM results found here (Figs. 3, 4, and 5e and Data in Brief Table 24), which showed a non-significant GM decrease for congenital hearing loss corrected for age. Interestingly, children with hearing loss did not exhibit the typical left greater than right volumetric asymmetry found in those with normal hearing (Smith et al., 2011). Left-right asymmetry in normal hearing children was 11.91% while that in children with hearing loss was 8.33%, i.e. a significant reduction of approximately 3.58% (Smith et al., 2011). A conclusion was that the hemispheres were less asymmetric in pediatric profound SNHL.
In the present analysis the GM volume of the right hemisphere was more affected than the left hemisphere (Data in Brief: Congenital Gray Matter Volume), as well as the WM volume (Data in Brief: Congenital White Matter Volume). Zheng et al. (2017), using DTI in pediatric bilateral profound SNHL (age 4.7 ± 1.0 years, mean ± SD), found widespread changes to auditory tracts (auditory radiation), auditory nuclei (superior olivary nucleus), and WM underlying Heschl’s gyrus and frontal gyri. Feng et al. (2018) assessed children with bilateral moderate, severe or profound SNHL (1.49 ± 0.65 years, mean ± SD, range 0.66 to 3.17 years). They found that determining the type of neural reorganization before cochlear implantation was valuable for predicting language outcomes. The benefit for predictive, deep learning algorithms to be trained with MRI and DTI data for clinical outcomes in hearing loss would be extremely valuable (Ratnanather, 2020). Here we have created the prototypical endophenotype of hearing loss which could be used to mask ROI for these machine learning methods (See Data in Brief: for nii files). For Smith et al. (2011) and Feng et al. (2018) deemed the most important pediatric studies to-date, clusters of morphometric differences were widespread and dispersive in nature (Figs. 3, 4, 5e and 7 and 9). One series of studies has been published by the same group (Li et al., 2012, Li et al., 2015, Li et al., 2013, Liu et al., 2010, Miao et al., 2013, Wenjing et al., 2010) using a cohort with congenital bilateral profound SNHL (mean age ≈ 15 yrs). These studies assessed cortical thickness (Li et al., 2012), voxel-based morphometry (Li et al., 2015, Li et al., 2013, Wenjing et al., 2010) and WM properties. (Liu et al., 2010, Miao et al., 2013) Here, decreases in cortical thickness in the right postcentral gyrus and left middle frontal gyrus were observed (Li et al., 2012). GM morphometry analyses revealed modest alterations in the temporal gyri (Li et al., 2015), asymmetrical increases in the middle and superior frontal gyri (Li et al., 2013) and interestingly, bilateral increases in cerebral hemispheres (Wenjing et al., 2010). Using DTI (Liu et al., 2010, Miao et al., 2013), changes in fractional anisotropy of WM fibers projecting to bilateral Heschl’s gyri and superior temporal gyri were found. Subsequent studies, Xia et al. (2008) (albeit duplicated publication (Xia and Qi, 2008)), used morphometry to assess adolescents with profound congenital bilateral SNHL (range 9–12 yrs). These studies (Wenjing et al., 2010, Xia et al., 2008, Xia and Qi, 2008, Li et al., 2012, Li et al., 2015, Li et al., 2013, Liu et al., 2010, Miao et al., 2013) are pseudo-replicated (meaning multiple reports use the same cohort and thus the findings are not independent) (Manno et al., 2018). Tae (2015) investigated adolescents with congenital bilateral hearing loss (≈ 15.6 yrs) using GM morphometry and found decreases in the anterior left Heschl’s gyrus, bilateral inferior colliculus, bilateral lingual gyrus, bilateral nucleus accumbens and the left thalamic reticular nucleus. Chang et al. (2004) used DTI in children (mean age = 5.9 years) with profound bilateral SNHL prior to cochlear implantation to correlate brain structural measures with post-implantation auditory performance. Strong correlations were found between performance and fractional anisotropy of the medical geniculate nucleus, Broca’s, genu of the corpus callosum and auditory tract in children with good outcomes. Huang et al. (2015), investigated congenital bilateral SNHL (mean age = 4.7 yrs) using DTI and found bilateral decreases in fractional anisotropy in the trapezoid body, superior olivary nucleus, inferior colliculus, medial geniculate body, auditory radiation and WM of Heschl’s gyrus, in addition to medial diffusivity increases in these regions. There are several concerns with these studies due to poor reporting practices or experimental design. For example, Huang et al. (2015) failed to differentiate between the left and right hemispheres; some studies failed to find differences in connectivity (adolescents with congenital bilateral hearing loss, mean age = 9.36 years) (Shi et al., 2016); others failed to report exact ages (DTI in adolescents with bilateral cochlear nerve deficiencies) (Chinnadurai et al., 2016) or failed to list ages for the control group (DTI in children with congenital bilateral hearing loss, mean age = 4.9 years) (Wu et al., 2016), which complicates comparison and assessment in a meta-analysis.
4.2. Adult
Adults with congenital hearing loss were the first to be studied (Emmorey et al., 2003, Penhune et al., 2003, Shibata, 2007). However, there is considerable debate as to how these studies are confounded by sign language (Meyer et al., 2007, Leporé et al., 2010, Allen et al., 2008, Allen et al., 2013, Olulade et al., 2014, Kim et al., 2017). In addition, the studies have not unequivocally demonstrated structural alterations due to bilateral SNHL. For example, Emmorey et al. (2003) (severe SNHL n = 25, 23.8 ± 4.1 years, mean ± SD) and Penhune et al. (2003) (profound SNHL n = 12, 29 years) have low to non-significant effect sizes with an average Cohen’s d increase effect size of 0.1949 ± 0.4810 (low increase) and 0.0442 ± 0.9151 (insignificant), respectively for all ROIs assessed. While these studies had relatively small sample sizes, a third study (Shibata, 2007) also found insignificant effect sizes (average Cohen’s d effect size −0.0111 ± 2.8336). Penhune et al. (2003) concluded “preservation” while Emmorey et al. (2003) found a higher bilateral GM/WM ratio in STG and a reduction in WM volume in HG (purportedly due to auditory deafferentation resulting in less myelination) in hearing loss individuals compared to controls. Emmorey et al. (2003) also found an abolished leftward asymmetry for GM in STG (with concomitant increased GM volume in right STG), but a preserved leftward GM asymmetry in HG and the PT. Despite the body of literature containing contradictory results, when you examine the meta-analysis you find an increased effect size in the adult population in areas circumscribing the temporal lobe (Figs. 3f, 4i, 5f, Data in Brief Table.13).
A theory driving the background of the aforementioned studies of adults with congenital hearing loss was that asymmetry would, or should be, ‘off balance’ due to the left hemisphere lateralization for language (i.e. hemispheric specialization) (Geschwind and Levitsky, 1968, Geschwind, 1970). The theory is that if auditory deprivation is congenital (i.e., established in utero) (Geschwind and Galaburda, 1985a, 1985b, 1985c), then the hemispheres might develop “unbalanced” due to the lack of sensory input driving language specializations in the left hemisphere. Geschwind and Galaburda (1985a, 1985b, 1985c) argued hemispheric cerebral dominance leading to asymmetrical structures, such as the left planum temporale and sylvian fissure, are determined genetically, established in utero and are relatively restricted to humans. Interestingly, that is what we see in the meta-analysis (Fig. 5f), but opposite from the anticipated direction, a significant increase in right temporal lobe GM in hearing loss (Data in Brief, Table.13). Further, cerebral torque (Yakovlevian torque - the right frontal lobe extending across the midline, over the left, and the left occipital lobe protruding over the right in an anticlockwise twisting) is also seen as a uniquely human trait which is possibly driven by language and could be altered due to hearing loss (Kral et al., 2000, Crow, 2008, Crow, 2013, Van Essen, 1997). To elaborate further, the tension-based morphogenesis theory indicates that due to populations of axons pulling together, tension pulls strongly interconnected regions forming an outward fold along their common border. As a result, the crown of a gyrus and weakly interconnected regions drift apart, resulting in an inward fold, the fundus of a sulcus (Kral et al., 2000, Crow, 2008, Crow, 2013, Van Essen, 1997). Along outward folds, deep layers are stretched radially and become thicker. Along inward folds, layers are stretched tangentially and compressed radially, becoming thinner (Kral et al., 2000, Crow, 2008, Crow, 2013, Van Essen, 1997). The foundation of this theory could be due to synaptic activity patterns in deep layers (Kral et al., 2000). Further, this line of thought can explain WM auditory pathway/tract asymmetry (Figs. 3f, 4i, 5f, 9 and 10). For example, Amaral et. al., (Amaral et al., 2016) found rightward and leftward anisotropic WM attributions of both increases and decreases, irrespective of side, with a modest effect size (an average Cohen’s d increase effect size of 0.2616 ± 1.318, low increase). Furthermore, Karns et al. (2017) found a significantly decreased leftward HG asymmetry leading to a Cohen’s d increase effect size of 0.7332. Some recent studies focused on the planum temporale specifically and found increased GM and WM in both the left and right hemisphere (Shiell and Zatorre, 2017, Shiell et al., 2016). In congenital hearing loss, the asymmetry contributing processes should be weaker or reduced due to the lack of sensory input, whereas persons with acquired hearing loss may be able to compensate more. Our meta-analysis, when comparing left versus right effect sizes for a specific ROI, found relatively week asymmetry changes compared to the control group, possibly due to the fact that left and right hearing loss groups were analyzed together. Furthermore, this could be a byproduct of assessing ROIs from studies which effectively cancel out contributions of increases and decreases. For future studies, we suggest sharing the full brain statistical maps either defined by ROI or voxel-based from neuroimaging, not only for replication purposes, but also for more sensitive and specific future meta-analyses.
4.3. Aged-adult
Postlingual, or late onset, hearing loss is often a comorbidity with tinnitus (Boyen et al., 2013, Luan et al., 2019, Husain et al., 2011). General presbycusis (Peelle et al., 2011, Lin et al., 2014, Rigters et al., 2017, Rigters et al., 2018) - acquired hearing loss due to aging - is often comorbid with dementia (Cunningham and Tucci, 2017, Reed et al., 2019, Lin, 2013) and confounded by hearing aid use (Pereira-Jorge et al., 2018). Half the people in their 7th decade or older have hearing loss, which affects communication (Olkin et al., 2012). Additionally, hearing loss is associated with accelerated cognitive decline (Lin, 2013) and increased medical care costs (Reed et al., 2019). The morphometry results for aged-adults are considerably more homogeneous than the pediatric and adult populations. For example, the right temporal lobe is significantly increased in GM compared to control individuals, possibly revealing a compensatory mechanism (Fig. 5g). Peelle et al. (2011) conducted the first presbycusis study of hearing loss and found the GM volume decrease in the right primary auditory cortex was significantly associated with a participant’s hearing ability as assessed with pure tone average thresholds (n = 25, 66.3 ± 5.5 years, mean ± SD). This focal finding was augmented by the whole-brain assessment of Lin et al. (2014), who found accelerated volumetric declines in the whole brain and in ROIs of the right temporal lobe (superior, middle, and inferior temporal gyri). The rate of decline was 8.4 cm3/year vs. 7.2 cm3/year, in hearing loss versus normal hearing, respectively. The largest study to-date in the entire field of hearing loss was conducted in the aged-adult population of the Rotterdam Study with 2,562 participants (69.3 ± 9.6 years, mean ± SD). Here, WM microstructure in the association tracts, such as the right superior longitudinal fasciculus and the right uncinate fasciculus, were significantly associated with poorer hearing acuity as assessed by pure-tone thresholds (Rigters et al., 2017, Rigters et al., 2018). Interestingly, aging was not a significant covariate for volumetric differences between the eldest age groups (middle-aged, 51–69 years old and older, 70–100 years old). Note that the adult and aged-adult groups with acquired hearing loss are the least studied; therefore, it is imperative to expand research on these groups in the future.
4.4. Limitations and recommendations for future work
One major recommendation for future work is investigators need to report mean and SD for control and hearing loss groups for GM or WM metrics in MNI coordinates for the populations under investigation (Nichols et al., 2017). Without this information, their research contributions are potentially uninformative for meta-analysis as they are difficult (or at times impossible) to compare with other studies. We noted 7 studies did not follow this recommendation and we implore that future studies apply best practice research methods (Data in Brief Table 5) (Nichols et al., 2017). If hearing loss groups are not completely homogeneous, mean and SD by GM or WM metrics for MNI coordinates need to be reported separately for subgroups. Within-group heterogeneity of a study likely contributed to a large portion of the variability found in this study. If future studies measure the heterogeneity of hearing loss, they need to categorize the measures to delineate the subgroup within the main group compared to control. This method allows the greatest determination of effect size differences among groups. Based on COBIDAS recommendations, individual participant mean and SD by GM or WM metrics for MNI coordinates should be reported as a best-case scenario (Nichols et al., 2017). We note that this was done the least often, but offers the most precise measure for meta-analytical comparability. All original scans should be made available and uploaded to a Hearing Loss Database, or similar open access neuroimaging repositories, for future analysis. Currently, no scans of hearing loss patients are openly available. Exacerbating the lack of open data is the absence of test retest reliability in hearing loss (Zuo et al., 2017). Here you could ask: are the structural alterations observed in hearing loss stable reproducible measures? This is very important for determining longitudinal effects observed in our lifespan assessment: whether the projected trajectory matches the true trajectory across the lifespan is unknown, as there have been no longitudinal studies to-date. Further, as some studies measured things traditionally not done in the MRI neuroimaging field (WM thickness - mostly corpus callosum, and cortical fractional anisotropy), we recommend an open database and researchers should provide their scans for re-analysis, as these measures are difficult to interpret. The present meta-analysis included neuroimaging studies that spanned a range of different ages, ethnic groups, socioeconomic factors such as education, and comorbidities. Recent work has indicated that age and ethnicity affect template-based image analysis (Dong et al., 2020, Yang et al., 2020). In this regard, we support the development of brain templates that account for confounding variables, as this could help determine heterogeneity in WM and GM metrics. This review has followed the recommendation by providing all original data for future reassessments (Nichols et al., 2017). The incongruity in previous studies, dataset duplications, and missing essential variables for comparison, complicate a direct assessment of structural changes in the brain due to hearing loss. Ultimately when designing a study, it is essential to report variables that allow direct comparison between studies such as mean and standard deviation for the measure of interest (i.e. unit of analysis) for both control and experimental groups (i.e. in addition to effect sizes).
5. Conclusions
Hearing loss is a heterogeneous disorder (Morton and Nance, 2006), which presents dynamic structural adaptions and compensations across the lifespan that result in great variability. This study was a systematic review, meta-analysis and meta-regression of hearing loss aimed at constructing a structural endophenotypic map of the gray matter and white matter alterations throughout the human lifespan. Historically, the temporal lobe auditory regions were commonly thought to be most affected in hearing loss, although the present analysis found widespread abnormalities in the frontal lobe GM and underlying WM to the cerebellum, mostly decreased in both congenital and acquired hearing loss. This is likely due to the primary role of the inferior fronto-occipital fasciculus in language processing (Simon et al., 2020). We found widespread and dispersed heterogeneity among studies, likely caused by non-uniform study parameters. Future research should include the endophenotype template to discern impact and clinical outcomes in hearing loss.
Supplementary Material
Acknowledgments
FAMM would like to thank the University Grants Committee (UGC) of Hong Kong, Research Grants Council for the HKPFS award PF16-07754. RRC was supported by a grant from the Québec research funds - Health/Fonds de la recherche du Québec - Santé (FRQ-S 291486). RK was supported by a grant from the National Institutes of Health Medical Scientist Training Program (T32 GM07170). CL was supported by a grant from the UGC Early Career Scheme 21201217. JTR was supported by grants from the National Institutes of Health (P41 EB015909 and R01 DC016784). All authors would like to express their gratitude to Drs. SHC Manno, A Faria, and C Ceritoglu, for their help and insightful comments at various stages of the project.
Footnotes
Declaration of Competing Interest
The authors declare no competing financial interests and no non-financial competing interests.
Supplementary materials
Supplementary material associated with this article can be found, in the online version, at doi:10.1016/j.neuroimage.2021.117826.
Data availability statement
The entire dataset, analyses and code used in this work can be downloaded by contacting the corresponding author and from the Open Science Framework: Manno, et al., 2018. “Profound Hearing Loss.” OSF. https://osf.io/7y59j/.
References
- Allen JS, Emmorey K, Bruss J, Damasio H, 2008. Morphology of the insula in relation to hearing status and sign language experience. J. Neurosci 28 (46), 11900–11905. doi: 10.1523/jneurosci.3141-08.2008. [DOI] [PMC free article] [PubMed] [Google Scholar]
- Allen JS, Emmorey K, Bruss J, Damasio H, 2013. Neuroanatomical differences in visual, motor, and language cortices between congenitally deaf signers, hearing signers, and hearing non-signers. Front.. Neuroanat. 7, 26. doi: 10.3389/fnana.2013.00026. [DOI] [PMC free article] [PubMed] [Google Scholar]
- Amaral L, Ganho-Ávila A, Osório A, Soares MJ, He D, Chen Q, Mahon BZ, Gonçalves OF, Sampaio A, Fang F, Bi Y, Almeida J, 2016. Hemispheric asymmetries in subcortical visual and auditory relay structures in congenital deafness. Eur. J. Neurosci 44 (6), 2334–2339. doi: 10.1111/ejn.13340. [DOI] [PubMed] [Google Scholar]
- Boyen K, Langers DR, de Kleine E, van Dijk P, 2013. Gray matter in the brain: differences associated with tinnitus and hearing loss. Hear Res. 295, 67–78. doi: 10.1016/j.heares.2012.02.010. [DOI] [PubMed] [Google Scholar]
- Chang Y, Lee SH, Lee YJ, Hwang MJ, Bae SJ, Kim MN, Lee J, Woo S, Lee H, Kang DS., 2004. Auditory neural pathway evaluation on sensorineural hearing loss using diffusion tensor imaging. Neuroreport 15 (11), 1699–1703. doi: 10.1097/01.wnr.0000134584.10207.1a. [DOI] [PubMed] [Google Scholar]
- Chinnadurai V, Sreedhar CM, Khushu S, 2016. Assessment of cochlear nerve deficiency and its effect on normal maturation of auditory tract by diffusion kurtosis imaging and diffusion tensor imaging: a correlational approach. Magn Reson Imaging 34 (9), 1305–1313. doi: 10.1016/j.mri.2016.07.010. [DOI] [PubMed] [Google Scholar]
- Crow TJ., 2008. The ‘big bang’ theory of the origin of psychosis and the faculty of language. Schizophr Res. 102 (1–3), 31–52. doi: 10.1016/j.schres.2008.03.010. [DOI] [PubMed] [Google Scholar]
- Crow TJ., 2013. The XY gene hypothesis of psychosis: origins and current status. Am. J. Med. Genet. B Neuropsychiatr Genet 162B (8), 800–824. doi: 10.1002/ajmg.b.32202. [DOI] [PMC free article] [PubMed] [Google Scholar]
- Cunningham LL, Tucci DL., 2017. Hearing loss in adults. N. Engl. J. Med. 377 (25), 2465–2473. [DOI] [PMC free article] [PubMed] [Google Scholar]
- Dong HM, Castellanos FX, Yang N, Zhang Z, Zhou Q, Ye He, Lei Zhang, Xug T, Holmes AJ, Yeo BTT, Chen F, Wang B, Beckmann C, White T, Sporns O, Qiuo J, Feng T, Chen A, Liu X, Chen X, Weng X, Milham MP, Zuo XN., 2020. Charting brain growth in tandem with brain templates at school age. Sci. Bull 65 (22), 1924–1934. doi: 10.1016/j.scib.2020.07.027. [DOI] [PubMed] [Google Scholar]
- Emmorey K, Allen JS, Bruss J, Schenker N, Damasio H, 2003. A morphometric analysis of auditory brain regions in congenitally deaf adults. Proc. Natl. Acad Sci USA 100 (17), 10049–10054. doi: 10.1073/pnas.1730169100. [DOI] [PMC free article] [PubMed] [Google Scholar]
- Feng G, Ingvalson EM, Grieco-Calub TM, Roberts MY, Ryan ME, Birmingham P, Burrowes D, Young NM, Wong PCM., 2018. Neural preservation underlies speech improvement from auditory deprivation in young cochlear implant recipients. Proc Natl Acad Sci USA 115 (5), E1022–E1031. [DOI] [PMC free article] [PubMed] [Google Scholar]
- Ferguson MA, Kitterick PT, Chong LY, Edmondson-Jones M, Barker F, Hoare DJ., 2017. Hearing aids for mild to moderate hearing loss in adults. Cochrane Database Syst Rev 9, CD012023. [DOI] [PMC free article] [PubMed] [Google Scholar]
- GBD 2017 Disease and Injury Incidence and Prevalence Collaborators, 2018. Global, regional, and national incidence, prevalence, and years lived with disability for 354 diseases and injuries for 195 countries and territories, 1990–2017: a systematic analysis for the global burden of disease study 2017. Lancet 392 (10159), 1789–1858. [DOI] [PMC free article] [PubMed] [Google Scholar]
- Geschwind N, Galaburda AM., 1985a. Cerebral lateralization. Biological mechanisms, associations, and pathology: I. A hypothesis and a program for research. Arch Neurol 42 (5), 428–459. doi: 10.1001/archneur.1985.04060050026008. [DOI] [PubMed] [Google Scholar]
- Geschwind N, Galaburda AM., 1985b. Cerebral lateralization. Biological mechanisms, associations, and pathology: II. A hypothesis and a program for research. Arch Neurol 42 (6), 521–552. doi: 10.1001/archneur.1985.04060060019009. [DOI] [PubMed] [Google Scholar]
- Geschwind N, Galaburda AM., 1985c. Cerebral lateralization. Biological mechanisms, associations, and pathology: III. A hypothesis and a program for research. Arch Neurol 42 (7), 634–654. doi: 10.1001/archneur.1985.04060070024012. [DOI] [PubMed] [Google Scholar]
- Geschwind N, Levitsky W, 1968. Human brain: left-right asymmetries in temporal speech region. Science 161 (3837), 186–187. doi: 10.1126/science.161.3837.186. [DOI] [PubMed] [Google Scholar]
- Geschwind N, 1970. The organization of language and the brain. Science 170 (3961), 940–944. doi: 10.1126/science.170.3961.940. [DOI] [PubMed] [Google Scholar]
- Huang L, Zheng W, Wu C, Wei X, Wu X, Wang Y, Zheng H, 2015. Diffusion tensor imaging of the auditory neural pathway for clinical outcome of cochlear implantation in pediatric congenital sensorineural hearing loss patients. PLoS One 10 (10), e0140643. doi: 10.1371/journal.pone.0140643. [DOI] [PMC free article] [PubMed] [Google Scholar]
- Huddle MG, Goman AM, Kernizan FC, Foley DM, Price C, Frick KD, Lin FR, 2017. The economic impact of adult hearing loss: A systematic review. JAMA Otolaryngol Head Neck Surg 143 (10), 1040–1048. [DOI] [PubMed] [Google Scholar]
- Husain FT, Medina RE, Davis CW, Szymko-Bennett Y, Simonyan K, Pajor NM, Horwitz B, 2011. Neuroanatomical changes due to hearing loss and chronic tinnitus: a combined VBM and DTI study. Brain Res 1369, 74–88. doi: 10.1016/j.brainres.2010.10.095. [DOI] [PMC free article] [PubMed] [Google Scholar]
- Karns CM, Stevens C, Dow MW, Schorr EM, Neville HJ., 2017. Atypical white-matter microstructure in congenitally deaf adults: a region of interest and tractography study using diffusion-tensor imaging. Hear Res 343, 72–82. doi: 10.1016/j.heares.2016.07.008. [DOI] [PMC free article] [PubMed] [Google Scholar]
- Kim J, Choi JY, Eo J, Park HJ, 2017. Comparative evaluation of the white matter fiber integrity in patients with prelingual and postlingual deafness. Neuroreport 28 (16), 1103–1107. doi: 10.1097/wnr.0000000000000894. [DOI] [PubMed] [Google Scholar]
- Kral A, Hartmann R, Tillein J, Heid S, Klinke R, 2000. Congenital auditory deprivation reduces synaptic activity within the auditory cortex in a layer-specific manner. Cereb Cortex 10 (7), 714–726. [DOI] [PubMed] [Google Scholar]
- Kral A, Kronenberger WG, Pisoni DB, O’Donoghue GM, 2016. Neurocognitive factors in sensory restoration of early deafness: a connectome model. Lancet Neurol 15 (6), 610–621. [DOI] [PMC free article] [PubMed] [Google Scholar]
- Kral A, O’Donoghue GM., 2010. Profound deafness in childhood. N Engl J Med 363 (15), 1438–1450. [DOI] [PubMed] [Google Scholar]
- Kral A, Sharma A, 2012. Developmental neuroplasticity after cochlear implantation. Trends Neurosci 35 (2), 111–122. [DOI] [PMC free article] [PubMed] [Google Scholar]
- Leporé N, Vachon P, Lepore F, Chou YY, Voss P, Brun CC, Lee AD, Toga AW, Thompson PM., 2010. 3D mapping of brain differences in native signing congenitally and prelingually deaf subjects. Hum Brain Mapp. 31 (7), 970–978. doi: 10.1002/hbm.20910. [DOI] [PMC free article] [PubMed] [Google Scholar]
- Li J, Li W, Xian J, Li Y, Liu Z, Liu S, Wang X, Wang Z, He H, 2012. Cortical thickness analysis and optimized voxel-based morphometry in children and adolescents with prelingually profound sensorineural hearing loss. Brain Res. 1430, 35–42. doi: 10.1016/j.brainres.2011.09.057. [DOI] [PubMed] [Google Scholar]
- Li W, Li J, Wang Z, Li Y, Liu Z, Yan F, Xian J, He H, 2015. Grey matter connectivity within and between auditory, language and visual systems in prelingually deaf adolescents. Restor Neurol. Neurosci. 33 (3), 279–290. doi: 10.3233/rnn-140437. [DOI] [PMC free article] [PubMed] [Google Scholar]
- Li W, Li J, Xian J, Lv B, Li M, Wang C, Li Y, Liu Z, Liu S, Wang Z, He H, Sabel BA., 2013. Alterations of grey matter asymmetries in adolescents with prelingual deafness: A combined VBM and cortical thickness analysis. Restor Neurol. Neurosci. 31 (1), 1–17. doi: 10.3233/RNN-2012-120269. [DOI] [PubMed] [Google Scholar]
- Lin FR, Yaffe K, Xia J, Xue Q-L, Harris TB, Purchase-Helzner E, Satterfield S, Ayonayon HN, Ferrucci L, Simonsick EM, 2013. Hearing loss and cognitive decline in older adults. JAMA Intern Med. 173 (4), 293–299. [DOI] [PMC free article] [PubMed] [Google Scholar]
- Lin FR, Ferrucci L, An Y, Goh JO, Doshi J, Metter EJ, Davatzikos C, Kraut MA, Resnick SM., 2014. Association of hearing impairment with brain volume changes in older adults. Neuroimage 90, 84–92. doi: 10.1016/j.neuroimage.2013.12.059. [DOI] [PMC free article] [PubMed] [Google Scholar]
- Liu Z-H, Li M, Xian J-F, He H-G, Z.-C, Li Y, Li J-H, Wang X-C, Liu S, 2010. Investigation of the white matter with tract-based spatial statistics in congenitally deaf patients. Chinese J. Med. Imaging Technol. 26 (7), 1226–1229. [Google Scholar]
- Luan Y, Wang C, Jiao Y, Tang T, Zhang J, Teng GJ., 2019. Prefrontal-temporal pathway mediates the cross-modal and cognitive reorganization in sensorineural hearing loss with or without tinnitus: a multimodal MRI study. Front Neurosci. 13, 222. doi: 10.3389/fnins.2019.00222. [DOI] [PMC free article] [PubMed] [Google Scholar]
- Manno FAM, Manno SHC, Ahmed I, Liu Y, Cheng SH, Lau C, 2018. One Patient, Two Patient, Three Patient, Four - When Patients Are Counted, but Not Accounted for: Pseudoreplication in Medicine. ITME doi: 10.1109/itme.2018.00065. [DOI] [Google Scholar]
- Meyer M, Toepel U, Keller J, Nussbaumer D, Zysset S, Friederici AD., 2007. Neuroplasticity of sign language: implications from structural and functional brain imaging. Restor Neurol. Neurosci 25 (3–4), 335–351. [PubMed] [Google Scholar]
- Miao W, Li J, Tang M, Xian J, Li W, Liu Z, Liu S, Sabel BA, Wang Z, He H, 2013. Altered white matter integrity in adolescents with prelingual deafness: a high-resolution tract-based spatial statistics imaging study. AJNR Am. J. Neuroradiol. 34 (6), 1264–1270. doi: 10.3174/ajnr.a3370. [DOI] [PMC free article] [PubMed] [Google Scholar]
- Moore JK, Niparko JK, Miller MR, Linthicum FH., 1994. Effect of profound hearing loss on a central auditory nucleus. Am. J. Otol 15 (5), 588–595. [PubMed] [Google Scholar]
- Moore JK, Niparko JK, Perazzo LM, Miller MR, Linthicum FH., 1997. Effect of adult-on-set deafness on the human central auditory system. Ann. Otol. Rhinol. Laryngol 106 (5), 385–390. [DOI] [PubMed] [Google Scholar]
- Morton CC, Nance WE., 2006. Newborn hearing screening - a silent revolution. N. Engl. J. Med 354 (20), 2151–2164. [DOI] [PubMed] [Google Scholar]
- Nichols TE, et al. , 2017. Best practices in data analysis and sharing in neuroimaging using MRI. Nat. Neurosci 20 (3), 299–303. [DOI] [PMC free article] [PubMed] [Google Scholar]
- Olkin I, Dahabreh IJ, Trikalinos TA., 2012. GOSH - a graphical display of study heterogeneity. Res. Synth Methods 3 (3), 214–223. [DOI] [PubMed] [Google Scholar]
- Olulade OA, Koo DS, LaSasso CJ, Eden GF., 2014. Neuroanatomical profiles of deafness in the context of native language experience. J. Neurosci 34 (16), 5613–5620. doi: 10.1523/jneurosci.3700-13.2014. [DOI] [PMC free article] [PubMed] [Google Scholar]
- Peelle JE, Troiani V, Grossman M, Wingfield A, 2011. Hearing loss in older adults affects neural systems supporting speech comprehension. J. Neurosci 31 (35), 12638–12643. doi: 10.1523/jneurosci.2559-11.2011. [DOI] [PMC free article] [PubMed] [Google Scholar]
- Penhune VB, Cismaru R, Dorsaint-Pierre R, Petitto LA, Zatorre RJ., 2003. The morphometry of auditory cortex in the congenitally deaf measured using MRI. Neuroimage 20 (2), 1215–1225. doi: 10.1016/s1053-8119(03)00373-2. [DOI] [PubMed] [Google Scholar]
- Pereira-Jorge MR, Andrade KC, Palhano-Fontes FX, Diniz PRB, Sturzbecher M, Santos AC, Araujo DB., 2018. Anatomical and functional MRI changes after one year of auditory rehabilitation with hearing aids. Neural Plast. 2018, 9303674. doi: 10.1155/2018/9303674. [DOI] [PMC free article] [PubMed] [Google Scholar]
- Ratnanather JT., 2020. Structural neuroimaging of the altered brain stemming from pediatric and adolescent hearing loss —Scientific and clinical challenges. Wiley Interdiscip Rev. Syst. Biol. Med. 12 (2), e1469. [DOI] [PMC free article] [PubMed] [Google Scholar]
- Reed NS, Altan A, Deal JA, Yeh C, Kravetz AD, Wallhagen M, Lin FR., 2019. Trends in health care costs and utilization associated with untreated hearing loss over 10 Years. JAMA Otolaryngol. Head Neck Surg. 145 (1), 27–34. [DOI] [PMC free article] [PubMed] [Google Scholar]
- Rigters SC, Bos D, Metselaar M, Roshchupkin GV, Baatenburg de Jong RJ, Ikram MA, Vernooij MW, Goedegebure A, 2017. Hearing impairment is associated with smaller brain volume in aging. Front. Aging Neurosci. 9, 2. doi: 10.3389/fnagi.2017.00002. [DOI] [PMC free article] [PubMed] [Google Scholar]
- Rigters SC, Cremers LGM, Ikram MA, van der Schroeff MP, de Groot M, Roshchupkin GV, Niessen WJN, Baatenburg de Jong RJ, Goedegebure A, Vernooij MW., 2018. White-matter microstructure and hearing acuity in older adults: a population-based cross-sectional DTI study. Neurobiol. Aging 61, 124–131. [DOI] [PubMed] [Google Scholar]
- Ropers FG, Pham ENB, Kant SG, Rotteveel LJC, Rings EHHM, Verbist BM, Dekkers OM., 2019. Assessment of the clinical benefit of imaging in children with unilateral sensorineural hearing loss: a systematic review and meta-analysis. JAMA Otolaryngol Head Neck Surg doi: 10.1001/jamaoto.2019.0121. [DOI] [PMC free article] [PubMed] [Google Scholar]
- Shi B, Yang LZ, Liu Y, Zhao SL, Wang Y, Gu F, Yang Z, Zhou Y, Zhang P, Zhang X, 2016. Early-onset hearing loss reorganizes the visual and auditory network in children without cochlear implantation. Neuroreport 27 (3), 197–202. doi: 10.1097/wnr.0000000000000524. [DOI] [PubMed] [Google Scholar]
- Shibata DK., 2007. Differences in brain structure in prel persons on MR imaging studied with voxel-based morphometry. AJNR Am. J. Neuroradiol 28 (2), 243–249. [PMC free article] [PubMed] [Google Scholar]
- Shiell MM, Champoux F, Zatorre RJ., 2016. The right hemisphere planum temporale supports enhanced visual motion detection ability in deaf people the right hemisphere planum temporale supports enhanced visual motion detection ability in deaf people. Neural Plast., 7217630 doi: 10.1155/2016/7217630. [DOI] [PMC free article] [PubMed] [Google Scholar]
- Shiell MM, Zatorre RJ., 2017. White matter structure in the right planum temporale region correlates with visual motion detection thresholds in deaf people. Hear Res. 343, 64–71. doi: 10.1016/j.heares.2016.06.011. [DOI] [PubMed] [Google Scholar]
- Simon M, Campbell E, Genest F, MacLean MW, Champoux F, Lepore F, 2020. The impact of early deafness on brain plasticity: a systematic review of the white and gray matter changes. Front. Neurosci 14, 206. doi: 10.3389/fnins.2020.00206. [DOI] [PMC free article] [PubMed] [Google Scholar]
- Smith KM, Mecoli MD, Altaye M, Komlos M, Maitra R, Eaton KP, Egelhoff JC, Holland SK., 2011. Morphometric differences in the Heschl’s gyrus of hearing impaired and normal hearing infants. Cereb Cortex 21 (5), 991–998. doi: 10.1093/cercor/bhq164. [DOI] [PMC free article] [PubMed] [Google Scholar]
- Tae W-S, 2015. Reduced gray matter volume of auditory cortical and subcortical areas in congenitally deaf adolescents: a voxel-based morphometric study. Investig Magn. Reson. Imaging 19, 1–9. doi: 10.13104/imri.2015.19.1.1. [DOI] [Google Scholar]
- Tarabichi O, Kozin ED, Kanumuri VV, Barber S, Ghosh S, Sitek KR, Reinshagen K, Herrmann B, Remenschneider AK, Lee DJ., 2018. Diffusion tensor imaging of central auditory pathways in patients with sensorineural hearing loss: a systematic review. Otolaryngol Head Neck Surg. 158 (3), 432–442. [DOI] [PMC free article] [PubMed] [Google Scholar]
- Thompson DC, McPhillips H, Davis RL, Lieu TL, Homer CJ, Helfand M, 2001. Universal newborn hearing screening: summary of evidence. JAMA 286 (16), 2000–2010. [DOI] [PubMed] [Google Scholar]
- Van Essen DC., 1997. A tension-based theory of morphogenesis and compact wiring in the central nervous system. Nature 385 (6614), 313–318. doi: 10.1038/385313a0. [DOI] [PubMed] [Google Scholar]
- Waskom M, Gramfort A, Burns S, Luessi M, Larson E, 2021. PySurfer: python neuroimaging visualization. Python package version 0.9.0. https://pysurfer.github.io/. https://github.com/nipy/PySurfer. [Google Scholar]
- Wenjing Li, Yong Li, Junxi X, Zhaohui L, Xiaocui W, Sha L, Zhenchang W, Huiguang H, 2010. A voxel-based morphometric analysis of brain in congenitally deaf patients. J. Clin. Rad 29 (2), 166–169. doi: 10.13437/j.cnki.jcr.2010.02.031. [DOI] [Google Scholar]
- Worsley KJ, Taylor JE, Carbonell F, Chung MK, Duerden E, Bernhardt B, Lyttelton O, Boucher M, SurfStat Evans AC, July 2009. A Matlab toolbox for the statistical analysis of univariate and multivariate surface and volumetric data using linear mixed effects models and random field theory. NeuroImage 47 (Supplement 1), S39–S41. doi: 10.1016/S1053-8119(09)70882-1. [DOI] [Google Scholar]
- Wu C, Huang L, Tan H, Wang Y, Zheng H, Kong L, Zheng W, 2016. Diffusion tensor imaging and MR spectroscopy of microstructural alterations and metabolite concentration changes in the auditory neural pathway of pediatric congenital sensorineural hearing loss patients. Brain Res. 1639, 228–234. doi: 10.1016/j.brainres.2014.12.025. [DOI] [PubMed] [Google Scholar]
- Xia S, Qi J, Li Q, 2008. High-resolution MR study of auditory cortex in prelingual sensorineural hearing loss. Chinese J. Med. Imaging Technol. 24 (11), 1705–1707. [Google Scholar]
- Xia S, Qi J, 2008. The study of diffusion weighted imaging and MR spectroscopy in auditory cortex and related area of prelingual hearing-loss patients. Chinese J. Radiol. 42 (7), 702–705. [Google Scholar]
- Yang G, Zhou S, Bozek J, Dong HM, Han M, Zuo XN, Liu H, Gao JH., 2020. Sample sizes and population differences in brain template construction. Neuroimage 206, 116318. doi: 10.1016/j.neuroimage.2019.116318. [DOI] [PMC free article] [PubMed] [Google Scholar]
- Zheng W, Wu C, Huang L, Wu R, 2017. Diffusion kurtosis imaging of microstructural alterations in the brains of paediatric patients with congenital sensorineural hearing loss. Sci Rep 7, 1543. doi: 10.1038/s41598-017-01263-9. [DOI] [PMC free article] [PubMed] [Google Scholar]
- Zuo XN, He Y, Betzel RF, Colcombe S, Sporns O, Milham MP., 2017. Human Connectomics across the Life Span. Trends Cogn. Sci. 21 (1), 32–45. [DOI] [PubMed] [Google Scholar]
Associated Data
This section collects any data citations, data availability statements, or supplementary materials included in this article.
Supplementary Materials
Data Availability Statement
The entire dataset, analyses and code used in this work can be downloaded by contacting the corresponding author and from the Open Science Framework: Manno, et al., 2018. “Profound Hearing Loss.” OSF. https://osf.io/7y59j/.