Abstract
Significant effort toward the automation of general anesthesia has been made in the past decade. One open challenge is in the development of control-ready patient models for closed-loop anesthesia delivery. Standard depth-of-anesthesia tracking does not readily capture inter-individual differences in response to anesthetics, especially those due to age, and does not aim to predict a relationship between a control input (infused anesthetic dose) and system state (commonly, a function of electroencephalography (EEG) signal). In this work, we developed a control-ready patient model for closed-loop propofol-induced anesthesia using data recorded during a clinical study of EEG during general anesthesia in ten healthy volunteers. We used principal component analysis to identify the low-dimensional state-space in which EEG signal evolves during anesthesia delivery. We parameterized the response of the EEG signal to changes in propofol target-site concentration using logistic models. We note that inter-individual differences in anesthetic sensitivity may be captured by varying a constant cofactor of the predicted effect-site concentration. We linked the EEG dose-response with the control input using a pharmacokinetic model. Finally, we present a simple nonlinear model predictive control in silico demonstration of how such a closed-loop system would work.
Keywords: Biomedical control, medical applications, nonlinear control, model predictive control, power spectral density
1. INTRODUCTION
General anesthesia (GA) is a profound state of unconsciousness, analgesia, and amnesia [Brown et al., 2010]. Anesthesiologists control the depth of unconsciousness during GA by assessing patient signs and symptoms and/or using a brain monitor summary score and then making concomitant changes to the infusion of hypnotic medications at irregular time intervals. Automatic control of unconsciousness with closed loop anesthesia delivery (CLAD) would afford anesthesiologists more attention on other aspects of anesthesia care and provide more regular and frequent adjustments to hypnotic infusions. A diagram of a CLAD system is shown in Figure 1.
Fig. 1.
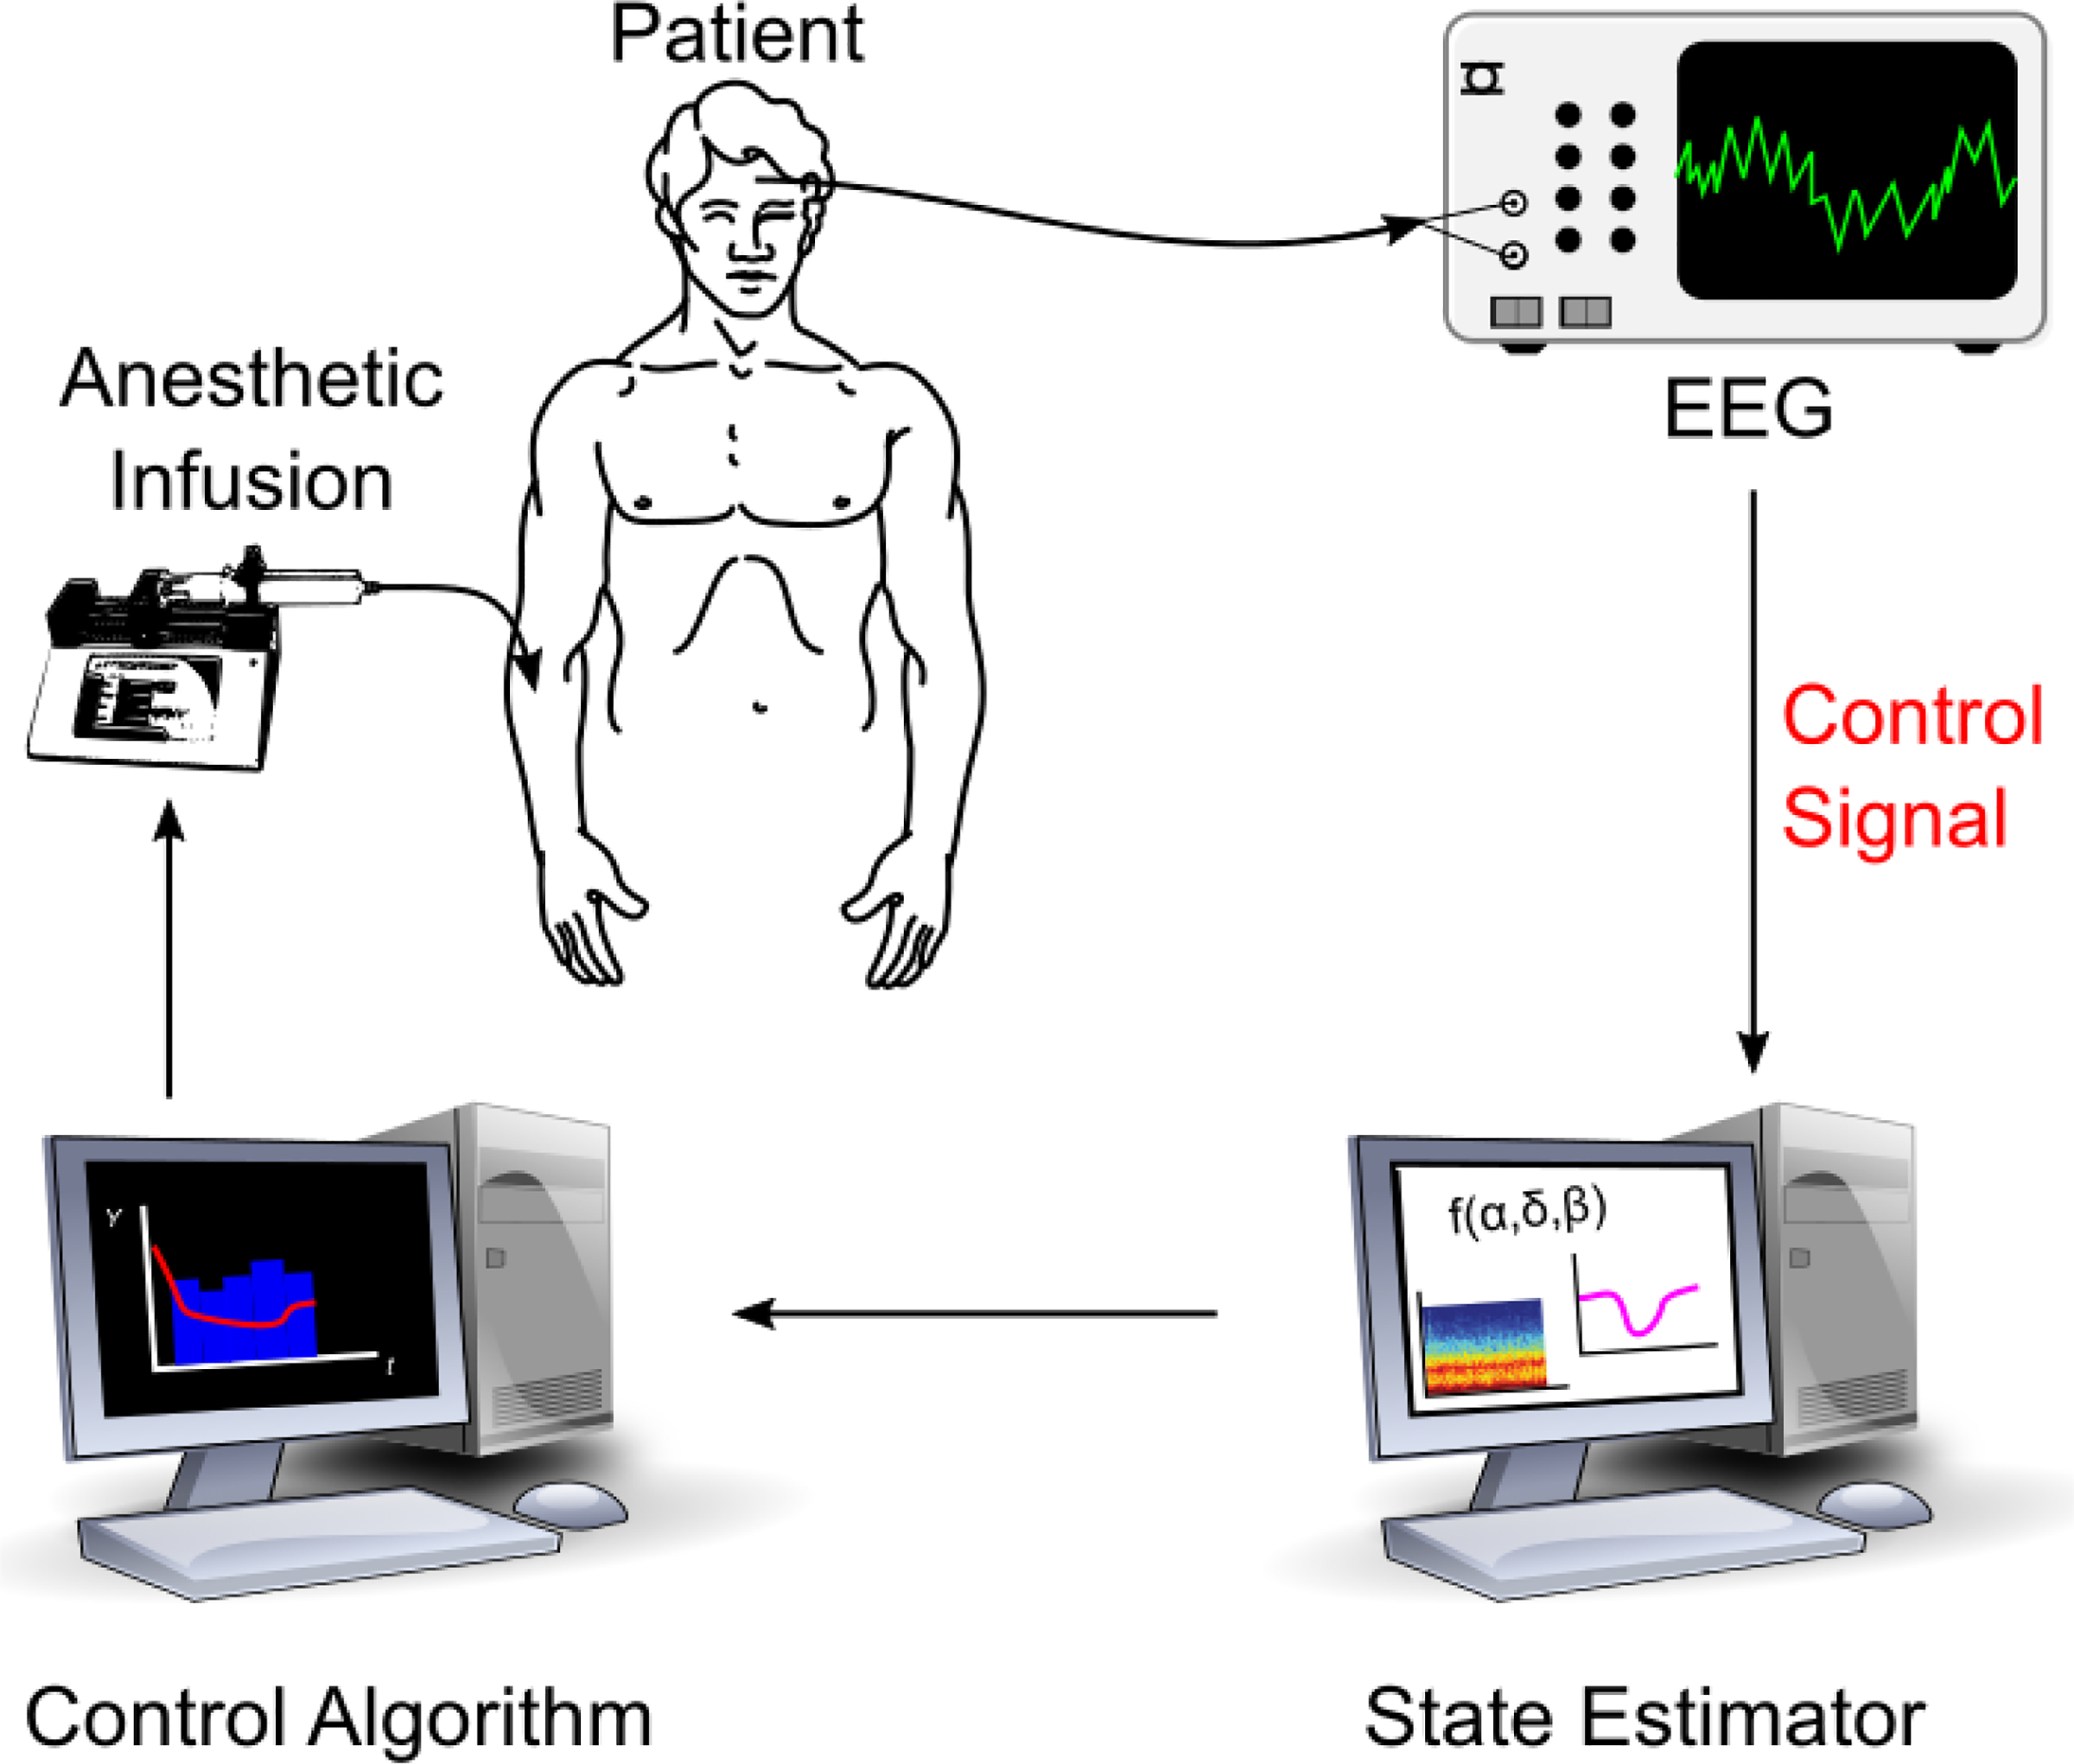
Diagram of a closed-loop anesthesia delivery (CLAD) system. This work focuses on development of the control signal appropriate for closed-loop delivery of propofol.
Clinically available depth of unconsciousness summary monitors have been used as the control signal for prior studies on CLAD [Absalom et al., 2009; Gentilini et al., 2001; Haddad et al., 2003; Soltesz et al., 2012; Van Heusden et al., 2014] as well as commercially available CLAD products [Liu et al., 2015]. Commercially available consciousness summary monitors include bispectral index (BIS, Medtronic) and NeuroSENSE (Neurowave Systems). These monitors indicate the “depth of anesthesia” with a single scalar between 0 and 100. Patients have been shown to have inter-individual differences in both pharmcodynamic (sensitivity) and pharmacokinetic (drug uptake and elimination) monitor responses to hypnotic [Absalom et al., 2009; Gentilini et al., 2001], particularly for children [Soltesz et al., 2012; Van Heusden et al., 2014]. Depth of anesthesia summary monitors are insensitive to patient characteristics and anesthetic agents, and defining the underlying physics of general anesthesia remains a significant barrier for CLAD [Absalom et al., 2011].
The summary scores produced by consciousness monitors are dervied from recordings of the brain’s electrical activity: the electroencephalogram (EEG). Custom metrics dervied from the EEG have been used for automatic control of medically-induced coma. Specifically, the probability of brain activity senescence (the ”burst suppression probability”) was computed from EEG in real-time and used as the control signal for developing linear-quadratic regulator [Shanechi et al., 2013; Yang et al., 2019] and proportional-integral-derivative [Ching et al., 2013] medically-induced coma controllers. Medically-induced coma is only indicated for patients with aberrant brain activity, and targets an even greater reduction in brain activity than GA. EEG can provide a richer representation of neural activity than summary monitors, but an EEG signature would need to be identified specifically for GA.
CLAD models have a wide-range of personalization and adaptability. Many fit model parameters on patient populations [Absalom et al., 2009; Gentilini et al., 2001; Soltesz et al., 2012; Van Heusden et al., 2014]. Some have developed personalization via an initial calibration period prior to control tests [Ching et al., 2013; Shanechi et al., 2013]. Calibration during control has been previously performed for medically-induced coma [Yang et al., 2019] and in numerical simulations of general anesthesia [Haddad et al., 2003].
Here, we develop a proof-of-concept EEG-based CLAD system for general anesthesia. We first derive an EEG-based control signal from a clinical trial on EEG response to the hypnotic agent propofol. We then assess pharmacokinetic (PK) and pharmacodynamic (PD) model fitting differences across patients. Next we formalize the application of a model-based controller with an adaptive phase of control that adjusts to an individual’s susceptibility. Finally, we perform simulations to demonstrate the proposed system’s performance.
2. PROBLEM FORMULATION AND APPROACH
We seek to ensure unconsciousness during anesthesia by regulating neural activity as recorded via EEG. To do so, we aimed to develop a pharmacokinetic-pharmacodynamic (PKPD) model of EEG power spectral density (PSD) that evolves over time t according to:
| (1) |
where system is some D-dimensional measure of the relevant EEG characteristics and control input is the anesthetic infusion dosing (concentration/time). By noting that the PSD is a function of effect-site concentration of the drug
| (2) |
the model may be separated into two components:
| (3) |
where c(t) is the drug concentration at the effect site. The latter term, dc/dt, is the pharmacokinetic term and has been studied extensively and implemented clinically in the target-controlled infusion (TCI) paradigm [Absalom et al., 2009; Barakat et al., 2007; Levitt and Schnider, 2005; Schnider et al., 1998, 1999]. In this work, we focus on developing the former pharmacodynamic term, dp/dc, in a manner that enables control and is robust to inter-individual variability in drug responses.
2.1. Identification of low-dimensional state space model from EEG
We developed a control signal using the EEG data recorded from prefrontal cortex (Fp1 electrode) during a clinical trial of ten healthy volunteers where the effect-site concentration of propofol was varied systematically for each individual. For details on the study and data collection, see Purdon et al. [2013]. Because the power spectral density is known to vary reliably depending upon propofol-induced anesthetic state, we first performed a multitapered spectral analysis of the full Fp1 EEG time series to arrive at the multitaper spectrogram Ms ∈ ℝF × N, where F is the number of frequency bins and N is the number of time windows of the spectrogram. Here, the subscript s denotes the individual subject from which the data was collected. Each column of Ms is denoted ms,t ∈ ℝF×1 is the PSD in each of F frequencies at time window t for subject s.
We performed multitaper spectral analysis in Python using the NiTime package [Rokem et al., 2009] using window length 2s with no overlap, normalized half-bandwidth TW = 3, and a spectral resolution of 2 Hz. An adaptive weighting routine was used to combine estimates of different tapers [Thomson, 1982], and the resulting multitaper spectrogram from each patient was converted to decibels.
The manifold along which the EEG PSD evolves during anesthesia is of reduced dimensionality compared to F, and many spectral features co-occur, e.g., slow-delta (0.1–4 Hz) and alpha (8–12 Hz) [Purdon et al., 2013]. Thus, we sought to reduce the dimensionality of the observations to independent linear combinations of spectral power via projecting the PSD (each ms,t) onto D principal components. That is, we compressed to by:
| (4) |
where is the ith principal component, ordered by the magnitude of the corresponding eigenvalue. We computed the principal components (PCs) performing principal component analysis (PCA) on all ten resulting spectrograms [M1, …, MS], thus, the PCs are not a signature specific to each subject. The result of this approach is shown in Figure 2.
Fig. 2.
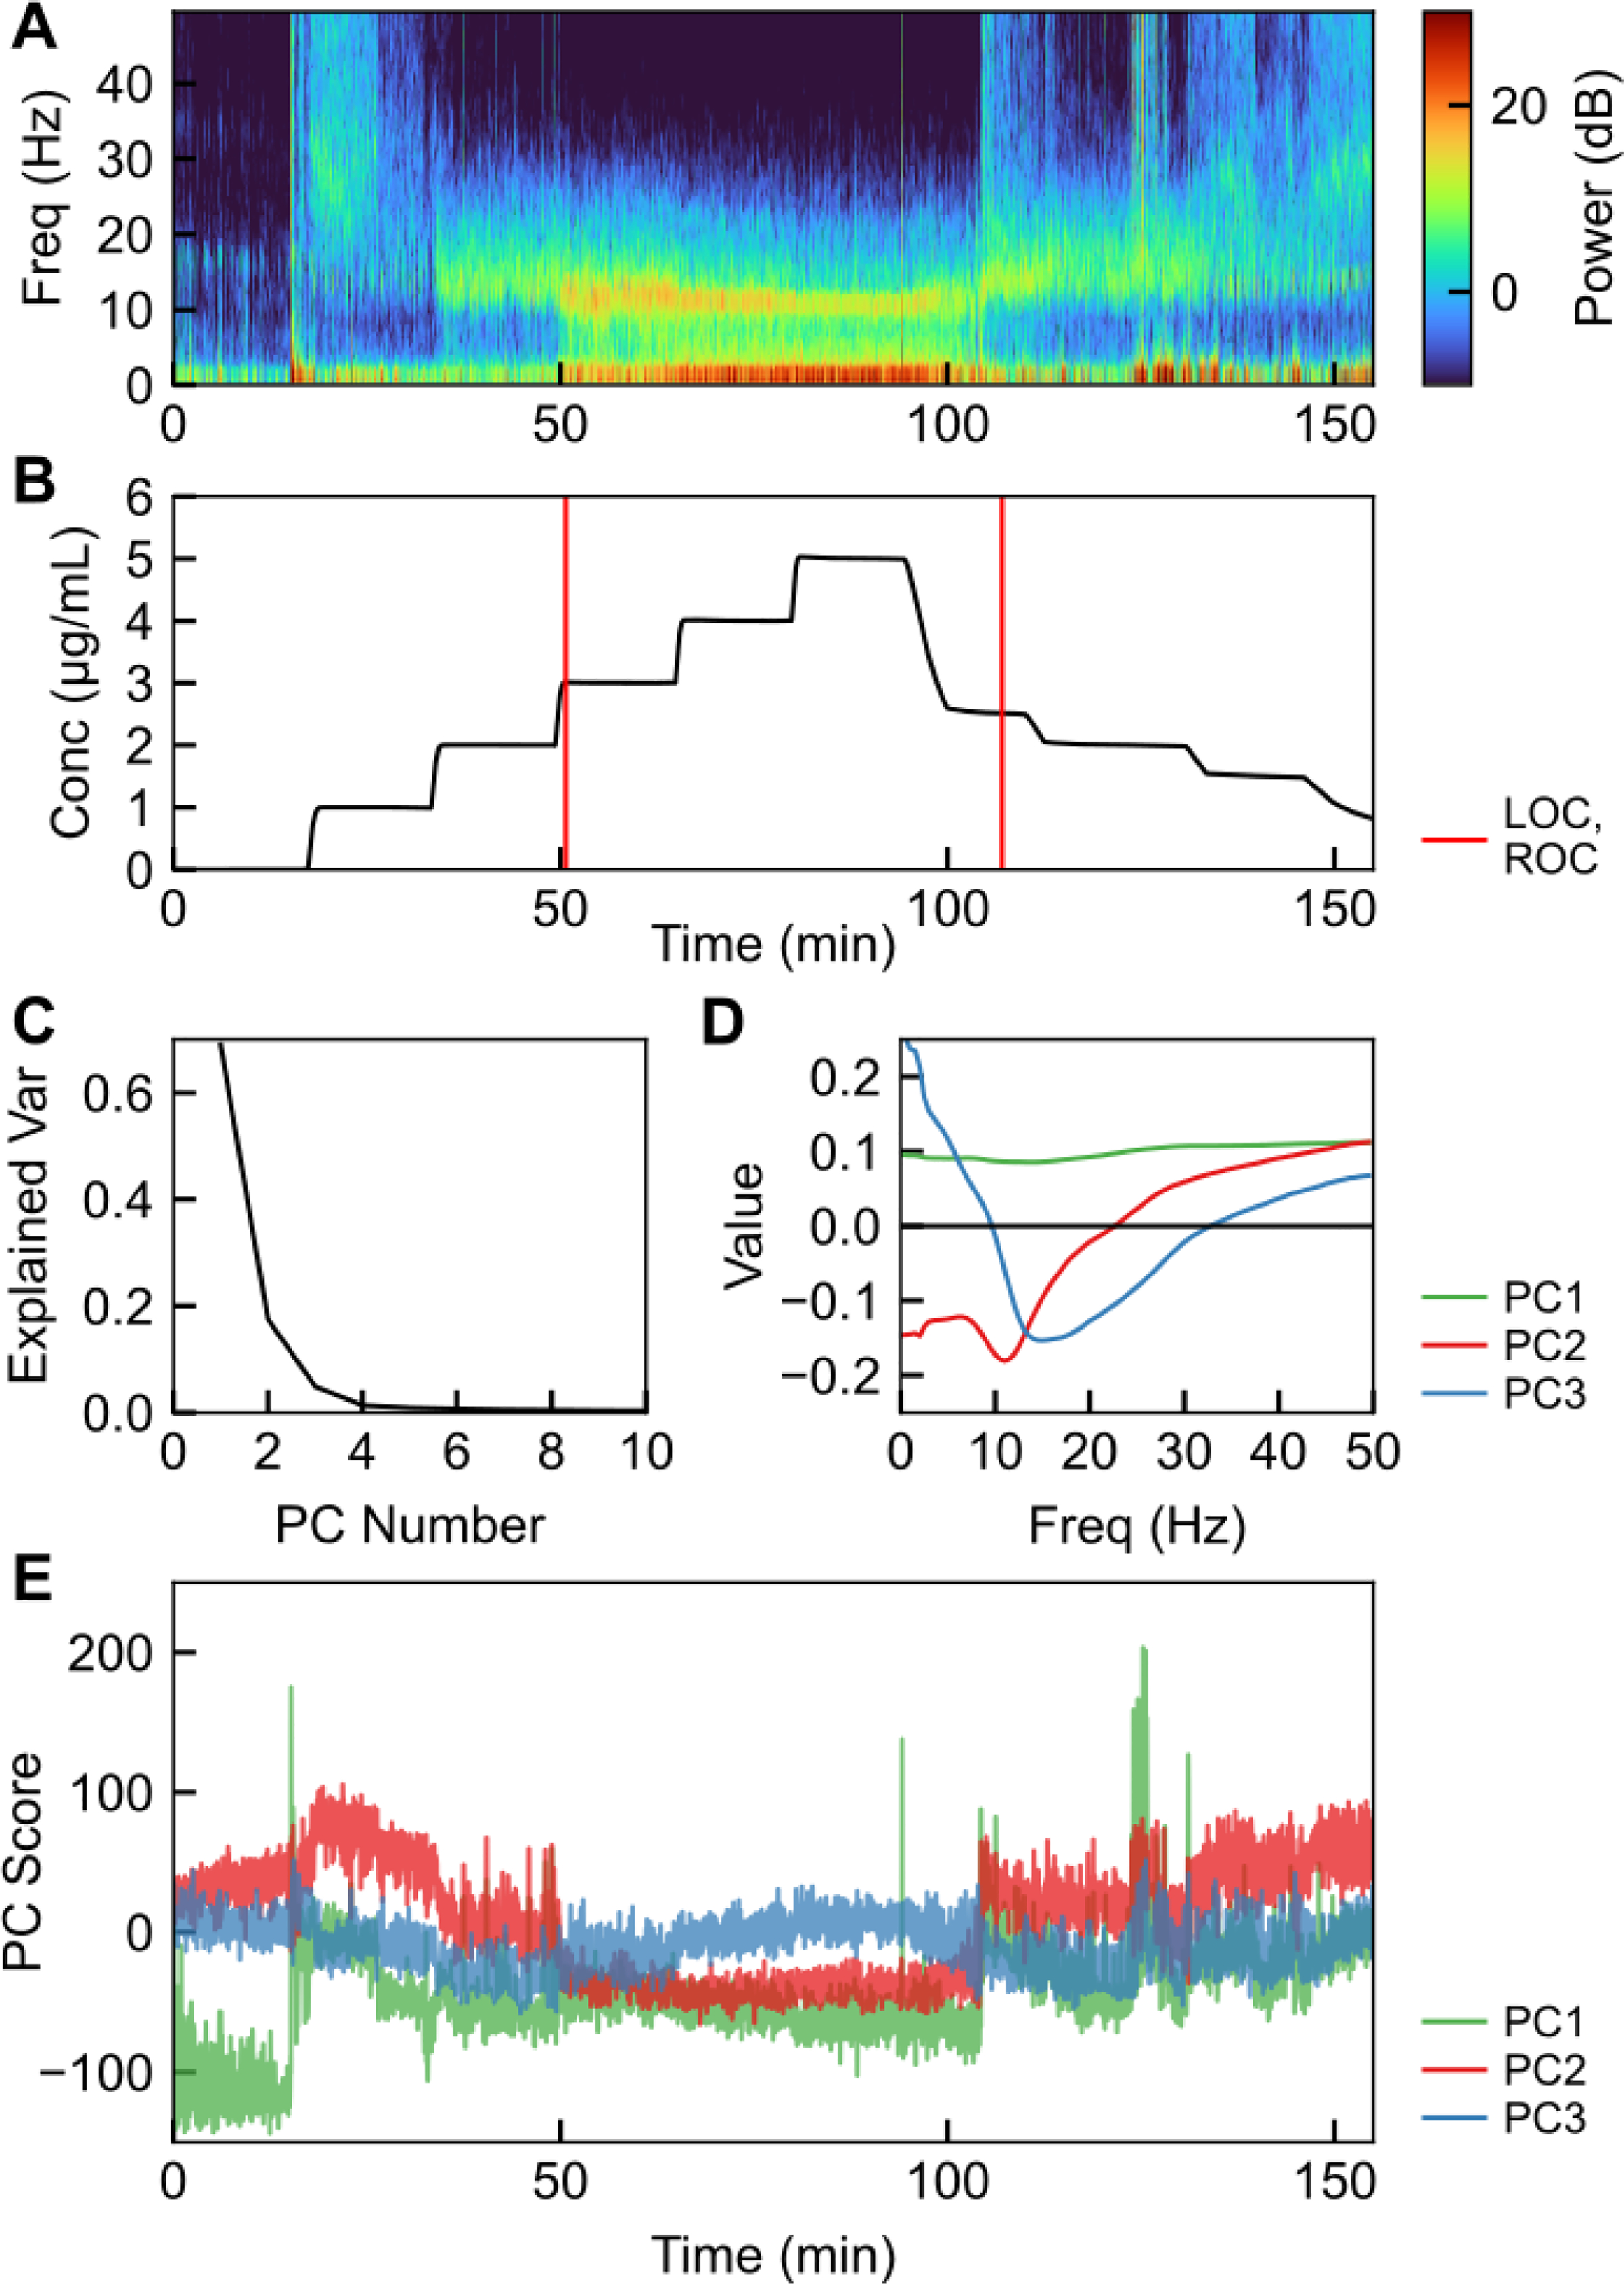
Spectral characteristics of EEG during propofol anesthesia. (A) Multitaper spectrogram of EEG signal in a healthy volunteer, from Purdon et al. [2013]. (B) Drug effect-site concentration corresponding to the multitaper spectrogram in A, with loss of consciousness (LOC) and restoration of consciousness (ROC) labeled. (C) Fraction of the explained variance in each of the first ten principal components. (D) Eigenvectors e1, e2, and e3 corresponding to the first three principal components. (E) First three principal component score of the multitaper spectrogram during the timecourse in (A,B).
We eliminated PCs above PC3, which each contained < 2% of the observed variance in the spectrogram. We chose to use two PCs (p1 = PC2, p2 = PC3) due to their clear concentration-dependence and good dynamic range, thus enabling control to be applied. We did not use PC1 due to its unclear dependence on concentration. Furthermore, these two PCs correspond with unconscious or conscious state, as shown by the separation between conscious and unconscious signal in Figure 3, and thus enable a controller to use a set point relative to conscious state.
Fig. 3.
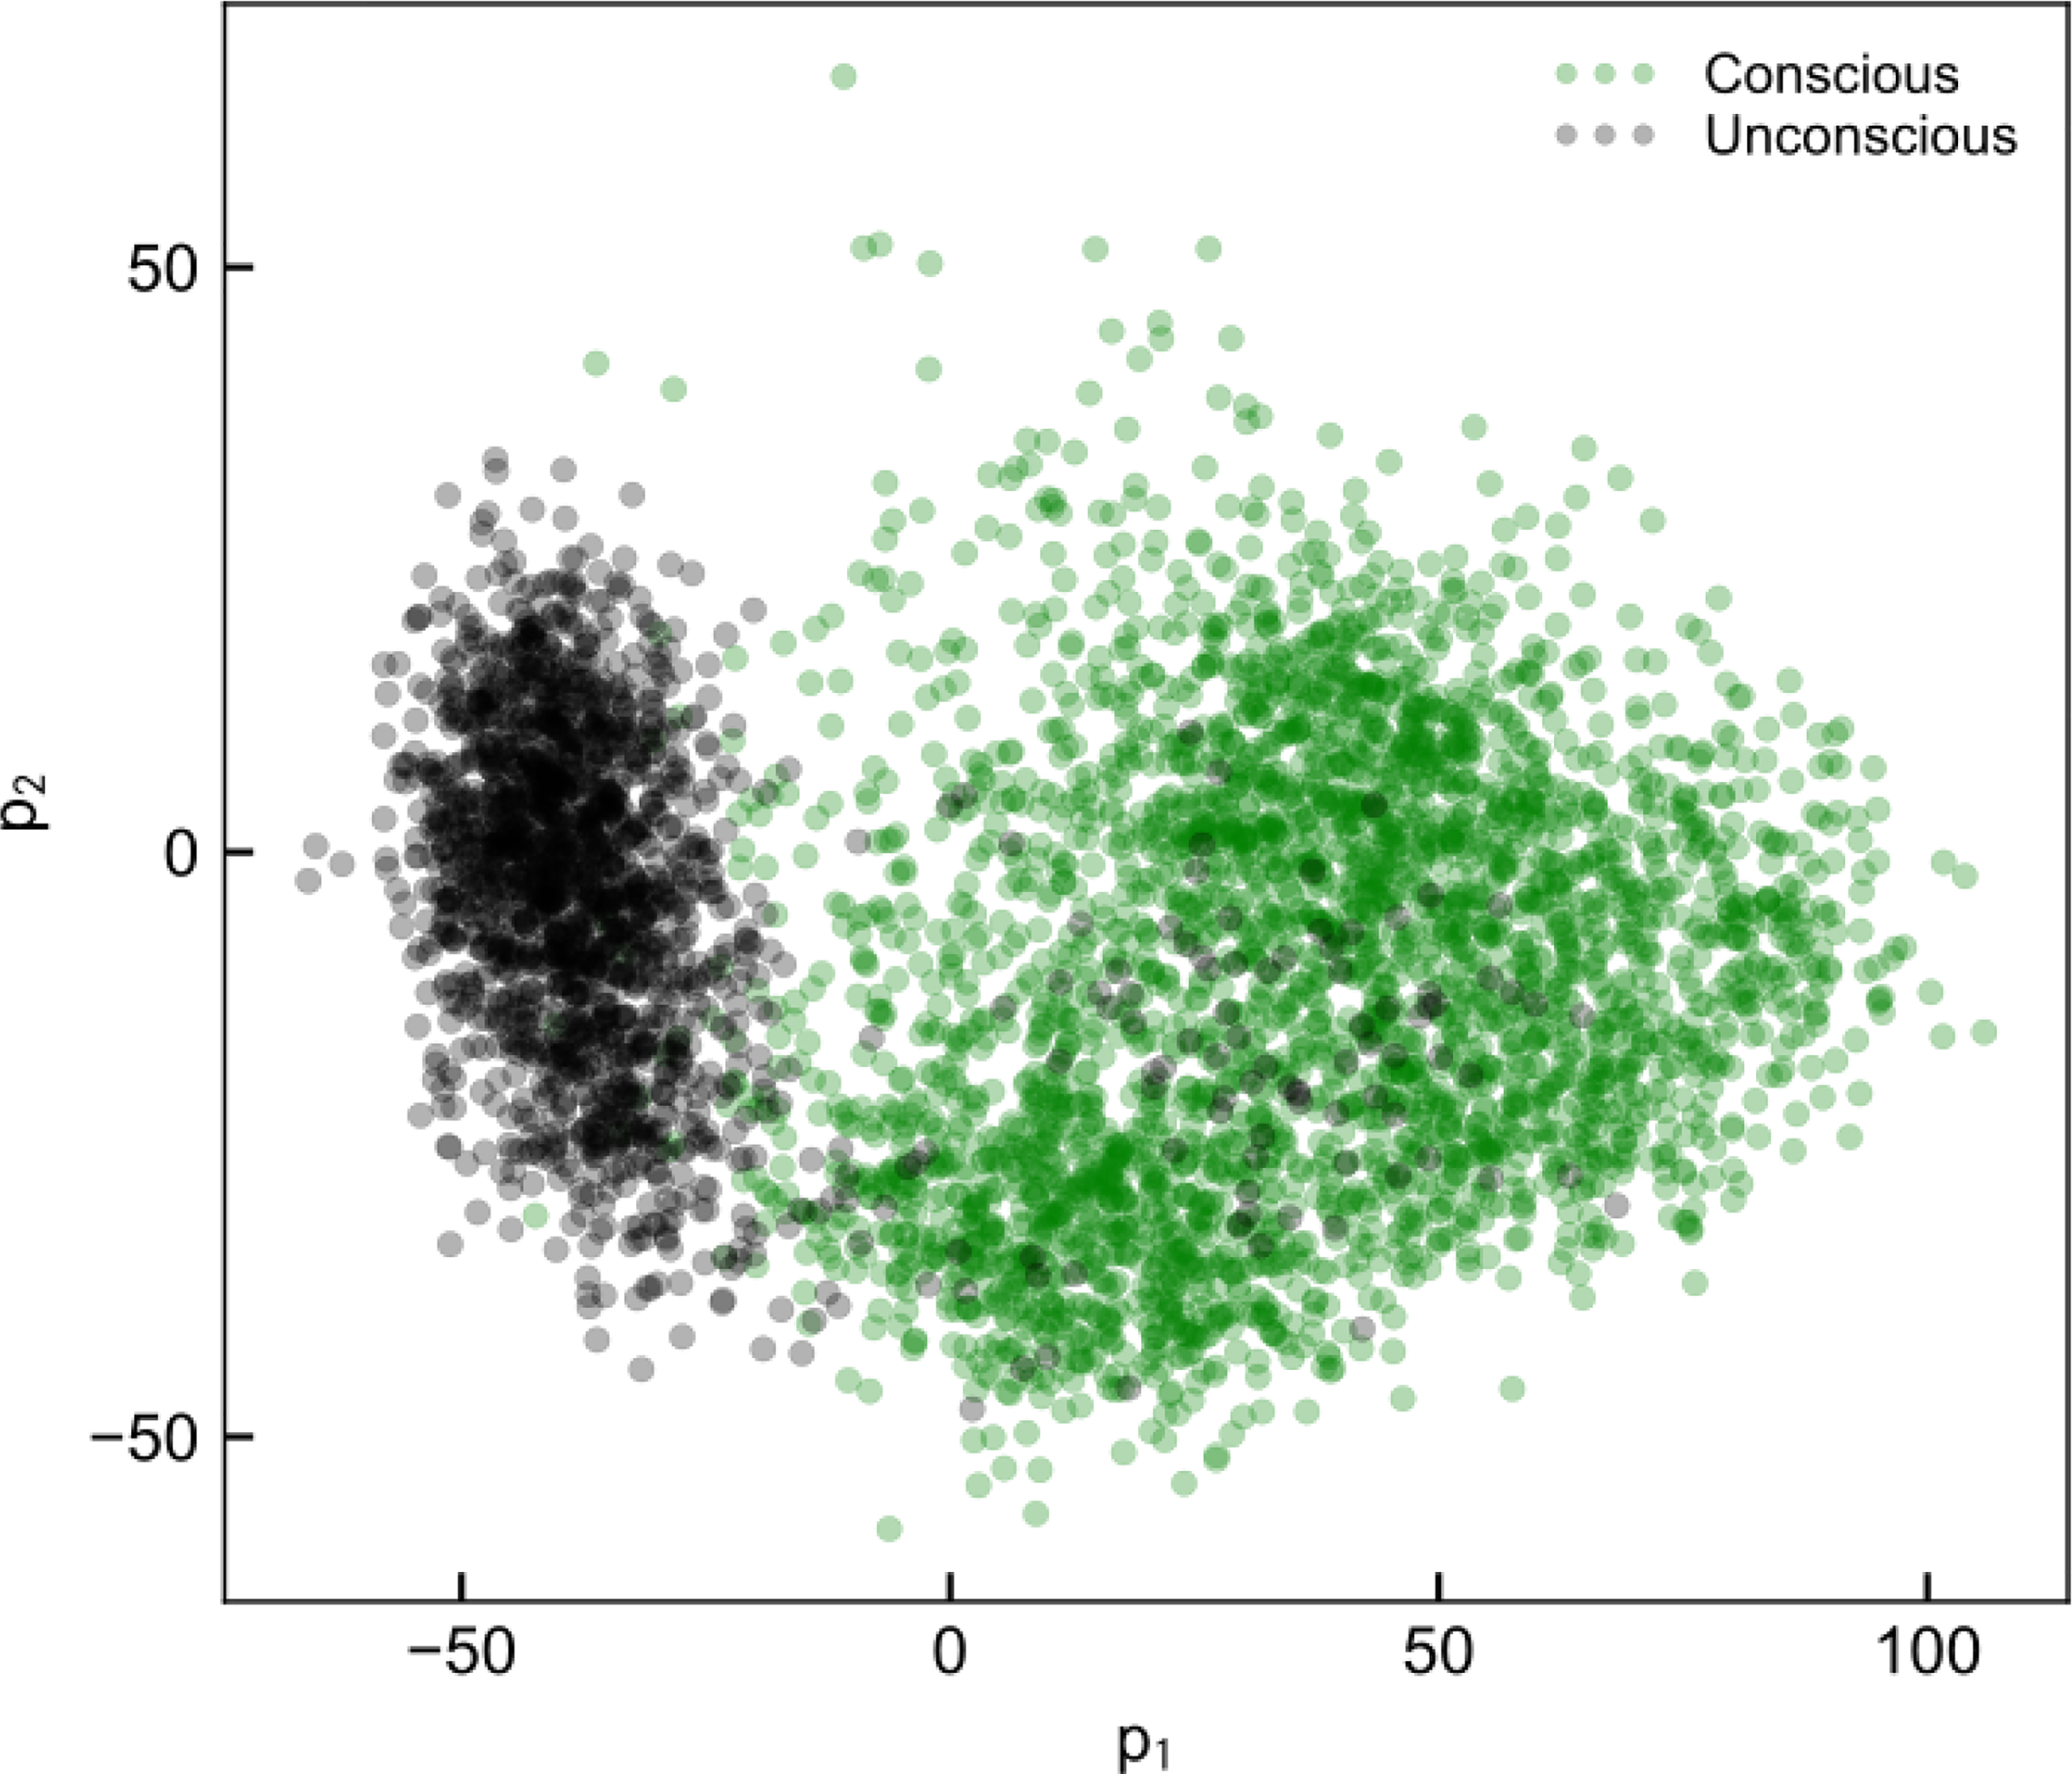
Example of p1,t (PC2 scores) vs. p2,t (PC3 scores) plotted for one subject, demonstrating the feasibility of using values of p as targets for control that ensure unconsciousness.
2.2. State-space dynamics and inter-individual variation
Having reduced the dimensionality along which the PSD evolves during anesthesia, we next sought to characterize pharmacodynamics (PD) by parameterizing a function hi(c) that generates pi(c). Each hi(c) varies between patients (as seen in Figure 2), and parameterization of these functions is important for performing control. We sought to find a universal parameter set so that control may be implemented for any individual, and so hi(c) = hi(c;ai) where ai is a fixed parameter set for function hi, common to all subjects.
Ideally the PD model we developed would apply without any subject-specific tuning. Although the shapes of hi(c) are consistent across individuals, they appear to be scaled by a constant parameter (Figure 4, top). Because we have S = 10 subjects, we can then state that for subject s,
| (5) |
where ks is the subject’s anesthetic sensitivity and a high ks denotes high sensitivity. A higher sensitivity indicates a larger response to a given anesthetic dose. This is of additional use because, since ks is always a coefficient of c,
| (6) |
where h′(c) = ∂h/∂c. Thus the equation we seek to control for subject s becomes:
| (7) |
Fig. 4.
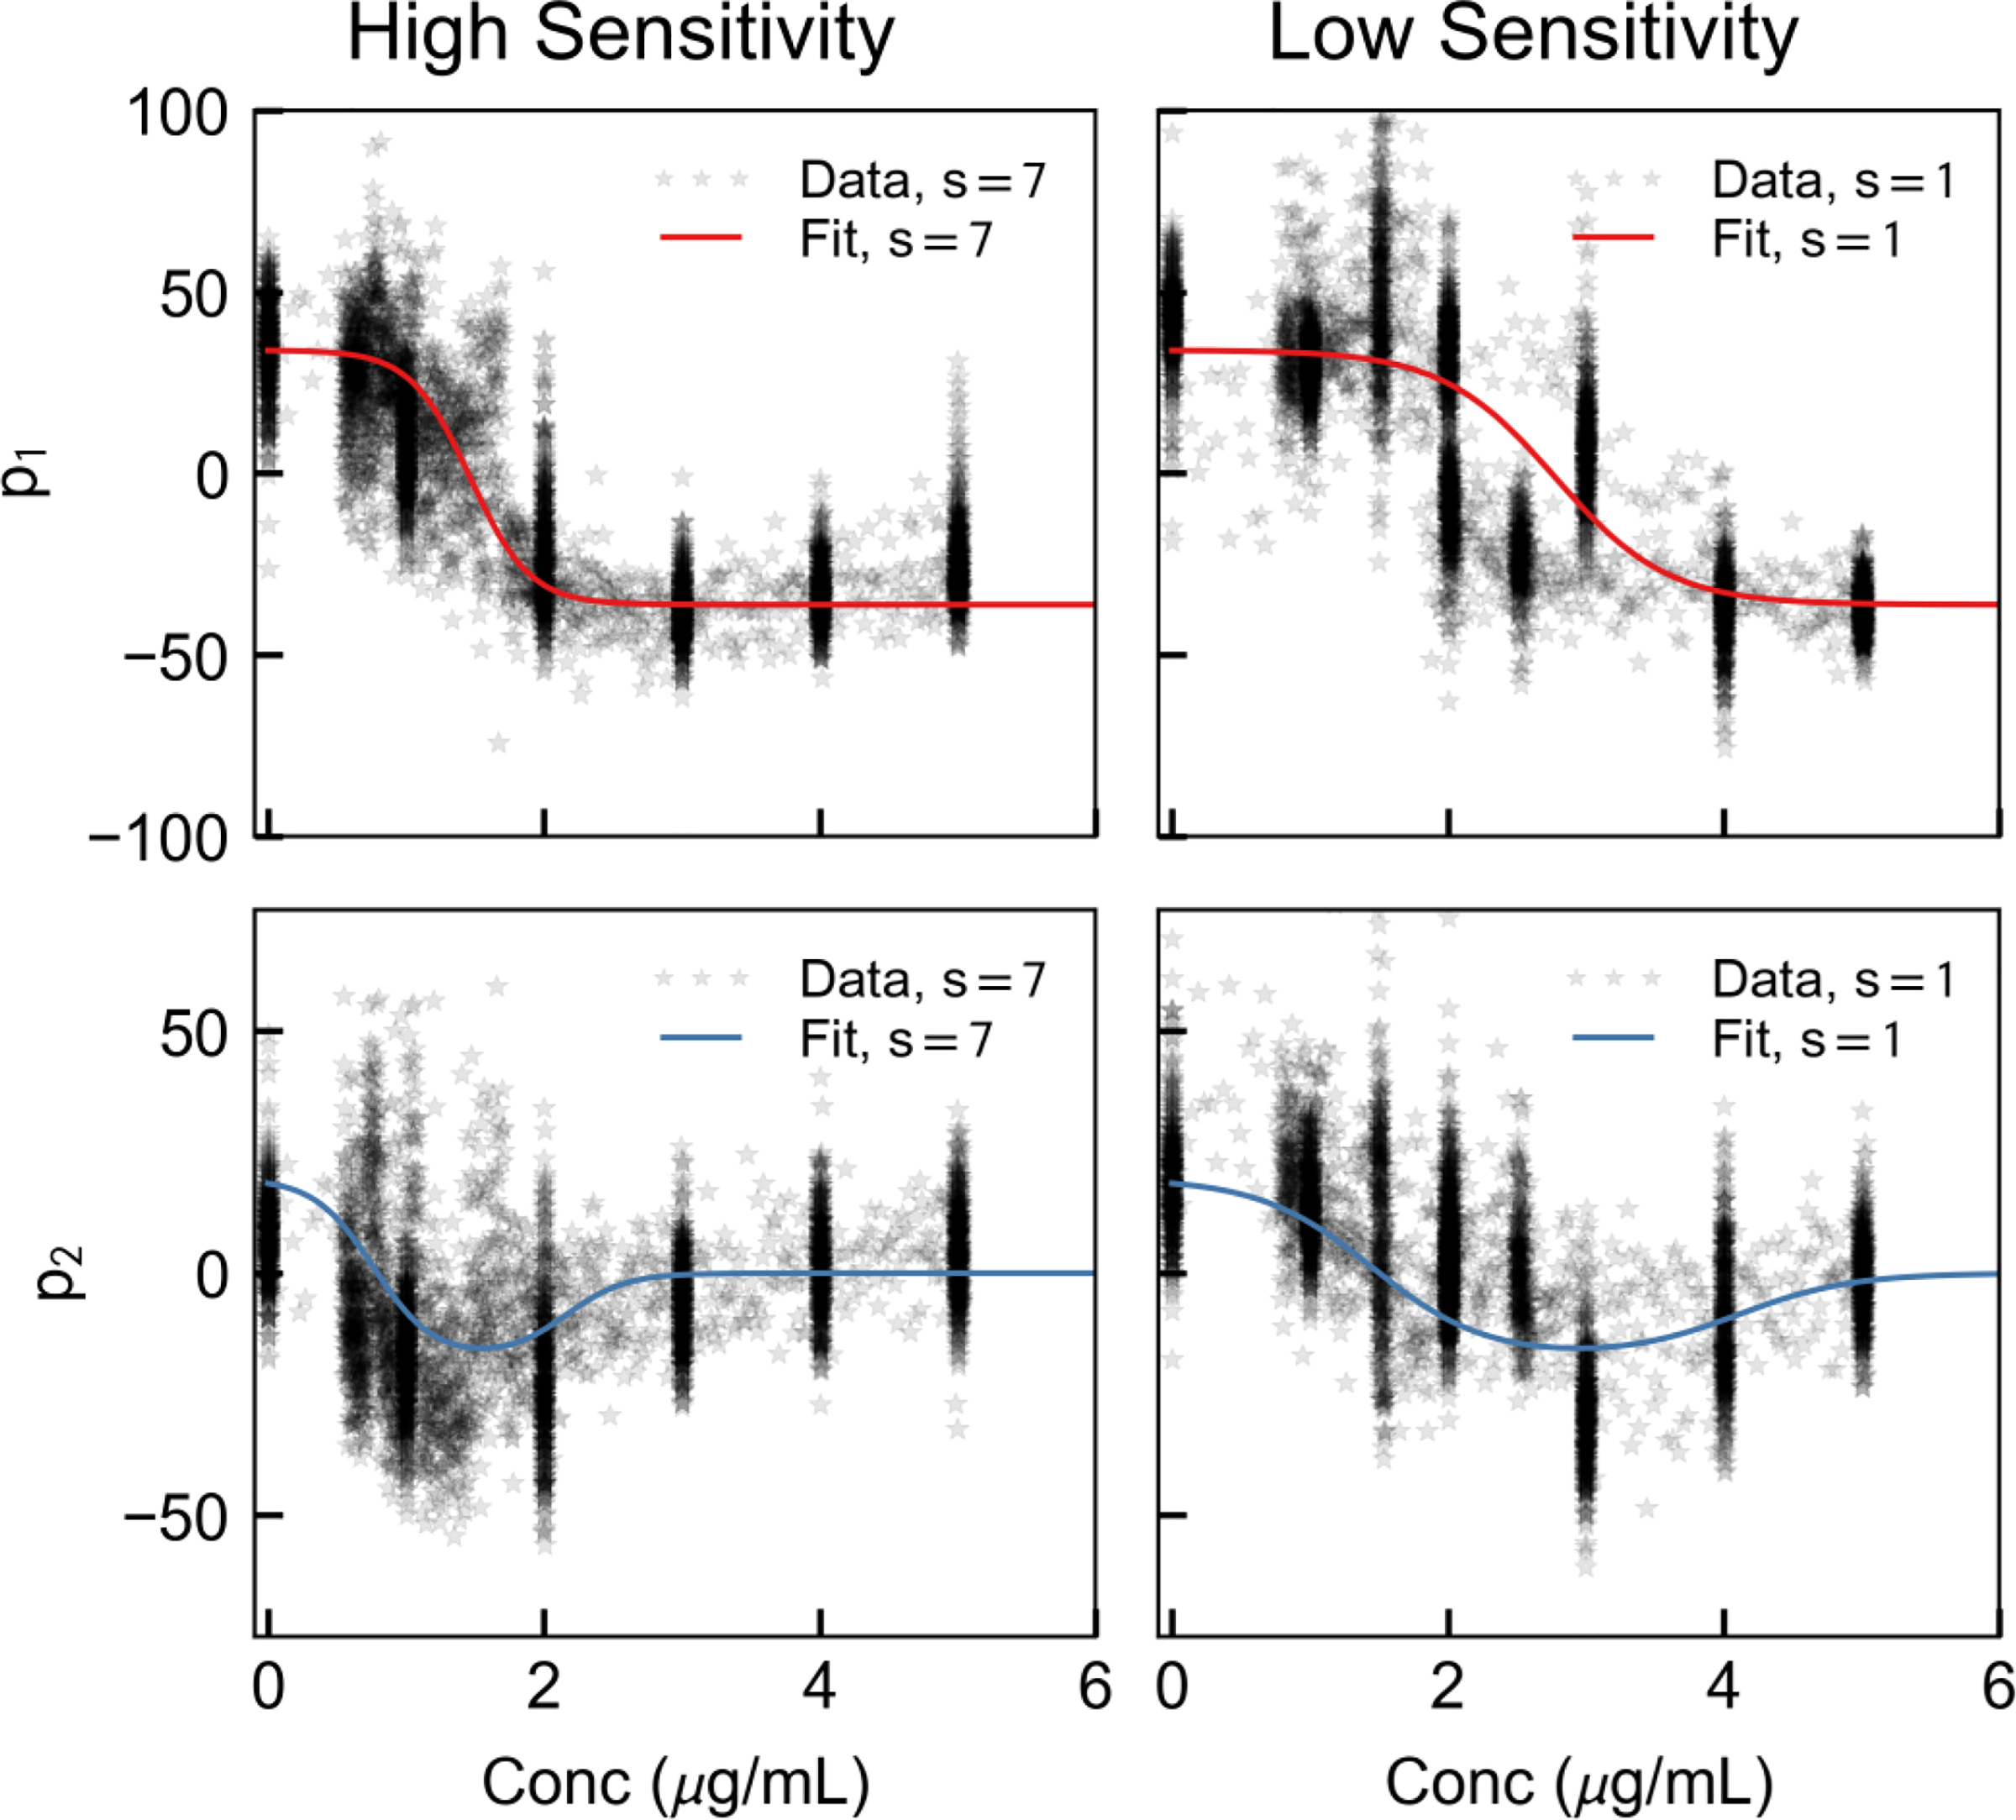
Example of two-dimensional control signal identified for two representative subjects, one with a high anesthetic sensitivity (left, k7 = 4.63) and one with a low anesthetic sensitivity (right, k1 = 2.44).
By parameterizing h1 and h2 and taking the derivative, we found an analytic form of dp/dt which depends on the anesthetic sensitivity.
By inspection, we postulated that these functions may be captured with logistic equations, specifically:
| (8) |
Thus, parameter set , parameter set , and patient-specfic parameter set .
We used a least-squares fitting to parameterize h, that is:
| (9) |
This optimization resulted in parameters
| (10) |
as shown in Figure 4. Finally, taking dh/dc yields our PD control model in differential equation form:
| (11) |
We note that ks is still a subject-specific parameter which we do not know a priori. Luckily, we may estimate and update this parameter in the same way an anesthesiologist may adjust dosing to determine an individual’s anesthetic sensitivity.
2.3. Incorporating pharmacokinetics
There are numerous PK models used under varying circumstances in the operating room [Absalom et al., 2009; Barakat et al., 2007; Levitt and Schnider, 2005; Schnider et al., 1998, 1999]. These are most generally two- or three-compartment models, but may be increasingly complicated and multicompartmental. Model parameters are also typically a function of patient body mass and age [Schnider et al., 1998, 1999]. The model from Schnider et al. [1999] was used in Purdon et al. [2013] to provide the c values we have used in this study, directly supporting the utility of this approach in conjunction with the methods we have developed. For our control implementation here, we used the same four-compartment PK model from Schnider et al. [1998, 1999] and used in Chakravarty et al. [2017]:
| (12) |
where u is the anesthetic infusion concentration, c1,2,3 are non-effect compartment concentrations, and c is the effect site concentration all in μg/mL. We used parameters corresponding to a 24 year old female patient with a mass of 65kg and a height of 163cm. We note that this would be replaced with a model parameterized by patient characteristics in a real-world implementation.
3. IMPLEMENTATION OF CONTROL
3.1. Formulating the control problem
The model developed in the prior sections may now be used to formulate an in silico control problem to test the feasibility of this approach. The nonlinear nature of the control equations lends itself to a nonlinear model predictive control (NMPC) approach. NMPC has been used in biological applications previously, with good successes [Abel et al., 2019; Dassau et al., 2017]. In this case, we set desired p = [p1, p2] and control the system to remain stably at those values. In the future, the desired p values may be selected by training classifiers using the conscious state of the subject (e.g., sedation may correspond to one psed, whereas general anesthesia might correspond to another pga).
We still retain the problem of the unspecified ks. In practice, a standard induction bolus is given to each patient, and the dosing is then modified depending upon how the patient responds. In the same manner, we may initialize the controller with a set ks value, and update this value as we observe how the system responds. One possible marker for identifying ks is the zero-cross of p2 (PC3), as it varies systematically with k and is observed prior to deep unconsciousness. Figure 5 shows the relationship between the observed zero-cross of PC3 and k, given the parameterization we have previously identified.
Fig. 5.
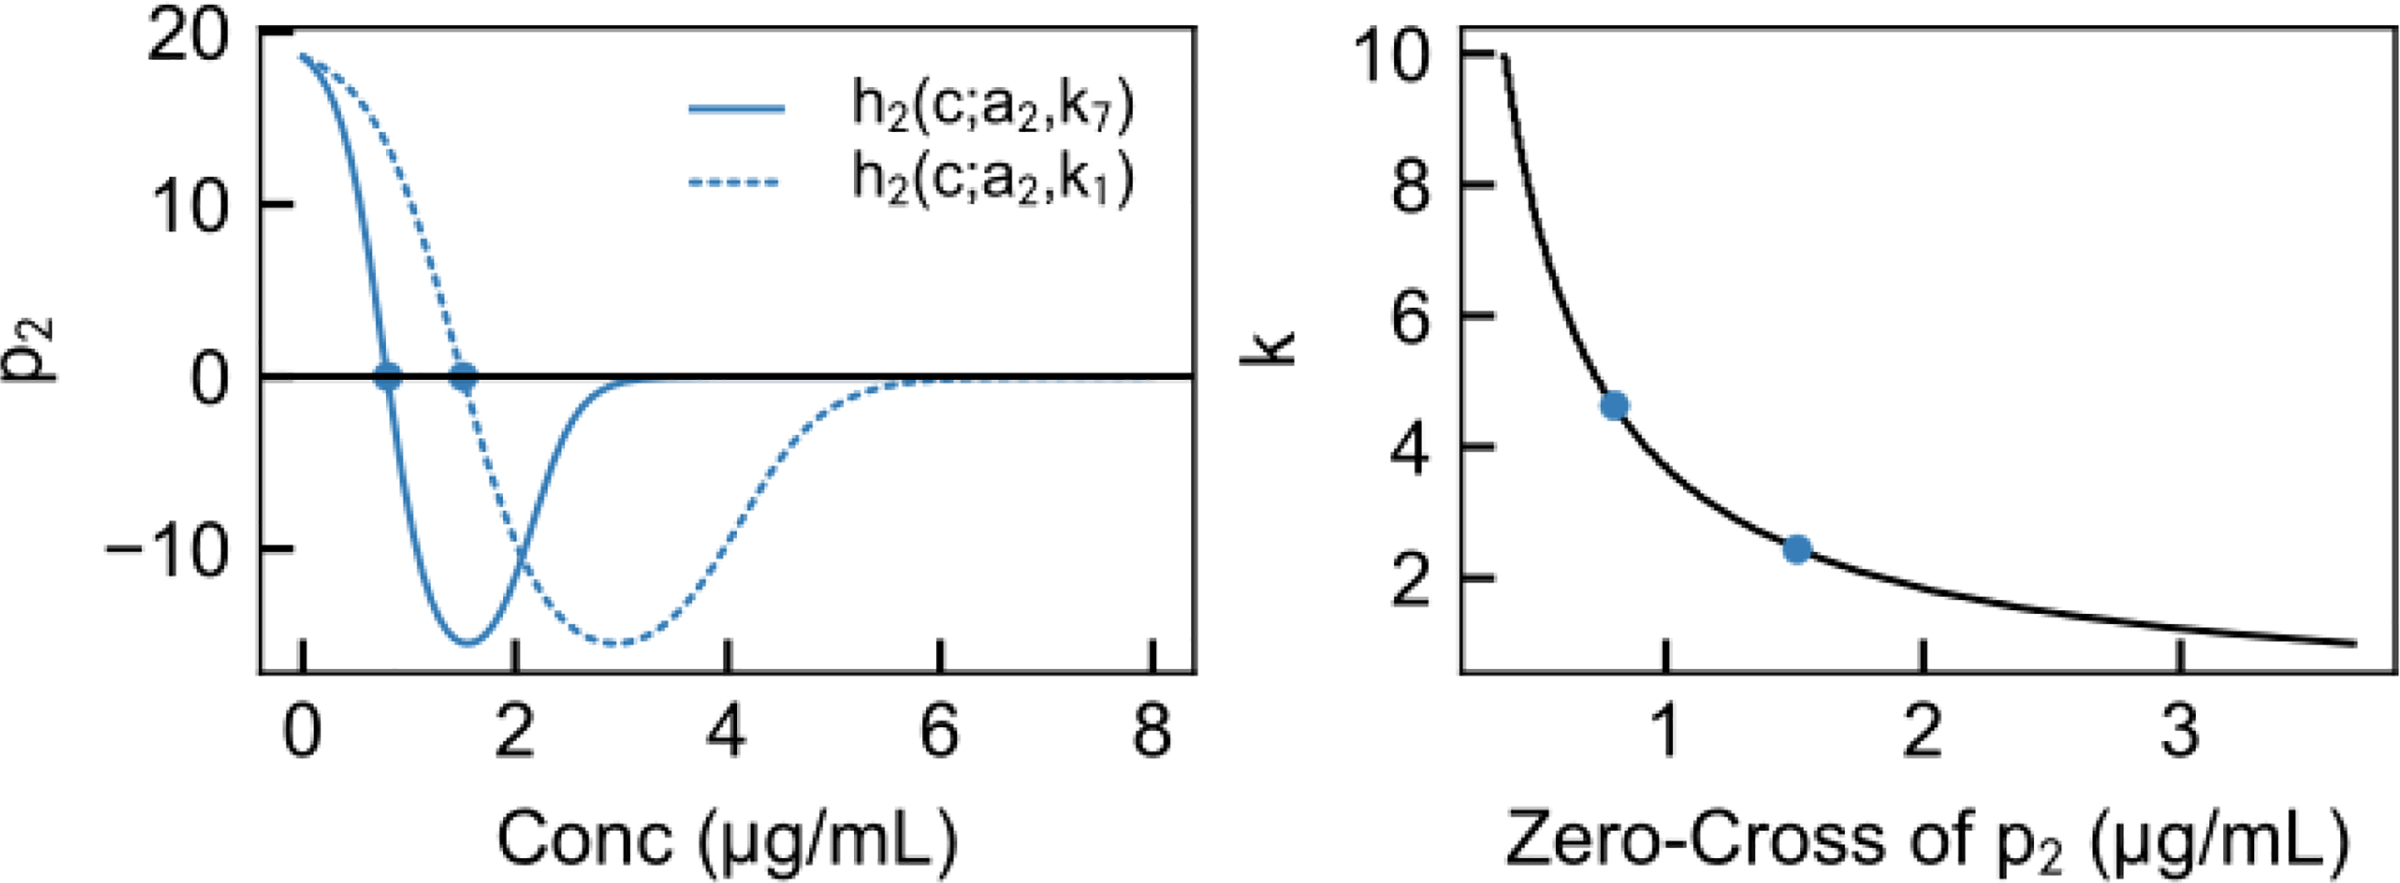
Finding ks is enabled by the dependence of the zero-cross of p2 on ks. Left, h2(c; a2, ks) is plotted for two values of ks. The initial zero-cross of these depends upon ks. Given the parameterization of h we have developed, the relationship between ks and the PK effect-site concentration at the predicted zero-cross of p2 is shown here. Thus, by updating the controller parameterization when p2 is observed to cross zero, we may attain individualized control.
The state of the patient updates every 2 s, given the multitaper parameters we have selected. Anesthetic infusion pumps update more infrequently, so we parameterized u as piecewise-constant with 10 s steps with control input bounded on [0, umax]. The anesthetic takes several minutes to deliver its effect, and so we used control and prediciton horizons of 300s (M = 30 steps of 10 s) with the predicted value ppred computed at the end of each of the steps. We initialized the model with an initial sensitivity kinit = 2 and update this sensitivity once p2 crosses zero. The predicted states starting at time t0 are given by integrating Eqn. (11) forward 10 s at a time.
| (13) |
where is the value at the end of the previous step and is the current observed state of the system. We denote the current estimate of ks as ke, which is initialized at a value of kinit = 2 and updated following the zero-cross of p2.
Thus, we formulated the NMPC finite-horizon optimal control problem for finding the optimal control over the predictive horizon as follows:
| (14) |
where wp = 1, wu = 0.0001 to scale the minimization and umax = 10mg/kg/min. We chose pga = h(10; a, kinit) because this corresponds to where the system is definitely unconscious (projected value for a high effect site concentration). We are prevented from overdosing the patient (the trivial solution to ensuring unconsciousness) by the tunable control input penalty and the restriction on pump concentration rate.
We applied this NMPC controller to a model of the system given by:
| (15) |
and note that we have isolated system-model mismatch to the k parameter and ignored measurement noise. Further testing would be needed to determine robustness of this approach to other parameter errors and observer design.
3.2. Two in silico examples
First, we simulated an example where the individual is more sensitive to the anesthetic than the initial sensitivity ks = 2kinit. The risk in such a case is unintentional overdosing of a patient. This can be avoided by simple bounds on control input u, which may be relaxed or tightened after ks is found. Next, we simulated an example where the individual is less sensitive to the anesthetic than the initial sensitivity ks = 0.75kinit. The risk in such a case is underdosing of anesthesia and the patient retaining consciousness.
The results of these simulations are shown in Figure 6. We found that this controller design performs well in generating a signal corresponding to unconsciousness in our model without excess or insufficient delivery of the anesthetic, i.e., it is sensitive to patient characteristics. Both ks values (1.5, 4.0) are extremes near the range observed in the clinical study of healthy volunteers. A large difference in effect-site concentration between these two cases (despite all patient characteristics remaining identical) resulting in the same PD underlines the need for PD-based control, rather than simple control of plasma or effect-site concentration. Further testing of response to signal noise, system-model mismatch, and disturbance rejection is necessary, however, these simple examples provide a proof-of-concept.
Fig. 6.
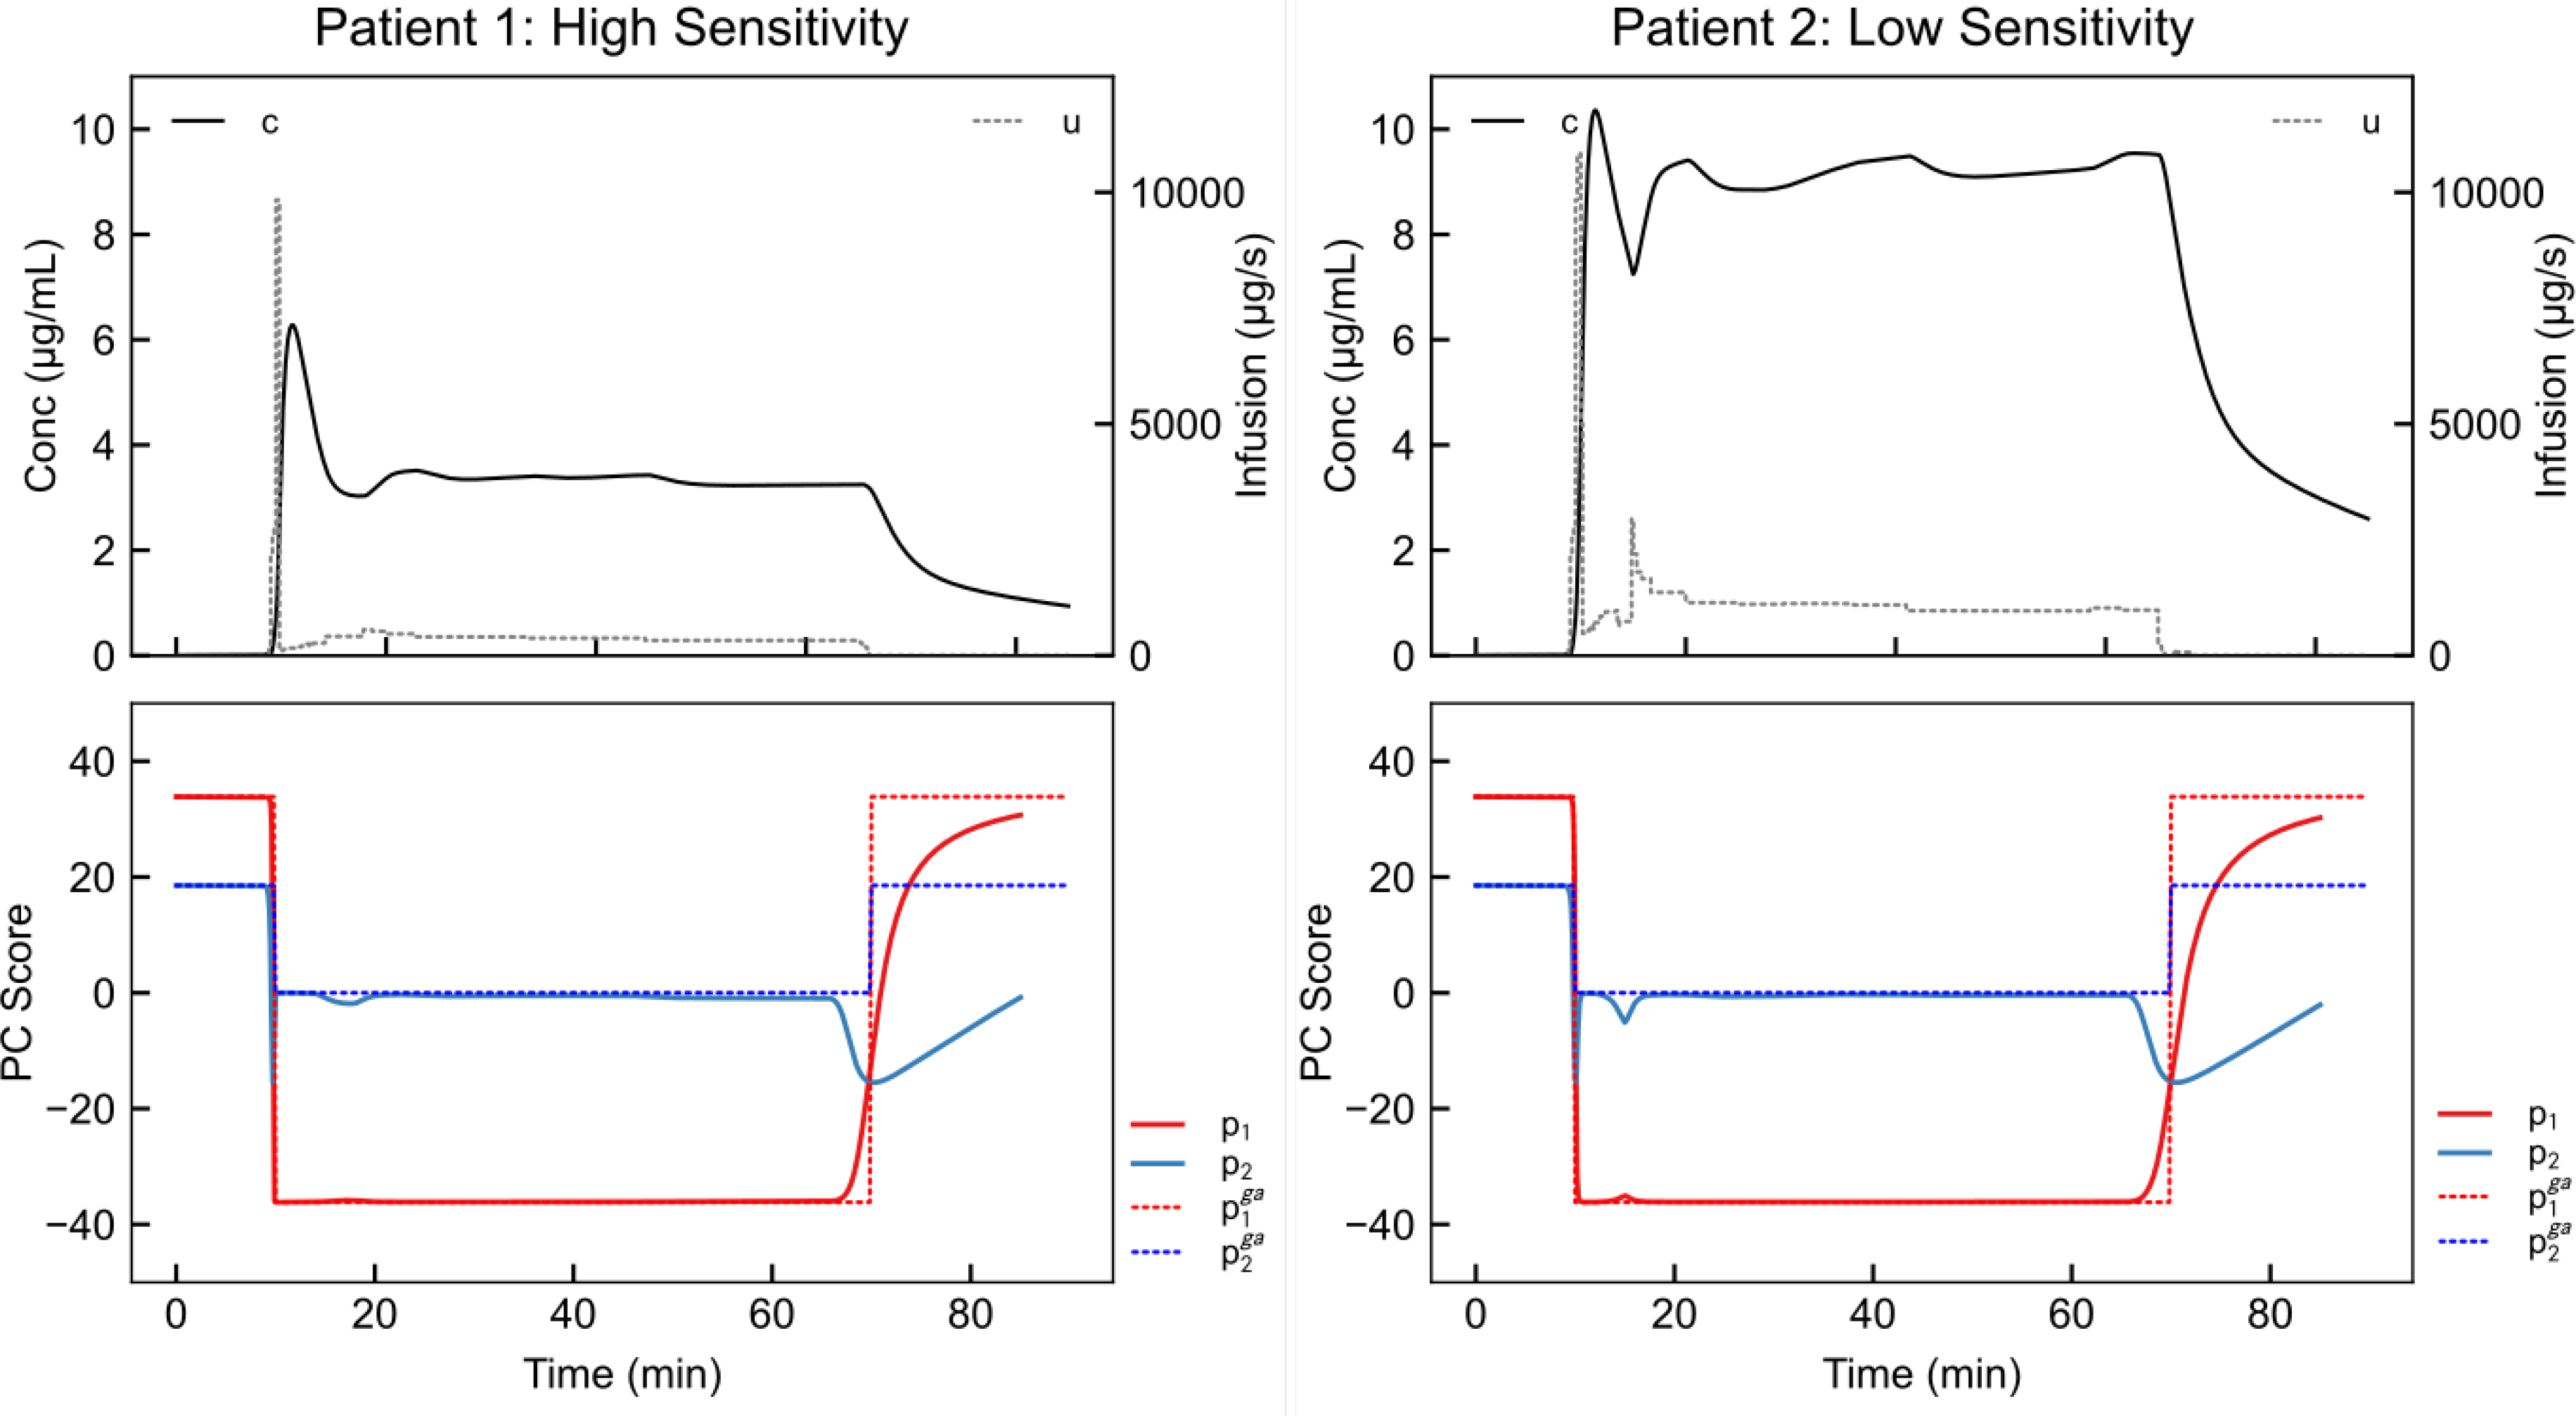
NMPC results for high anesthetic sensitivity ks = 2kinit (left), and low anesthetic sensitivity, ks = 0.75kinit (right). In this simulation, the set point moves from conscious (first ten minutes) to unconscious (next 60 minutes) to conscious (final 20 minutes). The controller in each case responds by inducing unconsciousness starting at the 10 minute mark. Furthermore, it correctly maintains unconsciousness using a lower anesthetic dose in the high-sensitivity patient.
4. DISCUSSION
Several additional steps should be taken to validate the control signal we have selected. First, the signal should be analyzed in clinical cases to determine if it follows the same dynamics in the presence of other drugs that may affect EEG. Additionally, there are deeper states of anesthesia, such as burst-suppression, which should be avoided if they are not clinically desired [Brown et al., 2010]. Currently, the controller avoids deeper-than-needed anesthesia by minimizing the control input needed to attain the depth of anesthesia setpoint, however, if the control signal continues to evolve as anesthesia deepens, a control signal corresponding to burst-suppression may be avoided explicitly. Characterization of these states may be achieved using data recorded during clinical administration of anesthesia in the operating room [Purdon et al., 2015]. Running the controller retroactively on EEG recorded during clinical cases and comparing controller suggestions with anesthesiologist action is a reasonable next step in testing the control system we have presented. We note that observer design will also be important in applying control in this fashion.
Despite these barriers, there are two main benefits to using NMPC to control this system in comparison to linear-quadratic regulator or proportional-integral-derivative controllers. First, NMPC does not attempt to use a linear approximation of model dynamics, and therefore requires less simplification of the complex underlying neural system. Second, safety mechanisms may be readily implemented in NMPC. We anticipate that a clinical NMPC system would involve safety features such as anesthesia-on-board constraints to prevent overdosing (as in Ellingsen et al. [2009]) and modifying controller responsiveness via confidence indexes (as in Laguna Sanz et al. [2017]; Pinsker et al. [2018]).
Significant barriers remain to realizing closed-loop control of general anesthesia in clinical settings [Absalom et al., 2011]. By developing physiologically interpretable PD models of anesthesia, we seek to bridge the gap in understanding between the anesthesiologist and the controls engineer.
Acknowledgments
This research was supported by the National Institutes of Health grants T32 HLO9701 and F32 AG064886 (to JHA). This work has been accepted by IFAC for publication ©IFAC 2020.
REFERENCES
- Abel JH, Chakrabarty A, Klerman EB, and Doyle FJ III (2019). Pharmaceutical-based entrainment of circadian phase via nonlinear model predictive control. Automatica, 100, 336–348. [DOI] [PMC free article] [PubMed] [Google Scholar]
- Absalom AR, Mani V, De Smet T, and Struys MMRF (2009). Pharmacokinetic models for propofoldefining and illuminating the devil in the detail. British Journal of Anaesthesia, 103(1), 26–37. [DOI] [PubMed] [Google Scholar]
- Absalom AR, De Keyser R, and Struys MM (2011). Closed loop anesthesia: Are we getting close to finding the holy grail? Anesthesia and Analgesia, 112(3), 516–518. [DOI] [PubMed] [Google Scholar]
- Barakat AR, Sutcliffe N, and Schwab M (2007). Effect site concentration during propofol TCI sedation: A comparison of sedation score with two pharmacokinetic models. Anaesthesia. [DOI] [PubMed] [Google Scholar]
- Brown EN, Lydic R, and Schiff ND (2010). General Anesthesia, Sleep, and Coma. New England Journal of Medicine, 363(27), 2638–2650. [DOI] [PMC free article] [PubMed] [Google Scholar]
- Chakravarty S, Nikolaeva K, Kishnan D, Flores FJ, Purdon PL, and Brown EN (2017). Pharmacodynamic modeling of propofol-induced general anesthesia in young adults. 2017 IEEE Healthcare Innovations and Point of Care Technologies, HI-POCT 2017, 2017 Decem, 44–47. [DOI] [PMC free article] [PubMed] [Google Scholar]
- Ching S, Liberman MY, Chemali JJ, Westover MB, Kenny JD, Solt K, Purdon PL, and Brown EN (2013). Real-time Closed-loop Control in a Rodent Model of Medically Induced Coma Using Burst Suppression. Anesthesiology, 119(4), 848–860. [DOI] [PMC free article] [PubMed] [Google Scholar]
- Dassau E, Renard E, Place J, Farret A, Pelletier MJ, Lee J, Huyett LM, Chakrabarty A, Doyle FJ III, and Zisser HC (2017). Intraperitoneal insulin delivery provides superior glycaemic regulation to subcutaneous insulin delivery in model predictive control-based fully-automated artificial pancreas in patients with type 1 diabetes: a pilot study. Diabetes, Obesity and Metabolism, 19(12), 1698–1705. [DOI] [PMC free article] [PubMed] [Google Scholar]
- Ellingsen C, Dassau E, Zisser H, Grosman B, Percival MW, Jovanovič L, and Doyle FJ III (2009). Safety Constraints in an Artificial Pancreatic β Cell: An Implementation of Model Predictive Control with Insulin on Board. Journal of Diabetes Science and Technology, 3(3), 536–544. [DOI] [PMC free article] [PubMed] [Google Scholar]
- Gentilini A, Frei C, Glattfedler A, Morari M, Sieber T, Wymann R, Schnider T, and Zbinden A (2001). Multitasked closed-loop control in anesthesia. IEEE Engineering in Medicine and Biology Magazine, 20(1), 39–53. [DOI] [PubMed] [Google Scholar]
- Haddad WM, Hayakawa T, and Bailey JM (2003). Adaptive control for non-negative and compartmental dynamical systems with applications to general anesthesia. International Journal of Adaptive Control and Signal Processing, 17(3), 209–235. [Google Scholar]
- Laguna Sanz AJ, Doyle FJ III, and Dassau E (2017). An Enhanced Model Predictive Control for the Artificial Pancreas Using a Confidence Index Based on Residual Analysis of Past Predictions. Journal of Diabetes Science and Technology, 11(3), 537–544. [DOI] [PMC free article] [PubMed] [Google Scholar]
- Levitt DG and Schnider TW (2005). Human physiologically based pharmacokinetic model for propofol. BMC Anesthesiology. [DOI] [PMC free article] [PubMed] [Google Scholar]
- Liu Y, Li M, Yang D, Zhang X, Wu A, Yao S, Xue Z, and Yue Y (2015). Closed-Loop Control Better than Open-Loop Control of Profofol TCI Guided by BIS: A Randomized, Controlled, Multicenter Clinical Trial to Evaluate the CONCERT-CL Closed-Loop System. PLOS ONE, 10(4), e0123862. [DOI] [PMC free article] [PubMed] [Google Scholar]
- Pinsker JE, Laguna Sanz AJ, Lee JB, Church MM, Andre C, Lindsey LE, Doyle FJ III, and Dassau E (2018). Evaluation of an Artificial Pancreas with Enhanced Model Predictive Control and a Glucose Prediction Trust Index with Unannounced Exercise. Diabetes Technology & Therapeutics, 20(7), 455–464. [DOI] [PMC free article] [PubMed] [Google Scholar]
- Purdon PL, Pavone KJ, Akeju O, Smith AC, Sampson AL, Lee J, Zhou DW, Solt K, and Brown EN (2015). The Ageing Brain: Age-dependent changes in the electroencephalogram during propofol and sevofluranegeneral anaesthesia. British Journal of Anaesthesia, 115, i46–i57. [DOI] [PMC free article] [PubMed] [Google Scholar]
- Purdon PL, Pierce ET, Mukamel EA, Prerau MJ, Walsh JL, Wong KFK, Salazar-Gomez AF, Harrell PG, Sampson AL, Cimenser A, Ching S, Kopell NJ, Tavares-Stoeckel C, Habeeb K, Merhar R, and Brown EN (2013). Electroencephalogram signatures of loss and recovery of consciousness from propofol. Proceedings of the National Academy of Sciences, 110(12), E1142–E1151. [DOI] [PMC free article] [PubMed] [Google Scholar]
- Rokem A, Trumpis M, and Perez F (2009). Nitime: time-series analysis for neuroimaging data. In Proceedings of the 8th Python in Science Conference, 68–75. [Google Scholar]
- Schnider TW, Minto CF, Gambus PL, Andresen C, Goodale DB, Shafer SL, and Youngs EJ (1998). The influence of method of administration and covariates on the pharmacokinetics of propofol in adult volunteers. Anesthesiology. [DOI] [PubMed] [Google Scholar]
- Schnider TW, Minto CF, Shafer SL, Gambus PL, Andresen C, Goodale DB, and Youngs EJ (1999). The influence of age on propofol pharmacodynamics. Anesthesiology. [DOI] [PubMed] [Google Scholar]
- Shanechi MM, Chemali JJ, Liberman M, Solt K, and Brown EN (2013). A Brain-Machine Interface for Control of Medically-Induced Coma. PLoS Computational Biology, 9(10). [DOI] [PMC free article] [PubMed] [Google Scholar]
- Soltesz K, Van Heusden K, Dumont GA, Hägglund T, Petersen CL, West N, and Ansermino JM (2012). Closed-loop anesthesia in children using a PID controller: A pilot study. IFAC Proceedings Volumes (IFAC-PapersOnline), 2(PART 1), 317–322. [Google Scholar]
- Thomson DJ (1982). Spectrum Estimation and Harmonic Analysis. Proceedings of the IEEE, 70(9), 1055–1096. [Google Scholar]
- Van Heusden K, Dumont GA, Soltesz K, Petersen CL, Umedaly A, West N, and Ansermino JM (2014). Design and clinical evaluation of robust PID control of propofol anesthesia in children. IEEE Transactions on Control Systems Technology, 22(2), 491–501. [Google Scholar]
- Yang Y, Lee JT, Guidera JA, Vlasov KY, Pei JZ, Brown EN, Solt K, and Shanechi MM (2019). Developing a personalized closed-loop controller of medically-induced coma in a rodent model. Journal of Neural Engineering, 16(3). [DOI] [PubMed] [Google Scholar]


