

Abstract
Background:
The ability to characterize and to quantify the extent of coronary artery disease has the potential to improve the prognostic capability of coronary computed tomography angiography. Although reproducible techniques have been described in those with mild coronary disease, this has yet to be assessed in patients with advanced disease.
Methods:
Twenty patients with known multivessel disease underwent repeated computed tomography coronary angiography, 2 weeks apart. Coronary artery segments were analysed using semi-automated software by two trained observers to determine intraobserver, interobserver and interscan reproducibility.
Results:
Overall, 149 coronary arterial segments were analysed. There was excellent intraobserver and interobserver agreement for all plaque volume measurements (Lin’s coefficient 0.95 to 1.0). There were no substantial interscan differences (P>0.05 for all) for total (2063±1246 mm3, mean of differences −35.6 mm3), non-calcified (1795±910 mm3, mean of differences −4.3 mm3), calcified (298±425 mm3, mean of differences −31.3 mm3) and low-attenuation (13±13 mm3, mean of differences −2.6 mm3) plaque volumes. Interscan agreement was highest for total and noncalcified plaque volumes. Calcified and low-attenuation plaque (−236.6 to 174 mm3 and −15.8 to 10.5 mm3 respectively) had relatively wider 95% limits of agreement reflecting the lower absolute plaque volumes.
Conclusion:
In the presence of advanced coronary disease, semi-automated plaque quantification provides excellent reproducibility, particularly for total and non-calcified plaque volumes. This approach has major potential to assess change in disease over time and optimize risk stratification in patients with established coronary artery disease.
Keywords: Atherosclerosis, quantitative plaque analysis, reproducibility, computed tomography coronary angiography, low-attenuation plaque
TOC Summary
Original research: We demonstrate the excellent reproducibility of semi-automated plaque quantification on computed tomography coronary angiography in a cohort of patients with advanced coronary artery disease. On a per patient level, intraobserver, interobserver and interscan correlations were excellent for total plaque volume and non-calcified plaque volume. Plaque quantification represents a robust approach for the assessment of disease progression and facilitates the optimisation of risk stratification in patients with established coronary artery disease.
1. INTRODUCTION
Coronary computed tomography angiography (CCTA) is often the imaging modality of choice for those suspected of having coronary artery disease due to its diagnostic accuracy, prognostic value and ability to guide evidence-based treatments.1,2 As technology has evolved, our ability to quantify the extent of coronary artery plaque has improved. Semi-automated software now facilitates the rapid assessment of coronary plaque subtype and burden which is comparable to that achieved with intravascular ultrasound.3 Recent studies have reported that quantitative evaluation of non-calcified plaque burden, particularly low-attenuation plaque, holds high prognostic value in identifying patients at risk of myocardial infarction.4 Serial imaging can be performed to monitor the extent and distribution of coronary atheroma such that there is a growing interest in the use of coronary plaque composition as a surrogate endpoint in randomised clinical trials.5 However, if this metric is to gain more widespread adoption, it is important to validate the precision of measurement on repeated testing.
Robust reproducibility for the quantitative analysis of plaque burden is essential for clinical application. Previous studies have reported excellent reproducibility with quantitative coronary plaque analysis in patients with a low burden of atheroma.6,7 However, as coronary artery disease becomes more advanced, extensive vascular calcification can cause blooming artefact and photon starvation which hinders assessment of the coronary lumen.8,9 Moreover, the scan-rescan reproducibility of low-attenuation non-calcified plaque, has not been established. As the residual risk of cardiovascular events is highest in patients with higher burdens of atherosclerosis, we sought to assess whether non-calcified plaque could be precisely quantified in patients with advanced coronary artery disease.
2. METHODS
2.1. Study Population
The study population was recruited from a randomized controlled trial using CCTA in patients with advanced coronary artery disease [NCT02110303], the results of which have been described previously.10 In brief, patients were eligible if they were over the age of 40 years and had angiographically proven multivessel coronary artery disease defined as at least 2 major epicardial vessels with either ≥50% luminal stenosis or previous revascularisation (percutaneous coronary intervention or coronary artery bypass graft surgery).
2.2. CCTA Image Acquisition
The CCTA image acquisition has been described previously.10 Briefly, patients underwent baseline CCTA (64-multidetector Biograph mCT, Siemens Medical Systems, Erlangen, Germany) after receiving 50 to 100 mg of oral metoprolol to achieve a heart rate of <65/min and 400 μg of sublingual glyceryl trinitrate. A contrast-enhanced CCTA was performed using prospective electrocardiogram gating, triggering in mid-diastole (60–75% R-R interval) during an expiratory breath-hold (Prospective CareKV, tube voltage of 100 kVp (body-mass index <25 kg/m2) or 120 kVp (body-mass index ≥25 kg/m2)). Scans were reconstructed using 180-degree rotation, 512 × 512 matrix and B26f reconstruction kernel with 0.75-mm slice thickness at 0.5-mm increments. Repeated scans were conducted using the same acquisition protocol within 2 weeks of the baseline scan.
2.3. CCTA Image Evaluation
CCTA data sets were anonymised and exported in Digital Imaging and Communications in Medicine (DICOM) format for measurement of coronary plaque. Plaque measurements were performed using semi-automated software (AutoPlaque, Version 2.5, Cedars-Sinai Medical Center, Los Angeles, USA, Figure 1) by two trained observers. AutoPlaque has previously been validated against intravascular ultrasound.3
Figure 1:

[A] Analysis of plaque burden in the left main stem of a 76-year-old male. [B] Vessel wall delineated in red dotted line. [C] Once vessel wall confirmed (green dotted line) and calcified plaque identified (in yellow), vessel lumen delineated in blue [D] Result of analysis with non-calcified plaque volume of 231.5 mm3 (highlighted in red) and calcified plaque volume of 12.0 mm3 (highlighted in yellow)
Coronary artery centerlines were extracted using a semi-automated method. A region of interest was placed in the proximal aorta to define blood pool attenuation. Where possible, the entire length of each major artery was extracted as well as major tributary branches with visible disease. Coronary artery segments were manually defined by each observer independently, using side-branches to mark progression from proximal to distal segments consistently across both scans according to the Society of Cardiovascular Computed Tomography (SCCT) guidelines.11 The length of the distal segment was dependent on vessel diameter with a 2-mm minimum threshold for inclusion.12 Stented segments and graft insertion points were excluded from the final analysis.
Image quality was deemed excellent if every coronary artery was clearly visualised, good if one or more artery had artefact that made analysis suboptimal (requiring multiple or manually generated centerlines), limited if one or more artery could not be analysed, and unanalysable if none of the arteries could be analysed. If a segment or an artery was deemed too poor to analyse in the baseline scan, it was excluded from analysis in the repeat scan, and vice versa. Two blinded observers independently analysed all scans. One observer analysed the baseline scans twice, 3 months apart, in random order to minimise recall bias.
The vessel lumen, wall and plaque constituents were automatically detected with manual adjustments performed where required. Scan-specific Hounsfield unit (HU) thresholds were applied to define non-calcified and calcified plaque constituents as described previously.13,14 Low-attenuation plaque was defined by a fixed attenuation of <30 HU as this demonstrates the best correlation with intravascular ultrasound.15 For each patient, plaque volume (mm3) and burden (normalized to the vessel volume, as a percentage) were calculated for total, non-calcified, calcified and low-attenuation plaque subtypes, as well as diameter stenosis and the maximal remodelling index.
2.4. Statistical Analysis
Data are expressed as mean ± standard deviation or mean (95% confidence interval) for continuous variables or median [interquartile range] where not normally distributed. Categorical variables are presented as number (percentage). Data were analysed by paired two-sided t-tests, linear regression analysis and Lin’s concordance correlation coefficients. Repeatability coefficient was defined as 1.96 x the standard deviation of the differences. Coefficient of variation was defined as the average of means divided by the standard deviation of mean difference. Reproducibility was determined using Bland-Altman analysis and bias (mean difference) is presented alongside 95% limits of agreement (95% confidence intervals). Statistical analysis was performed using GraphPad Prism (Version 8.0, GraphPad Software, San Diego, California, USA). Two-sided P-value <0.05 was considered to be statistically significant.
3. RESULTS
Study participants were predominantly male (n=17; 85%) with a mean age of 69±7 years (Table 1). All but one participant had previously undergone either percutaneous coronary intervention or coronary artery bypass graft surgery. The mean time between CCTA scans was 12±4 days and heart rate at baseline and during interval scanning were comparable (57±8 and 57±10/min respectively, Table 2). The median calcium score was 371 [154–1183] Agatston units. Two participants were excluded from the final analysis due to inadequate image quality of one of the paired scans. Branches without visible disease were not analysed, as such, from a total of 177 potential paired segments, 149 (84%) were analysed, the remaining 28 pairs were excluded either due to poor image quality or stent placement.
Table 1:
Participant Characteristics
| Number of patients (n=20) | |
|---|---|
| Mean age (years) | 69 ± 7 |
| Male | 17 (85%) |
| Hypertension | 14 (70%) |
| Hypercholesterolaemia | 20 (100%) |
| Diabetes | 2 (10%) |
| Peripheral vascular disease | 1 (5%) |
| Family history of CHD | 12 (60%) |
| Previous acute coronary syndrome | 13 (65%) |
| Previous percutaneous coronary stenting | 13 (65%) |
| Coronary artery bypass graft | 9 (45%) |
Mean ± standard deviation or number (%)
Table 2:
Scan characteristics
| Number of patients (n=20) | |
|---|---|
| Time between scans (days) | 12 ± 4 |
| Heart rate at baseline scan | 57 ± 8 |
| Heart rate at interval scan | 57 ± 10 |
| Difference of heart rate | 4 ± 3 |
| Median coronary calcium score (Agatston) | 371 (154–1183) |
| Image quality – Excellent | 10 (50%) |
| Image quality – Good | 5 (25%) |
| Image quality – Limited | 3 (15%) |
| Image quality – Unanalysable | 2 (10%) |
| Total patients analysed | 18 |
| Total segments analysed | 149 |
Mean ± standard deviation, number (%), or median (interquartile range)
3.1. Intraobserver Repeatability
There were no differences between mean volumes for total, non-calcified and calcified plaque on repeated analysis by the same observer, (p = 0.29, 0.28 and 0.68 respectively, Table 3). The mean volume of low-attenuation plaque was 13±13 mm3 on the first analysis and 12±13 mm3 on the second (mean difference −1.6 mm3, p=0.02). Correlation was excellent for all plaque volume measurements with Lin’s concordance correlation coefficient ranging from 0.97 to 1.0. The coefficients of variation were 2.6%, 3.3%, 4.1% and 21.4% for total, non-calcified, calcified and low-attenuation plaque volumes. Per patient repeatability coefficient ranged between 5.2 and 114.1 mm3. Bland Altman plots highlighting limits of agreement (Figure 2) demonstrate the excellent intraobserver agreement throughout plaque subtypes.
Table 3:
Intraobserver, Interobserver and Scan-Rescan variability of per patient plaque volume measurements.
| Intraobserver Variability | Observation 1 | Observation 2 | LCC (95% CI) | Mean difference | P value | Bland-Altman 95% LoA (95% CI) | CoR |
|---|---|---|---|---|---|---|---|
| Total Plaque (mm3) | 2063 ± 1246 [1443–2683] |
2077 ± 1260 [1450–2704] |
1.0 (1.0 – 1.0) |
14.1 | 0.29 | −93 (−155, −58) to +121 (87, 183) |
107.0 |
| Non-calcified Plaque (mm3) | 1765 ± 910 [1312–2217] |
1780 ± 921 [1322–2238] |
1.0 (1.0 – 1.0) |
15.4 | 0.28 | −99 (−165, −62) to +129 (93, 196) |
114.1 |
| Calcified Plaque (mm3) | 298 ± 425 [87–510] |
297 ± 425 [86–508] |
1.0 (1.0 – 1.0) |
−1.2 | 0.68 | −25 (−39, −17) to +23 (15, 36) |
23.7 |
| Low-attenuation Plaque (mm3) | 13 ± 13 [7–20] |
12 ± 13 [5–18] |
0.97 (0.93 – 0.99) |
−1.6 | 0.02 | −7 (−9, −5) to +4 (1, 6) |
5.2 |
| Interobserver Variability | Investigator 1 | Investigator 2 | LCC (95% CI) | Mean difference | P value | Bland-Altman 95% LoA (95% CI) | CoR |
| Total Plaque (mm3) | 2063 ± 1246 [1443–2683] |
1985 ± 1161 [1443–2683] |
0.97 (0.93 – 0.99) |
−74.2 | 0.24 | −615 (−927, −442) to +459 (286, 770) |
537.0 |
| Non-calcified Plaque (mm3) | 1765 ± 910 [1312–2217] |
1688 ± 803 [1289–2087] |
0.95 (0.88 – 0.98) |
−76.5 | 0.24 | −594 (−894, −428) to +441 (275, 742) |
517.6 |
| Calcified Plaque (mm3) | 298 ± 425 [87–510] |
297 ± 432 [82–512] |
1.0 (0.99 – 1.0) |
−1.7 | 0.84 | −69 (−97, −41) to 66 (38, 94) |
67.5 |
| Low-attenuation Plaque (mm3) | 13 ± 13 [7–20] |
14 ± 12 [8–20] |
0.90 (0.76 – 0.96) |
1.2 | 0.39 | −10 (−14, −5) to +12 (8, 17) |
11.0 |
| Scan-Rescan Variability | Baseline Scan | Repeat Scan | LCC (95% CI) | Mean difference | P value | Bland-Altman 95% LoA (95% CI) | CoR |
| Total Plaque (mm3) | 2063 ± 1246 [1443–2683] |
2027 ± 1223 [1419–2635] |
0.98 (0.94 – 0.99) |
−35.6 | 0.56 | −531 (−735, −328) to 460 (257, 664) |
495.7 |
| Non-calcified Plaque (mm3) | 1765 ± 910 [1312–2217] |
1760 ± 928 [1299–2221] |
0.97 (0.93 – 0.99) |
−4.3 | 0.93 | −418 (−587, −248) to +409 (239, 579) |
413.4 |
| Calcified Plaque (mm3) | 298 ± 425 [87–510] |
267 ±377 [79–455] |
0.96 (0.91 – 0.98) |
−31.3 | 0.22 | −237 (−321, −152) to +174 (90, 258) |
205.2 |
| Low-attenuation Plaque (mm3) | 13 ± 13 [7–20] |
10 ±13 [4–17] |
0.85 (0.64 – 0.94) |
−2.6 | 0.11 | −16 (−21, −10) to +11 (5, 16) |
13.1 |
Mean ± standard deviation [95% confidence interval], LCCC – Lin’s concordance correlation coefficient (95% confidence interval), LoA – Limits of agreement (95% confidence interval), CoR - coefficient of repeatability.
Figure 2: Intraobserver variability:

Panel [A–D] Bland-Altman plots demonstrating 95% limits of agreement.
3.2. Interobserver Reproducibility
There were no differences between mean volumes for total, non-calcified, calcified and low-attenuation plaque volumes when comparing analysis done by two independent investigators (p = 0.24, 0.24, 0.84 and 0.39 respectively, Table 3). There was excellent correlation for total, non-calcified and calcified plaque volumes measurements, Lin’s coefficient 0.97, 0.95 and 1.0 for total, non-calcified and calcified plaque volumes respectively. Correlation was modest with low-attenuation plaque volumes, Lin’s coefficient 0.90. The coefficients of variation were 13.5%, 15.3%,11.6% and 41.0% for total, non-calcified, calcified and low-attenuation plaque volumes. Per patient repeatability coefficients ranged from 11 to 537 mm3. Bland Altman plots (Figure 3) highlight excellent agreement particularly for total and non-calcified plaque volumes. Agreement was lower for low-attenuation plaque volume with 95% limits of agreement ranging from −9.9 to +12.2 mm3.
Figure 3: Interobserver variability:
Panel [A–D] Bland-Altman plots demonstrating 95% limits of agreement.
3.3. Interscan Reproducibility and Coronary Characteristics
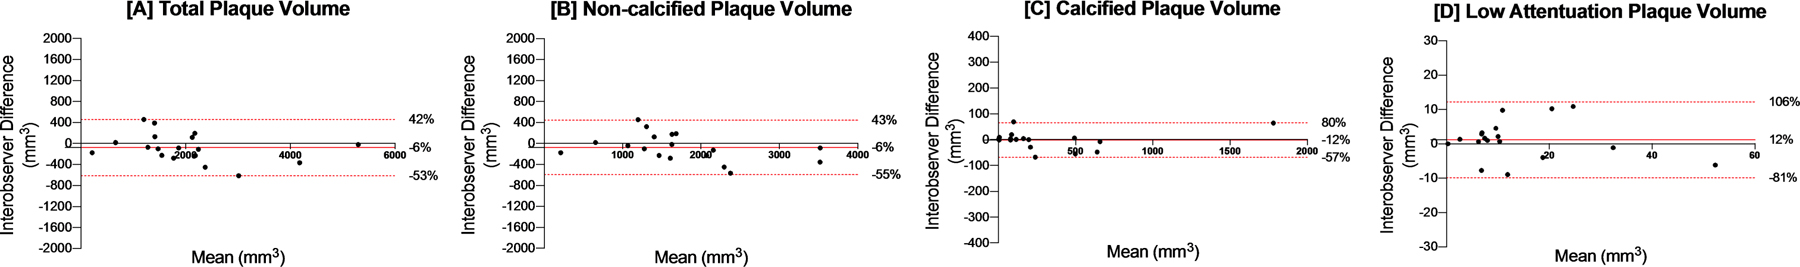
The mean total plaque volume was similar on the baseline and repeated scan (2063±1246 and 2027±1223 mm3 respectively, p = 0.56). Similarly, no difference was noted between mean plaque volume for non-calcified, calcified and low-attenuation plaque volume (Table 3). Correlations for plaque volumes were excellent for total, non-calcified and calcified plaque volumes (Lin’s coefficient 0.98, 0.97 and 0.96 respectively) but lower for low-attenuation plaque (Lin’s coefficient 0.85). The 95% limits of agreement were narrow for total plaque volume and non-calcified plaque volume but wider for calcified plaque (−236.6 to +174 mm3) and for low-attenuation plaque (−15.8 to +10.5 mm3) (Figure 4). The coefficients of variation were 12.4%, 12.0%, 37.0% and 56.8% for total, non-calcified, calcified and low-attenuation plaque volumes respectively. Per patient repeatability coefficients ranged from 13 to 496 mm3.
Figure 4: Interscan reproducibility:

Panel [A–D] Bland-Altman plots demonstrating 95% limits of agreement.
4. DISCUSSION
In this scan-rescan reproducibility study of patients with advanced coronary artery disease, we have demonstrated that coronary plaque volume can be precisely quantified using semi-automated analysis software. Non-calcified plaque has excellent inter- and intraobserver agreement and scan-rescan reproducibility. Low-attenuation plaque and calcified plaque performed less well on repeated testing with narrow absolute but wide relative 95% limits of agreement. Thus, semi-automated plaque volume quantification is a robust and reproducible method that could be used as valuable and precise measure of disease burden and disease progression in patients with advanced coronary disease.
The current standard for the assessment of coronary atherosclerosis using CCTA requires visual assessment of luminal stenosis severity alongside plaque characterization (calcified, non-calcified or mixed).11 Whilst these factors are undoubtedly important, recent studies have highlighted the incremental prognostic value of quantifying subtypes of atherosclerotic plaque.12,16–18 Previous iterations of plaque quantification software were time consuming and have limited their widescale applicability.19 In recent years, the use of a more rapid semi-automated analysis of plaque has expanded and provides a reproducible analytical method, especially when used in patients with a relatively low disease burden.6,7 However, as disease burden increases, the prominence of coronary calcification rises and the overall image quality is often suboptimal. Our study established that despite these factors, semi-automated plaque analysis remained reliable and reproducible, particularly for measuring non-calcified plaque.
In our study cohort, all patients had multivessel disease and 95% had previous coronary revascularisation. Within a two-week window, scans were performed prospectively at the same site using identical reconstruction protocols to ensure consistency. The quality of acquired images was variable, with only 50% being deemed acceptable despite excellent heart rate control at both baseline and interval scans.20 This is perhaps unsurprising considering the high coronary calcium score, extensive use of coronary revascularisation, and the advanced nature of the coronary artery disease. Reflecting this advanced disease, plaque volumes were at least 5 times larger than in any other previous reproducibility study performed to date. The highest mean total plaque volume reported by Schuhbaeck and colleagues in their study of observer variability was only 399±247 mm3 compared to our 2063±1246 mm3.6
Previous studies have established that the assessment of stenosis severity on CCTA has excellent agreement between observers.21 However, the observer variability of visual plaque analysis appears to be poor.22 Quantitative plaque analysis removes many of the limitations of visual assessment, and has been shown to be reproducible in patients with low and intermediate disease severity. Ovrehus et al showed excellent scan-rescan, interobserver and intraobserver agreement for the quantitative assessment of non-calcified and calcified plaque volumes.7 Tzolos et al similarly showed excellent intraobserver and interobserver repeatability for the assessment of non-calcified plaque burden.23 However, these studies involved patients with less severe coronary artery disease and lower total plaque volumes. Our study adds to this literature by establishing that the observer and scan-rescan agreement for total and non-calcified plaque volume persists in patients with advanced coronary artery disease.
The narrow absolute and wide relative limits of agreements seen with low-attenuation plaque reflect the smaller volumes measured. As a consequence, small absolute changes in volumes have a large impact on relative and proportionate changes, translating into relatively large coefficients of variability. Low-attenuation plaque accounted for less than 1% of total plaque volume. In patients who have high use of statin and preventative therapies, this is perhaps not surprising as the phenotypic transformation from low-attenuation to calcified plaque may have already occurred. Moreover, with 65% of patients having had previous percutaneous coronary intervention, much of the ‘at-risk’ plaque may have already been treated and excluded from our analysis. Our coefficient of variation of 21 to 41% for low-attenuation plaque is lower than previous reports of 30 to 57% in patients with a lower burden of disease.24 To our knowledge scan-rescan variation for low-attenuation plaque has not previously been reported and as anticipated, was slightly higher than intraobserver and interobserver variability. The presence of low-attenuation plaque can identify patients at high risk of future cardiovascular events, so whilst its measurement is more variable, this does not detract from its potential clinical utility. However, in this population of people with advanced and well treated disease, measuring progression of low-attenuation plaque may be challenging as small volumes do not allow for precise reproducible quantification. Trialists have begun to use low-attenuation volume as an endpoint to monitor the effect of novel therapies on coronary atherosclerosis.5 We demonstrate here, that in patients with advanced coronary disease, non-calcified plaque volume is potentially a more reliable metric to use when monitoring disease progression.
Our study has some limitations. The number of patients was relatively small although repeated scanning and radiation exposure does present challenges to conducting such a study in larger numbers of patients. The population was predominantly male, but the results of the plaque reproducibility would be expected to be similar irrespective of gender. We did not compare plaque volumes with a reference standard, such as intravascular ultrasound, although this has been previously reported by others.3,25
In conclusion, we have demonstrated the excellent intraobserver, interobserver and scan-rescan reproducibility of semi-automated plaque volume quantification in patients with advanced coronary artery disease. This validates its use as a novel approach to quantify change in coronary artery disease over time and optimise risk stratification in patients with coronary artery disease.
Acknowledgements
The investigators would like to thank the staff at the Edinburgh Clinical Research Facility and Edinburgh Imaging Facility at the Royal Infirmary of Edinburgh. We would also like to acknowledge the help of the NHS Lothian Research & Development department and the assistance of the Chief Scientists Office.
Funding
Supported in part by NIH/NHLBI grant 1R01HL148787-01A1. MM is supported by the British Heart Foundation (FS/19/46/34445). TS is supported by the Medical Research Council (MR/T029153/1). AM is supported by the British Heart Foundation (AA/18/3/34220). MCW is supported by the British Heart Foundation (FS/11/014 and CH/09/002). DEN is supported by the British Heart Foundation (FS/19/15/34155, CH/09/002, RG/16/10/32375, RE/18/5/34216) and is the recipient of a Wellcome Trust Senior Investigator Award (WT103782AIA). PDA is supported by a Heart Foundation of New Zealand Senior Fellowship (1844).
ABBREVIATIONS
- CCTA
Coronary computed tomography angiography
- DICOM
Digital Imaging and Communications in Medicine
- HU
Hounsfield unit
- SCCT
Society of Cardiovascular Computed Tomography
Footnotes
Publisher's Disclaimer: This is a PDF file of an unedited manuscript that has been accepted for publication. As a service to our customers we are providing this early version of the manuscript. The manuscript will undergo copyediting, typesetting, and review of the resulting proof before it is published in its final form. Please note that during the production process errors may be discovered which could affect the content, and all legal disclaimers that apply to the journal pertain.
Conflict of Interest
Outside the current study, Drs. Dey and Slomka received software royalties from Cedars-Sinai Medical Center and have a patent. The remaining authors have no disclosures to report.
References
- 1.Meah MN, Williams MC. Long-Term Prognostic Role of Computed Tomography Coronary Angiography for Stable Angina. Current Treatment Options in Cardiovascular Medicine. 2020;22(9). [Google Scholar]
- 2.Newby DE, Adamson PD, Berry C, et al. Coronary CT Angiography and 5-Year Risk of Myocardial Infarction. N Engl J Med. 2018;379(10):924–933. [DOI] [PubMed] [Google Scholar]
- 3.Dey Damini, Schepis Tiziano, Marwan M, Slomka Piotr J, Berman Daniel S, Achenbach S. Automated Three-dimensional Quantification of Noncalcified Coronary Plaque from Coronary CT Angiography: Comparison with Intravascular US. Radiology. 2010;257(2):516–522. [DOI] [PubMed] [Google Scholar]
- 4.Dey D, Diaz Zamudio M, Schuhbaeck A, et al. Relationship Between Quantitative Adverse Plaque Features From Coronary Computed Tomography Angiography and Downstream Impaired Myocardial Flow Reserve by 13N-Ammonia Positron Emission Tomography: A Pilot Study. Circ Cardiovasc Imaging. 2015;8(10):e003255. [DOI] [PMC free article] [PubMed] [Google Scholar]
- 5.Budoff MJ, Bhatt DL, Kinninger A, et al. Effect of icosapent ethyl on progression of coronary atherosclerosis in patients with elevated triglycerides on statin therapy: final results of the EVAPORATE trial. Eur Heart J. 2020. [DOI] [PMC free article] [PubMed]
- 6.Schuhbaeck A, Dey D, Otaki Y, et al. Interscan reproducibility of quantitative coronary plaque volume and composition from CT coronary angiography using an automated method. Eur Radiol. 2014;24(9):2300–2308. [DOI] [PubMed] [Google Scholar]
- 7.Ovrehus KA, Schuhbaeck A, Marwan M, et al. Reproducibility of semi-automatic coronary plaque quantification in coronary CT angiography with sub-mSv radiation dose. J Cardiovasc Comput Tomogr. 2016;10(2):114–120. [DOI] [PubMed] [Google Scholar]
- 8.Zhang LJ, Wu SY, Wang J, et al. Diagnostic accuracy of dual-source CT coronary angiography: The effect of average heart rate, heart rate variability, and calcium score in a clinical perspective. Acta Radiol. 2010;51(7):727–740. [DOI] [PubMed] [Google Scholar]
- 9.Otton J, Yu C-Y, McCrohon J, Sammel N, Feneley M. Accuracy and Clinical Outcomes of Computed Tomography Coronary Angiography in the Presence of a High Coronary Calcium Score. Journal of the American College of Cardiology. 2013;61(10). [DOI] [PubMed] [Google Scholar]
- 10.Moss AJ, Dweck MR, Doris MK, et al. Ticagrelor to Reduce Myocardial Injury in Patients With High-Risk Coronary Artery Plaque. JACC Cardiovasc Imaging. 2020;13(7):1549–1560. [DOI] [PMC free article] [PubMed] [Google Scholar]
- 11.Raff GL, Abidov A, Achenbach S, et al. SCCT guidelines for the interpretation and reporting of coronary computed tomographic angiography. J Cardiovasc Comput Tomogr. 2009;3(2):122–136. [DOI] [PubMed] [Google Scholar]
- 12.Gaur S, Ovrehus KA, Dey D, et al. Coronary plaque quantification and fractional flow reserve by coronary computed tomography angiography identify ischaemia-causing lesions. Eur Heart J. 2016;37(15):1220–1227. [DOI] [PMC free article] [PubMed] [Google Scholar]
- 13.Matsumoto H, Watanabe S, Kyo E, et al. Standardized volumetric plaque quantification and characterization from coronary CT angiography: a head-to-head comparison with invasive intravascular ultrasound. Eur Radiol. 2019;29(11):6129–6139. [DOI] [PMC free article] [PubMed] [Google Scholar]
- 14.Dey D, Cheng VY, Slomka PJ, et al. Automated 3-dimensional quantification of noncalcified and calcified coronary plaque from coronary CT angiography. J Cardiovasc Comput Tomogr. 2009;3(6):372–382. [DOI] [PubMed] [Google Scholar]
- 15.Matsumoto H, Watanabe S, Kyo E, et al. Improved Evaluation of Lipid-Rich Plaque at Coronary CT Angiography: Head-to-Head Comparison with Intravascular US. Radiol Cardiothorac Imaging. 2019;1(5):e190069. [DOI] [PMC free article] [PubMed] [Google Scholar]
- 16.Chang HJ, Lin FY, Lee SE, et al. Coronary Atherosclerotic Precursors of Acute Coronary Syndromes. J Am Coll Cardiol. 2018;71(22):2511–2522. [DOI] [PMC free article] [PubMed] [Google Scholar]
- 17.Hell MM, Motwani M, Otaki Y, et al. Quantitative global plaque characteristics from coronary computed tomography angiography for the prediction of future cardiac mortality during long-term follow-up. Eur Heart J Cardiovasc Imaging. 2017;18(12):1331–1339. [DOI] [PMC free article] [PubMed] [Google Scholar]
- 18.Williams MC, Kwiecinski J, Doris M, et al. Low-Attenuation Noncalcified Plaque on Coronary Computed Tomography Angiography Predicts Myocardial Infarction: Results From the Multicenter SCOT-HEART Trial (Scottish Computed Tomography of the HEART). Circulation. 2020;141(18):1452–1462. [DOI] [PMC free article] [PubMed] [Google Scholar]
- 19.Cheng VY, Nakazato R, Dey D, et al. Reproducibility of coronary artery plaque volume and composition quantification by 64-detector row coronary computed tomographic angiography: an intraobserver, interobserver, and interscan variability study. J Cardiovasc Comput Tomogr. 2009;3(5):312–320. [DOI] [PubMed] [Google Scholar]
- 20.Kidoh M, Utsunomiya D, Funama Y, et al. The effect of heart rate on coronary plaque measurements in 320-row coronary CT angiography. Int J Cardiovasc Imaging. 2018;34(12):1977–1985. [DOI] [PubMed] [Google Scholar]
- 21.Williams MC, Golay SK, Hunter A, et al. Observer variability in the assessment of CT coronary angiography and coronary artery calcium score: substudy of the Scottish COmputed Tomography of the HEART (SCOT-HEART) trial. Open Heart. 2015;2(1):e000234. [DOI] [PMC free article] [PubMed] [Google Scholar]
- 22.Maroules CD, Hamilton-Craig C, Branch K, et al. Coronary artery disease reporting and data system (CAD-RADS(TM)): Inter-observer agreement for assessment categories and modifiers. J Cardiovasc Comput Tomogr. 2018;12(2):125–130. [DOI] [PubMed] [Google Scholar]
- 23.Tzolos E, McElhinney P, Williams MC, et al. Repeatability of quantitative pericoronary adipose tissue attenuation and coronary plaque burden from coronary CT angiography. J Cardiovasc Comput Tomogr. 2020. [DOI] [PMC free article] [PubMed]
- 24.de Knegt MC, Haugen M, Linde JJ, et al. Reproducibility of quantitative coronary computed tomography angiography in asymptomatic individuals and patients with acute chest pain. PLoS One. 2018;13(12):e0207980. [DOI] [PMC free article] [PubMed] [Google Scholar]
- 25.Boogers MJ, Broersen A, van Velzen JE, et al. Automated quantification of coronary plaque with computed tomography: comparison with intravascular ultrasound using a dedicated registration algorithm for fusion-based quantification. Eur Heart J. 2012;33(8):1007–1016. [DOI] [PubMed] [Google Scholar]