

Abstract
Gene expression provides valuable insight into cell function. As such, vision researchers have frequently employed gene expression studies to better understand retinal physiology and disease. With the advent of single-cell RNA sequencing, expression experiments provide an unparalleled resolution of information. Instead of studying aggregated gene expression across all cells in a heterogenous tissue, single-cell technology maps RNA to an individual cell, which facilitates grouping of retinal and choroidal cell types for further study. Single-cell RNA sequencing has been quickly adopted by both basic and translational vision researchers, and single-cell level gene expression has been studied in the visual systems of animal models, retinal organoids, and primary human retina, RPE, and choroid. These experiments have generated detailed atlases of gene expression and identified new retinal cell types. Likewise, single-cell RNA sequencing investigations have characterized how gene expression changes in the setting of many retinal diseases, including how choroidal endothelial cells are altered in age-related macular degeneration. In addition, this technology has allowed vision researcher to discover drivers of retinal development and model rare retinal diseases with induced pluripotent stem cells. In this review, we will overview the growing number of single-cell RNA sequencing studies in the field of vision research. We will summarize experimental considerations for designing single-cell RNA sequencing experiments and highlight important advancements in retinal, RPE, choroidal, and retinal organoid biology driven by this technology. Finally, we generalize these findings to genes involved in retinal degeneration and outline the future of single-cell expression experiments in studying retinal disease.
Keywords: single-cell, RNA, transcriptome, retina, RPE, choroid, choriocapillaris, endothelial
1. The value of scRNA-seq in vision research
Human visual signaling requires many different classes of retinal neurons and supportive cell types. In health, a variety of specialized cells coordinate their various functions and harmoniously orchestrate vision. Unfortunately, if one (or more) retinal or supportive cell types fails to perform its required function, visual signaling can become disrupted, leading to irreversible vision loss.
As the mRNA profile of a cell provides insight into cellular function, vision researchers have frequently employed mRNA phenotyping methods to better understand retinal physiology and disease pathophysiology in humans. Early experiments with subtractive hybridization sequenced human retinal and retinal pigment epithelium (RPE) cDNA libraries and identified candidate visual disease genes (den Hollander et al., 1999; Schulz et al., 2004; Swaroop et al., 1991). Likewise, the PCR-based differential display technology was used to identify RPE genes with altered expression in response to cell culture (Esser et al., 1997) or exposure to vitreous fluid (Kociok et al., 2002). Serial analysis of gene expression (SAGE) provided more comprehensive expression profiles of the neural retina (Bowes Rickman et al., 2006; Chowers et al., 2003) and RPE (Sharon et al., 2002) from human donors.
As knowledge of the human genome advanced, DNA microarrays were employed to quantify transcript abundance with higher throughput. This allowed vision researchers to generate more comprehensive expression atlases (Booij et al., 2010; Chowers et al., 2006; Hornan et al., 2007; Radeke et al., 2007; Strunnikova et al., 2010; van Soest et al., 2007; Wagner et al., 2013; Whitmore et al., 2013; Young et al., 2013) and test targeted hypotheses, such as identifying how ocular transcriptomes change with age (Cai et al., 2012; Yoshida et al., 2002). However, the hybridization-based approaches of microarrays could only be used to quantify known transcripts. With the advent of RNA-sequencing, deep sequencing could interrogate transcriptomes in an unbiased manner. The sequence-level output from this technology allowed for detection of novel genes and provided splicing information in the retina (Farkas et al., 2013) and RPE-choroid (Li et al., 2014b; Whitmore et al., 2014).
In traditional expression studies such as SAGE, microarray, and RNA-sequencing, mRNA contributions from all cell types are aggregated and analyzed together. This is problematic for studies involving the retina and RPE/choroid, as these tissues have extremely heterogenous composition. For example, the human retina consists of several major classes of neurons (cone photoreceptor cells, rod photoreceptor cells, bipolar cells, retinal ganglion cells, amacrine cells, and horizontal cells), each with a number of subtypes, in addition to supporting vascular and glial cells. When mRNA contributions from such diverse cells are pooled and analyzed together, it becomes incredibly challenging to identify how gene expression changes between two different biological conditions. As an illustration, consider a hypothetical experiment comparing gene expression between healthy and diseased retina. If the goal of the experiment is to discover dysregulated genes in the setting of disease, there are two possible ways in which such genes can be identified with bulk RNA sequencing. First, one gene may have altered expression in multiple different cell types in the diseased retina. In such a scenario, a somewhat modest expression change across multiple cell types can result in a quantifiable difference in read counts after mRNA is pooled from all cell types. Second, if a gene has altered expression in only a single cell type, the expression difference between the healthy and diseased retina must be large enough to withstand dilution by other cell types that do not harbor an expression difference. Thus, more rare cell subtypes must demonstrate larger expression differences in order for detection by differential expression.
Single-cell RNA sequencing (scRNA-seq) addresses this major limitation by capturing the transcriptome of individual cells in a parallelized, high-throughput manner. Cell sorting and microfluidic approaches are capable of interrogating the mRNA profile of hundreds to thousands of cells simultaneously. Subsequent computational analysis resolves heterogenous mRNA profiles into populations of similar cells, and expression profiles from cell types originating from different biological conditions can be directly compared. Indeed, this technology has been quickly embraced by the vision research community, and scRNA-seq has been applied to study ocular tissues in mice, primates, humans, and retinal organoids. In this review, we outline how scRNA-seq has advanced our understanding of retinal health and disease and summarize the future directions of this technology in vision research.
2. Experimental considerations and data analysis for scRNA-seq
2.1. Sample preparation of ocular tissues
Careful sample preparation is required to obtain high quality data from a scRNA-seq experiment. Ocular tissue can be processed for a scRNA-seq experiment in several different ways based on the objectives of the investigation (Figure 1). In this section, we will outline experimental and analytic considerations central to scRNA-seq experiments.
Figure 1: Sample preparation for a scRNA seq experiment.

Ocular tissue can be prepared for a scRNA-seq experiment in different ways to achieve different goals. Three sources of ocular tissue have been used in most scRNA-seq experiments to date: human postmortem donors, animal models, and in vitro models such as retinal organoids derived from induced pluripotent stem cells (iPSCs). Tissue can be immediately dissociated (solid black line) and immediately barcoded for scRNA-seq. Alternatively, dissociated cell suspensions can be cryopreserved in order to collect additional samples for a well powered analysis. Freshly dissociated tissue and cryopreserved cell suspensions both retain cell surface epitopes, permitting enrichment of specific cell types by magnetic beads or flow cytometry. Single-nuclei may also be isolated from fresh (dotted black line) or flash-frozen (dotted red line) ocular tissue before barcoding, which can improve capture rates of fragile cell types.
Dissociation:
The neural retina can be readily dissociated into a suspension of viable, single cells (Fadl et al., 2020; Feodorova et al., 2015; Sarthy and Lam, 1979), and the enzyme papain has been noted to cause relatively little trauma to retinal photoreceptors (Sarthy et al., 1981). Supporting tissues such as the RPE and choroid have strong cell-cell junctions and typically require more potent enzymatic buffers for dissociations. For example, different combinations of collagenase (Voigt et al., 2019a), dispase, DNAse, and trypsin (Lehmann et al., 2020; Rohlenova et al., 2020) have been used to isolate single cells from the RPE/choroid. Dissociation should begin as quickly as possible post-mortem; mRNA from the human RPE has been shown to appreciably degrade after approximately 5 hours (Malik et al., 2003), and mRNA degradation occurs more quickly in at least one non-primate animal model (Kallestad et al., 2019). Likewise, in a scRNA-seq study from human retina, rod photoreceptor cells with long post-mortem intervals (~15 hours) demonstrated decreased expression of MALAT1 compared to those with shorter post-mortem intervals (~6 hours) (Lukowski et al., 2019). This drop in MALAT1 expression was subsequently validated in time series experiments. Interestingly, non-rod photoreceptor cell types retained relatively high MALAT1 expression despite increasing postmortem time, suggesting that some cells and genes may be more affected by post-mortem degradation than others.
Cryopreservation:
Library preparation can begin immediately on dissociated cells. While immediate barcoding is fastest (minimizing RNA degradation) and gentlest on the dissociated cells, it is not always feasible for studying human cells. For example, human tissue donations occur at unpredictable times, and it may not be possible to access library barcoding equipment without advanced notice. To address this, our group gently cryopreserves dissociated cells in DMSO-based media (Life Technologies, Carlsbad CA) to minimize ice crystal formation. We slowly cool cells at 1°C/min (CryoSafe, Summerville SC) for 3–8 hours before long-term storage of cell suspensions in liquid nitrogen (Voigt et al., 2019b). While cryopreservation requires additional handling of fragile cells, it has at least three important benefits. First, cryopreservation allows additional time to acquire the ophthalmologic history and demographic information from each human donor. Second, it allows time for genotyping (to identify risk alleles) or histologic analysis of the non-dissociated eye (to identify undiagnosed disease status – such as age-related macular degeneration). Third, cryopreservation allows multiple case and control donors with similar post-mortem intervals to be sequenced in parallel, increasing the power of the study while minimizing batch effect.
scRNA-seq of cultured human explants:
Ocular tissue must be dissociated before it is cryopreserved. As human tissue donations occur unpredictably (often in the middle of the night), we investigated if popular RPE/choroid explant culture models could be used in lieu of cryopreservation to retain cell health prior to scRNA-seq. To test this idea, we acquired adjacent 6-mm punches of RPE/choroid from a human donor with a time-to-preservation interval of seven hours and twenty-eight minutes. The first punch was immediately dissociated and cryopreserved (as described above) while the second punch was cultured in DMEM at 37°C for 48 hours prior to cryopreservation. Both samples were thawed in parallel before scRNA-seq analysis (Figure 2A).
Figure 2. scRNA-seq of cryopreserved versus explanted culture models.

A. We acquired adjacent 6-mm punches of RPE/choroid from one human donor. The first punch (blue) was immediately dissociated and barcoded, while the second punch (yellow) was cultured in Dulbecco’s Modified Eagle’s Medium for 48 hours prior to dissociation and cryopreservation. We thawed cell suspensions from both punches in parallel and performed scRNA-seq. B. Dimensionality reduction and cluster classification of immediately dissociated and explanted cells. In general, disparate clusters were observed for explanted cells versus immediately dissociated cells. C. We conducted a functional pathway enrichment on genes upregulated in explanted cells with WebGestalt. Explanted cells had increased expression of genes involved in metabolism, including glycolysis/gluconeogenesis and amino acid biosynthesis. D. Expression of cell-specific hallmark genes were compared between explanted and immediately dissociated cells. In general, the immediately dissociated cells demonstrated higher expression of these key genes.
A total of 2,125 cells were recovered from the two processing methods. After cells were classified into clusters, we considered if the immediately dissociated and explanted cultured cells had different gene expression. In general, explanted cells formed distinct clusters from the immediately dissociated cells (Figure 2B), suggesting that the two processing methods affected gene expression in different ways. Further, the proportion of recovered cell types was quite different between the two techniques. For example, many fibroblasts were recovered from the immediately dissociated sample while none were identified from the explanted sample, suggesting that the explant culture method may select against the survival of some choroidal cell types. In addition, a large population of cells from the explanted sample could not be classified into a known RPE or choroidal cell type (“Unknown”, Figure 2B), which possibly represent fibroblasts with a severely altered expression profile. To assess what classes of genes change in expression between these two processing methods, we identified enriched functional categories from upregulated genes in explanted cells (Figure 2C). Cells from explanted tissue demonstrated a unique expression profile of metabolic genes and were most enriched in glycolysis/gluconeogenesis and amino acid biosynthesis genes. Finally, we compared the expression of hallmark marker genes in immediately dissociated versus explanted cell populations (Figure 2D). In general, the expression of cell-specific genes was higher in the immediately dissociated populations, suggesting preservation of these transcripts. Collectively, this data suggests that explant culture models have many limitations for gene expression studies at the single-cell level. Immediate dissociation, with or without subsequent cryopreservation, remains the gold standard for processing human tissue for single-cell expression studies.
Cell-enrichment:
Both freshly dissociated and thawed cryopreserved cell suspensions have intact surface epitopes that can be used to enrich for specific cell types of interest prior to barcoding (Figure 1). Three different enrichment strategies have been used in the vision research field. First, Rheaume and colleagues performed immunopanning to purify retinal ganglion cells (expressing Thy1) from mouse retina (Rheaume et al., 2018). Second, we and other investigators have used antibody conjugated microbeads to magnetically enrich for high interest cell types, including choroidal endothelial cells (expressing CD31) (Rohlenova et al., 2020; Voigt et al., 2019a), retinal ganglion cells (expressing CD90) (Peng et al., 2019), or depletion of rod photoreceptor cells (with anti-CD73 microbeads) (Peng et al., 2019). Last, fluorescent activated cell sorting has purified populations of bipolar cells in VSX2-GFP transgenic mice (Shekhar et al., 2016) or CD45/CD11b expressing retinal microglial cells from mice (Ronning et al., 2019). Collectively, we have found that enrichment methods are particularly helpful for studying more rare populations of high interest cells, such as choriocapillaris endothelial cells (see section 4.3).
Viability assessment:
The viability and health of cells should be assessed immediately prior to barcoding (post cryopreservation/cell enrichment, if applicable) to ensure cells are of sufficient quality for scRNA-seq analysis. Traditionally, cell viability has been measured based on exclusion of dyes, such as Trypan blue (Strober, 2001). However, we have observed that healthy photoreceptors absorb Trypan blue, rendering this assay inaccurate for assessing retinal viability. Propidium iodide/Annexin V stains represent an alternative tool for viability assessment, as propidium iodide is able to enter cells with disrupted cell membranes while Annexin V binds phosphatidylserine (which presents on the outer plasma membrane leaflet of cells undergoing apoptosis (Rieger et al., 2011)) as well as normal photoreceptor outer segment tips prior to phagocytosis (Ruggiero et al., 2012). Some groups have qualitatively evaluated how their processing techniques influence cell survival by culturing cells post-dissociation. These studies demonstrated that dissociation does not negatively influence bipolar cell survival in vitro, suggesting that single-cell processing does not harm cell viability (Shekhar et al., 2016). The field would benefit from similar studies that evaluate how dissociation protocols may selectively affect the survival and recovery of other retinal cell types.
Barcoding Strategies:
In scRNA-seq, transcripts that originate from the same cell are tagged with a unique oligonucleotide barcode. This barcode is incorporated into all cDNA molecules during synthesis; thus, all libraries from the same cell share the same identifying tag. Following barcoding, cDNA libraries from multiple cells can be pooled for sequencing, and different reads are computationally assigned to the same originating cell if and only if they share the same barcode. There are currently three predominant barcoding strategies used for scRNA-seq. First, plate-based methods (e.g., Smart-seq, Smart-seq2, MATQ-seq) separate singlet cells into different wells of a multi-well (96 or 384) plate before parallelized reverse transcription and library construction (Hashimshony et al., 2016; Picelli et al., 2013; Ramsköld et al., 2012; Sheng et al., 2017). Such plate-based methods are the most sensitive (they capture more RNA molecules for sequencing) (Ding et al., 2020) but are lower throughput (most experiments are conducted with hundreds of cells). In addition, plate-based methods are often more expensive per cell. Second, bead-based approaches (e.g., Drop-seq, Chromium, InDrop) use microfluidics to combine a single-cell with a barcoded bead in a droplet or a microwell (Gierahn et al., 2017; Han et al., 2018; Klein et al., 2015; Macosko et al., 2015; Zheng et al., 2017). While bead-based approaches are less sensitive (capturing less RNA), they are very high throughput, allowing for thousands of cells to be captured from one sample. Third, combinatorial indexing methods (e.g., SPLiT-seq, sci-RNA-seq) label transcripts with a series of sequentially added barcodes, and the transcriptome of one cell is assembled by gathering the reads with the same multi-barcode combination (Cao et al., 2017; Cao et al., 2019; Rosenberg et al., 2018). Such methods allow for very high-throughput sequencing of hundreds of thousands of cells from many libraries but demonstrate lower sensitivity in benchmarking studies (Ding et al., 2020).
Different barcoding methods require distinct approaches to cDNA synthesis (Chen et al., 2019). Most popular barcoding strategies tag individual cells with a unique molecular identifier (UMI). This UMI often consists of an oligonucleotide string flanked by a poly(T) tail and a reverse transcription primer. In these strategies, the poly(T) tail of the barcode hybridizes with poly-adenylated mRNA, and subsequent reverse transcription incorporates the UMI into each synthesized cDNA molecule. However, the proximity of the reverse transcription primer to the poly(T) tail can limit cDNA synthesis to the ~100 3’ most base pairs of each gene. Such 3’ reads are of sufficient length for mapping to the genome and enumerating read counts, however, they are too short for most splicing analyses or investigations of allele-specific expression. It can also be difficult to discriminate highly homologous genes (such as the cone opsins OPN1MW versus OPN1LW) using only the 100 most 3’ base pairs. In contrast, plate-based methods Smart-seq2 (Picelli et al., 2014) and Smart-seq3 (Hagemann-Jensen et al., 2020) perform “tagmentation” of barcoded reads, providing full length transcriptome coverage which allows for analysis of splicing and allele-specific expression.
2.2. Overview of computational analysis
There are numerous different bioinformatic tools and computational pipelines for analyzing single-cell RNA sequencing data (reviewed in (Hwang et al., 2018) and (Tian et al., 2019)). Different combinations of tools can be selected according to needs of the experiment, but most pipelines share a common structure (Figure 3). First, barcoded reads are mapped to genome and a gene expression matrix is generated. Next, quality control filtration removes cells that are likely to be low quality. For example, cells with either very few unique genes (poor quality) or very high unique genes (likely doublets, instances in which two different cells are combined in the same droplet or reaction well) are removed from further analysis, as are cells with many mitochondrial reads (as these cells likely have a partially disrupted plasma membrane, allowing cytoplasmic RNA to leak out while retaining larger organelles like mitochondria). After filtering, cells from different samples are normalized and aggregated together to minimize batch effect and cell-specific biases (Bacher et al., 2017; Butler et al., 2018; Finak et al., 2015; Katayama et al., 2013).
Figure 3: Computational analysis overview.

Sequenced libraries are mapped to the genome before filtering of low-quality cells. Next, multiple samples are aggregated together and normalized. Dimensionality reduction and clustering is performed on normalized reads, and clusters are classified into putative cell types by analyzing expression profiles within each cluster. Differential expression can be performed between different clusters or cells originating from different biological conditions. In some experiments, especially those involving differentiation of retinal organoids, trajectory analysis can identify gene expression changes as cells proceed through development.
Tens of thousands of genes can be simultaneously investigated in a scRNA-seq experiment. Dimensionality reduction is used to visualize groups of cells with similar global transcriptomes in a low dimensional space. The most common dimensionality reduction algorithms used in scRNA-seq are principal component analysis (PCA), t-distributed stochastic neighbor embedding (tSNE), and uniform manifold approximation and projection (UMAP). To illustrate these techniques, we simulated a three-dimensional data set measuring three genes (feature_1, feature_2, and feature_3) across four clusters of cells (Figure 4). Although the clusters show some separation in three-dimensional space (Figure 4A), no combination of any two features separates all four clusters (Figure 4B–D). PCA is a relatively simple dimensionality reduction technique that finds linear combinations of variables that maximize the variation in the dataset (thereby maximally separating points). These variable combinations are referred to as principal components, and two principal components can be represented as a plane in our three-dimensional data (Figure 4E–F). Using the computed principal components, we can transform our data onto a new set of axes and obtain a two-dimensional plot that improves separation of the four clusters (Figure 4G). UMAP and tSNE algorithms are more complex and require calculating “similarity scores” between all combinations of points in the dataset (Figure 4H). The tSNE and UMAP algorithms differ slightly on how similarities between points are computed and normalized (McInnes et al., 2018; van der Maaten and Hinton, 2008), but in each algorithm, observations that share high similarity scores are grouped together and projected onto lower-dimensional axes (Figure 4I–J). Even in this simulated low-dimensional dataset, tSNE and UMAP dimensionality reduction achieved superior separation of the four clusters compared to PCA.
Figure 4. Overview of dimensionality reduction on simulated data.

A. We simulated three-dimensional data (n = 300) across four clusters (red, yellow, blue, and green), viewed as a flattened three-dimensional image. B-D. No combination of features can be used to separate the four clusters. E-G. Principal component analysis was conducted and the first two principal components (PC-1 and PC-2) were plotted as a plane through the three-dimensional data (E and F represent different steroimages of the plane defined by PC-1 and PC2). Tangent lines (grey) are drawn from each point to the plane to demonstrate how each point maps to the lower dimensional principal component space (G). H. In the tSNE and UMAP algorithms, similarity scores are computed by measuring the distance between all combinations of points. In this example, we represent the measuring of distances from a single point (green, lower left) to all other points with dashed grey lines. tSNE (I) and UMAP (H) differ in their computation and scaling of similarity scores, resulting in different projections to lower dimensional space.
With tSNE and UMAP, it is tempting to extrapolate relationships between clusters based on their relative positions in the dimensionality reduction plot. In the example in Figure 4, it may seem that the red and blue cells are transcriptionally more similar than the red and yellow cells. However, such assertions should be made with an abundance of caution. While these dimensionality reductions excel at preserving local structure (i.e., preserving the relationships between points in a cluster), global structure (i.e., relationships between clusters) may be distorted. Many argue that UMAP preserves global structure better than tSNE (Becht et al., 2019), but there is disagreement in the field (Kobak and Linderman, 2019).
After performing dimensionality reduction, clusters of cells are classified into different cell types. Subsequently, differential expression analysis can identify genes specific to subpopulations of certain cell types or highlight genes enriched in unknown clusters. Differential expression analysis can also be used to create an atlas of cell-specific gene expression patterns and identify the most enriched genes in certain cell populations. In addition, single-cell experiments are often designed to study how a biological variable, such as the presence versus absence of a disease phenotype or knockdown of a gene in an animal model, changes gene expression across different populations of cells. In such experiments, the statistical significance of differential expression results must be interpreted with extra caution. Due to high cost and limitations of current barcoding strategies, most single-cell experiments include a limited number of biological replicates. Some analysis pipelines, such as Seurat (Butler et al., 2018), treat all cells as independent observations in differential expression analysis, which can inflate p-values comparing cells from different biological conditions. In such situations, it may be more appropriate to perform a ‘pseudo-bulk’ comparison of gene expression (Lun and Marioni, 2017), where the counts in each cluster of cells are averaged for each independent library and compared in edgeR (Robinson et al., 2010) or DESeq2 (Love et al., 2014).
Several computational methods serve to model temporal transcriptional changes, such as differentiation, from single-cell data (Ding et al., 2019; Street et al., 2018; Trapnell et al., 2014) (Figure 3). In contrast to bulk RNA sequencing investigations of time-series expression, in which cells at slightly different stages of differentiation are pooled together, trajectory-based inference methods from scRNA-seq order individual cells along an expression trajectory (referred to as pseudotime ordering). Such ordering of cells (e.g., from least mature to most mature or from most healthy to most diseased) helps identify key transcriptional events such as cell fate commitment or transient expression of developmental regulators. As modeling these trajectories has an inherent temporal component, pseudotime analyses are most often performed when studying differentiation, especially in experiments involving retinal organoids (see section 6 below).
While scRNA-seq has numerous advantages as outlined above (e.g., profiling gene expression in complex tissues, temporal ordering of cells, etc.), there are several important limitations to acknowledge before designing an experiment. First, as a single cell contains a low amount of starting RNA, some genes with low expression are not captured for downstream amplification. These so called ‘dropout’ events (Dal Molin et al., 2017) lead to zero-inflated expression values and must be accounted for in differential expression analysis (Miao et al., 2018). Thus, bulk RNA sequencing is more suitable for quantifying the global transcriptome of a purified cell population, as this technology has improved capture of lowly expressed genes. Similarly, scRNA-seq is more prone to noise and variability than bulk RNA-sequencing (Chen et al., 2019), and thus bulk RNA-sequencing may be better suited for comparative analyses (of purified cell populations) and reproducibility across different platforms. Finally, many scRNA-seq methods do not result in full-length transcript coverage, precluding splicing and allele-specific expression analysis that can be completed with bulk RNA sequencing.
3. scRNA-seq in the neural retina
3.1. Early scRNA-seq studies in mouse models
The neural retina is a remarkably heterogenous tissue. There are five major classes of retinal neurons (each with a myriad of subtypes) that interact to convert a photon of light into an electrical signal that can be propagated to the brainstem. Due to this remarkable cellular diversity and complex physiology, the murine retina was selected as the first tissue profiled with highly parallel scRNA-seq using the Drop-seq barcoding strategy (Macosko et al., 2015). In this landmark study, all major neuronal and non-neuronal supportive populations were transcriptomically characterized, generating a retinal cell specific gene expression atlas in the mouse at an unparalleled resolution. These detailed transcriptomes provided enormous insight into retinal physiology. For example, the authors identified 21 distinct clusters of amacrine cells in this study, and highly expressed genes served as new markers to study the morphology of different amacrine cell subtypes with immunohistochemistry. Further, expression profiles were used to characterize the neurotransmitter used by each amacrine cell subtype (GABAergic vs glycinergic), demonstrating the power of scRNA-seq in identifying new features of cells and advancing understanding of retinal cell biology.
The next wave of retinal scRNA-seq experiments sought to advance the discovery of bipolar cell (Shekhar et al., 2016) and retinal ganglion cell (Rheaume et al., 2018) subtypes, again using mice as a model system. Shekar and colleagues enriched for fluorescent bipolar cells isolated from transgenic mice before scRNA-seq (Shekhar et al., 2016). Even though bipolar cells comprise less than 10% of the mouse retina, this enrichment strategy allowed for the recovery of 27,499 total cells, of which 80% expressed canonical bipolar cells genes. These bipolar cells segregated into 15 distinct clusters, many of which corresponded to known subtypes. The authors next performed lentiviral labeling of bipolar cells while also visualizing cluster-specific marker genes using fluorescent in situ hybridization. This allowed for detailed morphological analysis of arborization patterns and mRNA-morphology associations of novel bipolar cell types. Similarly, murine retinal ganglion cell subtypes were explored for scRNA-seq after Thy1 immunopanning (Rheaume et al., 2018). In this study, 40 distinct clusters of retinal ganglion cells were identified, and enriched genes were identified in each putative cell type. In addition, Rheuame and colleagues prepared distinct libraries from the right and left eyes, and they identified retinal ganglion cell subtypes and marker genes specific to the right versus left eyes.
3.2. Physiology of the foveal and peripheral retina
In contrast to mice, the primate and human retina demonstrates higher order anatomical complexity. Humans and primates fixate their vision such that the image is focused onto an excavated pit within the retina called the fovea centralis, which is approximately 0.7 mm in diameter (Figure 5A–B) (Yuodelis and Hendrickson, 1986). This region excludes rod photoreceptor cells, bipolar cells, ganglion cells, and vascular elements, and instead exclusively consists of cone photoreceptor cells and supporting Müller cells (Yamada, 1969). Strikingly, foveal cones demonstrate a distinct morphology and wiring from their extrafoveal counterparts. Foveal cones have elongated inner and outer segments as well as long axons that form Henle’s nerve fiber layer, which displaces bipolar cells and ganglion cells radially away from the foveal center. Such displacement allows for the tight packing of cone photoreceptor cells within the foveal pit, mediating exceptionally high acuity vision (Figure 5C). In addition, each foveal cone synapses with exactly one bipolar cell, which synapses with one retinal ganglion cell. In contrast, peripheral cones possess the classical “teardrop” inner segment morphology with a short outer segment described by Cajal (Figure 5D) (Ramón y Cajal, 1972), and multiple peripheral cones synapse with the same bipolar cell.
Figure 5: Overview of foveal and peripheral retinal anatomy.

A-B. In human and primate retina, the fovea is an excavated pit within the center of the macula. C. Retinal cells within the fovea have distinct morphologies and neural circuitries. Foveal cones have elongated inner and outer segments as well as long axons that form Henle’s fiber layer. Bipolar cells and ganglion cells, which form one-to-one synapses with foveal cones, are radially displaced, which allows for dense packing of cone photoreceptor cells. D. In contrast, peripheral cones have shorter inner and outer segments and a teardrop morphology. In the periphery, multiple photoreceptor cells synapse with the same bipolar cell. OS: outer segments, ONL: outer nuclear layer, OPL: outer plexiform layer, INL: inner nuclear layer, IPL: inner plexiform layer, GCL: ganglion cell layer, RGC: retinal ganglion cell. E. Anatomy of the human fovea. Cone photoreceptor cells are labeled with peanut agglutinin (PNA) (red) and rod photoreceptor cells are labeled with rhodopsin (green).
Several retinal diseases injure cells in a regional pattern, either selectively damaging or sparing the fovea (Querques et al., 2016; Schindler et al., 2010), and modifying factors can prevent or stimulate foveal cone damage (Schindler et al., 2010). In such diseases, the health of the fovea has an enormous role in visual function, and loss of this small region of retina can drop acuity from 20/20 to legal blindness.
3.3. Foveal versus peripheral retina gene expression
Due to its physiologic and clinical importance, we set out to better understand the molecular features of foveal versus peripheral retinal cell types in the first large-scale scRNA-seq study of human retina (Voigt et al., 2019b). In this study, we obtained independent foveal (2 mm) and peripheral (4 mm) retinal punches from three sets of post-mortem human donor eyes processed within six hours of death (Figure 6A). Our selection of a 2-mm punch (instead of a smaller punch with fewer extrafoveal cells) was based on the practicality of reproducibly obtaining enough viable cells for downstream analysis. After dissociating neural retina in papain, cryopreserving cell suspensions, and performing scRNA-seq, we recovered 8,217 cells corresponding to all major retinal populations (Figure 6B, E). First, we compared the cellular composition between the foveal versus peripheral punches. While centered on the cone dominant fovea centralis, we expected our 2-mm foveal punch to include other cell types such as bipolar cells, ganglion cells, and rod photoreceptors based on the robustly quantified distributions of retinal cell types previously described by Curcio (Figure 6C) (Curcio et al., 1990). Based on these distributions, we anticipated that our 2-mm fovea-centered punch would contain a ratio of 1 cone : 1.8 rods : 0.8 retinal ganglion cells, which was very near the observed ratio of these cell types (1 cone : 1.5 rods : 2.2 retinal ganglion cells) (Figure 6D). In contrast, the peripheral retina was dominated by rod photoreceptor cells (1 cone : 18.4 rods : 0.3 retinal ganglion cells), mirroring the expected cell distribution 9 mm from the foveal center (1 cone : 27.5 rods : 0.13 retinal ganglion cells).
Figure 6: Single-cell RNA sequencing of human foveal versus peripheral retina.

A. One of the three human donor eyes used for scRNA-seq. From each donor, a 2-mm foveal centered punch and a 4-mm peripheral punch (dashed lines) approximately 9 mm from the foveal center were acquired for scRNA-seq. B. A total of 8217 retinal cells were recovered that segregated into 17 cellular clusters. C. Distribution of cone photoreceptor cells, rod photoreceptor cells, and retinal ganglion cells as a function of distance from the foveal center (foveal center = 0.0 mm) (Curcio et al., 1990). Grey shading indicates the expected distribution of cells within a perfectly centered 2-mm foveal centered punch. D. The observed proportion of different cell types in foveal (left) versus peripheral (right) libraries across three human donors, where each bar represents the proportion of each cell type in an individual donor. E. Violin plot depicting expression of previously reported cell type specific genes across each of the 17 clusters. The expression of the 100-most enriched genes in each cluster was used to create a dendrogram (left) that depicts the relationship between each cluster. RGC = retinal ganglion cells.
While the foveal and peripheral retina contained different distributions of cells, some cell types also demonstrated considerable gene expression differences based on anatomical region. In particular, foveal cone photoreceptor cells and foveal Müller glial cells formed distinct clusters from their peripheral counterparts (Figure 7A), suggesting strong regional gene expression differences. Foveal cone photoreceptors were enriched in mRNAs encoding Purkinje Cell Protein 4 (PCP4), a calmodulin-binding protein involved in synaptic plasticity (Wei et al., 2011), YBX1, a gene encoding a regulator of cell proliferation, translation, and stress response (Suresh et al., 2018), and PRDX1, a thiol peroxidase (Chidlow et al., 2016) (Figure 7B).
Figure 7: Gene expression in cone photoreceptor cells and glial cells varies by region.

A. Distinct clusters of foveal (blue) and peripheral (red) glial cells and cone photoreceptor cells were identified. B. Differential expression between foveal and peripheral cone photoreceptor cells. The y-axis depicts the average log fold change, with positive values indicating higher foveal expression. The x axis depicts ‘delta percent,’ which represents the difference in the proportion of cells expressing each gene. For example, if 50% of foveal cones express a given gene while 10% of peripheral cones express the same gene, the delta percent is 40% or 0.4. C. Differential expression between foveal and peripheral glial cells.
In contrast, peripheral cone photoreceptor cells were enriched in transcripts for the iron-binding protein transferrin (TF). Iron dysregulation within the retina has been postulated to lead to free radical generation via the Fenton reaction, contributing to oxidative stress (Dunaief, 2006). Indeed, irons levels are higher in RPE and retina samples from AMD donors compared to age-matched controls (Dentchev et al., 2005; Hahn et al., 2003), and transferrin expression increases in AMD (Chowers et al., 2006). Moreover, mice lacking retinal iron binding proteins develop lesions in the RPE and choroid (Hadziahmetovic et al., 2008). A relative deficiency of foveal transferrin compared to the periphery may increase susceptibility to oxidative damage within this region. Corroborating these region-specific transcriptome findings, we detected increased transferrin expression at the protein level in peripheral compared to foveal cones (Figure 8).
Figure 8: Increased transferrin expression in peripheral versus foveal cones.

Cryosectioned retinal samples from the fovea and periphery of the same donor were co-labeled with anti-arrestin-3 (green) and anti-transferrin (red). The peripheral retina demonstrated increased transferrin expression in cone photoreceptor cells. Scalebar = 25 μm.
In addition, the carotenoid-cleaving enzyme BCO2 was enriched in peripheral cone photoreceptor cells (Voigt et al., 2019b). Human and primate foveas contain high amounts of xanthophyll carotenoids, which are responsible for the visible yellow pigmentation the central retina (Li et al., 2014a). Such xanthophylls, such as lutein, have been shown to protect the retina from oxidative damage and defend photoreceptor cells from light damage (Krinsky et al., 2003). The relative deficiency of BCO2 in foveal cones suggests a mechanism by which these carotenoids accumulate within the fovea.
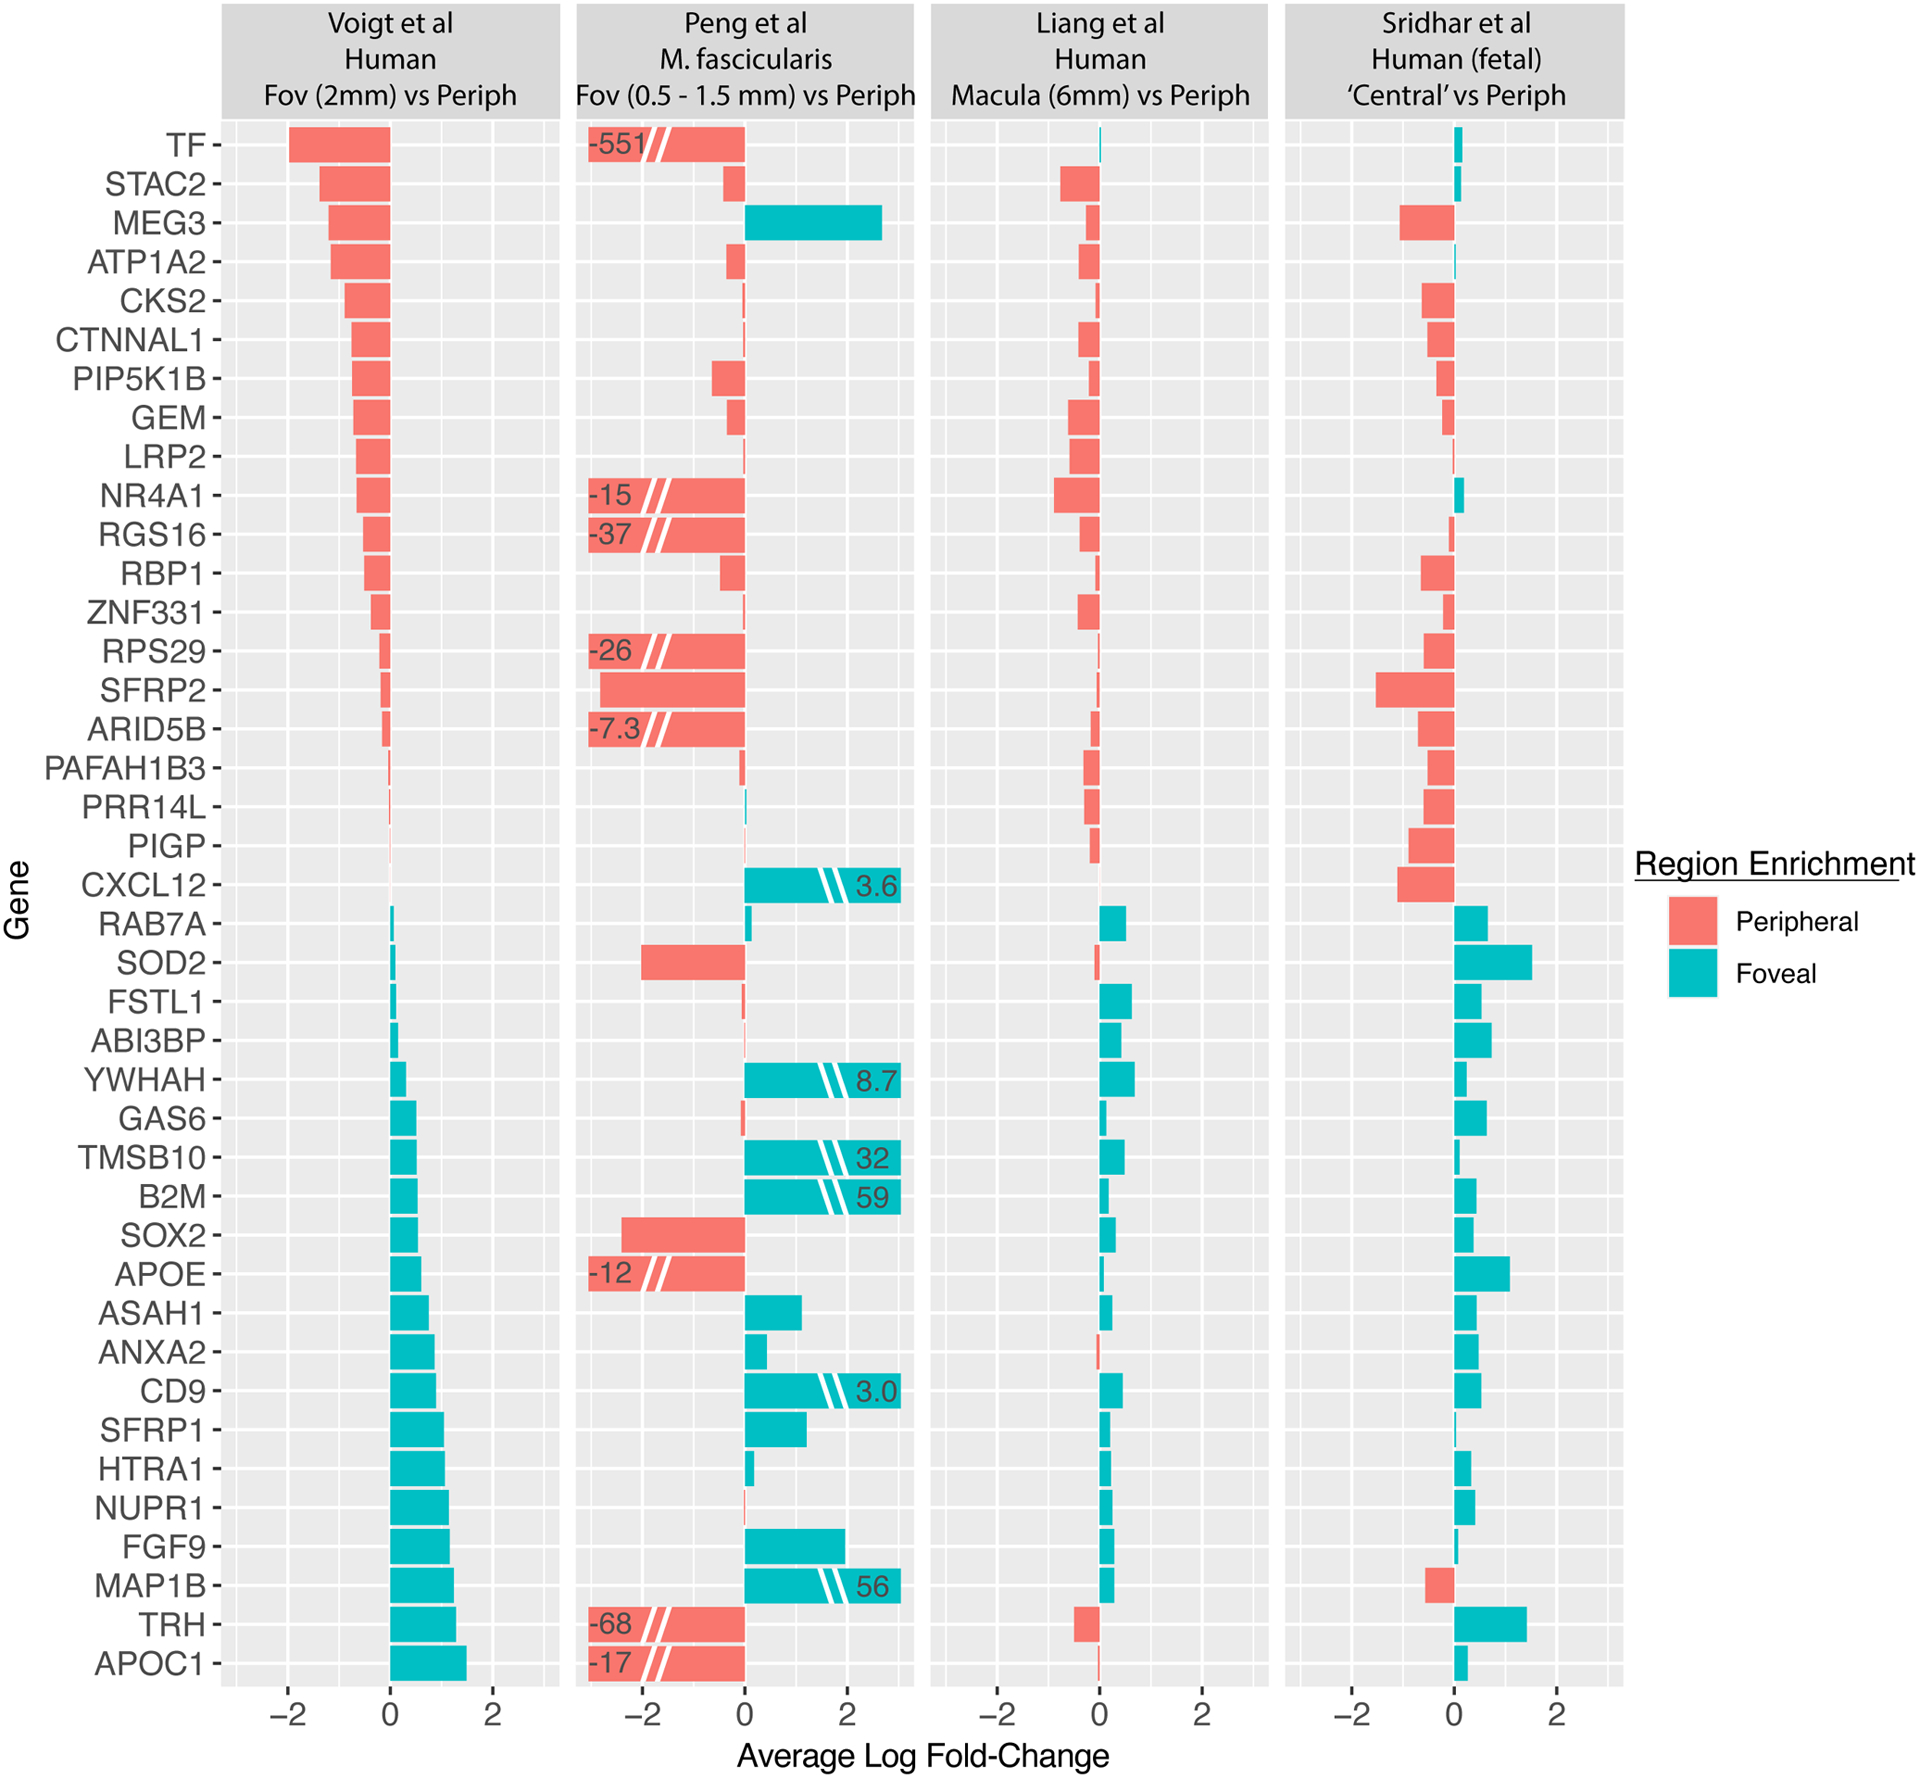
Several subsequent investigations have used scRNA-seq to investigate gene expression within the human neural retina. For example, Hu and colleagues performed scRNA-seq on 2421 cells from the fetal neural retina and RPE, which provided transcriptional insight into human retinal development and lineage commitment (Hu et al., 2019). Lukowski and colleagues generated an expression atlas containing ~20,000 cells from three human donors (postmortem intervals ranging from 6–15 hours) and identified distinct populations of L/M vs S cone photoreceptor cells (Lukowski et al., 2019). Single-nuclei RNA sequencing has been utilized to generate a very large dataset of over 100,000 retinal and RPE cells from four post-mortem eyes, which allowed for the transcriptional characterization of bipolar, amacrine, and retinal ganglion cell subtypes in humans (Orozco et al., 2020). A very recent report has generated a large expression atlas over 285,000 human retina and retinal organoid cells (Cowan et al., 2020). This study demonstrated that mature organoid cell types have similar expression profiles to human peripheral retina. In addition, several subsequent studies have used scRNA-seq to compare gene expression within different regions of the neural retina (Liang et al., 2019; Peng et al., 2019; Sridhar et al., 2020; Yan et al., 2020). We re-processed data from three of these studies to determine if regional gene expression patterns were reproducible across different samples and experiments. For cone photoreceptor cells, there were many genes with region specific expression profiles that were highly concordant across different datasets (Figure 9). Only one other study (Peng et al., 2019) contained an independent library for foveal retina, and this investigation was performed on the primate M. fascicularis. The two other human studies generated independent libraries for the central or macular retina, with one using 6-mm macular punches (Liang et al., 2019) and another using central retina of an unspecified size from fetal retina (Sridhar et al., 2020). Using larger portions of retina that surround the fovea may have driven more modest regional expression fold-changes for several genes in these two human studies.
Figure 9: Central versus peripheral gene expression in cone photoreceptor cells.

Selected genes with reproducible foveal or peripheral enrichment in cone photoreceptor cells are visualized across four scRNA-seq studies. Genes differentially expressed in different retinal regions are listed on the y-axis, and log fold-changes are depicted for genes enriched in the periphery (red) or fovea (blue). Study descriptions (top) denote the species and size of the foveal punch. Of note, Liang et al and Sridhar et al obtained larger sections of central retina, which may diminish gene expression changes specific to the fovea.
One very recent report examined differences between foveal and peripheral expression of retinal cell types (Yan et al., 2020). In this investigation, bipolar cells were enriched with anti-CD90 and rods were depleted with anti-CD73 magnetic beads, which allowed for the enrichment of rarer retinal cell types. However, because only one of the donors in the study had paired foveal and peripheral libraries and some peripheral cell types were underrepresented (for example, in our re-analysis we only identified a total of 36 peripheral cone photoreceptor cells), we elected to not include such differential expression results in our comparison of regional expression patterns across different datasets (Figure 9).
Like cone photoreceptor cells, foveal Müller glia also demonstrate a distinct gene expression profile from their peripheral counterparts, with each region forming independent clusters (Figure 7C). Peripheral Müller cells were enriched for TF and several members of the metallothionein gene family (MT1G, MT3), which consist of cysteine rich proteins that are upregulated in response to heavy metals (Chen et al., 2014). In contrast, foveal Müller cells were enriched in FABP5, a fatty acid binding protein implicated in neuronal differentiation (Liu et al., 2000) and recovery from neuronal injury (Figueroa et al., 2016). Foveal Müller cells were also enriched for HES5, which is involved in gliogenesis (Hojo et al., 2000). Collectively, many Müller cell genes demonstrated consistent enrichment in either the fovea or periphery across different single-cell datasets (Figure 10).
Figure 10: Central versus peripheral gene expression in Müller glial cells.
Selected genes with reproducible foveal or peripheral enrichment in Müller glial cells are visualized across four scRNA-seq studies. Genes differentially expressed in different retinal regions are listed on the y-axis, and log fold-changes are depicted for genes enriched in the periphery (red) or fovea (blue). Study descriptions (top) denote the species and size of the foveal punch. Of note, Liang et al and Sridhar et al obtained larger sections of central retina, which may diminish gene expression changes specific to the fovea.
3.4. Gene expression in retinal degeneration
While foveal and peripheral retinal cells have unique gene expression profiles in health, retinal degeneration can affect these regional transcriptomes differently. To better understand gene expression in the setting of retinal degeneration, we performed scRNA-seq on postmortem tissue from a donor with autoimmune retinopathy (AIR) (Voigt et al., 2020a). The AIR patient in this study was followed for 19 years at the University of Iowa, and demonstrated progressive visual field constriction, peripheral bone-spicule-like pigmentary changes, and RPE migration into the inner retina. However, the macular retina was relatively spared from damage and pigmentary changes, and the patient demonstrated moderate acuity (20/40 +1 in the right eye, 20/100 in the left eye) two years before his death. We isolated foveal (2 mm) and peripheral (8 mm) punches of neural retina from the AIR donor and four control donors to identify how different cell populations transcriptionally respond to retinal injury.
After scRNA-seq and computational processing, we recovered a total of 23,429 cells from the five paired libraries, including 7,189 cells from the AIR donor (Figure 11A). Cells from the AIR donor (colored in shades of red) contributed to all major retinal cell populations with the exception of rod photoreceptor cells (Clusters 22 and 23), recapitulating this patient’s progressive visual field constriction and lack of rod-photoreceptor detection with immunohistochemistry on the contralateral eye, as described in other gene expression studies of human photoreceptor degeneration (Mullins et al., 2012). Somewhat surprisingly, the majority of retinal cell types (including bipolar cells, retinal ganglion cells, horizontal cells, and amacrine cells) had remarkably similar expression profiles between the AIR and control donors, and cells from the healthy and diseased retina clustered together. However, we observed unique clusters of astrocytes (Cluster 4), Müller cells (Cluster 5), and RPE cells (Cluster 6) that consisted almost exclusively of cells from the periphery of the AIR donor (Figure 11A). Astrocytes proliferate in response to retinal injury (de Hoz et al., 2016) and RPE cells were histologically observed in the inner retina of the AIR donor, which can explain why these cell populations were not found in healthy donors. It is perhaps surprising that RPE cells that clinically contribute to bone spicule like pigmentation continue to express genes unique to the normal RPE.
Figure 11: Peripheral Müller cells from the autoimmune retinopathy donor demonstrate a unique gene expression profile.

A. Dimensionality reduction plot depicting 23,429 cells recovered from five human donors, including one donor with autoimmune retinopathy (AIR). Three clusters of cells (RPE, astrocytes, peripheral Müller cells) were comprised predominantly of cells from the AIR donor (red). The number in parentheses in the legend (e.g., D1) represents the donor number. B. Differential expression of peripheral Müller cells in the AIR vs healthy donors. The y-axis depicts log fold-change, with positive values associated with increased expression in the peripheral Muller cells from the AIR donor. The x-axis depicts delta percent, which is the difference in the proportion of cells expressing each gene. For example, if 50% of peripheral Muller glia from the AIR donor express a given gene while 10% of Muller glia from the healthy donors express the same gene, the delta percent is 40% or 0.4.
In contrast, peripheral Müller cells from the AIR donor clustered away from their healthy counterparts, suggesting that retinal disease drove expression changes in these cells strong enough to form their own cluster. Indeed, peripheral Müller cells from healthy and AIR donors demonstrated numerous expression differences (Figure 11B). In particular, peripheral Müller cells from the AIR donor were enriched for many genes implicated in reactive gliosis. For example, the single-most enriched gene in these cells was GFAP, which encodes an intermediate filament protein expressed early in the gliotic response (Larsen and Osborne, 1996). Likewise, these cells demonstrated increased expression of ANXA1 and ANXA2, which increase during reactive gliosis in the brain (Eberhard et al., 1994). In comparison, foveal Müller cells from healthy and AIR donors clustered together (Figure 11A) and demonstrated relatively few expression differences. This suggests that the impressive transcriptional change in peripheral Müller cells was driven by this patient’s disease and not simply donor-to-donor variation.
This AIR gene expression study demonstrated three significant findings. First, scRNA-seq allowed for high resolution transcriptional profiling of human retinal cells in a rare, blinding inflammatory condition. In particular, characterizing the gliotic response of Müller cells and astrocytes provides new information about how the retina responds to chronic damage. Second, in at least some forms of retinal degeneration, inner retinal cell types have relatively normal transcriptomes in response to photoreceptor damage. The presence of morphologically and transcriptomically healthy inner retinal cells is promising for restoring visual function with autologous photoreceptor cell replacement strategies (Burnight et al., 2018). Third, this study highlights the power of scRNA-seq to discriminate a small population of diseased cells from their corresponding healthy counterparts. We believe that these methods will be helpful for elucidating disease mechanisms in other retinal diseases that principally affect one or a few cell types.
In addition to our investigation of AIR, scRNA-seq has been employed to study the immune response in a mouse model of retinal degeneration (Ronning et al., 2019). In this experiment, CD11b+/CD45+ immune cells were isolated from wildtype and Arr1−/− mice (in which rod photoreceptors degenerate upon light exposure) before scRNA-seq. Immune cells from the degenerating retina formed independent clusters from control cells, many of which were composed of infiltrating monocytes and macrophages from the peripheral circulation. In addition, resting versus proliferating expression profiles were defined for monocytes and microglia, highlighting how heterogenous populations of immune cells respond to retinal damage.
In summary, scRNA-seq has provided tremendous insight into retinal physiology. The neural retina of both animal models and human post-mortem tissue has be profiled at the single-cell level, generating several large, independent expression atlases specific to retinal cell types or subtypes. In addition, scRNA-seq has been employed to highlight unique features of foveal versus peripheral cell types, providing insight into the region-specific patterns of retinal physiology and disease. Finally, scRNA-seq can be employed to study neural retinal degeneration, offering a novel perspective of how individual populations of cells respond to retinal damage.
4. RPE and choroidal support of retinal function
4.1. Physiology of the RPE and choroid
Outer retinal physiology is extensively supported by two underlying tissues: the RPE and the choroid. The RPE is a polarized monolayer of pigmented cells with long apical microvilli that interface with photoreceptor outer segments and the interphotoreceptor matrix (Figure 12A). These cells provide crucial structural and metabolic support to photoreceptor cells, re-isomerize all-trans-retinal to 11-cis-retinal, and constantly phagocytize outer segments essential for photoreceptor maintenance. Underneath the RPE, a heterogenous tissue called the choroid also provides significant support to the retina. The choroid is a diverse connective tissue home to many different cell types including Schwann cells, melanocytes, fibroblasts, and several classes of resident leukocytes. Yet most prominently, the choroid contains a rich vascular system that supplies ~85% of the blood to the outer retina (Nork et al., 2006) (Figure 12A). This vascular system is anatomically organized into three layers, with deep large caliber vessels (Haller’s layer), medium caliber vessels (Sattler’s layer), and a dense superficial capillary network known as the choriocapillaris.
Figure 12: scRNA-seq of the RPE and choroid from three human donors.

A. Cartoon of RPE and major choroidal populations. B. Dimensionality reduction plot depicting scRNA-seq results of macular and peripheral samples from three human donors. A total of 4335 cells were recovered that segregated into 11 clusters. C. Violin plots depict the expression of key marker genes for the RPE and major choroidal populations. SMC = smooth muscle cell, SC = Schwann cell, NK = natural killer.
Dysfunction of either the RPE or choroid can disrupt retinal support and lead to neural retinal degeneration. Like the retina, many diseases that originate in the RPE and choroid have regional predilections. For example, age-related macular degeneration (AMD) is a major cause of blindness in aging populations (Ehrlich et al., 2008). In this heterogenous disease, dysfunction of the choroidal vasculature and overlying RPE leads to dysfunction of the central-most retina (the macula), while cells in the periphery are relatively spared. This pattern of damage is thought to be due in part to molecular differences between the macular and peripheral RPE and choroid, such as increased ICAM1 in macular choriocapillaris endothelial cells (Mullins et al., 2006). In contrast, other forms of inherited retinal disease exert most of their effects in the periphery with relative sparing of the fovea, such as retinitis pigmentosa.
4.2. RPE and choroidal gene expression atlas
Studying individual RPE/choroidal cells with scRNA-seq has improved our understanding of normal vision physiology and dysfunction in the setting of retinal disease (Voigt et al., 2019a). In our initial experiments, we isolated RPE/choroidal tissue from the macula (8 mm) and periphery (8 mm) of three human donors to understand how gene expression of these tissues changed by region. After dissociating tissue, sequencing mRNA, and computational processing of the data, we recovered 4,335 cells that corresponded to the RPE and all major choroidal populations (Figure 12BC).
An important result of this study was the generation of a comprehensive expression atlas of RPE and choroidal cell types. This atlas demonstrated a substantial improvement in resolution compared to previous bulk transcriptomic investigations in the RPE/choroid (Li et al., 2014b; Whitmore et al., 2014). For example, complement factor H (CFH) is a regulator of the alternative pathway of complement, and single nucleotide polymorphisms in this gene are among the greatest genetic risk factors for AMD (Fritsche et al., 2016a). However, the relative importance of systemic versus locally synthesized complement inhibitors, as well as the most relevant sites of expression in the eye, is a subject of high interest, with several groups studying CFH in RPE cells (Kim et al., 2009; Weinberger et al., 2014) versus endothelial cells (Lundh von Leithner et al., 2009). Indeed, this initial scRNA-seq investigation demonstrated increased CFH expression in endothelial cells compared to RPE cells (absolute change 127%), however surprisingly, the cell type with the highest CFH expression was pericytes/smooth muscle cells (4.2 times higher than endothelial cells in this initial study). For more detailed discussion on complement regulator expression, including CFH expression along the vascular tree, see Section 7 below.
In addition, this expression atlas provided means to study individual populations of resident immune cells within the choroid. The role of inflammation in retinal disease has been well studied, and mast cell degranulation (Bhutto et al., 2016) and increased macrophage recruitment into the choroid (McLeod et al., 2016; Skeie and Mullins, 2009) have been implicated in AMD pathogenesis. We identified four populations of leukocytes expressing PTPRC (which encodes the pan-leukocyte surface gene product CD45), including distinct populations of B-cells (Cluster 8), T/NK-cells (Cluster 9), macrophages (Cluster 10), and mast cells (Cluster 11).
Interestingly, we identified two transcriptionally distinct populations of Schwann cells (Clusters 1 and 2), which support cranial, sympathetic and resident ganglion cell innervation within the choroid (Flugel et al., 1994; Reiner et al., 2018). While both clusters expressed the canonical Schwann cell marker PLP1, Cluster 1 highly expressed myelin protein zero (MPZ) and myelin basic protein (MBP), characteristic of myelinating Schwann cells, while Cluster 2 expressed non-myelinating Schwann cell genes such as SCN7A and NCAM1 (Garcia-Villegas et al., 2009; Liu et al., 2015). Immature Schwann cells are presumed to have identical developmental potential, and cell fate is determined by the caliber of axons that the Schwann cell encounters (Jessen and Mirsky, 2005). If an immature Schwann cell contacts a large-diameter axon, the cell will upregulate myelination machinery and develop into a myelinating Schwann cell. In contrast, non-myelinating Schwann cells randomly encounter small-diameter axons. Although conduction velocity along myelinated axons is much more rapid, axons that lack myelination are hypothesized to demonstrate greater plasticity to response to injury and/or disease (Griffin and Thompson, 2008). Consequently, non-myelinating Schwann cells are purported as rapid responders to support injured axons (Jessen and Mirsky, 2005). The human choroid receives neuronal input from parasympathetic, sympathetic, and the trigeminal nerve fibers (Reiner et al., 2018). The molecular identification of different supportive Schwann cells classes provides insight into the physiology and maintenance of these processes.
4.3. Characterizing transcription along the choroidal vascular tree
To our surprise, endothelial cells only represented 4% of all recovered cells in our initial scRNA-seq investigation (Figure 13), which was much lower than the number of endothelial cells we expected to recover based on histological observation. Therefore, we conducted a morphometric experiment using immunohistochemistry to estimate the true proportion of endothelial cells in the choroid. Human choroidal tissue sections were labeled with DAPI and fluorescently tagged antibodies against either CD34 (to identify endothelial cells) or CD45 (to identify leukocytes). We then developed an automated cell counting macro for ImageJ to enumerate the proportion of endothelial cells and leukocytes compared to all DAPI-positive nuclei (Figure 13A–C). According to morphometric counting across four human donors, endothelial cells represent approximately 18% of total RPE/choroidal cells, which is over four times greater than our observed endothelial cell recovery by scRNA-seq. We hypothesized that this discrepancy was due to incomplete dissociation of our RPE/choroidal punches. Unlike leukocytes and fibroblasts, choriocapillaris endothelial cells are firmly embedded in extracellular matrix (ECM) in both their own basal laminae as well as in the intercapillary pillars of Bruch’s membrane. In the setting of incomplete dissociation, large endothelial-ECM complexes would be theoretically removed during filtration of the cell suspension prior to scRNA-seq and thus not subject to study.
Figure 13: Choroidal endothelial cell proportions according to immunohistochemistry and scRNA-seq.

A-B. We acquired fluorescent images from four human donor RPE/choroids by labeling cells with DAPI and (A) CD34 (labeling endothelial cells) or (B) CD45 (labeling white blood cells). C. Using a custom ImageJ macro, the total number of RPE/choroidal nuclei were counted. Next, DAPI-labeled nuclei with overlying CD34 or CD45 expression were enumerated. The number of CD34 positive or CD45 positive cells were divided by the total number of nuclei in each section, resulting in our estimate that 18% of choroidal cells are endothelial. D. In our unselected RPE/choroidal scRNA-seq experiment, only 4% of all recovered cells expressed endothelial specific genes. E. In two subsequent scRNA-seq experiments, we enriched for CD31-expressing endothelial cells prior to barcoding. This resulted in a ~13 fold enrichment of endothelial cells compared to unselected experiments. Donors 4–7 are described in (Voigt et al., 2019a) while donors 8–11 are described in (Voigt et al., 2020c).
The poor recovery of endothelial cells was particularly disappointing as choroidal endothelial dysfunction is central to AMD pathogenesis. In particular, histological and imaging studies suggest that degeneration of the superficial choriocapillaris is the first observable event in AMD pathogenesis and occurs underneath a physically intact RPE monolayer (Biesemeier et al., 2014; Lutty and McLeod, 2005; Mullins et al., 2011). A potential cause of choriocapillaris death and dysfunction is complement activation. The choriocapillaris uniquely accumulates the membrane attack complex of the complement system while deeper choroidal vessels and other systemic vascular beds are spared (Chirco et al., 2016). Such membrane attack complex accumulation is proposed to lytically injure these endothelial cells (Whitmore et al., 2015) and drive choriocapillaris loss (Mullins et al., 2011). However, there has been considerable debate regarding what events initiate AMD pathogenesis, with photoreceptors, the RPE, and the choriocapillaris each proposed as the site of primary dysfunction. Recent advancements in swept-source optical coherence tomography (SS-OCT) and OCT angiography (OCTA) have allowed researchers to visualize previously inaccessible patterns of choroidal vascular loss in living patients (Kim et al., 2013). In living patients with dry AMD, choriocapillaris loss extends beyond the borders of geographic atrophy (Braun et al., 2019; Waheed et al., 2016). Further, blood flow through the choriocapillaris surrounding geographic atrophy lesions is reduced (Nassisi et al., 2019), supporting findings with laser doppler flowmetry that associate decreased choroidal blood flow with increased drusen abundance (Berenberg et al., 2012). Collectively, these imaging studies support the concept that choriocapillaris dysfunction is the first observable event in AMD pathogenesis. Likewise in our laboratory, we have histologically observed that decreased choriocapillaris vascular density is associated with increased cross sectional area of overlying drusen and more frequent basal deposits (Mullins et al., 2011). Proteomic studies in AMD demonstrate a loss of HLA-A antigen, CA4, and PLVAP (Yuan et al., 2010), all of which are highly expressed by choriocapillaris endothelial cells. Collectively, this large body of experimental work motivated us to study gene expression in greater numbers of choroidal endothelial cells, with the ultimate goal of identifying distinct populations of choriocapillaris endothelial cells.
In a second scRNA-seq experiment, we dissociated macular (12 mm) and peripheral (12 mm) RPE/choroid from four human donors. Dissociated cell suspensions were enriched for choroidal endothelial cells using magnetic beads conjugated to an anti-CD31 antibody prior to barcoding (Voigt et al., 2019a). This enrichment dramatically increased the recovery of cells expressing the canonical endothelial cell marker von Willebrand factor (VWF), and of the 14,234 total recovered cells, 7,647 (60%) were determined to be endothelial. This represented an approximately 15-fold endothelial cell enrichment compared to our initial investigation of the RPE-choroid (Figure 13D–E).
Importantly, recovering greater numbers of endothelial cells allowed us to identify different populations along the choroidal vascular tree. The choroid houses a uniquely organized vascular system. Large caliber choroidal arteries are found in the deeper choroid (in Haller’s and Sattler’s layers). A single pre-capillary arteriole rises superficially to supply each choriocapillaris lobule. A ring of post-capillary venules surrounds each lobule, which drains into deeper veins (Hayreh, 1975; Torczynski and Tso, 1976) (Figure 14). This anatomical organization is due in part to the unique development of the choroidal vasculature. While the deep choroidal vessels develop via angiogenesis, the choriocapillaris arises from a distinct precursor population called the hemangioblast and anastomoses with the deeper vessels around the 12th week of gestation (Hasegawa et al., 2007).
Figure 14. Anatomy of the choroidal vasculature.

The choriocapillaris is organized into superficial lobules supplied by a single central pre-capillary arteriole. Ring shaped, peripheral venules drain post-capillary blood into deeper and larger caliber veins.
Choroidal arteries, veins, and choriocapillaris endothelial cells demonstrated distinct transcriptomes, enabling detection of independent clusters for each of these cell types (Figure 15A). While all cells strongly expressed pan-endothelial cell markers such as VWF, the most enriched genes in each of the three clusters were known markers for arteries (e.g., SEMA3G, HEY1), choriocapillaris (e.g., CA4, PLVAP), and veins (e.g., DARC) (Figure 15B–E). In addition to previously known marker genes, differential expression analysis allowed us to identify new genes specific for each of these endothelial populations. For example, the 2nd most enriched gene in the choriocapillaris was the response gene to complement (RGCC), a gene which is activated by the membrane attack complex and is implicated in endothelial cell dysfunction (Badea et al., 1998).
Figure 15. Transcriptome of choroidal endothelial cells along the vascular tree.

A. Three distinct clusters of endothelial cells corresponding to choroidal arteries, veins, and choriocapillaris endothelial cells were observed after scRNA-seq. B. Violin plots of enriched genes in each cluster. All endothelial clusters demonstrate high expression of VWF, arteries highly express SEMA3G, the choriocapillaris expresses CA4, and veins express DARC. C-E. Differential expression analysis reveals the seven most enriched genes in arteries (C), choriocapillaris (D), and veins (E) compared to all other endothelial cells. Endothelial expression data combined from (Voigt et al., 2019a; Voigt et al., 2020c).
While CD31-enrichment drastically increased the proportion of recovered endothelial cells, we observed many non-endothelial choroidal cell types in this experiment. In particular, we recovered sizeable populations of pericytes and macrophages. Macrophages have been shown to express low amounts of CD31 (Liu and Shi, 2012) and pericytes closely interact with endothelial cells, making their recovery less surprising. Other cell types important in AMD pathogenesis such as RPE cells were recovered at considerably lower frequencies (Figure 13E).
4.4. Macular versus peripheral RPE and choroidal gene expression
Many retinal diseases originating in the RPE/choroid have macular predilections. In both the unselected and CD31-selected experiments, we prepared independent macular and peripheral libraries from each donor to identify genes that differed in expression by region. Previous bulk RNA sequencing and qPCR studies identified differentially expressed genes between the macular and peripheral RPE/choroid. For example, bestrophin-1 (BEST1) is expressed in RPE cells most highly outside the macula (Mullins et al., 2007), and conversely choriocapillaris ICAM1 expression is higher within the macula (Mullins et al., 2006). Indeed, both of these trends were recapitulated in the single-cell data, with peripheral RPE cells expressing more BEST1 (logFC = 0.4, absolute change = 149%) and macular choriocapillaris cells expressing more ICAM1 (logFC = 0.28, absolute change = 132%). However, most expression changes between macular and peripheral cells were more modest than those observed in the retina, with relatively few genes differing in expression greater than a (natural) log-fold change of 1.0.
Previous bulk RNA sequencing studies comparing macular versus peripheral RPE/choroid (Whitmore et al., 2014) identified more highly differentially expressed genes than the single-cell studies described above. For example, many RPE-specific genes such as LRAT and RPE65 demonstrated high enrichment in peripheral samples at the bulk level. However, at the single-cell level expression of these RPE-specific genes was very similar between the macula and periphery. We believe that this discrepancy can be attributed to different cellularity of the macular versus peripheral choroid. The choroid is thickest below the macula and thins radially (Hoseini-Yazdi et al., 2019). Thus in bulk studies, RPE-specific gene expression is diluted by more choroidal cells in the macula than in the periphery, making peripheral RPE-expression patterns appear higher. A similar finding is true in bulk studies of retina, in which the more abundant macular retinal ganglion cells contribute disproportionately to the total RNA content. This technical limitation is eliminated with scRNA-seq, demonstrating the power of this technology in identifying true biologically meaningful expression differences.
4.5. Endothelial gene expression changes with age
While diseases such as AMD are more pronounced in the macula, other biologic variables are associated with disease progression. In particular, age is the single most important risk factor for developing AMD, and numerous molecular changes in the choroid have been observed with advancing age. For example, the aging choroid progressively thins each year in adulthood (Wakatsuki et al., 2015), likely due to degenerative changes. Likewise, the membrane attack complex uniquely accumulates in the aging choriocapillaris, especially in individuals with AMD, while in youth the choriocapillaris remains relatively free from membrane attack complex (Chirco et al., 2016). As age-related vascular dysfunction contributes to pathology of numerous diseases (reviewed in (Donato et al., 2015)), we set out to identify how the choroidal endothelial transcriptome changes between infant and adult human donors.
Similar to our previous study, we performed scRNA-seq on CD31-enriched endothelial cells from the central macula of two infants (< 1 year of age) and two additional adult donors (> 60 years of age) (Voigt et al., 2020c). In order to recover other choroidal cell populations such as immune cells, we also prepared independent libraries for CD31-negative cell fractions from each of these donors. After scRNA-seq, we integrated expression profiles with our previous study (Voigt et al., 2019a) and identified endothelial cell clusters. In each cluster of choroidal arteries, veins, and choriocapillaris endothelial cells, we identified differentially expressed genes between infant and adults.
In general, infant endothelial cells had more anti-inflammatory expression profiles compared to adult endothelial cells. For example, the infant endothelial cells were enriched in several transcriptional regulators, including KLF2 (SenBanerjee et al., 2004), NR4A1 (You et al., 2009), and NR2F2 (Cui et al., 2015) that downregulate inflammatory surface adhesion molecules. In addition, infant endothelial cells had increased expression of AP-1 transcription factor components FOS and JUND, which protects against age-related endothelial dysfunction in mice (Paneni et al., 2013). Finally, infant choriocapillaris was enriched for the DNA-binding regulator ID3, which drives a stem-cell like phenotype of the microvasculature, including increased CD34 expression (Das et al., 2015). Indeed, CD34 expression was higher in infant versus adult choriocapillaris, corroborating our previous observations at the protein level (Sohn et al., 2014). In contrast, adult endothelial cells demonstrated more pro-inflammatory gene expression, including increased expression of adhesion molecules VCAM1, ICAM1, SELE, SELP as well as the chemokine receptor ACKR3, which regulates leukocyte entry from the endothelium (Cruz-Orengo et al., 2011). An age-related proinflammatory phenotype of the vasculature may drive increased leukocyte migration into the choroidal stroma, as is observed with increasing age (Cherepanoff et al., 2010; Ezzat et al., 2008; McLeod et al., 2016). Such leukocytes could instigate oxidative damage and other degenerative changes observed in diseases such as AMD.
4.6. Intersections with other choroidal endothelial scRNA-seq studies
Two additional studies have used scRNA-seq to characterize the choroidal transcriptome in mice (Lehmann et al., 2020; Rohlenova et al., 2020) and a single human donor (Rohlenova et al., 2020). To assess the consistency of endothelial gene expression across different datasets and species, we identified genes specific to arterial, choriocapillaris, and venous clusters of endothelial cells in each study (Figure 16). Overall, gene expression in each class of choroidal endothelial cells is highly consistent across species and experiments. For example, PLVAP, a gene expressed by fenestrated endothelial cells (Stan et al., 1999), is highly specific for the choriocapillaris across all datasets. Likewise, GJA4, a known marker of arterial endothelial cells, is enriched across all investigated populations of choroidal arteries. Interestingly, a few genes exhibited different expression between human and mouse studies. Complement inhibitor complement factor H (CFH) was slightly enriched in human arteries while clusterin (CLU) appeared enriched in human veins, yet the reverse pattern was observed in mice. Similarly, CA4 was expressed at very high levels by almost all human choriocapillaris endothelial cells. The homolog Car4 was enriched in the mouse choriocapillaris, but not nearly as strongly or specifically as in humans. While model systems such as mice lack anatomic features such as the macula, the transcriptomes of mouse choroidal endothelial cells closely mirror humans.
Figure 16: Choroidal endothelial gene expression across different experiments and species.

For each choroidal scRNA-seq dataset, we identified the top five most enriched genes (by average logFC) in arteries (red), choriocapillaris (purple), and veins (blue). The expression of these genes is visualized across each endothelial population in a dot plot, where the size of the circle corresponds to the proportion of each class of endothelial cells that express each gene in different datasets. The color of the circle corresponds to the average log fold-change in the endothelial population of interest versus other endothelial cells. Overall, the expression signatures of arteries, choriocapillaris, and veins are consistent across datasets and between experiments.
The Indian hedgehog (IHH) gene was identified to be enriched in choriocapillaris endothelial cells in a scRNA-seq study of mouse choroid (Lehmann et al., 2020). IHH encodes a secreted hedgehog protein that is expressed by epithelial cells in most tissues (Petrova and Joyner, 2014). After identifying enrichment of this gene with scRNA-seq, Lehmann and colleagues performed bulk RNA sequencing of endothelial cells isolated from the choroid, retina, lung, liver, and heart and identified that IHH expression was unique to choroidal capillaries. IHH enrichment in choriocapillaris endothelial cells was also observed in our human studies, and IHH was the 11th most enriched gene in choriocapillaris versus other endothelial cells (Figure 16). Likewise, GLI1, which is expressed in response to IHH signaling, was most highly expressed in our cluster of human fibroblasts, which corroborates the author’s finding that perivascular stromal cells are a target of IHH signaling.
4.7. Gene expression perturbations in macular degeneration
In addition to studying gene expression patterns in healthy choroidal endothelial cells, we also performed scRNA-seq on a single donor with neovascular AMD. To outline potential mechanisms of endothelial dysfunction, we set out to identify genes enriched in choroidal endothelial cells in this neovascular AMD donor.
Differential expression analysis identified several neovascular AMD enriched genes that have been implicated in endothelial dysfunction. For example, the regulator of cell cycle (RGCC) gene was the third most enriched gene in neovascular AMD choriocapillaris endothelial cells. The membrane attack complex has been proposed as a mediator of endothelial death and dysfunction (Whitmore et al., 2015) and intriguingly the membrane attack complex upregulates and activates RGCC (Badea et al., 1998). Upon such activation, RGCC increases inflammatory gene expression (Cui et al., 2018) and drives vascular dysfunction observed in atherosclerosis (Badea et al., 2002; Cui and Chen, 2018), making this gene an exciting AMD target. Another gene enriched in AMD choriocapillaris endothelial cells was early growth response protein 1 (EGR1) (#17 most neovascular AMD enriched choriocapillaris gene). EGR1 is a transcription factor with a zinc-finger domain (Gashler and Sukhatme, 1995) that is quickly activated in response to cell stress. Upon activation, EGR1 is viewed as a key mediator of endothelial cell response to injury (Fu et al., 2003). For example, EGR1 upregulates transcription of a variety of important genes involved in vascular health, including PDGF, FGF, TGFB, TNFA and ICAM1 (Silverman and Collins, 1999). Likewise, activating transcription factor 3 (ATF3) is a stress-inducible transcriptional regulator expressed in endothelial cells and enriched in the choriocapillaris of the neovascular AMD donor. ATF3 is activated by multiple cellular stressors, including DNA damage and oxidative stress. Interestingly, ATF3 expression has been shown to increase in response to serum factors (Hai et al., 1999), in line with our previous findings that ATF3 is greatly upregulated in RF6A cells treated with normal human serum (which contains all of the components necessary for membrane attack complex formation) (Zeng et al., 2016). While these upregulated genes in neovascular AMD represent promising potential mediators of choroidal endothelial cell dysfunction, they were only enriched in a single human donor, and such expression changes could be driven by inherent genetic variation. While the endothelial expression signature from this donor is valuable for hypothesis generation, many more AMD samples will be required before generalizing these findings to other patients.
Rohlenova and colleagues performed a scRNA-seq study to specifically identify gene expression changes in neovascular choroidal endothelial cells in mice (Rohlenova et al., 2020). In this investigation, mice were subjected to laser-induced choroidal neovascularization, and endothelial cells from injured and control animals were isolated for scRNA-seq ten days later. The authors characterized gene expression in several populations along the vascular tree, including arteries, arterioles, capillaries, venules, and veins. A unique population of endothelial cells expressing activated markers was observed exclusively in the lasered mice, which contained subpopulations of proliferating endothelial cells and tip endothelial cells. This neovascular endothelial population demonstrated dysregulated expression of several metabolomic genes involved in glycolysis, ATP synthesis, and membrane transport, perhaps suggesting that metabolic demand of these endothelial cells is particularly high. We investigated if the fifteen-most enriched genes from this murine choroidal neovascular cell population were enriched in the choriocapillaris of our single human donor with neovascular AMD (Figure 17). Eleven of the fifteen genes demonstrated some enrichment in the human neovascular AMD donor, suggesting potentially shared pathophysiology between this mouse model of choroidal neovascularization and human neovascular AMD.
Figure 17: Differential expression between neovascular AMD choriocapillaris (n = 1) and healthy choriocapillaris (n = 5).

The top fifteen enriched genes in the murine choroidal neovascular endothelial cell population are labeled (red dots). Eleven of the fifteen murine choroidal neovascular genes were enriched in this single human neovascular AMD donor.
In summary, the human and mouse choroid are both well suited for scRNA-seq studies. In addition to assigning expression patterns to a diverse number of choroidal cell types, enrichment strategies facilitate studying different populations of endothelial cells along the choroidal vascular tree. In particular, distinct clusters of choriocapillaris endothelial cells can be identified, which is important as these cells are both among the first to degenerate in atrophic AMD and contribute directly to the formation of neovascular membranes in exudative AMD. These methods have been successfully employed to identify differences between macular versus peripheral, young versus old, and healthy versus neovascular endothelial cells.
5. Modeling retinal development with organoids and pseudotime trajectories
Transcriptomic studies in retinal disease require access to ocular tissue, which cannot be directly obtained from living patients. While ultimately postmortem human tissue is the invaluable gold standard for expression studies, demographic and disease characteristics of incoming donors cannot be predicted. This complicates studying rare forms of retinal disease and is a barrier for single-cell gene expression studies. However, induced pluripotent stem cells (iPSCs) can be used as starting material to generate patient specific retinal (Tucker et al., 2011b; Wang et al., 2008) or choroidal endothelial cells (Giacalone et al., 2019; Mulfaul et al., 2020; Songstad et al., 2015) that closely model primary tissue. Such substrates recapitulate the complex cellular diversity of ocular tissues and allow for gene expression studies in rare retinal diseases. In this section, we will review how iPSC-derived retina has been used in single-cell expression studies and outline the emerging role of this technology in studying rare forms of retinal degeneration.
In 2006, Takahashi and Yamanaka reprogrammed somatic cells isolated from mice into a pluripotent state by delivering a set of four defined transcription factors (Takahashi and Yamanaka, 2006). Later that year, pluripotent embryonic stem cells were pushed toward a retinal fate with supplementary developmental factors Noggin, DKK1, and IGF-1 (Lamba et al., 2006). In addition to their utility in studying retinal development, such photoreceptor precursor cells have potential therapeutic benefit, and retinal cells derived from both embryonic stem cells (Lamba et al., 2009) and iPSCs (Mandai et al., 2017; Tucker et al., 2011a) were successfully transplanted into a mouse models of retinal degeneration where they induced partial restoration of electrical function. Subsequently, patient-specific iPSCs have proved to be useful for capturing the cellular diversity of the human retina (Phillips et al., 2014; Tucker et al., 2013b; Tucker et al., 2011b) and offer a new platform for gene therapy development and variant discovery (Tucker et al., 2013a; Tucker et al., 2013b; Tucker et al., 2011a; Wiley et al., 2016).
Studying transcription in such retinal organoid models has been of high interest to the vision research community. While scRNA-seq was in its infancy, capture rates and sensitivity (the number of identified RNA transcripts per cell) were low, which limited the power of this technology in early retinal organoid studies. For example, in an early scRNA-seq study using iPSC-derived retinal organoids, transcriptional differences were identified between early (d70) and late (d218) stages of retinal differentiation (Phillips et al., 2018). While discrete populations of different retinal cell types were not observed with principal component analysis, Phillips and colleagues assembled cells with similar relative expression of a known “bait” gene to create cellular groupings. As scRNA-seq technology advanced, iPSC reporter lines in combination with fluorescent-based cell sorting were used to enrich for organoid-derived cone photoreceptors (Welby et al., 2017) and retinal ganglion cells (Daniszewski et al., 2018) to more thoroughly characterize the transcriptome of these cell populations. More recent studies have focused on comparing the transcriptomes of iPSC-derived and primary human retina. For example, scRNA-seq of cone-rich retinal organoids has demonstrated that iPSC-derived photoreceptors transcriptionally resemble those from primary human tissue (Kim et al., 2019).
Due to the temporal nature of retinal organoid differentiation, pseudotime trajectory analysis has been a natural focus of scRNA-seq studies using these tissues. While most retinal organoid experiments include cells from multiple differentiation timepoints, cells do not mature in perfect synchrony, and even cells isolated from the same timepoint of differentiation can be at slightly different stages of maturation (Trapnell et al., 2014). Pseudotime analysis reduces this heterogeneity in differentiation by computational ordering of cells along a developmental trajectory (see 2.2 above). This analytical technique allows for gene expression to be studied temporally, especially at important timepoints such as lineage commitment.
Pseudotime trajectory analysis has captured the order of lineage commitment observed histologically in retinal organoids, with retinal progenitor cells first giving rise to retinal ganglion cells, followed by photoreceptors, and finally Müller glia (Collin et al., 2019). In addition, intermediate transitionary cell populations that fall between retinal progenitors and differentiated cell types have been identified (Sridhar et al., 2020). Such transitionary populations were also observed in fetal retina and noted to express important genes governing cell fate, such as ATOH7. Very large-scale experiments have recently profiled over 100,000 cells isolated from retinal organoids and fetal retina across numerous developmental time points (Lu et al., 2020). Again, pseudotime trajectory analysis in this study aided in identifying transiently expressed transcriptional factors that drive commitment to all major retinal populations, including retinal ganglion cells, horizontal cells, amacrine cells, rods, cones, and bipolar cells. Similar experiments have outlined retinal progenitor differentiation in mice, which demonstrated that the NFI family of transcription factors regulates bipolar and Müller glia cell commitment (Clark et al., 2019).
The aforementioned retinal organoid studies have been invaluable in transcriptionally modeling retinal differentiation and identifying key regulatory elements, such as transcription factors, that drive maturation of different retinal populations. In addition to advancing our understanding of normal retinal physiology, retinal organoids have the potential to model rare visual diseases. For example, skin biopsies can be obtained from patients with inherited forms of retinal degeneration, which can be used to generate iPSCs and subsequently retinal organoids. Such patient-derived organoid models demonstrate features of disease phenotypes (Burnight et al., 2014; Huang et al., 2019; Sharma et al., 2017; Tucker et al., 2013b; Tucker et al., 2014) and share a common splicing program with primary retina (Kim et al., 2019; Tucker et al., 2011b), suggesting that gene expression studies can provide insight into disease pathophysiology in these tissues.
In a recent investigation, scRNA-seq was performed on retinal organoids derived from a patient with a homozygous null mutation in the neural retina leucine zipper (NRL) gene (Kallman et al., 2020). NRL is required for development of rod photoreceptors, as this gene activates the NR2E3 transcription factor which suppresses cone-specific gene expression (Cheng et al., 2004). Hence, patients with NRL mutations have unregulated cone development, resulting in an increased numbers of S-cones (known as enhanced S-cone syndrome) and a deficiency of rod photoreceptors, leading to night blindness (Haider et al., 2000). Kallman and colleagues performed scRNA-seq on patient-derived NRL null and wild type retinal organoids, each differentiated to ~100-day and 170-day time points. Unsurprisingly, the NRL null organoids were enriched in S-cone photoreceptors and demonstrated a relative rod photoreceptor deficiency, mirroring the human retinal phenotype. Differential expression was performed to identify genes enriched in each cell population from the NRL null organoids. While NRL null and wild type cone photoreceptors shared similar expression profiles, the NRL null rod population had high expression of the S-cone opsin ONPN1SW, suggesting a possible rod-cone hybrid (or “cod”) expression profile. This prompted Kallman and colleagues to search for additional transcription factors that direct rod versus cone photoreceptor commitment. They identified MEF2C as a gene with higher expression in cones than both cods and rods and speculate that this transcription factor may direct cone maturation. However in mice, MEF2C acts downstream of NRL and expressed in rod photoreceptors (Hao et al., 2011). Thus, it is possible that MEF2C plays different roles in photoreceptor fate determination in different species.
In summary, retinal organoids serve as a more accessible source of tissue for gene expression studies, especially for rare diseases. This technology also offers a window into the developmental process of human retinal maturation. ScRNA-seq of retinal organoids has characterized gene expression in the major retinal cell classes and uncovered regulators of development and cell specification. Future gene expression studies in iPSC models from patients with retinal degeneration will provide important pathophysiological insight. In addition, CRISPR/Cas9 genome editing can correct mutations in patient derived iPSCs, allowing for the generation of isogenic control lines with the same genetic background as the patient (Burnight et al., 2018). Such patient-specific control lines will be invaluable comparison groups to pinpoint how a single mutated gene instigates retinal disease.
6. Expression of known retinal disease genes
Identifying which cell types express important retinal disease genes provides a potential starting point for understanding their pathophysiology. Therefore, we integrated our four scRNA-seq studies described above to generate a combined atlas of retina, RPE, and choroidal disease gene expression (Voigt et al., 2020a; Voigt et al., 2019a; Voigt et al., 2019b; Voigt et al., 2020c).
First, we examined expression patterns of all known genes implicated in Mendelian retinal disease (Figure 18A). Our laboratories have developed a classification system to organize inherited retinal disease by clinical features and molecular drivers (Stone et al., 2017). This classification system divides inherited retinal disease into three overarching groupings: photoreceptor disease (branch I), macular dystrophies (branch II), and other diseases (branch III). When groups of inherited retinal disease genes with similar expression patterns are clustered, the single-cell expression data largely recapitulates the clinical classification scheme (Figure 18A, bottom row). For example, mutated genes in photoreceptor disease (orange) predominantly localize to the middle of the heatmap where there are distinct patterns of genes expressed highly in both rods and cones, in rods only, in cones only, or in supporting RPE cells. In contrast, genes mutated in the third branch (green) tend to be expressed in the choroid (left portion of the heatmap) or in the inner retina (right portion of the heatmap). The fact that clustering largely recapitulates this clinical classification scheme highlights the strong connection between gene expression, cell function, and clinical features of retinal disease.
Figure 18: Expression of genes implicated in retinal disease.

Heatmaps depict expression of important genes implicated in retinal disease, where cell types are anatomically arranged on the y-axis and retinal disease genes are organized along the x-axis. For each gene, the mean and standard deviation of expression is computed across all populations, and the z-score of expression is represented for each population. A more yellow color indicates that a cell population highly and specifically expresses a given gene. Genes that were lowly expressed across all populations (normalized expression < 1) were excluded from analysis. A. Expression of genes mutated in mendelian inherited retinal disease. The category of each gene in our clinical classification system is appended onto the bottom row of the heatmap (Stone et al., 2017). B. Expression of genes with single nucleotide variants in AMD (Fritsche et al., 2016b). C. Expression of complement components, activators, and regulators.
In addition to studying Mendelian retinal disease, scRNA-seq can provide insight into pathogenesis mechanisms and therapy design in AMD. A total of 34 loci with single-nucleotide variants have been associated with advanced AMD (Fritsche et al., 2016b). Several of the 34 AMD-associated loci are neither in the coding sequence nor in known regulatory regions of protein coding genes, and in such instances nearby and/or canonical genes are broadly used to refer to these variants. Like our investigation of Mendelian inherited retinal disease, we generated a heatmap to depict gene expression patterns of these AMD genes across the retina, RPE, and choroid (Figure 18B). Genetic variants implicated in AMD demonstrate wide-ranging expression patterns spanning the retina, RPE, and choroid. For example, several AMD associated genes appear specific for glial cells (VEGFA, APOE, CFI, C3), cone photoreceptor cells (COL4A3, VTN), choroidal endothelial cells (CFH, KMT2E), immune cells (CD63, PILRA), and the RPE (TSPAN10, RDH5, SLV16A8, TRPM3). Of note, some genes such as ARMS2 are excluded from this analysis due to low expression in all identified cell populations.
Complement dysregulation in the choroid is also of high interest in AMD (reviewed in (Whitmore et al., 2015)). In analyzing the expression patterns of complement components, activators, and regulators (Figure 18C), we noted that choroidal cell types express more complement inhibitors than the overlying RPE or retina (Figure 18C). In particular, choroidal arteries, veins, and the choriocapillaris express high amounts of important complement regulators CD46, CD55, CD59, CD93, and CFH. While a few complement inhibitors were highly expressed in retinal glial cells (CFI, CLU), the majority of complement regulation gene expression appears at the level of the choroid. CFH expression is of particular interest due to the high association of variants in this gene with AMD (Edwards et al., 2005; Haines et al., 2005; Klein et al., 2005). In analyzing the aggregated expression of CFH between the retina, RPE, and choroid, two major populations express this gene: choroidal endothelial cells (arteries > choriocapillaris > veins) and choroidal stromal cells (fibroblasts and pericytes). For example, the choriocapillaris endothelial cells express ~20x more CFH than any cell population in the retina and ~4.1x more CFH than the RPE. This analysis and visualization supports the idea that complement inhibition is very important at the level of the choroidal vasculature.
7. Sharing and interpreting complex single-cell RNA sequencing data
ScRNA-seq has revolutionized ocular gene expression studies. However, analyzing data from scRNA-seq experiments is computationally challenging and requires a degree of bioinformatic expertise (Luecken and Theis, 2019). This analytical barrier limits the utility of scRNA-seq results in the broader vision research community. Sharing spreadsheets of differential expression results or heatmaps of highly expressed genes can allow for a degree of experimental collaboration, but in our experience directly visualizing and interacting with the data leads to improved understanding of the biology captured by scRNA-seq.
To facilitate collaboration and distribution of data, we developed an interactive resource for exploring scRNA-seq studies in ocular tissues (Voigt et al., 2020b). This resource, called Spectacle, hosts five of our previously described studies and is freely accessible at https://oculargeneexpression.org/singlecell. While other platforms such as the Single Cell Portal allow for some analysis of single-cell data, the broad inclusion of bioinformatic techniques used for data processing precludes detailed interactive analysis. For example, interactive analysis in the Single Cell Portal is limited to generating heatmaps that communicate which clusters express a specific gene. In contrast, Spectacle offers a suite of interactive features that allow the user to query gene expression and recluster groups of cells to identify subpopulations. In addition, Spectacle facilitates highly flexible differential expression analysis between manually selected populations of cells or between biological conditions (such as disease status or region). This allows users to identify cell-specific promoters for molecular experiments or generate hypotheses regarding pathogenesis of inherited retinal disease. In addition to the user interface, we also have hosted fully processed Seurat RData objects to facilitate rapid re-analysis of our data (https://oculargeneexpression.org/pages/methods_tech.html). In summary, we believe that Spectacle lowers the bioinformatic barrier to scRNA-seq data analysis and provides fast, free access to rich ocular single-cell expression datasets (Figure 19).
Figure 19: A screenshot of the Spectacle user interface.

Spectacle is a freely accessible (https://oculargeneexpression.org/singlecell) resource for interactive exploration of previously generated scRNA-seq studies in ocular tissues.
8. Future directions and conclusions
Five years ago, the first Drop-Seq experiment was performed on mouse retina (Macosko et al., 2015). Since this revolutionary experiment, scRNA-seq has been rapidly adopted by the vision research community, and gene expression has been studied at an unprecedented level of resolution in the retina, RPE, choroid, and retinal organoids. In these heterogenous tissues, scRNA-seq has allowed for profiling individual cell types and has advanced our understanding of retinal cell biology and disease pathophysiology. However, this brief yet informative chapter of generating expression atlases in normal ocular tissues is beginning to close. Numerous publicly available datasets have detailed expression in hundreds of thousands of human retina, RPE, choroid, and retinal organoid cells which provide an informative resource for the vision research community.
The next chapter of single-cell expression studies, which is already underway, will focus on identifying expression changes that drive retinal disease. Why do some retinal diseases manifest with reproducible regional predilections? What cell types have perturbed expression patterns in the setting of rare diseases? How do single nucleotide variants influence gene expression in different cells? Both post-mortem human tissue and patient-derived retinal organoids will be central to answering these questions. Cryopreservation of human samples allows for extensive genotyping and histological analysis of donor tissue, which permits studying gene expression changes of more common variants, such as those associated with AMD. Experiments with post-mortem tissue capture the complex interplay between genetics and environment in human donors with documented visual function. Such human tissues will be essential for addressing complicated physiological questions such as why the inferior retina is more profoundly affected in RHO-associated retinitis pigmentosa (Coussa et al., 2019). In contrast, patient derived retinal organoids will offer an opportunity to study rare retinal diseases within a patient’s genetic background. Using iPSCs from donors with uncharacterized inherited retinal disease, scRNA-seq may identify expression changes driven by non-coding variants and identify pathogenesis models for these diseases (Mullin et al., 2020). In combination with genome editing and pseudotime analysis, such studies offer great promise to elucidate new disease mechanisms and advance the development of autologous cell replacement therapies. In order to prioritize candidate genes identified by future scRNA-seq studies, high throughput functional validations will likely be required. For example, it is possible to alter expression of target genes with siRNA or overexpression before acquiring cell death or electrophysiological readouts. Such assays will help prioritize and validate the numerous candidates identified by scRNA-seq studies.
Technological and computational advancements in scRNA-seq will facilitate this new wave of experiments. As sequencing costs continue to decrease, it will be financially possible to include more biological and technical replicates, increasing the power to detect expression changes across different biological conditions. In addition, recent developments in spatial transcriptomics (Ståhl et al., 2016) and barcoding technology (Hagemann-Jensen et al., 2020) will aid in detecting regional or isoform-specific expression patterns. Optimizing and commercializing such technologies will be key in making these experiments accessible to most laboratories and reproducible between different research groups (Zerti et al., 2020). Likewise, bioinformatic improvements in normalization, co-expression analysis, and visualization may unlock new discoveries within existing datasets.
In summary, scRNA-seq has provided invaluable expression data in ocular tissues. This technology will continue to advance our understanding of retinal physiology and promote development of the next generation of retinal disease therapies.
Highlights:
Single-cell RNA sequencing allows for high resolution transcriptome profiling of heterogenous ocular tissues
Human cone photoreceptor cells and Muller cells have different expression profiles in the fovea versus the periphery
Distinct populations of choriocapillaris, arterial, and venous endothelial cells can be identified with scRNA-seq
scRNA-seq of patient-derived induced pluripotent stem cell models promotes discovery of new disease pathogenesis models
Acknowledgements:
This work was supported by National Institutes of Health grants EY027038, EY024605, P30 EY025580, and F30 EY031923, the MSTP training grant T32 GM007337, with additional support from the Research to Prevent Blindness, the Elmer and Sylvia Sramek Charitable Foundation, and the Martin Carver Chair in Ocular Cell Biology.
Abbreviations:
- scRNA-seq
single-cell RNA sequencing
- AMD
age-related macular degeneration
- RPE
retinal pigment epithelium
- iPSC
induced pluripotent stem cell
- AIR
autoimmune retinopathy
- CFH
complement factor H
References
- Bacher R, Chu L-F, Leng N, Gasch AP, Thomson JA, Stewart RM, Newton M, Kendziorski C, 2017. SCnorm: robust normalization of single-cell RNA-seq data. Nature Methods 14, 584–586 DOI: 10.1038/nmeth.4263. [DOI] [PMC free article] [PubMed] [Google Scholar]
- Badea T, Niculescu F, Soane L, Fosbrink M, Sorana H, Rus V, Shin ML, Rus H, 2002. RGC-32 increases p34CDC2 kinase activity and entry of aortic smooth muscle cells into S-phase. The Journal of biological chemistry 277, 502–508 DOI: 10.1074/jbc.M109354200. [DOI] [PubMed] [Google Scholar]
- Badea TC, Niculescu FI, Soane L, Shin ML, Rus H, 1998. Molecular cloning and characterization of RGC-32, a novel gene induced by complement activation in oligodendrocytes. The Journal of biological chemistry 273, 26977–26981 DOI: 10.1074/jbc.273.41.26977. [DOI] [PubMed] [Google Scholar]
- Becht E, McInnes L, Healy J, Dutertre C-A, Kwok IWH, Ng LG, Ginhoux F, Newell EW, 2019. Dimensionality reduction for visualizing single-cell data using UMAP. Nature Biotechnology 37, 38–44 DOI: 10.1038/nbt.4314. [DOI] [PubMed] [Google Scholar]
- Berenberg TL, Metelitsina TI, Madow B, Dai Y, Ying GS, Dupont JC, Grunwald L, Brucker AJ, Grunwald JE, 2012. The association between drusen extent and foveolar choroidal blood flow in age-related macular degeneration. Retina (Philadelphia, Pa.) 32, 25–31 DOI: 10.1097/IAE.0b013e3182150483. [DOI] [PMC free article] [PubMed] [Google Scholar]
- Bhutto IA, McLeod DS, Jing T, Sunness JS, Seddon JM, Lutty GA, 2016. Increased choroidal mast cells and their degranulation in age-related macular degeneration. The British journal of ophthalmology 100, 720–726 DOI: 10.1136/bjophthalmol-2015-308290. [DOI] [PMC free article] [PubMed] [Google Scholar]
- Biesemeier A, Taubitz T, Julien S, Yoeruek E, Schraermeyer U, 2014. Choriocapillaris breakdown precedes retinal degeneration in age-related macular degeneration. Neurobiology of aging 35, 2562–2573 DOI: 10.1016/j.neurobiolaging.2014.05.003. [DOI] [PubMed] [Google Scholar]
- Booij JC, ten Brink JB, Swagemakers SM, Verkerk AJ, Essing AH, van der Spek PJ, Bergen AA, 2010. A new strategy to identify and annotate human RPE-specific gene expression. PloS one 5, e9341 DOI: 10.1371/journal.pone.0009341. [DOI] [PMC free article] [PubMed] [Google Scholar]
- Bowes Rickman C, Ebright JN, Zavodni ZJ, Yu L, Wang T, Daiger SP, Wistow G, Boon K, Hauser MA, 2006. Defining the human macula transcriptome and candidate retinal disease genes using EyeSAGE. Investigative ophthalmology & visual science 47, 2305–2316 DOI: 10.1167/iovs.05-1437. [DOI] [PMC free article] [PubMed] [Google Scholar]
- Braun PX, Mehta N, Gendelman I, Alibhai AY, Moult EM, Zhao Y, Ishibazawa A, Sorour O, Konstantinou EK, Baumal CR, Witkin AJ, Fujimoto JG, Duker JS, Waheed NK, 2019. Global Analysis of Macular Choriocapillaris Perfusion in Dry Age-Related Macular Degeneration using Swept-Source Optical Coherence Tomography Angiography. Investigative ophthalmology & visual science 60, 4985–4990 DOI: 10.1167/iovs.19-27861. [DOI] [PMC free article] [PubMed] [Google Scholar]
- Burnight ER, Giacalone JC, Cooke JA, Thompson JR, Bohrer LR, Chirco KR, Drack AV, Fingert JH, Worthington KS, Wiley LA, Mullins RF, Stone EM, Tucker BA, 2018. CRISPR-Cas9 genome engineering: Treating inherited retinal degeneration. Progress in retinal and eye research 65, 28–49 DOI: 10.1016/j.preteyeres.2018.03.003. [DOI] [PMC free article] [PubMed] [Google Scholar]
- Burnight ER, Wiley LA, Drack AV, Braun TA, Anfinson KR, Kaalberg EE, Halder JA, Affatigato LM, Mullins RF, Stone EM, Tucker BA, 2014. CEP290 gene transfer rescues Leber congenital amaurosis cellular phenotype. Gene Ther. 21, 662–672 DOI: 10.1038/gt.2014.39. [DOI] [PMC free article] [PubMed] [Google Scholar]
- Butler A, Hoffman P, Smibert P, Papalexi E, Satija R, 2018. Integrating single-cell transcriptomic data across different conditions, technologies, and species. Nature Biotechnology 36, 411 DOI: 10.1038/nbt.4096 [DOI] [PMC free article] [PubMed] [Google Scholar]
- https://www.nature.com/articles/nbt.4096#supplementary-information.
- Cai H, Fields MA, Hoshino R, Priore LV, 2012. Effects of aging and anatomic location on gene expression in human retina. Front Aging Neurosci 4, 8 DOI: 10.3389/fnagi.2012.00008. [DOI] [PMC free article] [PubMed] [Google Scholar]
- Cao J, Packer JS, Ramani V, Cusanovich DA, Huynh C, Daza R, Qiu X, Lee C, Furlan SN, Steemers FJ, Adey A, Waterston RH, Trapnell C, Shendure J, 2017. Comprehensive single-cell transcriptional profiling of a multicellular organism. Science 357, 661–667 DOI: 10.1126/science.aam8940. [DOI] [PMC free article] [PubMed] [Google Scholar]
- Cao J, Spielmann M, Qiu X, Huang X, Ibrahim DM, Hill AJ, Zhang F, Mundlos S, Christiansen L, Steemers FJ, Trapnell C, Shendure J, 2019. The single-cell transcriptional landscape of mammalian organogenesis. Nature 566, 496–502 DOI: 10.1038/s41586-019-0969-x. [DOI] [PMC free article] [PubMed] [Google Scholar]
- Chen G, Ning B, Shi T, 2019. Single-Cell RNA-Seq Technologies and Related Computational Data Analysis. Front Genet 10, 317 DOI: 10.3389/fgene.2019.00317. [DOI] [PMC free article] [PubMed] [Google Scholar]
- Chen L, Ma L, Bai Q, Zhu X, Zhang J, Wei Q, Li D, Gao C, Li J, Zhang Z, Liu C, He Z, Zeng X, Zhang A, Qu W, Zhuang Z, Chen W, Xiao Y, 2014. Heavy metal-induced metallothionein expression is regulated by specific protein phosphatase 2A complexes. The Journal of biological chemistry 289, 22413–22426 DOI: 10.1074/jbc.M114.548677. [DOI] [PMC free article] [PubMed] [Google Scholar]
- Cheng H, Khanna H, Oh EC, Hicks D, Mitton KP, Swaroop A, 2004. Photoreceptor-specific nuclear receptor NR2E3 functions as a transcriptional activator in rod photoreceptors. Hum. Mol. Genet 13, 1563–1575 DOI: 10.1093/hmg/ddh173. [DOI] [PubMed] [Google Scholar]
- Cherepanoff S, McMenamin P, Gillies MC, Kettle E, Sarks SH, 2010. Bruch’s membrane and choroidal macrophages in early and advanced age-related macular degeneration. The British journal of ophthalmology 94, 918–925 DOI: 10.1136/bjo.2009.165563. [DOI] [PubMed] [Google Scholar]
- Chidlow G, Wood JP, Knoops B, Casson RJ, 2016. Expression and distribution of peroxiredoxins in the retina and optic nerve. Brain Struct Funct 221, 3903–3925 DOI: 10.1007/s00429-015-1135-3. [DOI] [PMC free article] [PubMed] [Google Scholar]
- Chirco KR, Tucker BA, Stone EM, Mullins RF, 2016. Selective accumulation of the complement membrane attack complex in aging choriocapillaris. Experimental eye research 146, 393–397 DOI: 10.1016/j.exer.2015.09.003. [DOI] [PMC free article] [PubMed] [Google Scholar]
- Chowers I, Liu D, Farkas RH, Gunatilaka TL, Hackam AS, Bernstein SL, Campochiaro PA, Parmigiani G, Zack DJ, 2003. Gene expression variation in the adult human retina. Human molecular genetics 12, 2881–2893 DOI: 10.1093/hmg/ddg326. [DOI] [PubMed] [Google Scholar]
- Chowers I, Wong R, Dentchev T, Farkas RH, Iacovelli J, Gunatilaka TL, Medeiros NE, Presley JB, Campochiaro PA, Curcio CA, Dunaief JL, Zack DJ, 2006. The iron carrier transferrin is upregulated in retinas from patients with age-related macular degeneration. Investigative ophthalmology & visual science 47, 2135–2140 DOI: 10.1167/iovs.05-1135. [DOI] [PubMed] [Google Scholar]
- Clark BS, Stein-O’Brien GL, Shiau F, Cannon GH, Davis-Marcisak E, Sherman T, Santiago CP, Hoang TV, Rajaii F, James-Esposito RE, Gronostajski RM, Fertig EJ, Goff LA, Blackshaw S, 2019. Single-Cell RNA-Seq Analysis of Retinal Development Identifies NFI Factors as Regulating Mitotic Exit and Late-Born Cell Specification. Neuron 102, 1111–1126.e1115 DOI: 10.1016/j.neuron.2019.04.010. [DOI] [PMC free article] [PubMed] [Google Scholar]
- Collin J, Queen R, Zerti D, Dorgau B, Hussain R, Coxhead J, Cockell S, Lako M, 2019. Deconstructing Retinal Organoids: Single Cell RNA-Seq Reveals the Cellular Components of Human Pluripotent Stem Cell-Derived Retina. Stem Cells 37, 593–598 DOI: 10.1002/stem.2963. [DOI] [PMC free article] [PubMed] [Google Scholar]
- Coussa RG, Basali D, Maeda A, DeBenedictis M, Traboulsi EI, 2019. Sector retinitis pigmentosa: Report of ten cases and a review of the literature. Molecular vision 25, 869–889. [PMC free article] [PubMed] [Google Scholar]
- Cowan CS, Renner M, De Gennaro M, Gross-Scherf B, Goldblum D, Hou Y, Munz M, Rodrigues TM, Krol J, Szikra T, Cuttat R, Waldt A, Papasaikas P, Diggelmann R, Patino-Alvarez CP, Galliker P, Spirig SE, Pavlinic D, Gerber-Hollbach N, Schuierer S, Srdanovic A, Balogh M, Panero R, Kusnyerik A, Szabo A, Stadler MB, Orgül S, Picelli S, Hasler PW, Hierlemann A, Scholl HPN, Roma G, Nigsch F, Roska B, 2020. Cell Types of the Human Retina and Its Organoids at Single-Cell Resolution. Cell 182, 1623–1640.e1634 DOI: 10.1016/j.cell.2020.08.013. [DOI] [PMC free article] [PubMed] [Google Scholar]
- Cruz-Orengo L, Holman DW, Dorsey D, Zhou L, Zhang P, Wright M, McCandless EE, Patel JR, Luker GD, Littman DR, Russell JH, Klein RS, 2011. CXCR7 influences leukocyte entry into the CNS parenchyma by controlling abluminal CXCL12 abundance during autoimmunity. J Exp Med 208, 327–339 DOI: 10.1084/jem.20102010. [DOI] [PMC free article] [PubMed] [Google Scholar]
- Cui X, Lu YW, Lee V, Kim D, Dorsey T, Wang Q, Lee Y, Vincent P, Schwarz J, Dai G, 2015. Venous Endothelial Marker COUP-TFII Regulates the Distinct Pathologic Potentials of Adult Arteries and Veins. Sci Rep 5, 16193 DOI: 10.1038/srep16193. [DOI] [PMC free article] [PubMed] [Google Scholar]
- Cui XB, Chen SY, 2018. Response Gene to Complement 32 in Vascular Diseases. Front Cardiovasc Med 5, 128 DOI: 10.3389/fcvm.2018.00128. [DOI] [PMC free article] [PubMed] [Google Scholar]
- Cui XB, Luan JN, Dong K, Chen S, Wang Y, Watford WT, Chen SY, 2018. RGC-32 (Response Gene to Complement 32) Deficiency Protects Endothelial Cells From Inflammation and Attenuates Atherosclerosis. Arterioscler Thromb Vasc Biol 38, e36–e47 DOI: 10.1161/atvbaha.117.310656. [DOI] [PMC free article] [PubMed] [Google Scholar]
- Curcio CA, Sloan KR, Kalina RE, Hendrickson AE, 1990. Human photoreceptor topography. The Journal of comparative neurology 292, 497–523 DOI: 10.1002/cne.902920402. [DOI] [PubMed] [Google Scholar]
- Dal Molin A, Baruzzo G, Di Camillo B, 2017. Single-Cell RNA-Sequencing: Assessment of Differential Expression Analysis Methods. Front Genet 8, 62 DOI: 10.3389/fgene.2017.00062. [DOI] [PMC free article] [PubMed] [Google Scholar]
- Daniszewski M, Senabouth A, Nguyen QH, Crombie DE, Lukowski SW, Kulkarni T, Sluch VM, Jabbari JS, Chamling X, Zack DJ, Pébay A, Powell JE, Hewitt AW, 2018. Single cell RNA sequencing of stem cell-derived retinal ganglion cells. Sci Data 5, 180013 DOI: 10.1038/sdata.2018.13. [DOI] [PMC free article] [PubMed] [Google Scholar]
- Das JK, Voelkel NF, Felty Q, 2015. ID3 contributes to the acquisition of molecular stem cell-like signature in microvascular endothelial cells: its implication for understanding microvascular diseases. Microvasc Res 98, 126–138 DOI: 10.1016/j.mvr.2015.01.006. [DOI] [PMC free article] [PubMed] [Google Scholar]
- de Hoz R, Rojas B, Ramírez AI, Salazar JJ, Gallego BI, Triviño A, Ramírez JM, 2016. Retinal Macroglial Responses in Health and Disease. Biomed Res Int 2016, 2954721 DOI: 10.1155/2016/2954721. [DOI] [PMC free article] [PubMed] [Google Scholar]
- den Hollander AI, van Driel MA, de Kok YJ, van de Pol DJ, Hoyng CB, Brunner HG, Deutman AF, Cremers FP, 1999. Isolation and mapping of novel candidate genes for retinal disorders using suppression subtractive hybridization. Genomics 58, 240–249 DOI: 10.1006/geno.1999.5823. [DOI] [PubMed] [Google Scholar]
- Dentchev T, Hahn P, Dunaief JL, 2005. Strong labeling for iron and the iron-handling proteins ferritin and ferroportin in the photoreceptor layer in age-related macular degeneration. Archives of ophthalmology (Chicago, Ill. : 1960) 123, 1745–1746 DOI: 10.1001/archopht.123.12.1745. [DOI] [PubMed] [Google Scholar]
- Ding J, Adiconis X, Simmons SK, Kowalczyk MS, Hession CC, Marjanovic ND, Hughes TK, Wadsworth MH, Burks T, Nguyen LT, Kwon JYH, Barak B, Ge W, Kedaigle AJ, Carroll S, Li S, Hacohen N, Rozenblatt-Rosen O, Shalek AK, Villani AC, Regev A, Levin JZ, 2020. Systematic comparison of single-cell and single-nucleus RNA-sequencing methods. Nat Biotechnol DOI: 10.1038/s41587-020-0465-8. [DOI] [PMC free article] [PubMed] [Google Scholar]
- Ding J, Lin C, Bar-Joseph Z, 2019. Cell lineage inference from SNP and scRNA-Seq data. Nucleic Acids Res 47, e56 DOI: 10.1093/nar/gkz146. [DOI] [PMC free article] [PubMed] [Google Scholar]
- Donato AJ, Morgan RG, Walker AE, Lesniewski LA, 2015. Cellular and molecular biology of aging endothelial cells. J Mol Cell Cardiol 89, 122–135 DOI: 10.1016/j.yjmcc.2015.01.021. [DOI] [PMC free article] [PubMed] [Google Scholar]
- Dunaief JL, 2006. Iron induced oxidative damage as a potential factor in age-related macular degeneration: the Cogan Lecture. Investigative ophthalmology & visual science 47, 4660–4664 DOI: 10.1167/iovs.06-0568. [DOI] [PubMed] [Google Scholar]
- Eberhard DA, Brown MD, VandenBerg SR, 1994. Alterations of annexin expression in pathological neuronal and glial reactions. Immunohistochemical localization of annexins I, II (p36 and p11 subunits), IV, and VI in the human hippocampus. The American journal of pathology 145, 640–649. [PMC free article] [PubMed] [Google Scholar]
- Edwards AO, Ritter R 3rd, Abel KJ, Manning A, Panhuysen C, Farrer LA, 2005. Complement factor H polymorphism and age-related macular degeneration. Science 308, 421–424 DOI: 10.1126/science.1110189. [DOI] [PubMed] [Google Scholar]
- Ehrlich R, Harris A, Kheradiya NS, Winston DM, Ciulla TA, Wirostko B, 2008. Age-related macular degeneration and the aging eye. Clin Interv Aging 3, 473–482 DOI: 10.2147/cia.s2777. [DOI] [PMC free article] [PubMed] [Google Scholar]
- Esser P, Grisanti S, Kociok N, Abts H, Hueber A, Unfried K, Heimann K, Weller M, 1997. Expression and upregulation of microtubule-associated protein 1B in cultured retinal pigment epithelial cells. Investigative ophthalmology & visual science 38, 2852–2856. [PubMed] [Google Scholar]
- Ezzat MK, Hann CR, Vuk-Pavlovic S, Pulido JS, 2008. Immune cells in the human choroid. The British journal of ophthalmology 92, 976–980 DOI: 10.1136/bjo.2007.129742. [DOI] [PubMed] [Google Scholar]
- Fadl BR, Brodie SA, Malasky M, Boland JF, Kelly MC, Kelley MW, Boger E, Fariss R, Swaroop A, Campello L, 2020. An optimized protocol for retina single-cell RNA sequencing. Molecular vision 26, 705–717. [PMC free article] [PubMed] [Google Scholar]
- Farkas MH, Grant GR, White JA, Sousa ME, Consugar MB, Pierce EA, 2013. Transcriptome analyses of the human retina identify unprecedented transcript diversity and 3.5 Mb of novel transcribed sequence via significant alternative splicing and novel genes. BMC Genomics 14, 486 DOI: 10.1186/1471-2164-14-486. [DOI] [PMC free article] [PubMed] [Google Scholar]
- Feodorova Y, Koch M, Bultman S, Michalakis S, Solovei I, 2015. Quick and reliable method for retina dissociation and separation of rod photoreceptor perikarya from adult mice. MethodsX 2, 39–46 DOI: 10.1016/j.mex.2015.01.002. [DOI] [PMC free article] [PubMed] [Google Scholar]
- Figueroa JD, Serrano-Illan M, Licero J, Cordero K, Miranda JD, De Leon M, 2016. Fatty Acid Binding Protein 5 Modulates Docosahexaenoic Acid-Induced Recovery in Rats Undergoing Spinal Cord Injury. J Neurotrauma 33, 1436–1449 DOI: 10.1089/neu.2015.4186. [DOI] [PMC free article] [PubMed] [Google Scholar]
- Finak G, McDavid A, Yajima M, Deng J, Gersuk V, Shalek AK, Slichter CK, Miller HW, McElrath MJ, Prlic M, Linsley PS, Gottardo R, 2015. MAST: a flexible statistical framework for assessing transcriptional changes and characterizing heterogeneity in single-cell RNA sequencing data. Genome Biol 16, 278 DOI: 10.1186/s13059-015-0844-5. [DOI] [PMC free article] [PubMed] [Google Scholar]
- Flugel C, Tamm ER, Mayer B, Lutjen-Drecoll E, 1994. Species differences in choroidal vasodilative innervation: evidence for specific intrinsic nitrergic and VIP-positive neurons in the human eye. Investigative ophthalmology & visual science 35, 592–599. [PubMed] [Google Scholar]
- Fritsche LG, Igl W, Bailey JN, Grassmann F, Sengupta S, Bragg-Gresham JL, Burdon KP, Hebbring SJ, Wen C, Gorski M, Kim IK, Cho D, Zack D, Souied E, Scholl HP, Bala E, Lee KE, Hunter DJ, Sardell RJ, Mitchell P, Merriam JE, Cipriani V, Hoffman JD, Schick T, Lechanteur YT, Guymer RH, Johnson MP, Jiang Y, Stanton CM, Buitendijk GH, Zhan X, Kwong AM, Boleda A, Brooks M, Gieser L, Ratnapriya R, Branham KE, Foerster JR, Heckenlively JR, Othman MI, Vote BJ, Liang HH, Souzeau E, McAllister IL, Isaacs T, Hall J, Lake S, Mackey DA, Constable IJ, Craig JE, Kitchner TE, Yang Z, Su Z, Luo H, Chen D, Ouyang H, Flagg K, Lin D, Mao G, Ferreyra H, Stark K, von Strachwitz CN, Wolf A, Brandl C, Rudolph G, Olden M, Morrison MA, Morgan DJ, Schu M, Ahn J, Silvestri G, Tsironi EE, Park KH, Farrer LA, Orlin A, Brucker A, Li M, Curcio CA, Mohand-Said S, Sahel JA, Audo I, Benchaboune M, Cree AJ, Rennie CA, Goverdhan SV, Grunin M, Hagbi-Levi S, Campochiaro P, Katsanis N, Holz FG, Blond F, Blanche H, Deleuze JF, Igo RP Jr., Truitt B, Peachey NS, Meuer SM, Myers CE, Moore EL, Klein R, Hauser MA, Postel EA, Courtenay MD, Schwartz SG, Kovach JL, Scott WK, Liew G, Tan AG, Gopinath B, Merriam JC, Smith RT, Khan JC, Shahid H, Moore AT, McGrath JA, Laux R, Brantley MA Jr., Agarwal A, Ersoy L, Caramoy A, Langmann T, Saksens NT, de Jong EK, Hoyng CB, Cain MS, Richardson AJ, Martin TM, Blangero J, Weeks DE, Dhillon B, van Duijn CM, Doheny KF, Romm J, Klaver CC, Hayward C, Gorin MB, Klein ML, Baird PN, den Hollander AI, Fauser S, Yates JR, Allikmets R, Wang JJ, Schaumberg DA, Klein BE, Hagstrom SA, Chowers I, Lotery AJ, Leveillard T, Zhang K, Brilliant MH, Hewitt AW, Swaroop A, Chew EY, Pericak-Vance MA, DeAngelis M, Stambolian D, Haines JL, Iyengar SK, Weber BH, Abecasis GR, Heid IM, 2016a. A large genome-wide association study of age-related macular degeneration highlights contributions of rare and common variants. Nature genetics 48, 134–143 DOI: 10.1038/ng.3448. [DOI] [PMC free article] [PubMed] [Google Scholar]
- Fritsche LG, Igl W, Bailey JN, Grassmann F, Sengupta S, Bragg-Gresham JL, Burdon KP, Hebbring SJ, Wen C, Gorski M, Kim IK, Cho D, Zack D, Souied E, Scholl HP, Bala E, Lee KE, Hunter DJ, Sardell RJ, Mitchell P, Merriam JE, Cipriani V, Hoffman JD, Schick T, Lechanteur YT, Guymer RH, Johnson MP, Jiang Y, Stanton CM, Buitendijk GH, Zhan X, Kwong AM, Boleda A, Brooks M, Gieser L, Ratnapriya R, Branham KE, Foerster JR, Heckenlively JR, Othman MI, Vote BJ, Liang HH, Souzeau E, McAllister IL, Isaacs T, Hall J, Lake S, Mackey DA, Constable IJ, Craig JE, Kitchner TE, Yang Z, Su Z, Luo H, Chen D, Ouyang H, Flagg K, Lin D, Mao G, Ferreyra H, Stark K, von Strachwitz CN, Wolf A, Brandl C, Rudolph G, Olden M, Morrison MA, Morgan DJ, Schu M, Ahn J, Silvestri G, Tsironi EE, Park KH, Farrer LA, Orlin A, Brucker A, Li M, Curcio CA, Mohand-Saïd S, Sahel JA, Audo I, Benchaboune M, Cree AJ, Rennie CA, Goverdhan SV, Grunin M, Hagbi-Levi S, Campochiaro P, Katsanis N, Holz FG, Blond F, Blanché H, Deleuze JF, Igo RP Jr., Truitt B, Peachey NS, Meuer SM, Myers CE, Moore EL, Klein R, Hauser MA, Postel EA, Courtenay MD, Schwartz SG, Kovach JL, Scott WK, Liew G, Tan AG, Gopinath B, Merriam JC, Smith RT, Khan JC, Shahid H, Moore AT, McGrath JA, Laux R, Brantley MA Jr., Agarwal A, Ersoy L, Caramoy A, Langmann T, Saksens NT, de Jong EK, Hoyng CB, Cain MS, Richardson AJ, Martin TM, Blangero J, Weeks DE, Dhillon B, van Duijn CM, Doheny KF, Romm J, Klaver CC, Hayward C, Gorin MB, Klein ML, Baird PN, den Hollander AI, Fauser S, Yates JR, Allikmets R, Wang JJ, Schaumberg DA, Klein BE, Hagstrom SA, Chowers I, Lotery AJ, Léveillard T, Zhang K, Brilliant MH, Hewitt AW, Swaroop A, Chew EY, Pericak-Vance MA, DeAngelis M, Stambolian D, Haines JL, Iyengar SK, Weber BH, Abecasis GR, Heid IM, 2016b. A large genome-wide association study of age-related macular degeneration highlights contributions of rare and common variants. Nature genetics 48, 134–143 DOI: 10.1038/ng.3448. [DOI] [PMC free article] [PubMed] [Google Scholar]
- Fu M, Zhu X, Zhang J, Liang J, Lin Y, Zhao L, Ehrengruber MU, Chen YE, 2003. Egr-1 target genes in human endothelial cells identified by microarray analysis. Gene 315, 33–41 DOI: 10.1016/s0378-1119(03)00730-3. [DOI] [PubMed] [Google Scholar]
- Garcia-Villegas R, Lopez-Alvarez LE, Arni S, Rosenbaum T, Morales MA, 2009. Identification and functional characterization of the promoter of the mouse sodium-activated sodium channel Na(x) gene (Scn7a). Journal of neuroscience research 87, 2509–2519 DOI: 10.1002/jnr.22069. [DOI] [PubMed] [Google Scholar]
- Gashler A, Sukhatme VP, 1995. Early growth response protein 1 (Egr-1): prototype of a zinc-finger family of transcription factors. Prog Nucleic Acid Res Mol Biol 50, 191–224 DOI: 10.1016/s0079-6603(08)60815-6. [DOI] [PubMed] [Google Scholar]
- Giacalone JC, Miller MJ, Workalemahu G, Reutzel AJ, Ochoa D, Whitmore SS, Stone EM, Tucker BA, Mullins RF, 2019. Generation of an immortalized human choroid endothelial cell line (iChEC-1) using an endothelial cell specific promoter. Microvasc Res 123, 50–57 DOI: 10.1016/j.mvr.2018.12.002. [DOI] [PMC free article] [PubMed] [Google Scholar]
- Gierahn TM, Wadsworth MH 2nd, Hughes TK, Bryson BD, Butler A, Satija R, Fortune S, Love JC, Shalek AK, 2017. Seq-Well: portable, low-cost RNA sequencing of single cells at high throughput. Nat Methods 14, 395–398 DOI: 10.1038/nmeth.4179. [DOI] [PMC free article] [PubMed] [Google Scholar]
- Griffin JW, Thompson WJ, 2008. Biology and pathology of nonmyelinating Schwann cells. Glia 56, 1518–1531 DOI: 10.1002/glia.20778. [DOI] [PubMed] [Google Scholar]
- Hadziahmetovic M, Dentchev T, Song Y, Haddad N, He X, Hahn P, Pratico D, Wen R, Harris ZL, Lambris JD, Beard J, Dunaief JL, 2008. Ceruloplasmin/hephaestin knockout mice model morphologic and molecular features of AMD. Investigative ophthalmology & visual science 49, 2728–2736 DOI: 10.1167/iovs.07-1472. [DOI] [PMC free article] [PubMed] [Google Scholar]
- Hagemann-Jensen M, Ziegenhain C, Chen P, Ramsköld D, Hendriks G-J, Larsson AJM, Faridani OR, Sandberg R, 2020. Single-cell RNA counting at allele and isoform resolution using Smart-seq3. Nature Biotechnology DOI: 10.1038/s41587-020-0497-0. [DOI] [PubMed] [Google Scholar]
- Hahn P, Milam AH, Dunaief JL, 2003. Maculas affected by age-related macular degeneration contain increased chelatable iron in the retinal pigment epithelium and Bruch’s membrane. Archives of ophthalmology (Chicago, Ill. : 1960) 121, 1099–1105 DOI: 10.1001/archopht.121.8.1099. [DOI] [PubMed] [Google Scholar]
- Hai T, Wolfgang CD, Marsee DK, Allen AE, Sivaprasad U, 1999. ATF3 and stress responses. Gene Expr 7, 321–335. [PMC free article] [PubMed] [Google Scholar]
- Haider NB, Jacobson SG, Cideciyan AV, Swiderski R, Streb LM, Searby C, Beck G, Hockey R, Hanna DB, Gorman S, Duhl D, Carmi R, Bennett J, Weleber RG, Fishman GA, Wright AF, Stone EM, Sheffield VC, 2000. Mutation of a nuclear receptor gene, NR2E3, causes enhanced S cone syndrome, a disorder of retinal cell fate. Nature genetics 24, 127–131 DOI: 10.1038/72777. [DOI] [PubMed] [Google Scholar]
- Haines JL, Hauser MA, Schmidt S, Scott WK, Olson LM, Gallins P, Spencer KL, Kwan SY, Noureddine M, Gilbert JR, Schnetz-Boutaud N, Agarwal A, Postel EA, Pericak-Vance MA, 2005. Complement factor H variant increases the risk of age-related macular degeneration. Science 308, 419–421 DOI: 10.1126/science.1110359. [DOI] [PubMed] [Google Scholar]
- Han X, Wang R, Zhou Y, Fei L, Sun H, Lai S, Saadatpour A, Zhou Z, Chen H, Ye F, Huang D, Xu Y, Huang W, Jiang M, Jiang X, Mao J, Chen Y, Lu C, Xie J, Fang Q, Wang Y, Yue R, Li T, Huang H, Orkin SH, Yuan GC, Chen M, Guo G, 2018. Mapping the Mouse Cell Atlas by Microwell-Seq. Cell 172, 1091–1107.e1017 DOI: 10.1016/j.cell.2018.02.001. [DOI] [PubMed] [Google Scholar]
- Hao H, Tummala P, Guzman E, Mali RS, Gregorski J, Swaroop A, Mitton KP, 2011. The transcription factor neural retina leucine zipper (NRL) controls photoreceptor-specific expression of myocyte enhancer factor Mef2c from an alternative promoter. The Journal of biological chemistry 286, 34893–34902 DOI: 10.1074/jbc.M111.271072. [DOI] [PMC free article] [PubMed] [Google Scholar]
- Hasegawa T, McLeod DS, Bhutto IA, Prow T, Merges CA, Grebe R, Lutty GA, 2007. The embryonic human choriocapillaris develops by hemo-vasculogenesis. Dev Dyn 236, 2089–2100 DOI: 10.1002/dvdy.21231. [DOI] [PMC free article] [PubMed] [Google Scholar]
- Hashimshony T, Senderovich N, Avital G, Klochendler A, de Leeuw Y, Anavy L, Gennert D, Li S, Livak KJ, Rozenblatt-Rosen O, Dor Y, Regev A, Yanai I, 2016. CEL-Seq2: sensitive highly-multiplexed single-cell RNA-Seq. Genome Biol 17, 77 DOI: 10.1186/s13059-016-0938-8. [DOI] [PMC free article] [PubMed] [Google Scholar]
- Hayreh SS, 1975. Segmental nature of the choroidal vasculature. The British journal of ophthalmology 59, 631–648 DOI: 10.1136/bjo.59.11.631. [DOI] [PMC free article] [PubMed] [Google Scholar]
- Hojo M, Ohtsuka T, Hashimoto N, Gradwohl G, Guillemot F, Kageyama R, 2000. Glial cell fate specification modulated by the bHLH gene Hes5 in mouse retina. Development 127, 2515–2522. [DOI] [PubMed] [Google Scholar]
- Hornan DM, Peirson SN, Hardcastle AJ, Molday RS, Cheetham ME, Webster AR, 2007. Novel retinal and cone photoreceptor transcripts revealed by human macular expression profiling. Investigative ophthalmology & visual science 48, 5388–5396 DOI: 10.1167/iovs.07-0355. [DOI] [PubMed] [Google Scholar]
- Hoseini-Yazdi H, Vincent SJ, Collins MJ, Read SA, Alonso-Caneiro D, 2019. Wide-field choroidal thickness in myopes and emmetropes. Sci Rep 9, 3474 DOI: 10.1038/s41598-019-39653-w. [DOI] [PMC free article] [PubMed] [Google Scholar]
- Hu Y, Wang X, Hu B, Mao Y, Chen Y, Yan L, Yong J, Dong J, Wei Y, Wang W, Wen L, Qiao J, Tang F, 2019. Dissecting the transcriptome landscape of the human fetal neural retina and retinal pigment epithelium by single-cell RNA-seq analysis. PLoS Biol 17, e3000365 DOI: 10.1371/journal.pbio.3000365. [DOI] [PMC free article] [PubMed] [Google Scholar]
- Huang KC, Wang ML, Chen SJ, Kuo JC, Wang WJ, Nhi Nguyen PN, Wahlin KJ, Lu JF, Tran AA, Shi M, Chien Y, Yarmishyn AA, Tsai PH, Yang TC, Jane WN, Chang CC, Peng CH, Schlaeger TM, Chiou SH, 2019. Morphological and Molecular Defects in Human Three-Dimensional Retinal Organoid Model of X-Linked Juvenile Retinoschisis. Stem Cell Reports 13, 906–923 DOI: 10.1016/j.stemcr.2019.09.010. [DOI] [PMC free article] [PubMed] [Google Scholar]
- Hwang B, Lee JH, Bang D, 2018. Single-cell RNA sequencing technologies and bioinformatics pipelines. Experimental & Molecular Medicine 50, 96 DOI: 10.1038/s12276-018-0071-8. [DOI] [PMC free article] [PubMed] [Google Scholar]
- Jessen KR, Mirsky R, 2005. The origin and development of glial cells in peripheral nerves. Nat Rev Neurosci 6, 671–682 DOI: 10.1038/nrn1746. [DOI] [PubMed] [Google Scholar]
- Kallestad L, Blackshaw S, Khalil AM, Palczewski K, 2019. Tissue- and Species-Specific Patterns of RNA metabolism in Post-Mortem Mammalian Retina and Retinal Pigment Epithelium. Sci Rep 9, 14821 DOI: 10.1038/s41598-019-51379-3. [DOI] [PMC free article] [PubMed] [Google Scholar]
- Kallman A, Capowski EE, Wang J, Kaushik AM, Jansen AD, Edwards KL, Chen L, Berlinicke CA, Joseph Phillips M, Pierce EA, Qian J, Wang TH, Gamm DM, Zack DJ, 2020. Investigating cone photoreceptor development using patient-derived NRL null retinal organoids. Commun Biol 3, 82 DOI: 10.1038/s42003-020-0808-5. [DOI] [PMC free article] [PubMed] [Google Scholar]
- Katayama S, Töhönen V, Linnarsson S, Kere J, 2013. SAMstrt: statistical test for differential expression in single-cell transcriptome with spike-in normalization. Bioinformatics 29, 2943–2945 DOI: 10.1093/bioinformatics/btt511. [DOI] [PMC free article] [PubMed] [Google Scholar]
- Kim DY, Fingler J, Zawadzki RJ, Park SS, Morse LS, Schwartz DM, Fraser SE, Werner JS, 2013. Optical imaging of the chorioretinal vasculature in the living human eye. Proceedings of the National Academy of Sciences of the United States of America 110, 14354–14359 DOI: 10.1073/pnas.1307315110. [DOI] [PMC free article] [PubMed] [Google Scholar]
- Kim S, Lowe A, Dharmat R, Lee S, Owen LA, Wang J, Shakoor A, Li Y, Morgan DJ, Hejazi AA, Cvekl A, DeAngelis MM, Zhou ZJ, Chen R, Liu W, 2019. Generation, transcriptome profiling, and functional validation of cone-rich human retinal organoids. Proceedings of the National Academy of Sciences of the United States of America 116, 10824–10833 DOI: 10.1073/pnas.1901572116. [DOI] [PMC free article] [PubMed] [Google Scholar]
- Kim YH, He S, Kase S, Kitamura M, Ryan SJ, Hinton DR, 2009. Regulated secretion of complement factor H by RPE and its role in RPE migration. Graefes Arch Clin Exp Ophthalmol 247, 651–659 DOI: 10.1007/s00417-009-1049-y. [DOI] [PMC free article] [PubMed] [Google Scholar]
- Klein AM, Mazutis L, Akartuna I, Tallapragada N, Veres A, Li V, Peshkin L, Weitz DA, Kirschner MW, 2015. Droplet barcoding for single-cell transcriptomics applied to embryonic stem cells. Cell 161, 1187–1201 DOI: 10.1016/j.cell.2015.04.044. [DOI] [PMC free article] [PubMed] [Google Scholar]
- Klein RJ, Zeiss C, Chew EY, Tsai JY, Sackler RS, Haynes C, Henning AK, SanGiovanni JP, Mane SM, Mayne ST, Bracken MB, Ferris FL, Ott J, Barnstable C, Hoh J, 2005. Complement factor H polymorphism in age-related macular degeneration. Science 308, 385–389 DOI: 10.1126/science.1109557. [DOI] [PMC free article] [PubMed] [Google Scholar]
- Kobak D, Linderman G, 2019. UMAP does not preserve global structure any better than t-SNE when using the same initialization. bioRxiv. [Google Scholar]
- Kociok N, Hueber A, Esser P, Schraermeyer U, Thumann G, Luther TT, Jordan J, Welsandt G, Kirchhof B, 2002. Vitreous treatment of cultured human RPE cells results in differential expression of 10 new genes. Investigative ophthalmology & visual science 43, 2474–2480. [PubMed] [Google Scholar]
- Krinsky NI, Landrum JT, Bone RA, 2003. Biologic mechanisms of the protective role of lutein and zeaxanthin in the eye. Annu Rev Nutr 23, 171–201 DOI: 10.1146/annurev.nutr.23.011702.073307. [DOI] [PubMed] [Google Scholar]
- Lamba DA, Gust J, Reh TA, 2009. Transplantation of human embryonic stem cell-derived photoreceptors restores some visual function in Crx-deficient mice. Cell Stem Cell 4, 73–79 DOI: 10.1016/j.stem.2008.10.015. [DOI] [PMC free article] [PubMed] [Google Scholar]
- Lamba DA, Karl MO, Ware CB, Reh TA, 2006. Efficient generation of retinal progenitor cells from human embryonic stem cells. Proc. Natl. Acad. Sci. U. S. A 103, 12769–12774 DOI: 10.1073/pnas.0601990103. [DOI] [PMC free article] [PubMed] [Google Scholar]
- Larsen AK, Osborne NN, 1996. Involvement of adenosine in retinal ischemia. Studies on the rat. Investigative ophthalmology & visual science 37, 2603–2611. [PubMed] [Google Scholar]
- Lehmann GL, Hanke-Gogokhia C, Hu Y, Bareja R, Salfati Z, Ginsberg M, Nolan DJ, Mendez-Huergo SP, Dalotto-Moreno T, Wojcinski A, Ochoa F, Zeng S, Cerliani JP, Panagis L, Zager PJ, Mullins RF, Ogura S, Lutty GA, Bang J, Zippin JH, Romano C, Rabinovich GA, Elemento O, Joyner AL, Rafii S, Rodriguez-Boulan E, Benedicto I, 2020. Single-cell profiling reveals an endothelium-mediated immunomodulatory pathway in the eye choroid. J Exp Med 217 DOI: 10.1084/jem.20190730. [DOI] [PMC free article] [PubMed] [Google Scholar]
- Li B, Vachali PP, Gorusupudi A, Shen Z, Sharifzadeh H, Besch BM, Nelson K, Horvath MM, Frederick JM, Baehr W, Bernstein PS, 2014a. Inactivity of human beta,beta-carotene-9’,10’-dioxygenase (BCO2) underlies retinal accumulation of the human macular carotenoid pigment. Proceedings of the National Academy of Sciences of the United States of America 111, 10173–10178 DOI: 10.1073/pnas.1402526111. [DOI] [PMC free article] [PubMed] [Google Scholar]
- Li M, Jia C, Kazmierkiewicz KL, Bowman AS, Tian L, Liu Y, Gupta NA, Gudiseva HV, Yee SS, Kim M, Dentchev T, Kimble JA, Parker JS, Messinger JD, Hakonarson H, Curcio CA, Stambolian D, 2014b. Comprehensive analysis of gene expression in human retina and supporting tissues. Human molecular genetics 23, 4001–4014 DOI: 10.1093/hmg/ddu114. [DOI] [PMC free article] [PubMed] [Google Scholar]
- Liang Q, Dharmat R, Owen L, Shakoor A, Li Y, Kim S, Vitale A, Kim I, Morgan D, Liang S, Wu N, Chen K, DeAngelis MM, Chen R, 2019. Single-nuclei RNA-seq on human retinal tissue provides improved transcriptome profiling, Nature communications, p. 5743. [DOI] [PMC free article] [PubMed] [Google Scholar]
- Liu L, Shi GP, 2012. CD31: beyond a marker for endothelial cells. Cardiovasc Res 94, 3–5 DOI: 10.1093/cvr/cvs108. [DOI] [PubMed] [Google Scholar]
- Liu Y, Longo LD, De León M, 2000. In situ and immunocytochemical localization of E-FABP mRNA and protein during neuronal migration and differentiation in the rat brain. Brain Res 852, 16–27 DOI: 10.1016/s0006-8993(99)02158-7. [DOI] [PubMed] [Google Scholar]
- Liu Z, Jin YQ, Chen L, Wang Y, Yang X, Cheng J, Wu W, Qi Z, Shen Z, 2015. Specific marker expression and cell state of Schwann cells during culture in vitro. PloS one 10, e0123278 DOI: 10.1371/journal.pone.0123278. [DOI] [PMC free article] [PubMed] [Google Scholar]
- Love MI, Huber W, Anders S, 2014. Moderated estimation of fold change and dispersion for RNA-seq data with DESeq2. Genome biology 15, 550–550 DOI: 10.1186/s13059-014-0550-8. [DOI] [PMC free article] [PubMed] [Google Scholar]
- Lu Y, Shiau F, Yi W, Lu S, Wu Q, Pearson JD, Kallman A, Zhong S, Hoang T, Zuo Z, Zhao F, Zhang M, Tsai N, Zhuo Y, He S, Zhang J, Stein-O’Brien GL, Sherman TD, Duan X, Fertig EJ, Goff LA, Zack DJ, Handa JT, Xue T, Bremner R, Blackshaw S, Wang X, Clark BS, 2020. Single-Cell Analysis of Human Retina Identifies Evolutionarily Conserved and Species-Specific Mechanisms Controlling Development. Dev Cell 53, 473–491.e479 DOI: 10.1016/j.devcel.2020.04.009. [DOI] [PMC free article] [PubMed] [Google Scholar]
- Luecken MD, Theis FJ, 2019. Current best practices in single-cell RNA-seq analysis: a tutorial. Mol Syst Biol 15, e8746 DOI: 10.15252/msb.20188746. [DOI] [PMC free article] [PubMed] [Google Scholar]
- Lukowski SW, Lo CY, Sharov AA, Nguyen Q, Fang L, Hung SS, Zhu L, Zhang T, Grünert U, Nguyen T, Senabouth A, Jabbari JS, Welby E, Sowden JC, Waugh HS, Mackey A, Pollock G, Lamb TD, Wang PY, Hewitt AW, Gillies MC, Powell JE, Wong RC, 2019. A single-cell transcriptome atlas of the adult human retina. Embo j 38, e100811 DOI: 10.15252/embj.2018100811. [DOI] [PMC free article] [PubMed] [Google Scholar]
- Lun ATL, Marioni JC, 2017. Overcoming confounding plate effects in differential expression analyses of single-cell RNA-seq data. Biostatistics 18, 451–464 DOI: 10.1093/biostatistics/kxw055. [DOI] [PMC free article] [PubMed] [Google Scholar]
- Lundh von Leithner P, Kam JH, Bainbridge J, Catchpole I, Gough G, Coffey P, Jeffery G, 2009. Complement factor h is critical in the maintenance of retinal perfusion. The American journal of pathology 175, 412–421 DOI: 10.2353/ajpath.2009.080927. [DOI] [PMC free article] [PubMed] [Google Scholar]
- Lutty GA, McLeod DS, 2005. Phosphatase enzyme histochemistry for studying vascular hierarchy, pathology, and endothelial cell dysfunction in retina and choroid. Vision research 45, 3504–3511 DOI: 10.1016/j.visres.2005.08.022. [DOI] [PMC free article] [PubMed] [Google Scholar]
- Macosko EZ, Basu A, Satija R, Nemesh J, Shekhar K, Goldman M, Tirosh I, Bialas AR, Kamitaki N, Martersteck EM, Trombetta JJ, Weitz DA, Sanes JR, Shalek AK, Regev A, McCarroll SA, 2015. Highly Parallel Genome-wide Expression Profiling of Individual Cells Using Nanoliter Droplets. Cell 161, 1202–1214 DOI: 10.1016/j.cell.2015.05.002. [DOI] [PMC free article] [PubMed] [Google Scholar]
- Malik KJ, Chen CD, Olsen TW, 2003. Stability of RNA from the retina and retinal pigment epithelium in a porcine model simulating human eye bank conditions. Investigative ophthalmology & visual science 44, 2730–2735 DOI: 10.1167/iovs.02-1120. [DOI] [PubMed] [Google Scholar]
- Mandai M, Fujii M, Hashiguchi T, Sunagawa GA, Ito SI, Sun J, Kaneko J, Sho J, Yamada C, Takahashi M, 2017. iPSC-Derived Retina Transplants Improve Vision in rd1 End-Stage Retinal-Degeneration Mice. Stem Cell Reports 8, 69–83 DOI: 10.1016/j.stemcr.2016.12.008. [DOI] [PMC free article] [PubMed] [Google Scholar]
- McInnes L, Healy J, Melville J, 2018. UMAP: Uniform Manifold Approximation and Projection for Dimension Reduction. arXiv preprint 1802.03426.
- McLeod DS, Bhutto I, Edwards MM, Silver RE, Seddon JM, Lutty GA, 2016. Distribution and Quantification of Choroidal Macrophages in Human Eyes With Age-Related Macular Degeneration. Investigative ophthalmology & visual science 57, 5843–5855 DOI: 10.1167/iovs.16-20049. [DOI] [PMC free article] [PubMed] [Google Scholar]
- Miao Z, Deng K, Wang X, Zhang X, 2018. DEsingle for detecting three types of differential expression in single-cell RNA-seq data. Bioinformatics 34, 3223–3224 DOI: 10.1093/bioinformatics/bty332. [DOI] [PubMed] [Google Scholar]
- Mulfaul K, Giacalone JC, Voigt AP, Riker MJ, Ochoa D, Han IC, Stone EM, Mullins RF, Tucker BA, 2020. Stepwise differentiation and functional characterization of human induced pluripotent stem cell-derived choroidal endothelial cells. Stem cell research & therapy 11, 409 DOI: 10.1186/s13287-020-01903-4. [DOI] [PMC free article] [PubMed] [Google Scholar]
- Mullin NK, Voigt AP, Cooke JA, Bohrer LR, Burnight ER, Stone EM, Mullins RF, Tucker BA, 2020. Patient derived stem cells for discovery and validation of novel pathogenic variants in inherited retinal disease. Progress in retinal and eye research, 100918 DOI: 10.1016/j.preteyeres.2020.100918. [DOI] [PMC free article] [PubMed] [Google Scholar]
- Mullins RF, Johnson MN, Faidley EA, Skeie JM, Huang J, 2011. Choriocapillaris vascular dropout related to density of drusen in human eyes with early age-related macular degeneration. Investigative ophthalmology & visual science 52, 1606–1612 DOI: 10.1167/iovs.10-6476. [DOI] [PMC free article] [PubMed] [Google Scholar]
- Mullins RF, Kuehn MH, Faidley EA, Syed NA, Stone EM, 2007. Differential macular and peripheral expression of bestrophin in human eyes and its implication for best disease. Investigative ophthalmology & visual science 48, 3372–3380 DOI: 10.1167/iovs.06-0868. [DOI] [PubMed] [Google Scholar]
- Mullins RF, Kuehn MH, Radu RA, Enriquez GS, East JS, Schindler EI, Travis GH, Stone EM, 2012. Autosomal recessive retinitis pigmentosa due to ABCA4 mutations: clinical, pathologic, and molecular characterization. Investigative ophthalmology & visual science 53, 1883–1894 DOI: 10.1167/iovs.12-9477. [DOI] [PMC free article] [PubMed] [Google Scholar]
- Mullins RF, Skeie JM, Malone EA, Kuehn MH, 2006. Macular and peripheral distribution of ICAM-1 in the human choriocapillaris and retina. Molecular vision 12, 224–235. [PubMed] [Google Scholar]
- Nassisi M, Baghdasaryan E, Borrelli E, Ip M, Sadda SR, 2019. Choriocapillaris flow impairment surrounding geographic atrophy correlates with disease progression. PloS one 14, e0212563 DOI: 10.1371/journal.pone.0212563. [DOI] [PMC free article] [PubMed] [Google Scholar]
- Nork TM, Kim CB, Shanmuganayagam D, Van Lysel MS, Ver Hoeve JN, Folts JD, 2006. Measurement of regional choroidal blood flow in rabbits and monkeys using fluorescent microspheres. Archives of ophthalmology (Chicago, Ill. : 1960) 124, 860–868 DOI: 10.1001/archopht.124.6.860. [DOI] [PubMed] [Google Scholar]
- Orozco LD, Chen HH, Cox C, Katschke KJ Jr., Arceo R, Espiritu C, Caplazi P, Nghiem SS, Chen YJ, Modrusan Z, Dressen A, Goldstein LD, Clarke C, Bhangale T, Yaspan B, Jeanne M, Townsend MJ, van Lookeren Campagne M, Hackney JA, 2020. Integration of eQTL and a Single-Cell Atlas in the Human Eye Identifies Causal Genes for Age-Related Macular Degeneration. Cell Rep 30, 1246–1259.e1246 DOI: 10.1016/j.celrep.2019.12.082. [DOI] [PubMed] [Google Scholar]
- Paneni F, Osto E, Costantino S, Mateescu B, Briand S, Coppolino G, Perna E, Mocharla P, Akhmedov A, Kubant R, Rohrer L, Malinski T, Camici GG, Matter CM, Mechta-Grigoriou F, Volpe M, Luscher TF, Cosentino F, 2013. Deletion of the activated protein-1 transcription factor JunD induces oxidative stress and accelerates age-related endothelial dysfunction. Circulation 127, 1229–1240, 10.1161/circulationaha.112.000826. [DOI] [PubMed] [Google Scholar]
- Peng YR, Shekhar K, Yan W, Herrmann D, Sappington A, Bryman GS, van Zyl T, Do MTH, Regev A, Sanes JR, 2019. Molecular Classification and Comparative Taxonomics of Foveal and Peripheral Cells in Primate Retina. Cell 176, 1222–1237.e1222 DOI: 10.1016/j.cell.2019.01.004. [DOI] [PMC free article] [PubMed] [Google Scholar]
- Petrova R, Joyner AL, 2014. Roles for Hedgehog signaling in adult organ homeostasis and repair. Development 141, 3445–3457 DOI: 10.1242/dev.083691. [DOI] [PMC free article] [PubMed] [Google Scholar]
- Phillips MJ, Jiang P, Howden S, Barney P, Min J, York NW, Chu LF, Capowski EE, Cash A, Jain S, Barlow K, Tabassum T, Stewart R, Pattnaik BR, Thomson JA, Gamm DM, 2018. A Novel Approach to Single Cell RNA-Sequence Analysis Facilitates In Silico Gene Reporting of Human Pluripotent Stem Cell-Derived Retinal Cell Types. Stem Cells 36, 313–324 DOI: 10.1002/stem.2755. [DOI] [PMC free article] [PubMed] [Google Scholar]
- Phillips MJ, Perez ET, Martin JM, Reshel ST, Wallace KA, Capowski EE, Singh R, Wright LS, Clark EM, Barney PM, Stewart R, Dickerson SJ, Miller MJ, Percin EF, Thomson JA, Gamm DM, 2014. Modeling human retinal development with patient-specific induced pluripotent stem cells reveals multiple roles for visual system homeobox 2. Stem Cells 32, 1480–1492 DOI: 10.1002/stem.1667. [DOI] [PMC free article] [PubMed] [Google Scholar]
- Picelli S, Bjorklund AK, Faridani OR, Sagasser S, Winberg G, Sandberg R, 2013. Smart-seq2 for sensitive full-length transcriptome profiling in single cells. Nat Methods 10, 1096–1098 DOI: 10.1038/nmeth.2639. [DOI] [PubMed] [Google Scholar]
- Picelli S, Faridani OR, Björklund ÅK, Winberg G, Sagasser S, Sandberg R, 2014. Full-length RNA-seq from single cells using Smart-seq2. Nature Protocols 9, 171–181 DOI: 10.1038/nprot.2014.006. [DOI] [PubMed] [Google Scholar]
- Querques G, Kamami-Levy C, Georges A, Pedinielli A, Capuano V, Blanco-Garavito R, Poulon F, Souied EH, 2016. ADAPTIVE OPTICS IMAGING OF FOVEAL SPARING IN GEOGRAPHIC ATROPHY SECONDARY TO AGE-RELATED MACULAR DEGENERATION. Retina (Philadelphia, Pa.) 36, 247–254 DOI: 10.1097/iae.0000000000000692. [DOI] [PubMed] [Google Scholar]
- Radeke MJ, Peterson KE, Johnson LV, Anderson DH, 2007. Disease susceptibility of the human macula: differential gene transcription in the retinal pigmented epithelium/choroid. Experimental eye research 85, 366–380 DOI: 10.1016/j.exer.2007.05.006. [DOI] [PubMed] [Google Scholar]
- Ramón y Cajal S, 1972. The Structure of the Retina. Thomas Charles C. [Google Scholar]
- Ramsköld D, Luo S, Wang YC, Li R, Deng Q, Faridani OR, Daniels GA, Khrebtukova I, Loring JF, Laurent LC, Schroth GP, Sandberg R, 2012. Full-length mRNA-Seq from single-cell levels of RNA and individual circulating tumor cells. Nat Biotechnol 30, 777–782 DOI: 10.1038/nbt.2282. [DOI] [PMC free article] [PubMed] [Google Scholar]
- Reiner A, Fitzgerald MEC, Del Mar N, Li C, 2018. Neural control of choroidal blood flow. Progress in retinal and eye research 64, 96–130 DOI: 10.1016/j.preteyeres.2017.12.001. [DOI] [PMC free article] [PubMed] [Google Scholar]
- Rheaume BA, Jereen A, Bolisetty M, Sajid MS, Yang Y, Renna K, Sun L, Robson P, Trakhtenberg EF, 2018. Single cell transcriptome profiling of retinal ganglion cells identifies cellular subtypes. Nat Commun 9, 2759 DOI: 10.1038/s41467-018-05134-3. [DOI] [PMC free article] [PubMed] [Google Scholar]
- Rieger AM, Nelson KL, Konowalchuk JD, Barreda DR, 2011. Modified annexin V/propidium iodide apoptosis assay for accurate assessment of cell death. J Vis Exp DOI: 10.3791/2597. [DOI] [PMC free article] [PubMed] [Google Scholar]
- Robinson MD, McCarthy DJ, Smyth GK, 2010. edgeR: a Bioconductor package for differential expression analysis of digital gene expression data. Bioinformatics 26, 139–140 DOI: 10.1093/bioinformatics/btp616. [DOI] [PMC free article] [PubMed] [Google Scholar]
- Rohlenova K, Goveia J, García-Caballero M, Subramanian A, Kalucka J, Treps L, Falkenberg KD, de Rooij L, Zheng Y, Lin L, Sokol L, Teuwen LA, Geldhof V, Taverna F, Pircher A, Conradi LC, Khan S, Stegen S, Panovska D, De Smet F, Staal FJT, McLaughlin RJ, Vinckier S, Van Bergen T, Ectors N, De Haes P, Wang J, Bolund L, Schoonjans L, Karakach TK, Yang H, Carmeliet G, Liu Y, Thienpont B, Dewerchin M, Eelen G, Li X, Luo Y, Carmeliet P, 2020. Single-Cell RNA Sequencing Maps Endothelial Metabolic Plasticity in Pathological Angiogenesis. Cell Metab 31, 862–877.e814 DOI: 10.1016/j.cmet.2020.03.009. [DOI] [PubMed] [Google Scholar]
- Ronning KE, Karlen SJ, Miller EB, Burns ME, 2019. Molecular profiling of resident and infiltrating mononuclear phagocytes during rapid adult retinal degeneration using single-cell RNA sequencing. Scientific Reports 9, 4858 DOI: 10.1038/s41598-019-41141-0. [DOI] [PMC free article] [PubMed] [Google Scholar]
- Rosenberg AB, Roco CM, Muscat RA, Kuchina A, Sample P, Yao Z, Graybuck LT, Peeler DJ, Mukherjee S, Chen W, Pun SH, Sellers DL, Tasic B, Seelig G, 2018. Single-cell profiling of the developing mouse brain and spinal cord with split-pool barcoding. Science 360, 176–182 DOI: 10.1126/science.aam8999. [DOI] [PMC free article] [PubMed] [Google Scholar]
- Ruggiero L, Connor MP, Chen J, Langen R, Finnemann SC, 2012. Diurnal, localized exposure of phosphatidylserine by rod outer segment tips in wild-type but not Itgb5−/− or Mfge8−/− mouse retina. Proceedings of the National Academy of Sciences of the United States of America 109, 8145–8148 DOI: 10.1073/pnas.1121101109. [DOI] [PMC free article] [PubMed] [Google Scholar]
- Sarthy PV, Bridges CD, Kretzer FL, Lam DM, 1981. Lectin receptors on cells isolated from the turtle retina. The Journal of comparative neurology 202, 561–569 DOI: 10.1002/cne.902020408. [DOI] [PubMed] [Google Scholar]
- Sarthy PV, Lam DM, 1979. Isolated cells from a mammalian retina. Brain Res 176, 208–212 DOI: 10.1016/0006-8993(79)90889-8. [DOI] [PubMed] [Google Scholar]
- Schindler EI, Nylen EL, Ko AC, Affatigato LM, Heggen AC, Wang K, Sheffield VC, Stone EM, 2010. Deducing the pathogenic contribution of recessive ABCA4 alleles in an outbred population. Human molecular genetics 19, 3693–3701 DOI: 10.1093/hmg/ddq284. [DOI] [PMC free article] [PubMed] [Google Scholar]
- Schulz HL, Rahman FA, Fadl El Moula FM, Stojic J, Gehrig A, Weber BH, 2004. Identifying differentially expressed genes in the mammalian retina and the retinal pigment epithelium by suppression subtractive hybridization. Cytogenet Genome Res 106, 74–81 DOI: 10.1159/000078564. [DOI] [PubMed] [Google Scholar]
- SenBanerjee S, Lin Z, Atkins GB, Greif DM, Rao RM, Kumar A, Feinberg MW, Chen Z, Simon DI, Luscinskas FW, Michel TM, Gimbrone MA Jr., García-Cardeña G, Jain MK, 2004. KLF2 Is a novel transcriptional regulator of endothelial proinflammatory activation. J Exp Med 199, 1305–1315 DOI: 10.1084/jem.20031132. [DOI] [PMC free article] [PubMed] [Google Scholar]
- Sharma TP, Wiley LA, Whitmore SS, Anfinson KR, Cranston CM, Oppedal DJ, Daggett HT, Mullins RF, Tucker BA, Stone EM, 2017. Patient-specific induced pluripotent stem cells to evaluate the pathophysiology of TRNT1-associated Retinitis pigmentosa. Stem Cell Res 21, 58–70 DOI: 10.1016/j.scr.2017.03.005. [DOI] [PubMed] [Google Scholar]
- Sharon D, Blackshaw S, Cepko CL, Dryja TP, 2002. Profile of the genes expressed in the human peripheral retina, macula, and retinal pigment epithelium determined through serial analysis of gene expression (SAGE). Proceedings of the National Academy of Sciences of the United States of America 99, 315–320 DOI: 10.1073/pnas.012582799. [DOI] [PMC free article] [PubMed] [Google Scholar]
- Shekhar K, Lapan SW, Whitney IE, Tran NM, Macosko EZ, Kowalczyk M, Adiconis X, Levin JZ, Nemesh J, Goldman M, McCarroll SA, Cepko CL, Regev A, Sanes JR, 2016. Comprehensive Classification of Retinal Bipolar Neurons by Single-Cell Transcriptomics. Cell 166, 1308–1323.e1330 DOI: 10.1016/j.cell.2016.07.054. [DOI] [PMC free article] [PubMed] [Google Scholar]
- Sheng K, Cao W, Niu Y, Deng Q, Zong C, 2017. Effective detection of variation in single-cell transcriptomes using MATQ-seq. Nat Methods 14, 267–270 DOI: 10.1038/nmeth.4145. [DOI] [PubMed] [Google Scholar]
- Silverman ES, Collins T, 1999. Pathways of Egr-1-mediated gene transcription in vascular biology. The American journal of pathology 154, 665–670 DOI: 10.1016/s0002-9440(10)65312-6. [DOI] [PMC free article] [PubMed] [Google Scholar]
- Skeie JM, Mullins RF, 2009. Macrophages in neovascular age-related macular degeneration: friends or foes? Eye (London, England) 23, 747–755 DOI: 10.1038/eye.2008.206. [DOI] [PMC free article] [PubMed] [Google Scholar]
- Sohn EH, Flamme-Wiese MJ, Whitmore SS, Wang K, Tucker BA, Mullins RF, 2014. Loss of CD34 expression in aging human choriocapillaris endothelial cells. PloS one 9, e86538 DOI: 10.1371/journal.pone.0086538. [DOI] [PMC free article] [PubMed] [Google Scholar]
- Songstad AE, Wiley LA, Duong K, Kaalberg E, Flamme-Wiese MJ, Cranston CM, Riker MJ, Levasseur D, Stone EM, Mullins RF, Tucker BA, 2015. Generating iPSC-Derived Choroidal Endothelial Cells to Study Age-Related Macular Degeneration. Investigative ophthalmology & visual science 56, 8258–8267 DOI: 10.1167/iovs.15-17073. [DOI] [PMC free article] [PubMed] [Google Scholar]
- Sridhar A, Hoshino A, Finkbeiner CR, Chitsazan A, Dai L, Haugan AK, Eschenbacher KM, Jackson DL, Trapnell C, Bermingham-McDonogh O, Glass I, Reh TA, 2020. Single-Cell Transcriptomic Comparison of Human Fetal Retina, hPSC-Derived Retinal Organoids, and Long-Term Retinal Cultures. Cell Rep 30, 1644–1659.e1644 DOI: 10.1016/j.celrep.2020.01.007. [DOI] [PMC free article] [PubMed] [Google Scholar]
- Ståhl PL, Salmén F, Vickovic S, Lundmark A, Navarro JF, Magnusson J, Giacomello S, Asp M, Westholm JO, Huss M, Mollbrink A, Linnarsson S, Codeluppi S, Borg Å, Pontén F, Costea PI, Sahlén P, Mulder J, Bergmann O, Lundeberg J, Frisén J, 2016. Visualization and analysis of gene expression in tissue sections by spatial transcriptomics. Science 353, 78–82 DOI: 10.1126/science.aaf2403. [DOI] [PubMed] [Google Scholar]
- Stan RV, Kubitza M, Palade GE, 1999. PV-1 is a component of the fenestral and stomatal diaphragms in fenestrated endothelia. Proceedings of the National Academy of Sciences of the United States of America 96, 13203–13207 DOI: 10.1073/pnas.96.23.13203. [DOI] [PMC free article] [PubMed] [Google Scholar]
- Stone EM, Andorf JL, Whitmore SS, DeLuca AP, Giacalone JC, Streb LM, Braun TA, Mullins RF, Scheetz TE, Sheffield VC, Tucker BA, 2017. Clinically Focused Molecular Investigation of 1000 Consecutive Families with Inherited Retinal Disease. Ophthalmology 124, 1314–1331 DOI: 10.1016/j.ophtha.2017.04.008. [DOI] [PMC free article] [PubMed] [Google Scholar]
- Street K, Risso D, Fletcher RB, Das D, Ngai J, Yosef N, Purdom E, Dudoit S, 2018. Slingshot: cell lineage and pseudotime inference for single-cell transcriptomics. BMC Genomics 19, 477 DOI: 10.1186/s12864-018-4772-0. [DOI] [PMC free article] [PubMed] [Google Scholar]
- Strober W, 2001. Trypan blue exclusion test of cell viability. Curr Protoc Immunol Appendix 3, Appendix 3B DOI: 10.1002/0471142735.ima03bs21. [DOI] [PubMed] [Google Scholar]
- Strunnikova NV, Maminishkis A, Barb JJ, Wang F, Zhi C, Sergeev Y, Chen W, Edwards AO, Stambolian D, Abecasis G, Swaroop A, Munson PJ, Miller SS, 2010. Transcriptome analysis and molecular signature of human retinal pigment epithelium. Human molecular genetics 19, 2468–2486 DOI: 10.1093/hmg/ddq129. [DOI] [PMC free article] [PubMed] [Google Scholar]
- Suresh PS, Tsutsumi R, Venkatesh T, 2018. YBX1 at the crossroads of non-coding transcriptome, exosomal, and cytoplasmic granular signaling. Eur J Cell Biol 97, 163–167 DOI: 10.1016/j.ejcb.2018.02.003. [DOI] [PubMed] [Google Scholar]
- Swaroop A, Xu JZ, Agarwal N, Weissman SM, 1991. A simple and efficient cDNA library subtraction procedure: isolation of human retina-specific cDNA clones. Nucleic Acids Res 19, 1954 DOI: 10.1093/nar/19.8.1954. [DOI] [PMC free article] [PubMed] [Google Scholar]
- Takahashi K, Yamanaka S, 2006. Induction of pluripotent stem cells from mouse embryonic and adult fibroblast cultures by defined factors. Cell 126, 663–676 DOI: 10.1016/j.cell.2006.07.024. [DOI] [PubMed] [Google Scholar]
- Tian L, Dong X, Freytag S, Lê Cao K-A, Su S, JalalAbadi A, Amann-Zalcenstein D, Weber TS, Seidi A, Jabbari JS, Naik SH, Ritchie ME, 2019. Benchmarking single cell RNA-sequencing analysis pipelines using mixture control experiments. Nature Methods 16, 479–487 DOI: 10.1038/s41592-019-0425-8. [DOI] [PubMed] [Google Scholar]
- Torczynski E, Tso MO, 1976. The architecture of the choriocapillaris at the posterior pole. American journal of ophthalmology 81, 428–440 DOI: 10.1016/0002-9394(76)90298-1. [DOI] [PubMed] [Google Scholar]
- Trapnell C, Cacchiarelli D, Grimsby J, Pokharel P, Li S, Morse M, Lennon NJ, Livak KJ, Mikkelsen TS, Rinn JL, 2014. The dynamics and regulators of cell fate decisions are revealed by pseudotemporal ordering of single cells. Nature biotechnology 32, 381–386 DOI: 10.1038/nbt.2859. [DOI] [PMC free article] [PubMed] [Google Scholar]
- Tucker BA, Anfinson KR, Mullins RF, Stone EM, Young MJ, 2013a. Use of a synthetic xeno-free culture substrate for induced pluripotent stem cell induction and retinal differentiation. Stem Cells Transl Med 2, 16–24 DOI: 10.5966/sctm.2012-0040. [DOI] [PMC free article] [PubMed] [Google Scholar]
- Tucker BA, Mullins RF, Streb LM, Anfinson K, Eyestone ME, Kaalberg E, Riker MJ, Drack AV, Braun TA, Stone EM, 2013b. Patient-specific iPSC-derived photoreceptor precursor cells as a means to investigate retinitis pigmentosa. Elife 2, e00824 DOI: 10.7554/eLife.00824. [DOI] [PMC free article] [PubMed] [Google Scholar]
- Tucker BA, Park IH, Qi SD, Klassen HJ, Jiang C, Yao J, Redenti S, Daley GQ, Young MJ, 2011a. Transplantation of adult mouse iPS cell-derived photoreceptor precursors restores retinal structure and function in degenerative mice. PloS one 6, e18992 DOI: 10.1371/journal.pone.0018992. [DOI] [PMC free article] [PubMed] [Google Scholar]
- Tucker BA, Scheetz TE, Mullins RF, DeLuca AP, Hoffmann JM, Johnston RM, Jacobson SG, Sheffield VC, Stone EM, 2011b. Exome sequencing and analysis of induced pluripotent stem cells identify the cilia-related gene male germ cell-associated kinase (MAK) as a cause of retinitis pigmentosa. Proceedings of the National Academy of Sciences of the United States of America 108, E569–576 DOI: 10.1073/pnas.1108918108. [DOI] [PMC free article] [PubMed] [Google Scholar]
- Tucker BA, Solivan-Timpe F, Roos BR, Anfinson KR, Robin AL, Wiley LA, Mullins RF, Fingert JH, 2014. Duplication of TBK1 Stimulates Autophagy in iPSC-derived Retinal Cells from a Patient with Normal Tension Glaucoma. J Stem Cell Res Ther 3, 161 DOI: 10.4172/2157-7633.1000161. [DOI] [PMC free article] [PubMed] [Google Scholar]
- van der Maaten L, Hinton G, 2008. Visualizing Data using t-SNE. Journal of Machine Learning Research 9, 2579–2605. [Google Scholar]
- van Soest SS, de Wit GM, Essing AH, ten Brink JB, Kamphuis W, de Jong PT, Bergen AA, 2007. Comparison of human retinal pigment epithelium gene expression in macula and periphery highlights potential topographic differences in Bruch’s membrane. Molecular vision 13, 1608–1617. [PubMed] [Google Scholar]
- Voigt AP, Binkley E, Flamme-Wiese MJ, Zeng S, DeLuca AP, Scheetz TE, Tucker BA, Mullins RF, Stone EM, 2020a. Single-Cell RNA Sequencing in Human Retinal Degeneration Reveals Distinct Glial Cell Populations. Cells 9 DOI: 10.3390/cells9020438. [DOI] [PMC free article] [PubMed] [Google Scholar]
- Voigt AP, Mulfaul K, Mullin NK, Flamme-Wiese MJ, Giacalone JC, Stone EM, Tucker BA, Scheetz TE, Mullins RF, 2019a. Single-cell transcriptomics of the human retinal pigment epithelium and choroid in health and macular degeneration. Proceedings of the National Academy of Sciences of the United States of America 116, 24100–24107 DOI: 10.1073/pnas.1914143116. [DOI] [PMC free article] [PubMed] [Google Scholar]
- Voigt AP, Whitmore SS, Flamme-Wiese MJ, Riker MJ, Wiley LA, Tucker BA, Stone EM, Mullins RF, Scheetz TE, 2019b. Molecular characterization of foveal versus peripheral human retina by single-cell RNA sequencing. Experimental eye research 184, 234–242 DOI: 10.1016/j.exer.2019.05.001. [DOI] [PMC free article] [PubMed] [Google Scholar]
- Voigt AP, Whitmore SS, Lessing ND, DeLuca AP, Tucker BA, Stone EM, Mullins RF, Scheetz TE, 2020b. Spectacle: An interactive resource for ocular single-cell RNA sequencing data analysis. Experimental eye research 200, 108204 DOI: 10.1016/j.exer.2020.108204. [DOI] [PMC free article] [PubMed] [Google Scholar]
- Voigt AP, Whitmore SS, Mulfaul K, Chirco KR, Giacalone JC, Flamme-Wiese MJ, Stockman A, Stone EM, Tucker BA, Scheetz TE, Mullins RF, 2020c. Bulk and single-cell gene expression analyses reveal aging human choriocapillaris has pro-inflammatory phenotype. Microvasc Res, 104031 DOI: 10.1016/j.mvr.2020.104031. [DOI] [PMC free article] [PubMed] [Google Scholar]
- Wagner AH, Anand VN, Wang WH, Chatterton JE, Sun D, Shepard AR, Jacobson N, Pang IH, Deluca AP, Casavant TL, Scheetz TE, Mullins RF, Braun TA, Clark AF, 2013. Exon-level expression profiling of ocular tissues. Experimental eye research 111, 105–111 DOI: 10.1016/j.exer.2013.03.004. [DOI] [PMC free article] [PubMed] [Google Scholar]
- Waheed NK, Moult EM, Fujimoto JG, Rosenfeld PJ, 2016. Optical Coherence Tomography Angiography of Dry Age-Related Macular Degeneration. Dev Ophthalmol 56, 91–100 DOI: 10.1159/000442784. [DOI] [PMC free article] [PubMed] [Google Scholar]
- Wakatsuki Y, Shinojima A, Kawamura A, Yuzawa M, 2015. Correlation of Aging and Segmental Choroidal Thickness Measurement using Swept Source Optical Coherence Tomography in Healthy Eyes. PloS one 10, e0144156 DOI: 10.1371/journal.pone.0144156. [DOI] [PMC free article] [PubMed] [Google Scholar]
- Wang S, Girman S, Lu B, Bischoff N, Holmes T, Shearer R, Wright LS, Svendsen CN, Gamm DM, Lund RD, 2008. Long-term vision rescue by human neural progenitors in a rat model of photoreceptor degeneration. Investigative ophthalmology & visual science 49, 3201–3206 DOI: 10.1167/iovs.08-1831. [DOI] [PMC free article] [PubMed] [Google Scholar]
- Wei P, Blundon JA, Rong Y, Zakharenko SS, Morgan JI, 2011. Impaired locomotor learning and altered cerebellar synaptic plasticity in pep-19/PCP4-null mice. Molecular and cellular biology 31, 2838–2844 DOI: 10.1128/mcb.05208-11. [DOI] [PMC free article] [PubMed] [Google Scholar]
- Weinberger AW, Eddahabi C, Carstesen D, Zipfel PF, Walter P, Skerka C, 2014. Human complement factor H and factor H-like protein 1 are expressed in human retinal pigment epithelial cells. Ophthalmic Res 51, 59–66 DOI: 10.1159/000351624. [DOI] [PubMed] [Google Scholar]
- Welby E, Lakowski J, Di Foggia V, Budinger D, Gonzalez-Cordero A, Lun ATL, Epstein M, Patel A, Cuevas E, Kruczek K, Naeem A, Minneci F, Hubank M, Jones DT, Marioni JC, Ali RR, Sowden JC, 2017. Isolation and Comparative Transcriptome Analysis of Human Fetal and iPSC-Derived Cone Photoreceptor Cells. Stem Cell Reports 9, 1898–1915 DOI: 10.1016/j.stemcr.2017.10.018. [DOI] [PMC free article] [PubMed] [Google Scholar]
- Whitmore SS, Braun TA, Skeie JM, Haas CM, Sohn EH, Stone EM, Scheetz TE, Mullins RF, 2013. Altered gene expression in dry age-related macular degeneration suggests early loss of choroidal endothelial cells. Molecular vision 19, 2274–2297. [PMC free article] [PubMed] [Google Scholar]
- Whitmore SS, Sohn EH, Chirco KR, Drack AV, Stone EM, Tucker BA, Mullins RF, 2015. Complement activation and choriocapillaris loss in early AMD: implications for pathophysiology and therapy. Progress in retinal and eye research 45, 1–29 DOI: 10.1016/j.preteyeres.2014.11.005. [DOI] [PMC free article] [PubMed] [Google Scholar]
- Whitmore SS, Wagner AH, DeLuca AP, Drack AV, Stone EM, Tucker BA, Zeng S, Braun TA, Mullins RF, Scheetz TE, 2014. Transcriptomic analysis across nasal, temporal, and macular regions of human neural retina and RPE/choroid by RNA-Seq. Experimental eye research 129, 93–106 DOI: 10.1016/j.exer.2014.11.001. [DOI] [PMC free article] [PubMed] [Google Scholar]
- Wiley LA, Burnight ER, DeLuca AP, Anfinson KR, Cranston CM, Kaalberg EE, Penticoff JA, Affatigato LM, Mullins RF, Stone EM, Tucker BA, 2016. cGMP production of patient-specific iPSCs and photoreceptor precursor cells to treat retinal degenerative blindness. Sci. Rep 6, 30742 DOI: 10.1038/srep30742. [DOI] [PMC free article] [PubMed] [Google Scholar]
- Yamada E, 1969. Some Structural Features of the Fovea Centralis in the Human Retina. Archives of Ophthalmology 82, 151–159 DOI: 10.1001/archopht.1969.00990020153002. [DOI] [PubMed] [Google Scholar]
- Yan W, Peng YR, van Zyl T, Regev A, Shekhar K, Juric D, Sanes JR, 2020. Cell Atlas of The Human Fovea and Peripheral Retina. Sci Rep 10, 9802 DOI: 10.1038/s41598-020-66092-9. [DOI] [PMC free article] [PubMed] [Google Scholar]
- Yoshida S, Yashar BM, Hiriyanna S, Swaroop A, 2002. Microarray analysis of gene expression in the aging human retina. Investigative ophthalmology & visual science 43, 2554–2560. [PubMed] [Google Scholar]
- You B, Jiang YY, Chen S, Yan G, Sun J, 2009. The orphan nuclear receptor Nur77 suppresses endothelial cell activation through induction of IkappaBalpha expression. Circ Res 104, 742–749 DOI: 10.1161/circresaha.108.192286. [DOI] [PubMed] [Google Scholar]
- Young TL, Hawthorne F, Feng S, Luo X, St Germain E, Wang M, Metlapally R, 2013. Whole genome expression profiling of normal human fetal and adult ocular tissues. Experimental eye research 116, 265–278 DOI: 10.1016/j.exer.2013.08.009. [DOI] [PMC free article] [PubMed] [Google Scholar]
- Yuan X, Gu X, Crabb JS, Yue X, Shadrach K, Hollyfield JG, Crabb JW, 2010. Quantitative proteomics: comparison of the macular Bruch membrane/choroid complex from age-related macular degeneration and normal eyes. Mol Cell Proteomics 9, 1031–1046 DOI: 10.1074/mcp.M900523-MCP200. [DOI] [PMC free article] [PubMed] [Google Scholar]
- Yuodelis C, Hendrickson A, 1986. A qualitative and quantitative analysis of the human fovea during development. Vision research 26, 847–855 DOI: 10.1016/0042-6989(86)90143-4. [DOI] [PubMed] [Google Scholar]
- Zeng S, Whitmore SS, Sohn EH, Riker MJ, Wiley LA, Scheetz TE, Stone EM, Tucker BA, Mullins RF, 2016. Molecular response of chorioretinal endothelial cells to complement injury: implications for macular degeneration. J Pathol 238, 446–456 DOI: 10.1002/path.4669. [DOI] [PMC free article] [PubMed] [Google Scholar]
- Zerti D, Collin J, Queen R, Cockell SJ, Lako M, 2020. Understanding the complexity of retina and pluripotent stem cell derived retinal organoids with single cell RNA sequencing: current progress, remaining challenges and future prospective. Current eye research 45, 385–396 DOI: 10.1080/02713683.2019.1697453. [DOI] [PMC free article] [PubMed] [Google Scholar]
- Zheng GX, Terry JM, Belgrader P, Ryvkin P, Bent ZW, Wilson R, Ziraldo SB, Wheeler TD, McDermott GP, Zhu J, Gregory MT, Shuga J, Montesclaros L, Underwood JG, Masquelier DA, Nishimura SY, Schnall-Levin M, Wyatt PW, Hindson CM, Bharadwaj R, Wong A, Ness KD, Beppu LW, Deeg HJ, McFarland C, Loeb KR, Valente WJ, Ericson NG, Stevens EA, Radich JP, Mikkelsen TS, Hindson BJ, Bielas JH, 2017. Massively parallel digital transcriptional profiling of single cells. Nat Commun 8, 14049 DOI: 10.1038/ncomms14049. [DOI] [PMC free article] [PubMed] [Google Scholar]