

Abstract
Background
Point-of-care lung ultrasound (LU) is an established tool in the first assessment of patients with coronavirus disease (COVID-19). Purpose of this study was to evaluate the value of lung ultrasound in COVID-19 intensive care unit (ICU) patients in predicting clinical course and outcome.
Methods
We analyzed lung ultrasound score (LUS) of all COVID-19 patients admitted from March 2020 to December 2020 to the Internal Intensive Care Unit, Ludwig-Maximilians-University (LMU) of Munich. LU was performed according to a standardized protocol at ICU admission and in case of clinical deterioration with the need for intubation. A normal lung scores 0 points, the worst LUS has 24 points. Patients were stratified in a low (0–12 points) and a high (13–24 points) lung ultrasound score group.
Results
The study included 42 patients, 69% of them male. The most common comorbidities were hypertension (81%) and obesity (57%). The values of pH (7.42 ± 0.09 vs 7.35 ± 0.1; p = 0.047) and paO2 (107 [80–130] vs 80 [66–93] mmHg; p = 0.034) were significantly reduced in patients of the high LUS group. Furthermore, the duration of ventilation (12.5 [8.3–25] vs 36.5 [9.8–70] days; p = 0.029) was significantly prolonged in this group. Patchy subpleural thickening (n = 38; 90.5%) and subpleural consolidations (n = 23; 54.8%) were present in most patients. Pleural effusion was rare (n = 4; 9.5%). The median total LUS was 11.9 ± 3.9 points. In case of clinical deterioration with the need for intubation, LUS worsened significantly compared to baseline LU. Twelve patients died during the ICU stay (29%). There was no difference in survival in both LUS groups (75% vs 66.7%, p = 0.559).
Conclusions
LU can be a useful monitoring tool to predict clinical course but not outcome of COVID-19 ICU patients and can early recognize possible deteriorations.
Supplementary Information
The online version contains supplementary material available at 10.1186/s12871-021-01396-5.
Keywords: COVID-19, Lung ultrasound, Lung ultrasound score, Clinical course, Outcome, Deterioration
Background
The infection with the severe acute respiratory syndrome coronavirus 2 (SARS-CoV2), COVID-19, leads to viral pneumonia and other organ manifestations like renal and liver failure, myocardial dysfunction, thrombotic complications, and neurologic illnesses [1]. The main cause of intensive care unit (ICU) admission remains lung failure. Older age, comorbidities, high sequential organ failure assessment (SOFA) score, lymphopenia, elevated troponin, and D-dimer have been reported to correlate with poor outcome [2].
In the last years, point-of-care ultrasound has increasingly been used to assess critically ill patients. Especially lung ultrasound (LU) is becoming more important. The sonographic signs e.g., B-lines, are useful in the diagnosis of acute respiratory failure or circulatory shock. Furthermore, LU can be used at the bedside of critically ill patients to assess the efficacy of ventilatory treatments and monitor the course of lung failure. It may also be used to detect and manage respiratory complications such as pneumothorax, atelectasis, and pleural effusions [3–5]. Several studies reported that LU findings correlate similar to high-resolution computed tomography (CT) findings with the clinical course of ICU patients treated for respiratory failure [6, 7].
During the corona pandemic, LU was extensively used in COVID-19 patients since the infection causes interstitial pneumonia [8, 9]. Manivel et al. developed a protocol (Coronavirus disease lung ultrasound in the emergency department protocol - CLUE protocol), which involves an anatomical parameter, the severity of lung changes, and a physiological parameter (oxygen requirement) to evaluate COVID-19 patients in the emergency room [10]. Lichter et al. showed that lung ultrasound score (LUS) at hospital admission strongly correlates with the need for invasive mechanical ventilation and is a strong predictor of mortality [11].
In this study, we analyzed whether LU performed at ICU admission can predict the clinical course and outcome of COVID-19 patients.
Methods
Study design and ethical approval
In this single-center retrospective study, we analyzed prospectively and systematically recorded data of lung ultrasound examinations. The study was approved by the ethics committee of the medical faculty of the Ludwig-Maximilians-University (LMU) Munich, IRB number 20–0227 and waived the need for informed consent because of the non-interventional design of the investigation.
Patient selection and data collection
Between 30/03/2020 and 10/12/2020, we studied all consecutive adult patients with a positive polymerase chain reaction assay for SARS-CoV2 in a respiratory tract sample, admitted to the Internal Intensive Care Unit at LMU hospital Munich, Campus Großhadern. There were no exclusion criteria. Demographic data, comorbidities, medications, and laboratory findings were collected systematically. Baseline was defined as the day of ICU admission. At the beginning of the pandemic, we established a lung ultrasound protocol on our ICU for every COVID-19 patient admitted. LUS was recorded at admission, and in case of respiratory deterioration. All patients underwent a comprehensive LU in the first 6 hours after admission. Respiratory deterioration was defined as the need for intubation in spontaneously breathing patients, including patients treated with high-flow nasal cannula (HFNC) and/or non-invasive ventilation (NIV).
Follow-up and outcomes
All medical records were daily reviewed to obtain clinical follow-up. Outcome analysis started at the time of the baseline LU exam. ICU length of stay (LOS), length of mechanical ventilation, and all-cause ICU mortality were the endpoints of the study.
Lung ultrasound
LU was performed by the ICU physician on duty supervised by a senior physician with expertise in LU recording and interpretation with the same equipment (Venue, GE Healthcare). Each exam takes between 3 and 5 min (min) with the patient in a supine position. No change in position was needed for the exam.
LU was performed on all COVID-19 patients admitted to the internal ICU using an eight-value method (four values for each lung) according to an adapted version of the CLUE protocol [10]. This protocol recommends scanning the chest systematically in 12 zones, six zones for the right lung (R1-R6) and six zones for the left lung (L1-L6). Due to the limited positioning options of our patients (mechanically ventilation, severe lung failure, hemodynamically unstable), we had to adapt the recently published CLUE-protocol. Instead of 12 we systematically scanned eight zones, we defined four zones for the right lung (R1 to R4), and four zones for the left lung (L1 to L4), see Fig. 1.
Fig. 1.
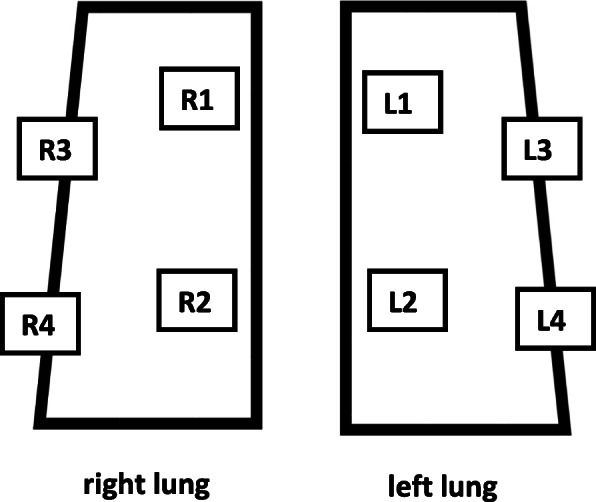
8 zones (R1-R4, L1-L4) for LU, adapted to CLUE protocol [10]
At each of the eight zones, LUS ranges from 0 to 3 points, with higher points allocated to severe lung changes (see Table 1). A normal lung will have a total score of 0 points. The worst LUS will be 24 points. All patients were divided into two groups depending on the LUS at admission: a low (0–12 points) and a high (13–24 points) LUS group.
Table 1.
Lung ultrasound score according to CLUE protocol [10]
| LUS 0 points |
LUS 1 point |
LUS 2 points |
LUS 3 points |
|
|---|---|---|---|---|
| A-lines | yes | no | no | no |
| B-lines | 1–2 | > 2 | confluent | confluent |
| Pleural line | smooth, thin | irregular, thickened | irregular, thickened | irregular, thickened |
| Consolidation | no | no | yes, height < 1 cm | yes, height > 1 cm |
| Accessory |
+/− air bronchogram +/− vascularity |
Statistical analyses
Continuous normally distributed data were presented as means ± standard deviation (SD) and compared using the Student’s t-test. Normal distribution was assessed by the Shapiro-Wilk test. Non-normally distributed variables were compared using the Mann-Whitney-U test. LU scores in consecutive exams were compared using the signed Wilcoxon signed-rank test. Correlation between data was examined using Pearson’s correlation coefficient or Chi2 test. P-values less than 0.05 were considered to indicate statistical significance. All data were analyzed with SPSS version 27 (IBM Corp., Armonk, NY).
Results
During the study period, clinical data were collected for 42 consecutive COVID-19 patients admitted to the Internal ICU. Table 2 shows baseline characteristics and LU assessments of all patients, as well as grouped by LU severity. Twenty-four patients (57%) had a baseline LUS of 0–12 points, and 18 (43%) had a LUS of 13–24 points. The mean age was 66 ± 13 years and 69% were males. Comorbidities were present in 40 patients (95%) with hypertension (81%) being the most common followed by obesity (57%), diabetes (33%), and medication with immunosuppression (31%). Patients with high LUS suffered significantly more often from hematological malignancies (4.2 vs 27.8%, p = 0.033); in all cases lymphomas under ongoing chemotherapy plus anti-CD20-treatment. There were no differences in the laboratory findings, the SOFA or APACHE II scores for both LU groups. The values of pH (7.42 ± 0.09 vs 7.35 ± 0.1; p = 0.047) and paO2 (107 [80–130] vs 80 [66–93] mmHg; p = 0.034) were significantly reduced in patients of the high LUS group. Furthermore, the duration of ventilation (12.5 [8.3–25] vs 36.5 [9.8–70] days; p = 0.029) was significantly prolonged in this group.
Table 2.
Baseline characteristics
| All LUS (n = 42) | LUS 0–12 (n = 24) | LUS 13–24 (n = 18) | P-value | |
|---|---|---|---|---|
| Characteristics at ICU admission | ||||
| Age, years | 66 ± 13 | 68 ± 12 | 64 ± 13 | 0.293 |
| Male gender, n | 29 (69) | 17 (71) | 12 (66.7) | 0.775 |
| SOFA | 7.3 ± 3.7 | 7.1 ± 3.5 | 7.6 ± 4.1 | 0.656 |
| APACHE II | 19.8 ± 7.9 | 19.1 ± 7.6 | 20.7 ± 8.5 | 0.540 |
| BMI, kg/m2 | 29.0 ± 4.8 | 28.7 ± 4.4 | 29.4 ± 5.3 | 0.649 |
| Medical history | ||||
| Hypertension, n | 34 (81) | 20 (83.3) | 14 (77.8) | 0.654 |
| Ischemic heart disease, n | 9 (21.4) | 5 (20.8) | 4 (22.2) | 0.915 |
| Diabetes, n | 14 (33.3) | 7 (29.2) | 7 (38.9) | 0.513 |
| Obesity, n | 24 (57.1) | 13 (54.2) | 11 (61.1) | 0.657 |
| Solid tumor, n | 3 (7.1) | 3 (12.5) | 0 | 0.124 |
| Hematological malignancy, n | 6 (14.3) | 1 (4.2) | 6 (27.8) | 0.033 |
| Immunosuppression, n | 13 (31) | 6 (25) | 7 (38.9) | 0.341 |
| Solid-organ recipient, n | 4 (9.5) | 1 (4.2) | 3 (16.7) | 0.177 |
| Transient ischemic attack/Stroke, n | 5 (11.9) | 4 (16.7) | 1 (5.6) | 0.277 |
| Asthma, n | 2 (4.8) | 1 (4.2) | 1 (5.6) | 0.836 |
| COPD, n | 3 (7.1) | 3 (12.5) | 0 | 0.124 |
| Medications on ICU | ||||
| ACE inhibitor, n | 3 (7.1) | 2 (8.3) | 1 (5.6) | 0.733 |
| Angiotensin receptor blocker, n | 9 (21.4) | 6 (25) | 3 (16.7) | 0.52 |
| Dexamethason, n | 24 (57.1) | 16 (66.7) | 8 (44.4) | 0.155 |
| Other anti-inflammatories, n | 26 (61.9) | 17 (70.8) | 9 (50) | 0.174 |
| Baseline laboratory results | ||||
| Leukocytes, G/l, | 9.7 (5.6–11.3) | 8.02 (5.6–12.7) | 9.9 (6.7–11.2) | 0.332 |
| Lymphocytes, G/l | 7 (3–10) | 8.5 (5–10.3) | 4.5 (2.8–8.3) | 0.066 |
| Creatinine, mg/dl | 0.9 (0.7–1.75) | 0.9 (0.73–1.1) | 0.9 (0.6–2.5) | 0.929 |
| Blood urea nitrogen, mg/dl | 50 (27–78) | 47 (28–63) | 58 (19–92) | 0.751 |
| Albumin, mg/dl | 2.9 ± 0.5 | 3.0 ± 0.4 | 2.8 ± 0.5 | 0.066 |
| C-reactive protein, mg/dl | 10.3 (8.1–14.1) | 10.1 (4.8–12.9) | 10.6 (10–11.2) | 0.083 |
| Lactate dehydrogenase, U/l | 412 ± 125 | 418 ± 128 | 405 ± 124 | 0.742 |
| Interleukin-6, pg/ml | 89.9 (40.3–197) | 81.1 (40.3–239) | 92 (39.8–167) | 0.549 |
| Ferritin, ng/ml | 1533 (662–2201) | 985 (322–2055) | 1648 (1178–2571) | 0.141 |
| High sensitive Troponin T, ng/ml | 0.018 (0.01–0.04) | 0.014 (0.01–0.03) | 0.022 (0.01–0.07) | 0.187 |
| D-Dimer, μg/ml | 1.2 (0.68–4.25) | 1.1 (0.6–1.88) | 1.2 (0.78–6.83) | 0.173 |
| Lactate, mmol/l | 1.1 (0.9–1.5) | 1.1 (0.9–1.58) | 1.0 (0.8–1.5) | 0.351 |
| Blood glucose, mg/dl | 141 (118–179) | 143 (117–193) | 133 (117–177) | 0.638 |
| Brain natriuretic peptide, pg/ml | 736 (212–1847) | 677 (218–1725) | 753 (193–8015) | 0.688 |
| Respiration/Ventilation | ||||
| Invasive ventilation at admission | 19 (45.2) | 9 (37.5) | 10 (55.5) | 0.250 |
| paO2/FiO2 ratio, mmHg | 156 ± 66 | 167 ± 67 | 141 ± 64 | 0.213 |
| pH | 7.40 ± 0.10 | 7.42 ± 0.09 | 7.35 ± 0.1 | 0.047 |
| paO2, mmHg | 91 (75–119) | 107 (80–130) | 80 (66–93) | 0.034 |
| paCO2, mmHg | 44.4 ± 16.6 | 41.8 ± 12.3 | 47.8 ± 19.2 | 0.249 |
| Respiratory rate, breaths/min | 24.3 ± 5.7 | 23.8 ± 6.2 | 24.8 ± 5.0 | 0.543 |
| PEEP (IV), mbar | 12.7 ± 4.1 | 7.8 ± 5.3 | 12.6 ± 3.8 | 0.409 |
| Driving pressure (IV), mbar | 12 (10–15) | 11.5 (8.8–13.5) | 12 (10–16) | 0.393 |
| Compliance (IV), ml/mbar | 41.4 ± 12.8 | 44.9 ± 10.3 | 37.8 ± 14.9 | 0.254 |
| Proning, n | 12 (28.6) | 6 (25) | 6 (33.4) | 0.559 |
| ECMO, n | 8 (19) | 3 (12.5) | 5 (27.8) | 0.134 |
| Baseline lung ultrasound | ||||
| Pleural effusion, n | 4 (9.5) | 2 (8.3) | 2 (11.1) | 0.764 |
| Pleural thickening, n | 38 (90.5) | 20 (83.3) | 18 (100) | 0.072 |
| Subpleural consolidations, n | 23 (54.8) | 7 (29.2) | 16 (88.9) | < 0.001 |
| Lung ultrasound score, n | 11.9 ± 3.9 | 9.2 ± 2.4 | 15.7 ± 2.0 | < 0.001 |
| Outcome | ||||
| Mechanical ventilation, days | 19 (9–51) | 12.5 (8–25) | 36.5 (10–70) | 0.029 |
| ICU LOS, days | 15.5 (8–49) | 15 (8–25) | 38 (8–72) | 0.203 |
| ICU survival, n | 30 (71.4) | 18 (75) | 12 (66.7) | 0.559 |
| Causes of death, n | ||||
| - Lung failure | 3 | 2 | 1 | |
| - Sepsis | 4 | 2 | 2 | |
| - Bleeding complication | 4 | 2 | 2 | |
| - Cardiac failure | 1 | 0 | 1 | |
Data are given as median and interquartile range or n and percent or mean ± SD, respectively. LUS lung ultrasound score, ICU intensive care unit, SOFA sepsis-related organ failure score, APACHE II Acute Physiology And Chronic Health Evaluation II, BMI body mass index, COPD chronic obstructive lung disease, ACE angiotensin-converting enzyme, IV invasive ventilation, paO2 partial pressure of oxygen, FiO2 fraction of inspired oxygen, paCO2 partial pressure of carbon dioxide, PEEP positive end-expiratory pressure, ECMO extracorporeal membrane oxygenation, LOS length of stay
None of the patients had a normal LU at ICU admission or homogenous B-lines in all 8 zones. Patchy subpleural thickening (n = 38; 90.5%) and subpleural consolidations (n = 23; 54.8%) were present in most patients. Pleural effusion was rare (n = 4; 9.5%). The mean total LUS was 11.9 ± 3.9.
Twenty-three patients (54.8%) were not mechanically ventilated at ICU admission. Eleven of whom worsened over the course (after 2 (1–7) days) with the need for intubation and invasive ventilation, see Fig. 2. In this patient group, LUS worsened mostly with increasing evidence of B-Lines, pleural thickening, and consolidations in the anterior zones, see also Table 3. The change in LUS from baseline (ICU admission) to clinical deterioration (day of intubation) was significant (p = 0.02), see Fig. 3.
Fig. 2.

Course of invasive ventilation stratified by LUS groups
Table 3.
Lung ultrasound in respiratory deteriorating patients. Evidence of findings in at least one LU zone. Data are given as n and percent or mean ± SD
| Parameter | Baseline (n = 11) | Follow-up (n = 11) | P-value |
|---|---|---|---|
| Pleural effusion | 0 (0) | 1 (9) | n.s. |
| Homogenous diffuse B-lines | 0 (0) | 0 (0) | n.s. |
| Pleural thickening | 11 (100) | 11 (100) | n.s. |
| Subpleural consolidations | 5 (46) | 10 (91) | 0.025 |
| Lung ultrasound score | 12 ± 4.2 | 15.3 ± 3.7 | 0.02 |
Fig. 3.
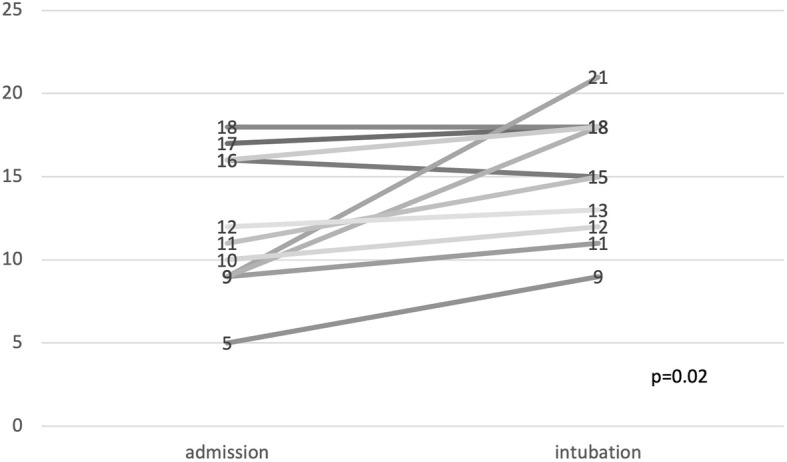
Course of LUS in patients with respiratory deterioration
In our cohort ICU mortality was 29% (n = 12). Baseline characteristics grouped by ICU mortality are shown in Supplemental Table 1. Non-survivors had a significantly increased SOFA (6.2 ± 3.4 vs 10 ± 3; p = 0.001) and APACHE II score (18 ± 7.6 vs 24 ± 7.1), p = 0.022). There was no difference in preexisting comorbidities in both groups. Non-survivors had significantly increased values of leucocytes (8.0 [5.5–10.3] vs 11.9 [9.3–15.4] G/l; p = 0.019), creatinine (0.9 [0.6–1.0] vs 2.0 [0.8–3.0] mg/dl; p = 0.047), lactate dehydrogenase (381 ± 116 vs 483 ± 119 U/l; p = 0.016), interleukin-6 (79 [18.6–171] vs 233 [73–280] pg/ml; p = 0.019), high sensitive troponin (0.012 [0.01–0.02] vs 0.053 [73–280] ng/ml, p < 0.001), and brain natriuretic peptide (482 [174–1454] vs 1725 [797–11,652] pg/ml; p = 0.023). Furthermore, lymphocytes (8 [5.0–10.8] vs 3 [2.3–7.3] G/l; p = 0.039), and albumin (3.0 ± 0.5 vs 2.6 ± 0.3 mg/dl; p = 0.008) were significantly decreased in non-survivors.
Values for paO2/FiO2 ratio (171 ± 61 vs 118 ± 65, p = 0.017) and pH (7.42 ± 0.08vs 7.34 ± 0.13, p = 0.017) were significantly lower in the non-survivor group. Non-survivors needed proning (p = 0.008) and ECMO therapy (p < 0.001) significantly more often.
There was no difference in mortality between the LUS groups in our cohort. But presence of pleural effusion (p = 0.033) and subpleural consolidations (p = 0.020) were each significantly increased in the group that died.
Discussion
COVID-19 primarily leads to viral pneumonia with all stages of lung failure beneath other organ manifestations [1]. During the COVID-19 pandemic, several hospitals used LU to determine the severity of lung failure and to support treatment decisions [8, 12]. In this retrospective study, we evaluated in 42 consecutive COVID-19 ICU patients the potential of LU to predict clinical course and outcome.
In our cohort, 24 patients were assigned to the low LUS group, and 18 patients to the high LUS group. Comparing the two groups there were no significant differences between age, sex, SOFA, APACHE II score, and all considered laboratory findings. This is surprising because several studies have shown that changes in these parameters are associated with higher severity of illness [13–15]. Other studies demonstrated that higher LU scores are associated with an increased disease severity [11, 16, 17]. The lack of relation might be explained by the differences in the studied cohorts. All considered studies examined patient cohorts of all hospital departments while our cohort consisted of ICU patients only.
As expected, pH and paO2 were significantly reduced in the high LUS group confirming that LU reflects the severity of lung failure which is in line with the findings of Zhao et al. [18]. Furthermore, the duration of mechanical ventilation was significantly prolonged in the high LUS group whereas the length of ICU stay was not. The LOS is not only affected by the course of lung failure. Other organ failures like renal or liver, as well as circulatory failure prolong the LOS. In the opinion of the authors, these results show that LU score determined at ICU admission can predict the clinical course of lung failure in COVID-19 patients.
Twelve patients died during their ICU stay (29%). This mortality corresponds with the mortality predicted by SOFA (20–40%) [19] and APACHE II (25–40%) [20] score. There was no difference in mortality between the two LUS groups. One possible reason for these results is that only four of the 12 patients died because of lung failure. The main causes of death were bleeding complications (in all cases under heparinization because of ECMO) and sepsis with other focus than pneumonia. It seems to be comprehensible that LU cannot predict other causes of death than lung failure.
None of the COVID-19 patients in our study had a normal LUS at ICU admission. All of these patients were admitted to ICU due to respiratory failure with the need for oxygen supplementation. Therefore, it is plausible that no patient had a normal LU. Main findings of LU at admission were pleural thickening and subpleural consolidations, pleural effusions were rare, homogenous B-lines over all 8 zones were not seen. Interestingly, presence of pleural effusion and subpleural consolidations at baseline ultrasound examination were each significantly increased in the group that died. In particular, pleural effusions are not a typical feature of COVID-19 pneumonia but could be associated with other comorbidities like renal or heart failure that explain this result.
Other scientists have shown that laboratory parameters like increased values of C-reactive protein, interleukin-6, lactate dehydrogenase, and D-Dimer are predictors of mortality in COVID-19 [21–24]. In our cohort, levels of leukocytes, creatinine, albumin, lactate dehydrogenase, interleukin-6, high-sensitive troponin, and brain natriuretic peptide were significantly increased in the non-survivor group, while levels of lymphocytes and albumin were significantly lower.
In case of clinical deterioration with the need for intubation, LUS was significantly increased compared to initial LUS due to increased detection of B-lines, pleural thickening, and subpleural consolidations, especially in the anterior zones of the lung. These results show that LUS can be used as a valuable monitoring tool to assess the course of lung failure and can early recognize possible deteriorations which is in line with the findings of other research groups [11, 25].
Limitations
This study has certain limitations. It is retrospective, based on data from a single-center and a small cohort. Therefore, a selection bias has to be presumed and data should be interpreted with caution. A larger number of subjects could potentially identify other characteristics associated with clinical course and outcome.
Conclusion
In this retrospective study of 42 COVID-19 patients, we report that lung ultrasound score assessed at ICU admission can predict clinical course (increased days of invasive ventilation with higher lung ultrasound score) but not outcome. Lung ultrasound can be used as a valuable monitoring tool to assess the course of lung failure and can early recognize possible deteriorations.
Supplementary Information
Additional file 1: Supplemental Table 1. Baseline characteristics adjusted to ICU death.
Acknowledgements
Not applicable.
Abbreviations
- ACE
Angiotensin-converting enzyme
- APACHE II
Acute Physiology And Chronic Health Evaluation II
- BMI
Body mass index
- COVID-19
Infection with the severe acute respiratory syndrome coronavirus 2
- COPD
Chronic obstructive lung disease
- CT
Computed tomography
- ECMO
Extracorporeal membrane oxygenation
- FiO2
Fraction of inspired oxygen
- HFNC
High-flow nasal cannula
- ICU
Intensive care unit
- IV
Invasive ventilation
- LMU
Ludwig-Maximilians-University
- LOS
Length of stay
- LU
Lung ultrasound
- LUS
Lung ultrasound score
- NIV
Non-invasive ventilation
- paCO2
partial pressure of carbon dioxide
- paO2
partial pressure of oxygen
- PEEP
Positive end-expiratory pressure
- SARS-CoV2
Severe acute respiratory syndrome coronavirus 2
- SD
Standard deviation
- SOFA
Sequential organ failure assessment
Authors’ contributions
SSS and MB contributed both equally to the conception, design of this study, acquisition, analysis, and interpretation of data. SSS drafted the initial manuscript. SA, AF, JG and HJS contributed to acquisition and interpretation of data; and critically revised the manuscript. All authors have approved the submitted version of this manuscript. The corresponding author (SSS) attests that all listed authors meet authorship criteria and that no others meeting.
Funding
The authors received no financial support for the research, authorship, and/or publication of this article. Open Access funding enabled and organized by Projekt DEAL.
Availability of data and materials
The datasets used and/or analyzed during the current study are available from the corresponding author on reasonable request.
Declarations
Ethics approval and consent to participate
The study was approved by the ethics committee of the medical faculty of the Ludwig-Maximilians-University (LMU) Munich, IRB number 20–0227 and waived the need for informed consent because of the non-interventional design of the investigation.
Consent for publication
Not applicable.
Competing interests
The authors declared no potential conflicts of interest with respect to the research, authorship, and/or publication of this article.
Footnotes
Publisher’s Note
Springer Nature remains neutral with regard to jurisdictional claims in published maps and institutional affiliations.
References
- 1.Gupta A, Madhavan MV, Sehgal K, Nair N, Mahajan S, Sehrawat TS, Bikdeli B, Ahluwalia N, Ausiello JC, Wan EY, Freedberg DE, Kirtane AJ, Parikh SA, Maurer MS, Nordvig AS, Accili D, Bathon JM, Mohan S, Bauer KA, Leon MB, Krumholz HM, Uriel N, Mehra MR, Elkind MSV, Stone GW, Schwartz A, Ho DD, Bilezikian JP, Landry DW. Extrapulmonary manifestations of COVID-19. Nat Med. 2020;26(7):1017–1032. doi: 10.1038/s41591-020-0968-3. [DOI] [PMC free article] [PubMed] [Google Scholar]
- 2.Zhou F, Yu T, Du R, Fan G, Liu Y, Liu Z, et al. Clinical course and risk factors for mortality of adult inpatients with COVID-19 in Wuhan, China: a retrospective cohort study. Lancet. 2020;395(10229):1054–1062. doi: 10.1016/S0140-6736(20)30566-3. [DOI] [PMC free article] [PubMed] [Google Scholar]
- 3.Mojoli F, Bouhemad B, Mongodi S, Lichtenstein D. Lung ultrasound for critically ill patients. Am J Respir Crit Care Med. 2019;199(6):701–714. doi: 10.1164/rccm.201802-0236CI. [DOI] [PubMed] [Google Scholar]
- 4.Bouhemad B, Mongodi S, Via G, Rouquette I. Ultrasound for “lung monitoring” of ventilated patients. Anesthesiology. 2015;122(2):437–447. doi: 10.1097/ALN.0000000000000558. [DOI] [PubMed] [Google Scholar]
- 5.Volpicelli G, Elbarbary M, Blaivas M, Lichtenstein DA, Mathis G, Kirkpatrick AW, et al. International evidence-based recommendations for point-of-care lung ultrasound. Intensive Care Med. 2012;38(4):577–591. doi: 10.1007/s00134-012-2513-4. [DOI] [PubMed] [Google Scholar]
- 6.Lichtenstein DA. BLUE-protocol and FALLS-protocol: two applications of lung ultrasound in the critically ill. Chest. 2015;147(6):1659–1670. doi: 10.1378/chest.14-1313. [DOI] [PubMed] [Google Scholar]
- 7.Danish M, Agarwal A, Goyal P, Gupta D, Lal H, Prasad R, et al. Diagnostic performance of 6-point lung ultrasound in ICU patients: a comparison with chest X-ray and CT thorax. Turk J Anaesthesiol Reanim. 2019;47(4):307–319. doi: 10.5152/TJAR.2019.73603. [DOI] [PMC free article] [PubMed] [Google Scholar]
- 8.Peng QY, Wang XT, Zhang LN. Chinese critical care ultrasound study G. findings of lung ultrasonography of novel corona virus pneumonia during the 2019-2020 epidemic. Intensive Care Med. 2020;46(5):849–850. doi: 10.1007/s00134-020-05996-6. [DOI] [PMC free article] [PubMed] [Google Scholar]
- 9.Poggiali E, Dacrema A, Bastoni D, Tinelli V, Demichele E, Mateo Ramos P, Marcianò T, Silva M, Vercelli A, Magnacavallo A. Can lung US help critical care clinicians in the early diagnosis of novel coronavirus (COVID-19) pneumonia? Radiology. 2020;295(3):E6. doi: 10.1148/radiol.2020200847. [DOI] [PMC free article] [PubMed] [Google Scholar]
- 10.Manivel V, Lesnewski A, Shamim S, Carbonatto G, Govindan T. CLUE: COVID-19 lung ultrasound in emergency department. Emerg Med Australas. 2020;32(4):694–696. doi: 10.1111/1742-6723.13546. [DOI] [PMC free article] [PubMed] [Google Scholar]
- 11.Lichter Y, Topilsky Y, Taieb P, Banai A, Hochstadt A, Merdler I, Gal Oz A, Vine J, Goren O, Cohen B, Sapir O, Granot Y, Mann T, Friedman S, Angel Y, Adi N, Laufer-Perl M, Ingbir M, Arbel Y, Matot I, Szekely Y. Lung ultrasound predicts clinical course and outcomes in COVID-19 patients. Intensive Care Med. 2020;46(10):1873–1883. doi: 10.1007/s00134-020-06212-1. [DOI] [PMC free article] [PubMed] [Google Scholar]
- 12.Volpicelli G, Lamorte A, Villen T. What’s new in lung ultrasound during the COVID-19 pandemic. Intensive Care Med. 2020;46(7):1445–1448. doi: 10.1007/s00134-020-06048-9. [DOI] [PMC free article] [PubMed] [Google Scholar]
- 13.Li X, Xu S, Yu M, Wang K, Tao Y, Zhou Y, Shi J, Zhou M, Wu B, Yang Z, Zhang C, Yue J, Zhang Z, Renz H, Liu X, Xie J, Xie M, Zhao J. Risk factors for severity and mortality in adult COVID-19 inpatients in Wuhan. J Allergy Clin Immunol. 2020;146(1):110–118. doi: 10.1016/j.jaci.2020.04.006. [DOI] [PMC free article] [PubMed] [Google Scholar]
- 14.Ishii M, Terai H, Kabata H, Masaki K, Chubachi S, Tateno H, et al. Clinical characteristics of 345 patients with coronavirus disease 2019 in Japan: a multicenter retrospective study. J Inf Secur. 2020;81(5):e3–e5. doi: 10.1016/j.jinf.2020.08.052. [DOI] [PMC free article] [PubMed] [Google Scholar]
- 15.Ferrando C, Mellado-Artigas R, Gea A, Arruti E, Aldecoa C, Bordell A, Adalia R, Zattera L, Ramasco F, Monedero P, Maseda E, Martínez A, Tamayo G, Mercadal J, Muñoz G, Jacas A, Ángeles G, Castro P, Hernández-Tejero M, Fernandez J, Gómez-Rojo M, Candela Á, Ripollés J, Nieto A, Bassas E, Deiros C, Margarit A, Redondo FJ, Martín A, García N, Casas P, Morcillo C, Hernández-Sanz ML, de la Red de UCI Española para COVID-19 Patient characteristics, clinical course and factors associated to ICU mortality in critically ill patients infected with SARS-CoV-2 in Spain: a prospective, cohort, multicentre study. Rev Esp Anestesiol Reanim. 2020;67(8):425–437. doi: 10.1016/j.redar.2020.07.003. [DOI] [PMC free article] [PubMed] [Google Scholar]
- 16.de Alencar JCG, Marchini JFM, Marino LO, da Costa Ribeiro SC, Bueno CG, da Cunha VP, et al. Lung ultrasound score predicts outcomes in COVID-19 patients admitted to the emergency department. Ann Intensive Care. 2021;11(1):6. doi: 10.1186/s13613-020-00799-w. [DOI] [PMC free article] [PubMed] [Google Scholar]
- 17.Bonadia N, Carnicelli A, Piano A, Buonsenso D, Gilardi E, Kadhim C, Torelli E, Petrucci M, di Maurizio L, Biasucci DG, Fuorlo M, Forte E, Zaccaria R, Franceschi F. Lung ultrasound findings are associated with mortality and need for intensive care admission in COVID-19 patients evaluated in the emergency department. Ultrasound Med Biol. 2020;46(11):2927–2937. doi: 10.1016/j.ultrasmedbio.2020.07.005. [DOI] [PMC free article] [PubMed] [Google Scholar]
- 18.Zhao L, Yu K, Zhao Q, Tian R, Xie H, Xie L, Deng P, Xie G, Bao A, du J. Lung ultrasound score in evaluating the severity of coronavirus disease 2019 (COVID-19) pneumonia. Ultrasound Med Biol. 2020;46(11):2938–2944. doi: 10.1016/j.ultrasmedbio.2020.07.024. [DOI] [PMC free article] [PubMed] [Google Scholar]
- 19.Ferreira FL, Bota DP, Bross A, Melot C, Vincent JL. Serial evaluation of the SOFA score to predict outcome in critically ill patients. JAMA. 2001;286(14):1754–1758. doi: 10.1001/jama.286.14.1754. [DOI] [PubMed] [Google Scholar]
- 20.Knaus WA, Draper EA, Wagner DP, Zimmerman JE. APACHE II: a severity of disease classification system. Crit Care Med. 1985;13(10):818–829. doi: 10.1097/00003246-198510000-00009. [DOI] [PubMed] [Google Scholar]
- 21.Wang JH, Chen RD, Yang HK, Zeng LC, Chen H, Hou YY, Hu W, Yu JS, Li H. Inflammation-associated factors for predicting in-hospital mortality in patients with COVID-19. J Med Virol. 2021;93(5):2908–2917. doi: 10.1002/jmv.26771. [DOI] [PubMed] [Google Scholar]
- 22.Gorham J, Moreau A, Corazza F, Peluso L, Ponthieux F, Talamonti M, Izzi A, Nagant C, Ndieugnou Djangang N, Garufi A, Creteur J, Taccone FS. Interleukine-6 in critically ill COVID-19 patients: a retrospective analysis. PLoS One. 2020;15(12):e0244628. doi: 10.1371/journal.pone.0244628. [DOI] [PMC free article] [PubMed] [Google Scholar]
- 23.Ma X, Wang H, Huang J, Geng Y, Jiang S, Zhou Q, Chen X, Hu H, Li W, Zhou C, Gao X, Peng N, Deng Y. A nomogramic model based on clinical and laboratory parameters at admission for predicting the survival of COVID-19 patients. BMC Infect Dis. 2020;20(1):899. doi: 10.1186/s12879-020-05614-2. [DOI] [PMC free article] [PubMed] [Google Scholar]
- 24.Aksel G, Islam MM, Algin A, Eroglu SE, Yasar GB, Ademoglu E, et al. Early predictors of mortality for moderate to severely ill patients with Covid-19. Am J Emerg Med. 2020. 10.1016/j.ajem.2020.08.076. [DOI] [PMC free article] [PubMed]
- 25.Dargent A, Chatelain E, Kreitmann L, Quenot JP, Cour M, Argaud L, the COVID-LUS study group Lung ultrasound score to monitor COVID-19 pneumonia progression in patients with ARDS. PLoS One. 2020;15(7):e0236312. doi: 10.1371/journal.pone.0236312. [DOI] [PMC free article] [PubMed] [Google Scholar]
Associated Data
This section collects any data citations, data availability statements, or supplementary materials included in this article.
Supplementary Materials
Additional file 1: Supplemental Table 1. Baseline characteristics adjusted to ICU death.
Data Availability Statement
The datasets used and/or analyzed during the current study are available from the corresponding author on reasonable request.