Abstract
The COVID-19 pandemic has exerted a disproportionate effect on older European populations living in nursing homes. This article discusses the 'fatal underfunding hypothesis', and reports an exploratory empirical analysis of the regional variation in nursing home fatalities during the first wave of the COVID-19 pandemic in Spain, one of the European countries with the highest number of nursing home fatalities. We draw on descriptive and multivariate regression analysis to examine the association between fatalities and measures of nursing home organisation, capacity and coordination plans alongside other characteristics. We document a correlation between regional nursing home fatalities (as a share of excess deaths) and a number of proxies for underfunding including nursing home size, occupancy rate and lower staff to a resident ratio (proxying understaffing). Our preliminary estimates reveal a 0.44 percentual point reduction in the share of nursing home fatalities for each additional staff per place in a nursing home consistent with a fatal underfunding hypothesis.
Keywords: Nursing homes; care coordination; long-term care financing; understaffing; nursing home size; COVID-19; Underfunding, Spain.
Introduction
It is well known that the risk exposure to COVID-19 increases with age. Eight out of ten COVID-19 deaths have been on adults over 65 years (CDC, 2020). Older individuals are more vulnerable to the COVID-19 risk, given their weaker immune system, lower physiological reserve and, more generally, the higher prevalence of multi-morbidities among older age than younger individuals (Montecino-Rodriguez et al., 2013). In some European countries such as Spain, the risk of death from COVID-19 is estimated at 4.6% among individuals aged 60–70 years, yet such number increases to 13.6% among individuals aged 70 to 80 years, and 21% among those 80 years and over. Some estimates suggest that 87% of COVID-19 deaths in Spain are among individuals aged 70 years and above (Spanish National Network for Epidemiological Monitoring, 2020a, 2020b).
A significant share of COVID-19 fatalities has taken place in nursing homes. At the time of the study, publicly reported evidence suggests that 22,373 people (or 55% of all those who died from COVID-19) died in nursing homes (Ministry of Health, 2020a, 2020b). To put this evidence in context, 13% of all nursing home residents died from COVID-19 in the first wave of the pandemic in Spain. Such a figure rises to 22% of nursing home residents over the age of 80 years. However, we still know little about the reasons for such large number of fatalities in nursing homes compared to age-matched controls in the community. This article attempts to shed some light on this question focussing on the evidence available at the time of the study, and more specifically examining the effect of a structural determinant of excess nursing home fatalities, namely the role of underfunding (including under-staffing).
Spain alongside other Southern European countries is one of the countries that have been heavily exposed to austerity cuts in the 2008–2013 period, which entailed a significant reduction in long-term care funding available, and as we argue in the article, might have magnified the effects of a pandemic in nursing homes. Yet, given that COVID-19 has not affected nursing homes equally across the entire country, it is possible to appreciate important differences across regions in nursing home fatalities. Whilst in some regions (such as Madrid), 18% of nursing home residents died from March to May; in other regions (in Andalusia), the figure is three to four times lower (and exhibit a 5% fatality rate) (Ministry of Health, 2020a, 2020b). Hence, what can explain such regional differences in nursing home deaths? Can some specific features of the way nursing homes are organised, predict such large regional differences in nursing home fatalities?
This paper provides a hypothesis-generating analysis of the regional variation in the nursing home organisation to examine whether underfunding alongside other explanations influenced nursing home fatalities during the first wave of the COVID-19 pandemic (March to May). More specifically, we examine whether proxy measures of nursing home underfunding, including understaffing (staff to places ratio), correlate with nursing home fatalities (relative to excess deaths). For instance, we predict the effect of the average nursing home size (regions that exhibit larger nursing homes might not guarantee access to protective equipment), and especially, the average regional nursing home occupancy rate (as occupancy plays a role in limiting the availability of spare rooms for self-isolation). Finally, we control for the role played by the existence of regional health and long-term care coordination plans which might play a crucial role in preventing fatalities.
The rest of the article is organised as follows: the next section provides international evidence on nursing home deaths. Section three examines chronic underfunding in nursing homes and considers the role of safety equipment and coordination both between health and social care and between governments. Section four examines the evidence on COVID-19 and excess mortality in nursing homes in Spain. The final section concludes.
International Evidence on COVID-19 Deaths in Nursing Homes
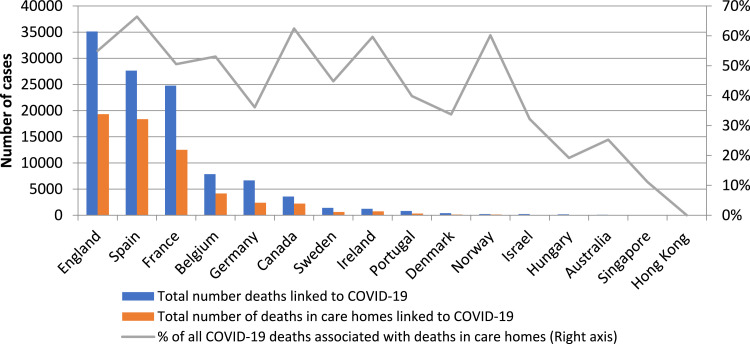
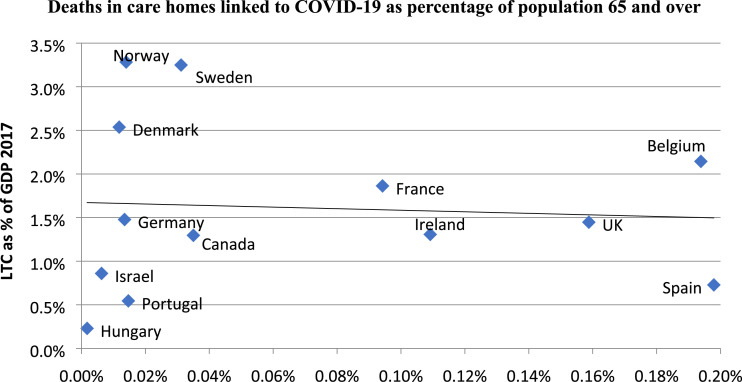
The international evidence available at the time of the study, suggests that in some countries a large share (close to 50%) of COVID-19 fatalities took place in nursing homes. However, Figure 1 shows that whilst in some countries we barely find any nursing home fatality, in some European countries deaths exceeded 10,000 already in May 2020 (with the notable exception of Germany and Denmark). In Spain, the figure suggests that 66% of the total deaths attributable to COVID-19 in mid-May as reported in Figure 2. The rest of the article will focus on examining evidence from Spain, to examine the main underlying explanations for the higher-than-average number of cases in the country.
Figure 1.
Nursing home deaths in selected countries. Source: Own elaboration and International Long-term Care Policy Network https://ltcCOVID.org/international-reports-on-COVID-19-and-long-term-care/, Sweden: COVID-19 deaths refer to the Stockholm region.
Figure 2.
Total number of deaths in care homes linked to COVID-19 as % of population 65 years and over and LTC as % of GDP 2017. Selected OECD countries. Source: International Long-term Care Policy Network and OECD Health Statistics (2019), https://www.oecd.org/els/health-systems/long-term-care.htm. Note: Sweden: COVID-19 deaths refer to the Stockholm region; OECD: Organization for Economic Cooperation and Development.
Chronic Underfunding
The main hypothesis we put forward in this paper for such large nursing home deaths is chronic underfunding, which reflects in understaffing when a care unit systematically operates at the limit of its capacity. In a pandemic, underfunded nursing homes might lack the sufficient spare human resources (and other inputs) to perform its duties at its expected quality. As a phenomenon, underfunding has been especially pervasive in the provision of long-term care services in many Southern European countries after the Great Recession (Costa-Font et al., 2016b). Austerity reforms gave rise to spending cuts in2012–2013, which reduced by an average of 20% available funding (Costa-Font et al., 2018; Costa-Font et al., 2016a). Although many European countries have expanded their funding for long-term care over time, spending growth has not kept in line with the increasing needs of the elderly population facilities providing care commonly face staff shortages and, many lacked contingency plans and training to use protective personal equipment (PPE) (Médecins Sans Frontières, 2020).
Limited long-term care funding engenders waiting lists in the access of long-term care (the percentage of applications still waiting for a place in a nursing home is as high as 30% of the total in Spain). The latter explains that a large share of the population already exhibited some level of 'institutionalization aversion' before the pandemic (Costa-Font, 2017). Finally, underfunding can compromise the quality of care delivered in nursing homes. For instance, in the first wave of the pandemic, it was challenging for high occupancy facilities to find rooms available for social distancing. Similarly, a common reaction to underfunding has been the reduction in the hiring of permanent staff. Unfortunately, the reliance on temporary staff that work in different facilities, or that take up different jobs might have exacerbated nursing home cases and fatalities.
Certainly, underfunding is not specific to Spain, and other studies suggest it is common in other countries too (Werner et al., 2020). Figure 2 displays evidence of a negative correlation between the number of nursing home deaths in a country and its LTC spending as a share of GDP. Although the evidence only suggests some moderate correlation, Figure 1 reveals that there are important outliers and the association is mainly driven by evidence a the United Kingdom, and especially Spain.
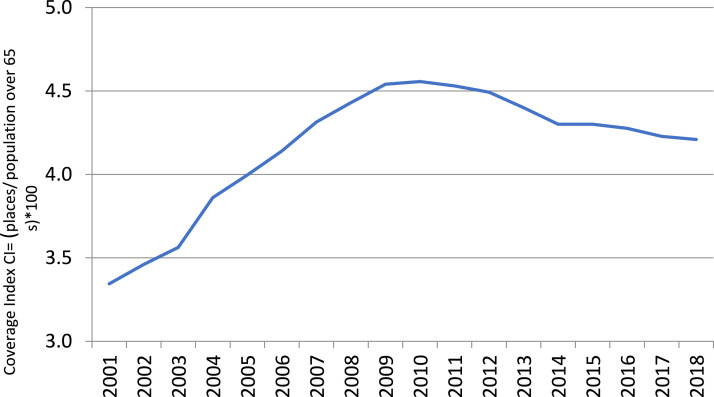
Consistently with the hypothesis of underfunding, Figure 3 reveals that the percentage of nursing home places as a share of the population over 65 years (coverage index) exhibits a declining trend since 2008. As a reaction to the excess demand of nursing home places, Spain has seen an expansion of both nursing home size and especially its occupancy rate. Importantly, as we show below, both measures correlate with nursing home fatalities (as a share of excess deaths).
Figure 3.
Nursing home beds as a share of population over 65 years (2001–2018). Source: IMSERSO, https://www.imserso.es/imserso_01/documentacion/estadisticas/ssppmm_esp/index.htm. Population data from: local census, several years.
Other Explanations
Coordination Failures and Safety
Underfunding can be made worst by the presence of coordination failures. Health and long-term care services in Spain have traditionally been subject to several types of ‘coordination failures’ both between health and social care services, and between different levels of government. Pandemics such as the COVID-19 put a strain on the efficiency of contingency plans and were responsible for delays in the transfer of residents into a hospital and reduced the access to PPE. Coordination plans for health and social care have been limited to a few regions. Only 8 of 17 regions in Spain had developed health and social care coordination plans at the time of the pandemic 1 , which might have halted the patient transfer to hospitals. Consistently, evidence from before the first wave of the pandemic suggests that limited coordination between health and social care has led to additional hospitalisations (Costa-Font et al., 2018).
During the first wave of the pandemic, after the state of emergency was declared in Spain on Saturday 14th of March, the healthcare stewardship of the health system was returned to the central government, which might have lead to an additional coordination problem between levels of government. In contrast, the regulation of nursing homes, remained as a regional responsibility. Coordination failures can explain that on average, most regions took between 26 and 31 days to report a case.
Finally, coordination failures took place together with other safety failures. Indeed, protocols in nursing home facilities only requested symptomatic cases to self-isolate, but not those in close contact with them.
Health System Preparedness
Certainly, not all countries were equally prepared to face the healthcare consequences of the first wave of the COVID-19 pandemic. European countries exhibited significant differences in the availability of critical care beds to treat new cases. 2 However, the availability of critical care beds is only one of the ways to prepare for additional healthcare needs during a pandemic, as pandemics constrain access to emergency health care. 3 Already, before the pandemic, hospital admissions were slower among nursing homes residents than community equivalent populations (Lee et al., 2003, Robins et al., 2013).
Some organisations have documented evidence that a significant number of emergency hospital referrals in Spain were slowed down during the peak of the pandemic increasing the share of positive patients in a nursing home (Médecins Sans Frontières, 2020). In some regions, older age patients were refused emergency health care from major hospitals, 4 as clinical guidelines explicitly stated not to admit older patients residing in nursing homes. 5 Finally, health systems facing capacity restrictions engage in rationing by age. That is, older age individuals received a lower priority in the management of hospital waiting lists (Venkatapuram et al., 2017).
Community Infections
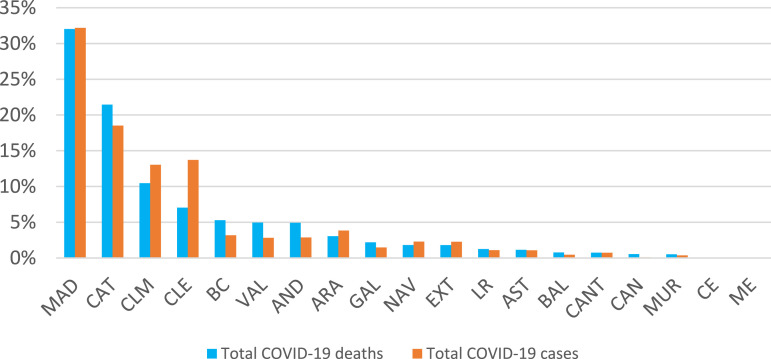
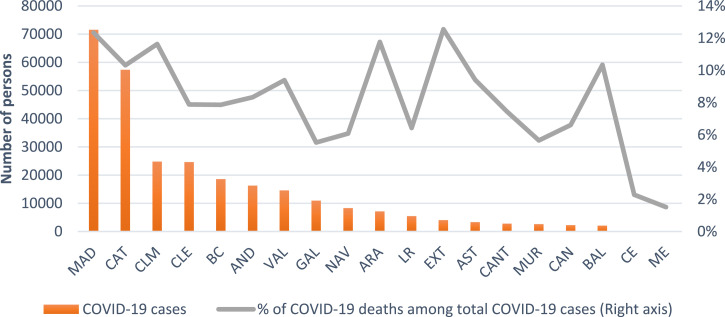
Finally, an additional explanation refers to the knock on effects of infections in the community. Accordingly, regional differences in COVID-19 cases in Spain are depicted in Figures 4 and 5. Figure 4 indicates that as of May 16, 2020, nearly 64% of total COVID-19 deaths were concentrated in a few regions, namely in Madrid, Catalonia and Castilla-La Mancha, with Madrid being the region with the highest number of cases and fatalities.
Figure 4.
Regional distribution of total COVID-19 deaths and cases (May 16, 2020). Region names are: MAD = Madrid, CAT =Catalonia, CLM = Castilla-La Mancha, CLE = Castilla Leon, BC = Basque Country, VAL = Valencian Community, AND = Andalusia, ARA = Aragon, GAL = Galicia, NAV = Navarra, EXT = Extremadura, LR = La Rioja, AST = Asturias, BAL = Balearics, CANT = Cantabria, CAN = Canary Islands, MUR = Murcia, CE = Ceuta and ME = Melilla. Source: Ministry of Health.
Figure 5.
Total COVID-19 cases and infection fatality rate by region (May 16, 2020). Region names are: MAD = Madrid, CAT =Catalonia, CLM = Castilla-La Mancha, CLE = Castilla Leon, BC = Basque Country, VAL = Valencian Community, AND = Andalusia, ARA = Aragon, GAL = Galicia, NAV = Navarra, EXT = Extremadura, LR = La Rioja, AST = Asturias, BAL = Balearics, CANT = Cantabria, CAN = Canary Islands, MUR = Murcia, CE = Ceuta and ME = Melilla. Source: Ministry of Health.
However, when we turn to examine the fatality rate, we find a different picture. Figure 5 depicts the severity of the pandemic against the fatality ratio as of May 16, 2020 defined as the number of deaths attributed to COVID-19 as a share of the number of cases (number of people that have tested). Although some regions report low number of cases such as Aragon, Extremadura and Balearics, evidence on COVID-19 fatalities reveals a more even picture with the exception of the two territories in Africa (Ceuta and Melilla). Suggesting that differences in fatalities in the community do not match the regional differences in nursing home fatalities we discuss in the next section.
Evidence on COVID-19 Deaths in Nursing Homes
Measuring Nursing Home Fatalities
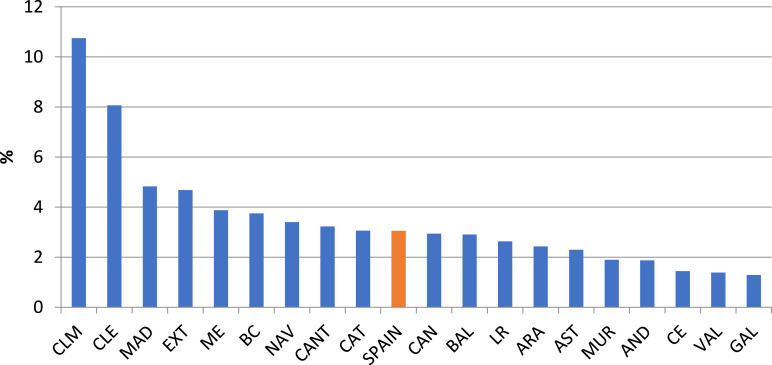
Figure 6 reveals that on average, 3% of the population reside in nursing homes. However, official estimates suggest that 18,400 (66%) of the total of 27,709 COVID-19 fatalities took place in nursing homes (RTVE, 05/19/2020). Yet, such estimates are largely heterogeneous across regions, ranging from less than 2% in Galicia to 11% in Castilla-La Mancha.
Figure 6.
Share of population in nursing homes by region in 2018 (or nearest available). Region names are: MAD = Madrid, CAT = Catalonia, CLM = Castilla-La Mancha, CLE = Castilla Leon, BC = Basque Country, VAL = Valencian Community, AND = Andalusia, ARA = Aragon, GAL = Galicia, NAV = Navarra, EXT = Extremadura, LR = La Rioja, AST = Asturias, BAL = Balearics, CANT = Cantabria, CAN = Canary Islands, MUR = Murcia, CE = Ceuta and ME = Melilla. Source: IMSERSO, https://www.imserso.es/imserso_01/documentacion/estadisticas/ssppmm_esp/index.htm.Note: Aragon, Canary Islands and Extremadura, data from 2016. Galicia, data from 2017.
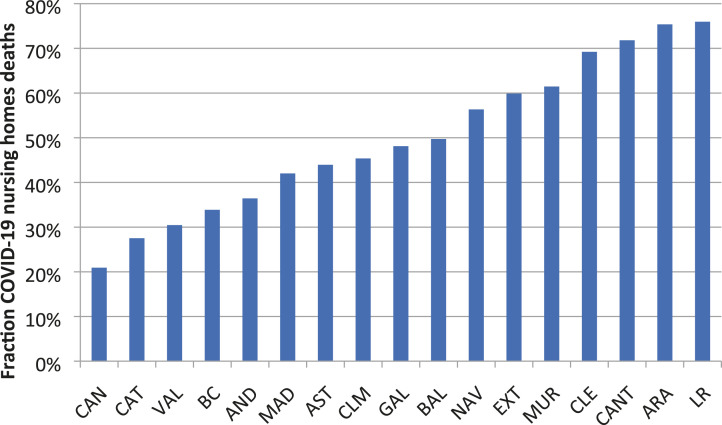
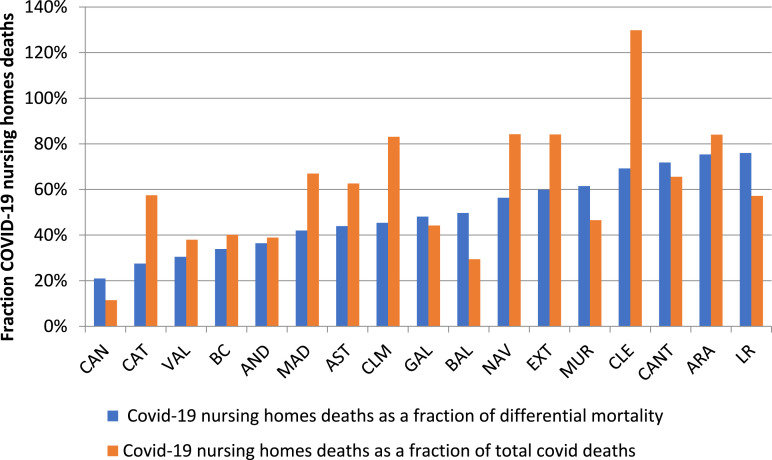
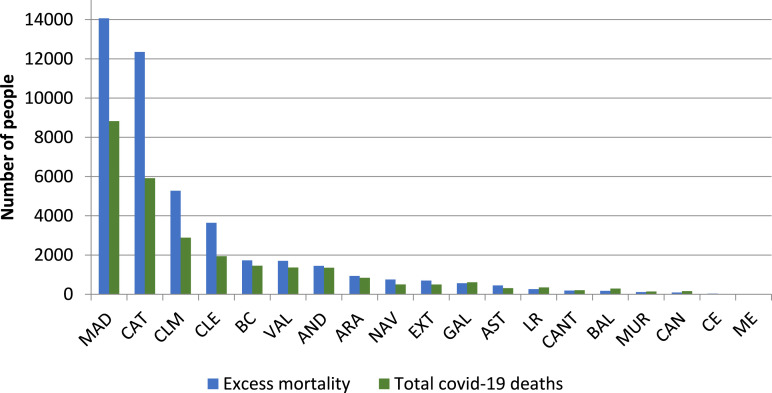
Figure 7 displays the regional variation in nursing home deaths as a share of excess deaths. Excess deaths are computed as the difference between total deaths from March to May 16th, 2020 and total deaths from March to May 16th, 2019 for each region; information was published by the Spanish National Network for Epidemiological Monitoring (MoMo), 2020b. Such estimates indicate significant regional variation (Figures A1 and A2 in the appendix display the difference with estimates from reported COVID-19 deaths).
Figure 7.
Nursing homes deaths as a share of excess deaths (May 16, 2020). Region names are: MAD = Madrid, CAT =Catalonia, CLM = Castilla-La Mancha, CLE = Castilla Leon, BC = Basque Country, VAL = Valencian Community, AND = Andalusia, ARA = Aragon, GAL = Galicia, NAV = Navarra, EXT = Extremadura, LR = La Rioja, AST = Asturias, BAL = Balearics, CANT = Cantabria, CAN = Canary Islands, MUR = Murcia, CE = Ceuta and ME = Melilla. Source: RTVE and MoMo.
Nursing Home Size
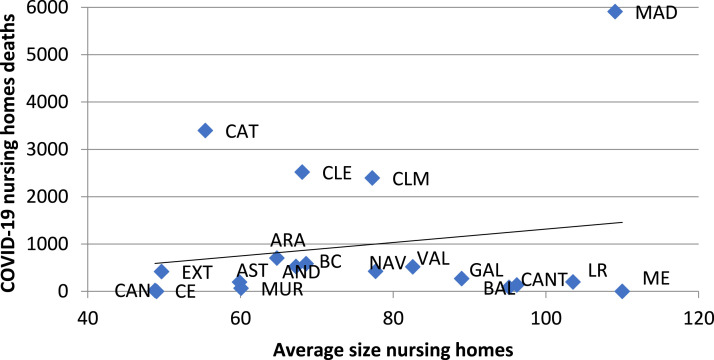
Consistently with the article’s hypothesis, larger sized nursing homes exhibit higher regional nursing home fatalities as displayed in Figure 8. Regions where nursing home bed capacity exceeds 100 beds such as Madrid and La Rioja have experienced higher-than-average death rates. In contrast, regions such as Catalonia, Extremadura and the Canary Islands, where the average size was about half (closer to 50), reveal a lower mortality.
Figure 8.
Average size of nursing homes (number of beds/number of homes) and COVID-19 nursing home deaths by region. Region names are: MAD = Madrid, CAT =Catalonia, CLM = Castilla-La Mancha, CLE = Castilla Leon, BC = Basque Country, VAL = Valencian Community, AND = Andalusia, ARA = Aragon, GAL = Galicia, NAV = Navarra, EXT = Extremadura, LR = La Rioja, AST = Asturias, BAL = Balearics, CANT = Cantabria, CAN = Canary Islands, MUR = Murcia, CE = Ceuta and ME = Melilla. Source: RTVE and IMSERSO.
Nursing Home Occupancy
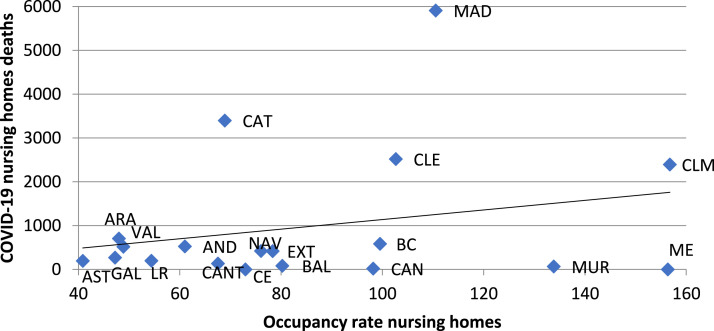
Another potential hypothesis for nursing home fatalities refers to its high-occupancy rate. Figure 9 shows that regions, where nursing homes were near full capacity, exhibit a larger number of deaths. This is consistent with an underfunding hypothesis, whereby higher occupancy reduced the availability of spare rooms for self-isolation purposes.
Figure 9.
Average occupancy rate (number of users/number of beds) and COVID-19 nursing home deaths by region. Region names are: MAD = Madrid, CAT =Catalonia, CLM = Castilla-La Mancha, CLE = Castilla Leon, BC = Basque Country, VAL = Valencian Community, AND = Andalusia, ARA = Aragon, GAL = Galicia, NAV = Navarra, EXT = Extremadura, LR = La Rioja, AST = Asturias, BAL = Balearics, CANT = Cantabria, CAN = Canary Islands, MUR = Murcia, CE = Ceuta and ME = Melilla. Source: RTVE and IMSERSO. Note: Data of users (IMSERSO): Aragon, Canary Islands and Extremadura, data from 2016. Galicia, data from 2017. Rest of regions 2018.
Multivariate Regression Analysis
Given that some of the descriptive determinants presented in the previous section are potentially correlated, in this section we report evidence from multivariate regression analysis examining the association between regional nursing home deaths as a share of excess mortality in the first wave of the COVID-9 pandemic. Given the small number of observations, we have only included a small list of variables as covariates in each of the specifications, and our analysis at this stage is only exploratory. We specifically examine the influence of a number of covariates such as the regional supply of nursing home beds, the share of the total population over 65 years, the regional nursing home size, the regional nursing home occupancy rate and the staff to resident ratio. We use the latter two as a measures of understaffing.
Table 1 reports a description of the variables. It suggests that the average region in Spain has 20,061 nursing home places and 287 nursing home facilities. On average, there is a nursing home place for every 20 individuals over the age of 65 years in a nursing home. Importantly, we estimate the average ratio of the total regional staff employed in nursing homes in a region (as measured by the survey of active population in 2020) to the number of nursing home places. The estimate takes the average value of 0.99, but such an estimate exhibits a large regional variation. 6 About 42% of regions have some coordination plan, and the average size of a nursing home is of 75 paces. Finally, the average occupancy rate is 84%, consistent with the hypothesis of long-term care underfunding.
Table 1.
Descriptive Statistics of Variables in the Analysis.
| Variable | Mean | Std. Dev | Min | Max |
|---|---|---|---|---|
| Nursing home places | 20061 | 18997 | 196 | 64093 |
| Nursing home facilities | 287 | 293 | 2 | 1157 |
| Population over 6 | 476610 | 460869 | 8876 | 1,442,630 |
| COVID-19 deaths until March 14 | 7 | 19 | 0 | 86 |
| COVID-19 deaths until May 16 | 1455 | 2267 | 2 | 8826 |
| COVID-19 NH deaths | 966 | 1540 | 0 | 5909 |
| Coverage: NH places/pop65+ | 0.043 | 0.018 | 0.014 | 0.079 |
| Excess death | 2339 | 4070 | 3 | 14065 |
| Employment in NH | 15202 | 13894 | 247 | 45640 |
| Occupancy rate | 84 | 35 | 41 | 157 |
| Size nursing home places | 75 | 20 | 49 | 110 |
| Staff to place ratio (total staff in NH/NH places) | 0.99 | 0.620 | 0.512 | 3.195 |
| Coordination | 0.421 | 0.507 | 0 | 1 |
| Nursing homes users/pop65+ | 0.035 | 0.024 | 0.013 | 0.107 |
| Total observations | 19 |
Note. This table reports the mean and SD of the variables used in the multivariate analysis.
Table 2 reports the regional correlates of nursing home deaths relative to excess deaths, and given the small number of observations, we use a stepwise analysis, whereby we add additional variables to the analysis. We find that larger-sized nursing home exhibit higher fatalities relative to excess deaths. More specifically, our coefficients suggest a 0.6 percentual point (pp) increase (in fatalities per excess deaths) per an additional place in each nursing home. Similarly, we predict a 0.44pp reduction in relative fatalities per additional staff per place in a nursing home. However, these estimates come from a small number of observations and report an adjusted association that cannot be interpreted as causal.
Table 2.
Dependent Variable: COVID-19 Nursing Home Deaths as a Fraction of Excess Death.
| (1) | (2) | (3) | (4) | (5) | (6) | (7) | (8) | (9) | |
|---|---|---|---|---|---|---|---|---|---|
| Nursing homes places (thousands) | 0.00818 | −0.0152 | −0.0162 | −0.0117 | −0.0101 | −0.00857 | −0.00229 | 0.00128 | 0.0176 |
| (0.0065) | (0.0095) | (0.0101) | (0.0110) | (0.0117) | (0.0136) | (0.0146) | (0.0115) | (0.0129) | |
| Population 65+ | −.00038 | 0.00051 | 0.000532 | 0.000357 | 0.000264 | 0.000208 | −00002 | −0.00007 | −0.00078 |
| (.0003) | (0.0004) | (0.0004) | (0.0004) | (0.0005) | (0.0005) | (0.0006) | (0.0004) | (0.0005) | |
| Nursing homes places/pop65+ | 13.13*** | 13.42** | 14.38*** | 11.93* | 11.46 | 8.553 | 20.24** | ||
| (4.388) | (4.585) | (4.679) | (6.448) | (6.972) | (7.395) | (7.194) | |||
| Deaths until March 14 | 0.995 | 1.289 | 1.302 | 1.444 | −0.259 | −4.248 | −3.109 | ||
| (2.643) | (2.658) | (2.730) | (2.899) | (3.263) | (2.938) | (3.785) | |||
| Nursing homes users/pop65+ | −2.955 | −2.312 | −2.410 | −2.605 | −22.00** | −8.343 | |||
| (2.927) | (3.211) | (3.367) | (3.340) | (.7.583) | (7.580) | ||||
| Staff NH/NH places | −0.0642 | −0.0720 | −0.135 | −0.502** | −0.448* | ||||
| (0.113) | (0.122) | (0.133) | (0.170) | (0.220) | |||||
| Coordination | −0.0287 | −0.0442 | −0.0812 | −0.117 | |||||
| (0.114) | (0.114) | (0.0902) | (0.116) | ||||||
| Size nursing homes | 0.00332 | 0.00725** | 0.00673* | ||||||
| (0.00302) | (0.00276) | (0.00359) | |||||||
| Occupancy rate | 0.0129** | 0.00494 | |||||||
| (0.00474) | (0.00494) | ||||||||
| Constant | 0.460*** | −0.0507 | −0.0597 | −0.00532 | 0.150 | 0.189 | 0.131 | −0.705 | 0.348 |
| (0.0773) | (0.182) | (0.189) | (0.197) | (0.340) | (0.387) | (0.387) | (0.431) | (0.277) | |
| Observations | 19 | 19 | 19 | 19 | 19 | 19 | 19 | 19 | 19 |
| R-squared | 0.107 | 0.441 | 0.446 | 0.486 | 0.500 | 0.503 | 0.556 | 0.757 | 0.543 |
Notes: This table provides the coefficients of a linear regression analysis of the main determinants of regional nursing home deaths. We specifically examine the association of nursing home fatalities relative to excess death and nursing home places, occupancy, nursing home size, population over the age of 65 years, the supply of nursing home beds relative to the regional population over 65 years, the total number of deaths and the nursing home staff to places ratio. * Refers to significance at 10%, ** Refers to significance at 5%, *** Refers to significance at 1%.
Finally, we estimate a significant association between nursing home occupancy rate and nursing fatalities relative to excess deaths, which is sensitive to the inclusion of the share of nursing homes per older population. These results indicate that regions with higher nursing home occupancy rate have higher nursing home death as a share of excess deaths. All the other covariates are not significant.
Conclusion
The first wave of COVID-19 encompassed a large number of fatalities in nursing homes. However, to date, we know little about what underlying explanations that were driving such large fatality rate. This article provides descriptive and exploratory (‘hypothesis-generating’) multivariate analysis of the first wave of COVID-19 nursing home fatalities in Spain, one of the European countries with the highest number of nursing home fatality rate.
We examine the association between nursing home fatalities relative to excess deaths and a number of nursing home characteristics, and especially some specifical proxies of underfunding. The latter include understaffing (staff to resident ratio), nursing home size and occupancy rate. Finally, we consider a number of other controls for the supply of nursing home care.
Our estimates suggest evidence consistent with the hypothesis of underinvestment in nursing home care. More specifically, we find that regions exhibiting lower staff to nursing home places, exhibit a higher nursing home fatality relative to excess deaths. Although our estimates are retrieved from a small sample, they suggest a 0.44pp reduction in the regional nursing home fatalities per excess death for each additional staff per place available in a nursing home in each region.
Our findings suggest that regions that exhibit larger nursing home places, higher occupancy, larger sized nursing homes, and those with lower staff to place ratios exhibit a higher number of fatalities per excess deaths. Consistently, regions having staffed nursing homes exhibit a lower death rate. However, we do not find robust evidence that differences in health and social care coordination explain COVID-19 fatalities, or that other characteristics of nursing homes play a role.
In addition to underfunding, other explanations include the role of weak contingency plans, limiting hospital admissions of nursing home residents into emergency care. These results suggest that although nursing homes can cope with underfunding during normal times, at times of a pandemic underfunding can have fatal consequences. That said, our evidence comes from a small sample and refers to cross-sectional regional data, and hence should be treated with some caution. More research should be carried out to document these effects when data become available, given our analysis does not address some of the other fundamental issues in prediction of mortality, specifically demographic characteristics and comorbidities in the nursing home resident populations.
Appendix 1
Figure A1.
Nursing home deaths as a share of excess deaths and total COVID-19 deaths as of May 16, 2020. Region names are: MAD = Madrid, CAT = Catalonia, CLM = Castilla La Mancha, CLE = Castilla Leon, BC = Basque Country, VAL = Valencian Community, AND = Andalusia, ARA = Aragon, GAL = Galicia, NAV = Navarra, EXT = Extremadura, LR = La Rioja, AST = Asturias, BAL = Balearics, CANT = Cantabria, CAN = Canary Islands, MUR = Murcia, CE = Ceuta and ME = Melilla. Source: Spanish National Network of Epidemiological Monitoring (MoMo)
Figure A2.
Excess mortality and total COVID-19 deaths by region. Region names are: MAD = Madrid, CAT =Catalonia, CLM = Castilla-La Mancha, CLE = Castilla Leon, BC = Basque Country, VAL = Valencian Community, AND = Andalusia, ARA = Aragon, GAL = Galicia, NAV = Navarra, EXT = Extremadura, LR = La Rioja, AST = Asturias, BAL = Balearics, CANT = Cantabria, CAN = Canary Islands, MUR = Murcia, CE = Ceuta and ME = Melilla. Source: Momo and Spanish Ministry of Health.
Notes
These refer to Asturias, Balearics Islands, Canary Islands, Cantabria, Castilla Leon, Catalonia, Community of Madrid and the Basque Country. On the other hand, 5 regions (Aragon, Castilla-La Mancha, Valencian Community, Extremadura and La Rioja) have socio-sanitary plans.
Furthermore, such differences were not be fully explained by differences in the relative investment in health (as a proportion of GDP), but by other public policy preferences (Rhodes et al., 2012).
Previous studies already document a mortality spike to what is normally observed after nursing home admissions (Aneshensel et al., 2000)
https://www.eldiario.es/sociedad/Comunidad-Madrid-Primaria-COVID-19-trasladarse_0_1032397623.html
By staff, we mean any member of staff referring mainly to care workers, but it includes nurses, managers and others, mostly full time, although in some cases such as doctors or cleaners, they might well be employed part time.
Footnotes
Declaration of Conflicting Interests: The author(s) declared no potential conflicts of interest with respect to the research, authorship and/or publication of this article.
Funding: The author(s) received no financial support for the research, authorship and/or publication of this article.
ORCID iD
Joan Costa-Font https://orcid.org/0000-0001-7174-7919
References
- Aneshensel C. S., Pearlin L. I., Levy-Storms L., Schuler R. H. (2000). The transition from home to nursing home mortality among people with dementia. The Journals of Gerontology Series B: Psychological Sciences and Social Sciences, 55(3), S152-S162. [DOI] [PubMed] [Google Scholar]
- Costa-Font J. (2017). ““Institutionalization aversion” and the willingness to pay for home health care”. Journal of Housing Economics, 38, 62-69. [Google Scholar]
- Costa-Font J., Mascarilla-Miró O., Elvira D. (2009). Ageing in place? An examination of elderly people housing preferences in Spain. Urban Studies, 46(2), 295-316. [Google Scholar]
- Costa-Font J., Jiménez-Martínez S., Vilaplana-Prieto C. (2016. a). Thinking of incentivizing care? The effect of demand subsidies on informal caregiving and intergenerational transfers. Barcelona GSE Working Paper, 929. Barcelona Graduate School of Economics. [Google Scholar]
- Costa-Font J., Karlsson M., Øien H. (2016. b). Careful in the crisis? Determinants of older people's informal care receipt in crisis-struck European countries. Health Economics, 25, 25-42. [DOI] [PubMed] [Google Scholar]
- Costa-Font J., Jimenez-Martin S., Vilaplana C. (2018). Does long-term care subsidization reduce hospital admissions and utilization? Journal of health economics, 58, 43-66. [DOI] [PubMed] [Google Scholar]
- Lee D. T. F., Woo J., McKenzie A. (2003). “A review of older people’s experiences with residential care placement”. Journal of Advanced Nursing, 37(1), 9-27. [DOI] [PubMed] [Google Scholar]
- Médecins Sans Frontières . (2020). Too little, too late the unacceptable neglect of the elderly in care homes during the COVID-19 pandemic in Spain. file:///Users/costafon/Downloads/executive-summary-of-the-msf-report-'too-little,-too-late_-the-unacceptable-neglect-of-the-elderly-in-care-homes-during-the-COVID-19-pandemic-in-spain'.pdf 20th August 2020.
- Ministry of Health (2020. a). Crononavirus. Television espanyola, November 15, 2020. https://www.rtve.es/noticias/20201115/radiografia-del-coronavirus-residencias-ancianos-espana/2011609.shtml.
- Ministry of Health (2020. b). Data of total COVID-deaths in Spain. https://www.mscbs.gob.es/profesionales/saludPublica/ccayes/alertasActual/nCov-China/situacionActual.htm.
- Montecino-Rodriguez E, Berent-Maoz B, Dorshkind K. (2013). “Causes, consequences, and reversal of immune system aging”. The Journal of Clinical Investigation, 123(3), 958-965. [DOI] [PMC free article] [PubMed] [Google Scholar]
- OECD Health Statistics . (2019). Long term care (LTC) as % of GDP OECD countries. https://www.oecd.org/els/health-systems/long-term-care.htm.
- Rhodes A, Ferdinande P., Flaatten H., Guidet B., Metnitz P. G., Moreno R. P. (2012). The variability of critical care bed numbers in Europe. Intensive Care Medicine, 38(10), 1647-1653. [DOI] [PubMed] [Google Scholar]
- Robbins I., Gordon A., Dyas J., Logan P., Gladman J. (2013). Explaining the barriers to and tensions in delivering effective healthcare in UK care homes: A qualitative study. BMJ Open, 3(7), e003178. doi: 10.1136/bmjopen-2013-003178. [DOI] [PMC free article] [PubMed] [Google Scholar]
- Spanish National. Network for Epidemiological Monitoring . (2020. a). https://eng.isciii.es/eng.isciii.es/QueHacemos/Servicios/VigilanciaSaludPublicaRENAVE/Paginas/default.html.
- Spanish National Network for Epidemiological Monitoring (MoMo) . (2020. b). Data of mortality from March to May 16, 2019. https://www.isciii.es/QueHacemos/Servicios/VigilanciaSalud-PublicaRENAVE/EnfermedadesTransmisibles/MoMo/Paginas/MoMo.aspx and 2020. https://momo.isciii.es/public/momo/dashboard/momo_dashboard.html#datos.
- Venkatapuram S., Ehni H.-J., Saxena A. (2017). “Equity and healthy ageing”. Bulletin of the World Health Organization, 95(11), 791. [DOI] [PMC free article] [PubMed] [Google Scholar]
- Werner R. M., Hoffman A. K., Coe N. B. (2020). Long-term care policy after COVID-19—solving the nursing home crisis. The New England Journal of Medicine, 383, 903-905. [DOI] [PubMed] [Google Scholar]


