

Abstract
Coronavirus19 is caused due to infection in the respiratory system. It is the type of RNA virus that might infect animal and human species. In the severe stage, it causes pneumonia in human beings. In this research, hand‐crafted and deep microscopic features are used to classify lung infection. The proposed work consists of two phases; in phase I, infected lung region is segmented using proposed U‐Net deep learning model. The hand‐crafted features are extracted such as histogram orientation gradient (HOG), noise to the harmonic ratio (NHr), and segmentation based fractal texture analysis (SFTA) from the segmented image, and optimum features are selected from each feature vector using entropy. In phase II, local binary patterns (LBPs), speeded up robust feature (Surf), and deep learning features are extracted using a pretrained network such as inceptionv3, ResNet101 from the input CT images, and select optimum features based on entropy. Finally, the optimum selected features using entropy are fused in two ways, (i) The hand‐crafted features (HOG, NHr, SFTA, LBP, SURF) are horizontally concatenated/fused (ii) The hand‐crafted features (HOG, NHr, SFTA, LBP, SURF) are combined/fused with deep features. The fused optimum features vector is passed to the ensemble models (Boosted tree, bagged tree, and RUSBoosted tree) in two ways for the COVID19 classification, (i) classification using fused hand‐crafted features (ii) classification using fusion of hand‐crafted features and deep features. The proposed methodology is tested /evaluated on three benchmark datasets. Two datasets employed for experiments and results show that hand‐crafted & deep microscopic feature's fusion provide better results compared to only hand‐crafted fused features.
Keywords: ensemble methods, entropy, fusion, hand crafted features, healthcare, public health, U‐Net
The affected lung region is segmented using a modified U‐Net deep learning model. The extracted hand‐crafted deep features and selected optimized features using entropy are fused serially and supplied to the ensemble learning. COVID19 detection process.
1. INTRODUCTION
The World Health organization has named Coronavirus19 (COVID‐19) a global pandemic disease (WHO).The severity of this disease may disrupt the respiratory system (Holshue et al., 2020). COVID‐19 is also recognized as a deadly disease having a fatality rate of 2%. Massive damage of alveolar and the respiratory system's failure are the main causes of death in severe circumstances of this disease (Saba, Abunadi, Shahzad, & Khan, 2021). RT‐ PCR is the laboratory technique for the diagnosis of this disorder. For early detection of this disease, RT‐PCR is not effective because its testing process is time‐consuming which may cause a delay in the proper treatment of the patients (Fang et al., 2020; Khan et al., 2021). The effective imaging protocol is Computed Tomography (CT) which is noninvasive (Huang et al., 2020). This is an essential diagnostic tool for early screening; however, there is difficulty in differentiating the COVID‐19 features from other pneumonia types. It is beneficial to diagnose and quarantine the patient and to control the spreading of the disease. The task of object detection and classification of images is the main concern in deep learning. Artificial intelligence is being applied on data to recognize patterns and their analysis (Rehman, Saba, et al., 2021; Rehman, Sabad, et al., 2021; Wang, Hu, et al., 2020). Therefore, it can be more beneficial for COVID‐19 detection and classification. Different AI methods are utilized for COVID‐19 detection. However, there is still a gap in this domain because small lesion regions are detected as a normal region and existing algorithms failed when lesion appears at the lungs region's border (Haimed, Saba, Albasha, Rehman, & Kolivand, 2021; Saba, 2021). Optimal features extraction and selection is another challenge. At the same time noisy features also reduce the overall model accuracy(Acharya et al., 2019; Albahri et al., 2020a, 2020b). Therefore, a new approach focused on semantic segmentation and features analysis based on the hand‐crafted and deep fusion features is discussed in this study. The core contributed steps of the proposed method include:
The affected lung region is segmented using a modified U‐Net deep learning model.
Extracted hand‐crafted deep features and selected optimized features using entropy are fused serially and supplied to the ensemble learning.
2. RELATED WORK
Artificial intelligence (AI) approaches are commonly utilized in biomedical research (Kang et al., 2020; Saba, 2019; Saba, Bokhari, Sharif, Yasmin, & Raza, 2018; Salman, Ahmed, Khan, Raza, & Latif, 2017; Wang, Muhammad, et al., 2020; Wang, Sun, et al., 2020; Wang, Tang, et al., 2019; Wang, Zhang, et al., 2019). AI methods are used in different applications that is, object detection, segmentation, and classification (Deepa, Devi,, & Technology, 2011). COVID19 patients are suffered from pneumonia due to the RNA virus that infects the lung region(Lai, Shih, Ko, Tang, & Hsueh, 2020). Deep learning is widely used to detect lung‐infected regions (Shan et al., 2020). Deep learning models are being used in three different ways such as pretrained model as fine‐tuning, without fine‐tuning, and trained from scratch. In the pretrained models, inceptionv3, VGG16, squeeze Net, Mobilenetv2, and ResNet‐50 are widely used for pneumonia detection (Kassani, Kassasni, Wesolowski, Schneider, & Deters, 2020). In the literature, a massive amount of work is done for COVID‐19 detection; however, still, there is a need for an optimized features extraction/selection approach which helps for accurate detection of the COVID‐19 (Albahri et al., 2020a, 2020b). Therefore, in this research hand‐crafted and deep features are extracted and fused for better classification of COVID‐19. The existing literature on COVID‐19 are summarized in Table 1.
TABLE 1.
Overview of the most recent COVID‐19 work
3. PROPOSED MODEL FOR DETECTION AND CLASSIFICATION OF CORONAVIRUS19
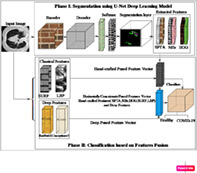
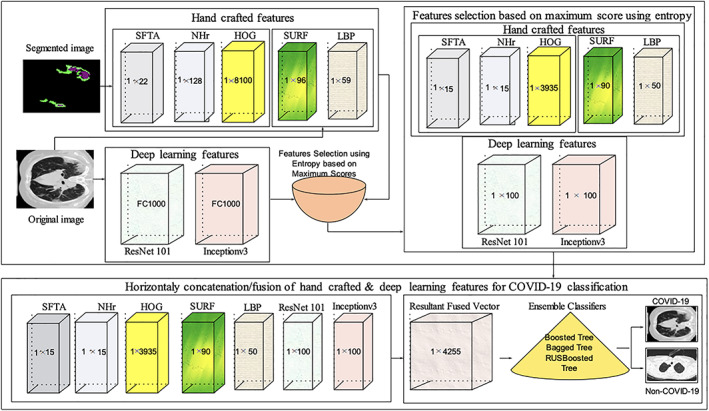
In this retrospective study, U‐Net based semantic deep learning model is proposed for lung region segmentation, which is infected by an RNA virus. Later, extracted hand‐crafted and deep features from the original CT images and segmented images. The redundant features affect the overall model accuracy; therefore, discriminant features are selected using entropy. The selected features are serially concatenated/fused for accurate classification of the COVID19. The proposed model architecture is presented in Figure 1.
FIGURE 1.
Proposed model for segmentation and classification of healthy/COVID‐19 images
3.1. Segmentation of the infected lung region using U‐Net deep convolutional neural network
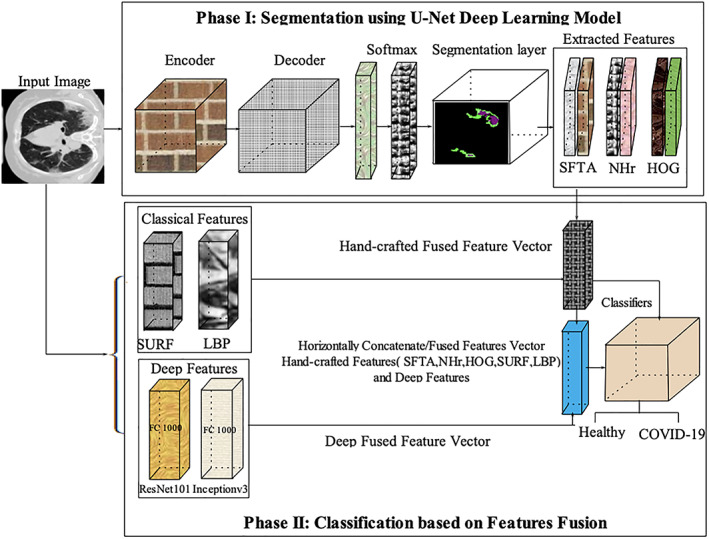
The CT images of size 224 × 224 × 1 are passed to the U‐Net (He, Zhang, Ren, & Sun, 2015) semantic segmentation deep learning model. The proposed model contains 46 layers in which 01 input, 15 convolutional (encoder), 17 ReLU, 03 max‐pooling, 02 drop‐out, 04, 01 softmax, and classification layers. The learning patterns of the last encoder and decoder section layers are visually presented in Figure 2.
FIGURE 2.
U‐Net model for COVID‐19 segmentation
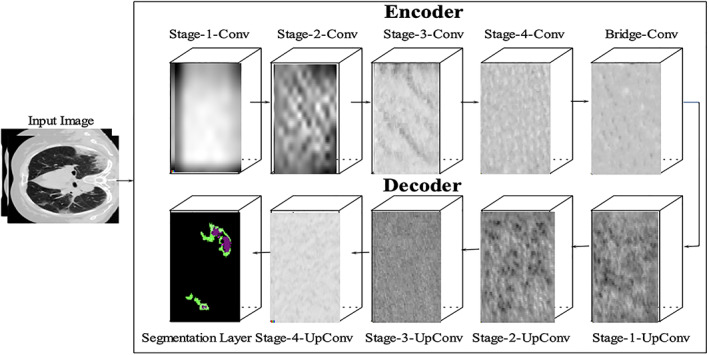
The bridge contains two sets of convolutional and ReLU layers. The encoder‐depth specifies the depth of encoder and decoder sub‐networks. Thus in this work, encoder depth is set as 3. The encoder section contains four stages, in which two sets of the convolutional and ReLU layers. Each stage contains one Maxpooling layer to perform down‐sampling and a 50% dropout layer is also used in the fourth stage to prevent the over‐fitting problem. The decoder section also contains four stages, in which each stage contains two sets of the convolutional, ReLU and transpose convolutional layer to perform up‐sampling. The final convolutional layer was followed by the softmax and segmentation layers which performed semantic segmentation. The model is trained from scratch and the selected configuration parameters of the U‐Net model are mentioned in Table 2. At the same time, the segmented images with ground truth are shown in Figure 3.
TABLE 2.
U‐Net configuration parameters
| Input size | Encoder depth | MaxEpoch | Learning rate |
|---|---|---|---|
| 224 × 224 × 1 | 3 | 40 | 0.001 |
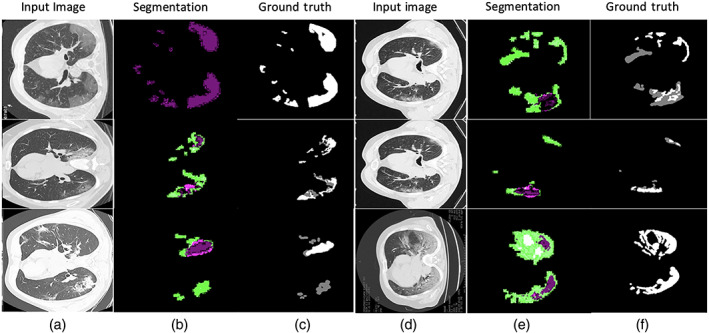
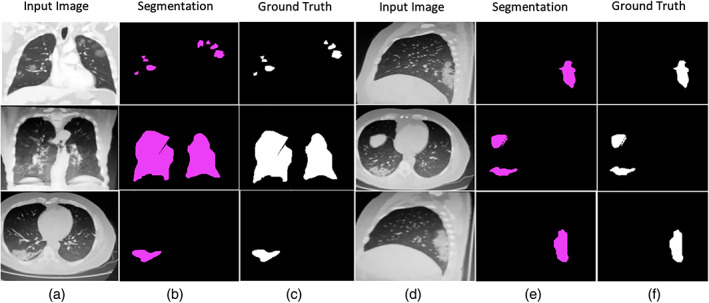
FIGURE 3.
Segmentation results with ground truth (a) input images (b) segmentation by proposed method (c) manually ground truth images
3.2. Features extraction
In the proposed method, hand‐crafted and deep features are extracted for COVID‐19 classification.
3.2.1. Hand crafted features extraction
The five hand‐crafted features such as noise to the harmonic ratio (NHr), histogram orientation gradient (HOG), local binary patterns (LBPs), SFTA, and speeded up robust features (SURF) are extracted. The best features are selected based on the maximum scores using entropy and fused serially.
3.2.2. Noise to harmonic ratio features
The NHr (Kim, Moreau, & Sikora, 2006) features is extracted from the segmented region. NHr is a strong feature to identify the lesion region's variation because lung lesions have variable shape and size. The NHr features are represented mathematically as follows:
| (1) |
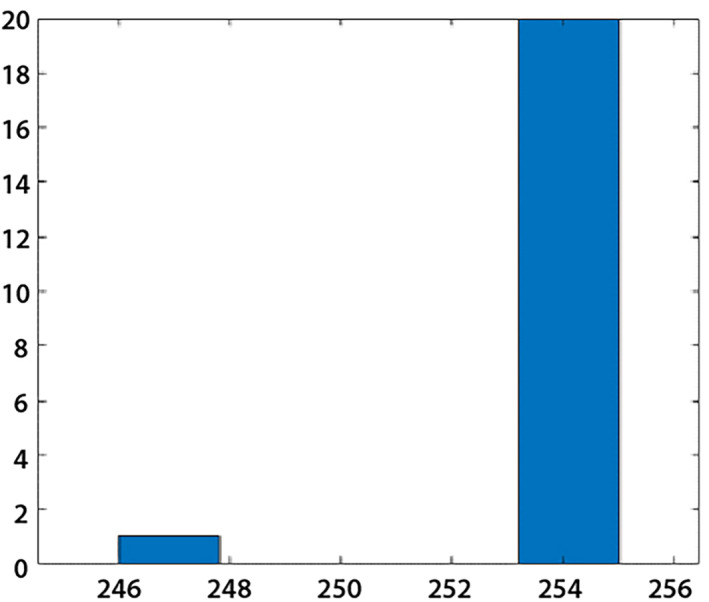
where N (number of sample), M represents the maximum lag. The length of NHr features vector is 1 × 128 and graphically illustrated in Figure 4.
FIGURE 4.
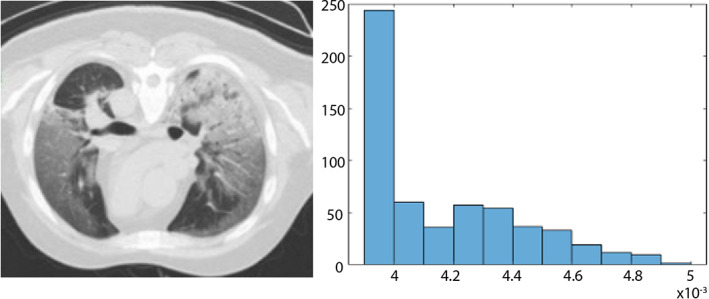
Noise to the harmonic ratio (NHr) features (a) input image (b) NHr
3.2.3. Speeded up robust features
Extracted speeded up robust features (SURF) features in terms of points, orientation, and scale from the input CT images having 1 × 96 length that is used for the detection of interest points as illustrated in Figure 5.
FIGURE 5.
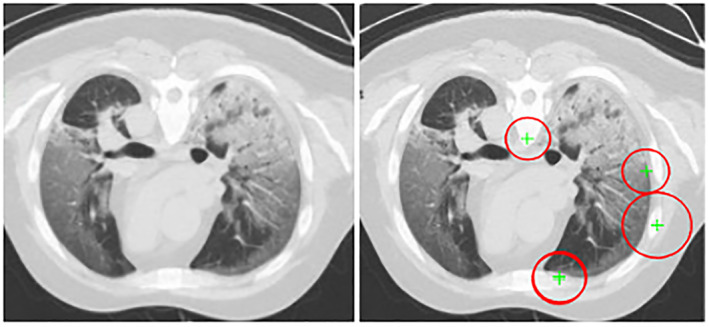
SURF features (a) original image (b) SURF features
3.2.4. Histogram orientation gradient
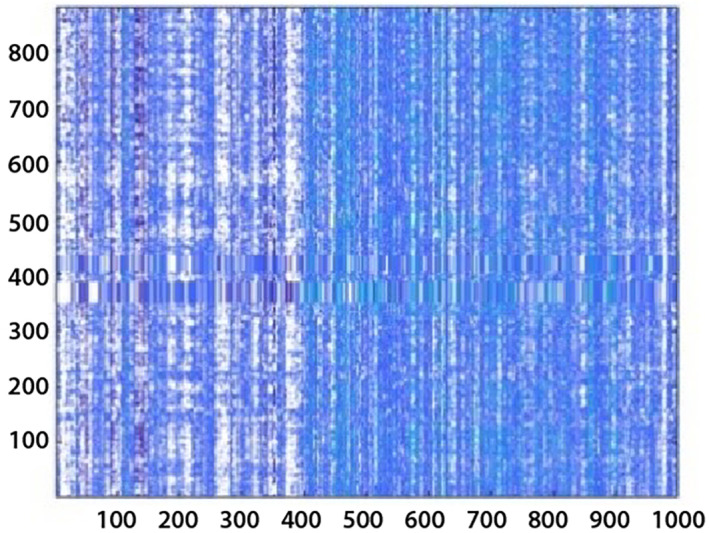
The lesion regions have an irregular shape. Therefore, HOG (shape‐based) features are extracted from the segmented lesion region having a vector length is 1 × 8,100 and are shown in Figure 6.
FIGURE 6.
Histogram orientation gradient (HOG) features (a) original image (b) HOG
3.2.5. Local binary pattern
The lung CT images having variant texture; therefore, LBP features are extracted from gray‐level images. The feature vector length is 1 × 59 and graphically shown in Figure 7.
FIGURE 7.
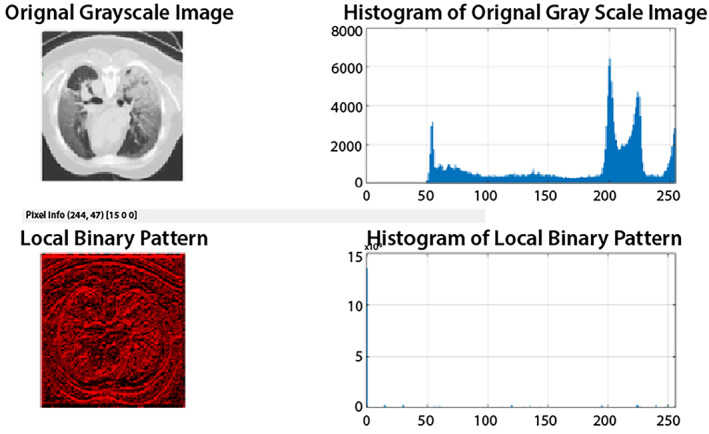
Local binary patterns (LBP) of the original image
3.2.6. SFTA
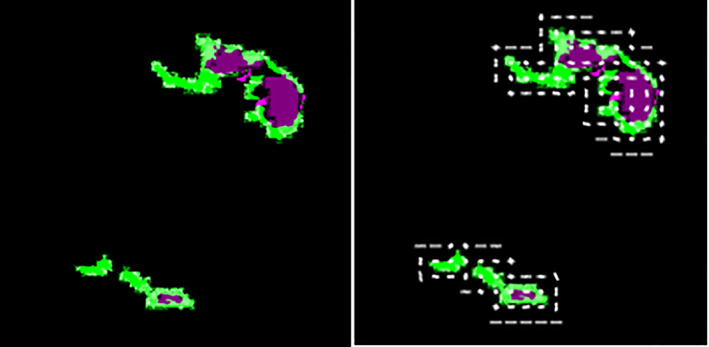
SFTA features are extracted from the segmented lesion region, which creates its own segment pattern and helps classify. The length of the feature vector is 1 × 22 and graphically shown in Figure 8.
FIGURE 8.
SFTA features
3.2.7. DCNN features
Extracted deep features using pretrained deep learning models that is, ResNet 101 and inceptionv3. The ResNet101 contains 347 layers in which 01 input, 107 convolutional, 99 ReLU, 103 batch‐normalization, 01 maxpooling, 32 addition layers, 01 pool average global layer, fully connected, 01 softmax, & classification layer. While inceptionv3 contains 315 layers in which input, 96 convolutional, 94 batch‐normalization, 94 ReLU, 04 maxpooling, 09 average pooling layers, 14 depth‐concatenations, fully‐connected, classification& softmax layer. The fully connected layer named as FC1000 of Resnet101 and the prediction layer of inceptionv3 with 1 × 1000 features vector length is selected for classification and graphically plot in Figure 9.
FIGURE 9.
DCNN features
3.3. Features selection and fusion
The features selection approach is presented using entropy as mentioned in Equation (2). The hand‐crafted and deep features are extracted from input images. The complete process of the feature's extraction, selection, and fusion is shown in Figure 10.
FIGURE 10.
Features extraction, selection, and fusion process for COVID‐19 classification
The length of extracted features is such as fNHr1 × 128, fHOG1 × 8,100, fSFTA1 × 22, fSURF1 × 96, fResNet1011 × 1,000, and fInceptionv31 × 1,000. The best features are selected based on the maximum score using entropy.
| (2) |
H e denotes entropy, N represents the number of features, and n shows features at the same score level.
The features are selected based on maximum score such as, 15 NHr features out of 128, 3,935 HOG features out of 8,100, 15 SFTA features out of 22, 90 SURF features out of 96, and 100 deep features out of 1,000 (ResNet101 and Inceptionv3). The selected score‐based features vectors are denoted as 1 × a, 1 × b, 1 × c, 1 × d, 1 × e, 1 × f. The selected features are concatenated/fused horizontally and denoted as FV1 × z .
Where,
| (3) |
and
The fused features vector length is 1 × 4256 in which the last column represents the class labels. The final features vectors with class labels are passed to the ensemble classifiers.
3.4. Classification
The vector of resultant fused feature is fed to classifiers. The ensemble classifiers are used with three kernels such as a boosted tree (Freund, 2009), bagged tree (Breiman, 1996), and RUSBoosted tree (Seiffert, Khoshgoftaar, Van Hulse, & Napolitano, 2008). The ensemble classifiers are built by combining the week decision tree classifiers to create a powerful prediction model. Brief overview of the selected classifiers with the learning parameters is given in Table 3.
TABLE 3.
Brief overview of ensemble classifiers
| Model type | Ensemble approach | Learner | Maximum splits | Total learners | Rate of the learning | Training time |
|---|---|---|---|---|---|---|
| Boosted Tree | AdaBoost | Decision tree | 20 | 30 | 0.1 | 380.3 s |
| Bagged Tree | Bag | 877 | 64.689 s | |||
| RUSBoosted Tree | RUSBoost | 20 | 189.98 s |
4. BENCHMARK DATASETS
The proposed research is evaluated using three benchmark datasets. Dataset I, COVID‐19 segmentation data consists of the 40 patients, in which 100 slices of CT images with ground truth in NII format. Besides, this dataset out of 829 slices includes 373 positive cases (COVID‐19). Dataset II, consists of the Chinese Hospital CT imaging data of 216 patients. The patient's data contains 316 positive and 700 negative slices (Zhao, Zhang, He, & Xie, 2020). Dataset III includes 30 patients of POF Hospital, in which 2000 positive slices are included out of 4,500. The classified radiologists also created the ground truth. The description of training and testing images is given in Table 4.
TABLE 4.
Training and testing data on benchmark datasets
| Dataset | Total images | Training and testing images | Classification |
|---|---|---|---|
| Dataset I | 829 | 456 negative images and 373 positive images | 10 fold cross validation (means divide whole data into 10 sets, one randomly selected set is utilized for testing and remaining nine for training. Same methodology is repeated in all 10 iterations. |
| Dataset II | 1,016 | 316 positive and 700 negative slices |
4.1. Experimentation
The proposed model is implemented on MATLAB core i7 CPU with Nvidia Graphic card. Two experiments are performed to test the proposed method performance. In Experiment 1, pixel‐based segmentation results are evaluated with ground truth. In Experiment 2, classifications are performed using hand‐crafted fused features and hand‐crafted and deep features fusion. In this experiment, training/testing data is divided on cross‐validation of 10‐fold. The performance of the proposed approach is assessed on various types of performance measurements described in Table 5.
TABLE 5.
Performance measurements
| Measures | Formulas | |
|---|---|---|
| IoU | here ϑ denotes true positive, false positive (ρ), and false negative (δ) | |
| Accuracy | ∃ represents the true negative | |
| Sensitivity |
|
|
| Specificity |
|
4.2. Experiment #1 (segmentation of lung region affected by COVID19)
In this experiment, segmented lesion region is evaluated with ground truth. IoU is mathematically expressed as:
| (4) |
The segmentation model is trained on selected parameters, which are finalized after the extensive experiments alluded in Table 6.
TABLE 6.
Experiment for the selection of optimal parameters
| Encoder depth | Optimizer | Epochs | Learning rate | Training accuracy |
|---|---|---|---|---|
| 2 | Adam | 30 | 0.002 | 0.96 |
| 3 | Sgdm | 40 | 0.001 | 0.98 |
| 3 | RmsProp | 100 | 0.001 | 0.95 |
Note: To prominant the selected parameters used and the results acheived from the proposed method are bold.
Table 6, shows learning parameters of the proposed segmentation model where different values are selected for training of model and to analayze the accuracy. The different kinds of optimizers such as sgdm, adam, and rmsProp are employed with 40, 30, and 100 epochs, respectively. We observed that learning rate is 0.001, 40 epochs, and encoder depth 3 with sgdm optimizer provide greater training accuracy than other optimizers. These parameters are reflected in italic highlighted font and utilized for further experiments. The quantitative segmentation results are reflected in the Table 7.
TABLE 7.
Segmentation outcomes on benchmark datasets
| Dataset | Global ACC | Mean ACC | Mean IoU | Weighted IoU | BF mean score |
|---|---|---|---|---|---|
| COVID‐19 segmentation | 0.98 | 0.88 | 0.87 | 0.96 | 0.89 |
| POF hospital | 1.00 | 1.00 | 1.00 | 1.00 | 1.00 |
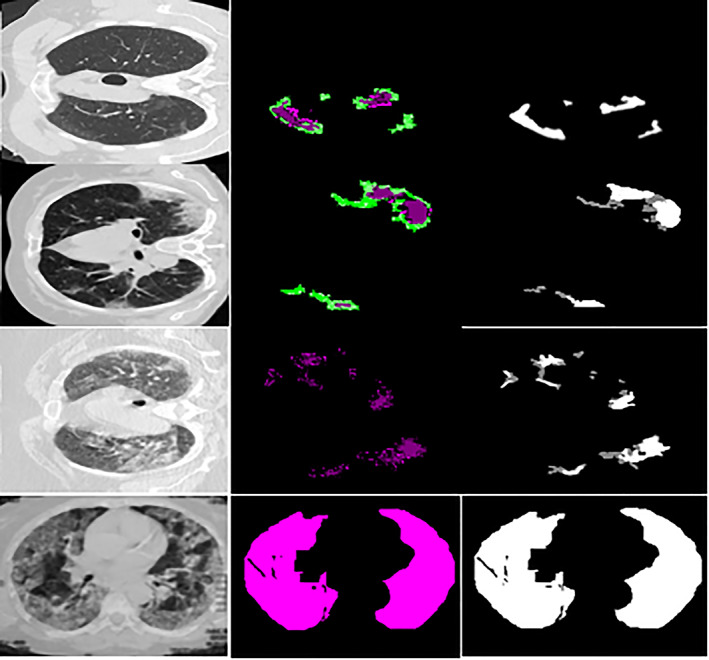
Table 3 shows that the modified U‐Net segmentation model achieves 0.96 IoU on the COVID‐19 segmentation dataset and 1.00 IoU on the POF Hospital dataset. The segmentation results of the lung affected region with ground truth are shown in Figures 11 and 12.
FIGURE 11.
Segmentation outcome on COVID‐19 segmentation dataset
FIGURE 12.
Segmentation outcome on POF Hospital dataset
4.3. Experiment #2 (classification based on hand‐crafted fused features)
The classification experiment is performed by extraction of the different hand‐crafted features such as NHr, SFTA (Costa, Humpire‐Mamani, & Traina, 2012), HOG(Dalal & Triggs, 2005), LBP (Ojala, Pietikainen, & Maenpaa, 2002), and SURF (Bay, Ess, Tuytelaars, & Van Gool, 2008), and at the same time informative features are selected using entropy and fused serially (1 × 4055) vector length. That is provided to the ensemble method with three powerful learning models such as boosted, bagged, and the Rusboosted tree. The ensemble model prediction is graphically presented in the Figure 13.
FIGURE 13.
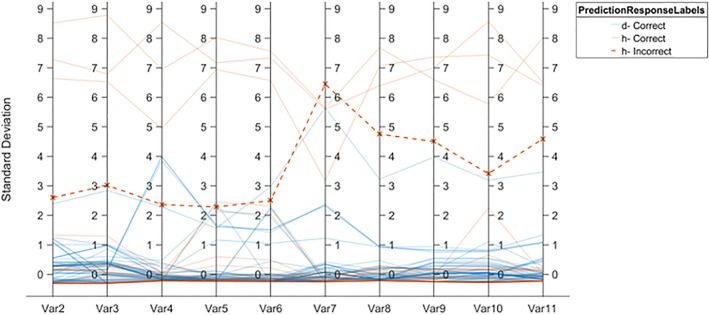
Ensemble prediction model based on hand crafted features vector
The quantitative classification outcomes are presented in Table 8, 9, 10.
TABLE 8.
COVID‐19 classification on COVID‐19 segmentation dataset
| Classification model | Sensitivity | Specificity | Accuracy |
|---|---|---|---|
| Boosted tree | 0.90 | 0.91 | 86.3% |
| Bagged tree | 0.98 | 0.97 | 96.8% |
| RUSBoosted tree | 1.0 | 0.97 | 98.17% |
TABLE 9.
COVID‐19 classification on Chinese hospital dataset
| Classification model | Sensitivity | Specificity | Accuracy |
|---|---|---|---|
| Boosted Tree | 0.97 | 0.92 | 92.03% |
| Bagged Tree | 0.90 | 0.70 | 89.52% |
| RUSBoosted Tree | 0.99 | 1.0 | 98.97% |
TABLE 10.
COVID‐19 classification on POF hospital dataset
| Classification model | Sensitivity | Specificity | Accuracy |
|---|---|---|---|
| Boosted Tree | 1.0 | 1.0 | 99.77% |
| Bagged Tree | 0.96 | 0.99 | 96.06% |
| RUSBoosted Tree | 0.99 | 0.93 | 93.85% |
The results in Tables 8, 9, 10 shows that RUSBoosted tree ensemble model provided better results in term of ACC, such as 98.17% on COVID‐19 segmentation dataset and 98.97% on Chinese Hospital dataset. At the same time, Boosted Tree ensemble model provides the highest accuracy on the POF hospital dataset.
4.4. Experiment 2.1 horizontally concatenation of the hand crafted and deep convolutional neural network
Extracted deep features are using Deep Convolutional Neural Network (DCNN) such as ResNET101(He, Zhang, Ren, & Sun, 2016) and Inception v3(Szegedy, Vanhoucke, Ioffe, Shlens, & Wojna, 2016) where length of the deep extracted features vector is 1 × 1,000. One hundred active features are selected from each feature vector using entropy and selected deep features. They are serially fused having a vector length 1 × 200 and further fused with hand‐crafted features vector length of 1 × 4,055. The length of final fused features is 1 × 4,255 which is passed to the ensemble learning classifiers for classification. The results with class labels are presented in Figure 14.
FIGURE 14.
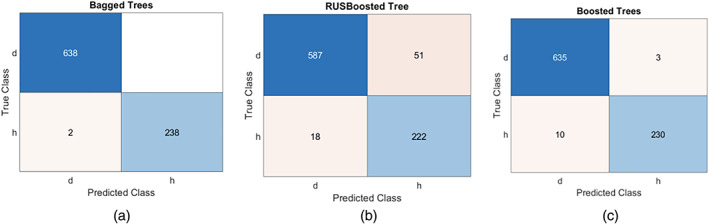
Confusion matrix using ensemble methods (a) bagged tree, (b) RUSBoosted tree, (c) Boosted tree
In Figure 14, d denotes the disease class and h represents the healthy. The model prediction is performed using the combination of classical and deep features as illustrated in Figure 15.
FIGURE 15.
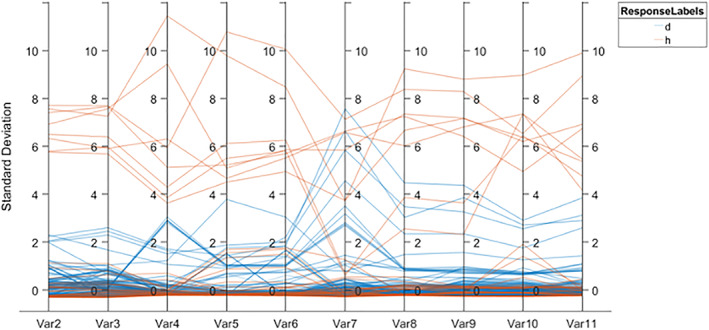
An ensemble prediction model based on hand‐crafted and deep features fusion
The empirical results are provided in Tables 11, 12, 13.
TABLE 11.
COVID‐19 classification on COVID‐19 segmentation dataset
| Classification model | Sensitivity | Specificity | Accuracy |
|---|---|---|---|
| Boosted Tree | 0.99 | 1.0 | 99.09% |
| Bagged Tree | 1.00 | 1.00 | 100% |
| RUSBoosted Tree | 0.98 | 0.97 | 96.8% |
TABLE 12.
COVID‐19 classification on Chinese hospital dataset
| Classification model | Sensitivity | Specificity | Accuracy |
|---|---|---|---|
| Boosted Tree | 0.98 | 1.0 | 98.52% |
| Bagged Tree | 0.97 | 0.92 | 92.14% |
| RUSBoosted Tree | 0.89 | 0.97 | 88.61% |
TABLE 13.
COVID‐19 classification on POF hospital dataset
| Classification model | Sensitivity | Specificity | Accuracy |
|---|---|---|---|
| Boosted Tree | 0.97 | 1.0 | 97.72% |
| Bagged Tree | 0.91 | 0.96 | 89.73% |
| RUSBoosted Tree | 0.96 | 0.92 | 91.25% |
The results in Tables 11, 12, 13 show that the ensemble boosted tree, achieved 99.09% ACC on the COVID‐19 segmentation dataset, 98.52% ACC on the Chinese Hospital dataset, and 97.72% ACC on the POF Hospital dataset. While ensemble bagged tree obtained 100% ACC on segmentation of COVID‐19 dataset. The ratio among the AUC and ROC is also plotted in Figure 16.
FIGURE 16.
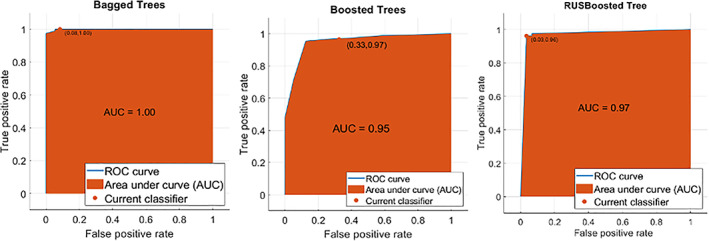
AUC across ROC of ensemble methods (a) Bagged tree, (b) Boosted tree, (c) RUSBoosted tree
In Figure 16, the maximum achieved AUC is 1.00 using the bagged tree ensemble method, 0.95 AUC on the Boosted tree ensemble method, where 0.97 AUC on the RUSBoosted tree ensemble. The classification results are analyzed by ensembling different features such as texture, shape, NHr, and deep features. The findings of the proposed procedure are contrasted with the recent studies published alluded to in Table 14.
TABLE 14.
Comparison of the proposed method with existing works
| References | Datasets | Method | Results accuracy% |
|---|---|---|---|
| Yang et al. (2020) | UCSD‐AI4H/COVID‐CT | ResNet‐50 | 0.89 |
| Burgos‐Artizzu (2020) | Inception | 83.5 ± 2.0 | |
| Z. Wang, Liu, and Dou (2020) | COVID‐Net | 78.69 ± 1.54 | |
| Ewen and Khan (2020) | DenseNet169 | 0.8621 ± 0.0474 | |
| Proposed method | Fusion of hand crafted and deep features | 0.9852 |
The proposed framework is contrasted with four latest frameworks that is, (Burgos‐Artizzu, 2020; Ewen & Khan, 2020; Wang, Liu, et al., 2020; Yang et al., 2020). The existing published methods classified the COVID‐19 CT images using different pretrained CNN models, these methods achieved a maximum of 0.89 accuracy. However, this research provides a unique framework based on the deeper analysis of the deep and hand crafted features with more prominent features selection using entropy. The proposed approach provides a significant improvement of 0.9852 accuracy for the classification of COVID‐10 lung CT images. This approach might be utilized in medical domain to analyze the more informative features for disease classification.
In this study, after comprehensive features analysis, it is observed that serially fusion of the hand‐crafted and deep features are provided a good effect on the model accuracy.
5. CONCLUSION
COVID‐19 segmentation and classification are an intricate task at an early stage. The accurate COVID‐19 segmentation is a crucial task because lesion regions appear at the boundaries that are difficult to segment using classical segmentation methods. Therefore, a deep learning model can be used to accurately segmentation the lesion region that appears at the borders. In this research, the modified U‐Net model is employed for segmentation. The proposed segmentation model achieved 0.98 global ACC, 0.96 weighted IoU on the COVID‐19 segmentation dataset, and 0.98 global ACC, 1.00 IoU on the POF Hospital dataset. The experimental discussion concludes that the fusion of the hand‐crafted and deep features provided competent results as compared to the fusion of hand‐crafted features only. The models achieved ACC of 99.09% on the Boosted Tree ensemble, 100% on the Bagged tree ensemble, and 96.8% RUSBoosted tree ensemble model.
CONFLICT OF INTEREST
All authors declared that there is no conflict of interest.
AUTHOR CONTRIBUTIONS
All authors are contributed equally in this manuscript.
ACKNOWLEDGMENT
No specific funding received for this research.
Amin, J. , Anjum, M. A. , Sharif, M. , Saba, T. , & Tariq, U. (2021). An intelligence design for detection and classification of COVID19 using fusion of classical and convolutional neural network and improved microscopic features selection approach. Microscopy Research and Technique, 84(10), 2254–2267. 10.1002/jemt.23779
Review Editor: Alberto Diaspro
DATA AVAILABILITY STATEMENT
The data that support the findings of this study are openly available in (covid‐CT‐dataset) at (https://covid‐19.conacyt.mx/jspui/handle/1000/4157).
REFERENCES
- Acharya, U. R. , Fernandes, S. L. , WeiKoh, J. E. , Ciaccio, E. J. , Fabell, M. K. M. , Tanik, U. J. , … Yeong, C. H. (2019). Automated detection of Alzheimer's disease using brain MRI images–a study with various feature extraction techniques. Journal of Medical Systems, 43(9), 302. [DOI] [PubMed] [Google Scholar]
- Albahri, O. , Zaidan, A. , Albahri, A. , Zaidan, B. , Abdulkareem, K. H. , Al‐Qaysi, Z. , … Rashid, N. A. (2020a). Systematic review of artificial intelligence techniques in the detection and classification of COVID‐19 medical images in terms of evaluation and benchmarking: Taxonomy analysis, challenges, future solutions and methodological aspects. Journal of Infection and Public Health, 13(10), 1381–1396. [DOI] [PMC free article] [PubMed] [Google Scholar]
- Albahri, O. , Zaidan, A. , Albahri, A. , Zaidan, B. , Abdulkareem, K. H. , Al‐Qaysi, Z. , … Health, P. (2020b). Systematic review of artificial intelligence techniques in the detection and classification of COVID‐19 medical images in terms of evaluation and benchmarking: Taxonomy analysis, challenges, future solutions and methodological aspects, 13(10), 1381–1396. [DOI] [PMC free article] [PubMed] [Google Scholar]
- Bay, H. , Ess, A. , Tuytelaars, T. , & Van Gool, L. (2008). Speeded‐up robust features (SURF). Computer Vision and Image Understanding, 110(3), 346–359. [Google Scholar]
- Breiman, L. (1996). Bagging predictors. Machine Learning, 24(2), 123–140. [Google Scholar]
- Burgos‐Artizzu, X. P. (2020). Computer‐aided covid‐19 patient screening using chest images (X‐Ray and CT scans). medRxiv .
- Costa, A. F. , Humpire‐Mamani, G. , & Traina, A. J. M. (2012). An Efficient Algorithm for Fractal Analysis of Textures. Paper Presented at the 2012 25th SIBGRAPI Conference on Graphics, Patterns and Images.
- Dalal, N. , & Triggs, B. (2005). Histograms of oriented gradients for human detection. Paper Presented at the 2005 IEEE Computer Society Conference on Computer Vision and Pattern Recognition (CVPR'05).
- Deepa, S. , Devi, B. A. , & Technology . (2011). A survey on artificial intelligence approaches for medical image classification, 4(11), 1583–1595. [Google Scholar]
- Ewen, N. , & Khan, N. (2020). Targeted Self Supervision for Classification on a Small COVID‐19 CT Scan Dataset. . arXiv preprint arXiv:2011.10188 .
- Fang, Y. , Zhang, H. , Xie, J. , Lin, M. , Ying, L. , Pang, P. , & Ji, W. J. R. (2020). Sensitivity of chest CT for COVID‐19 comparison to RT‐PCR, 296(2), 1–3. [DOI] [PMC free article] [PubMed] [Google Scholar]
- Freund, Y. (2009). A more robust boosting algorithm, 1–8.
- Haimed, A. M. A. , Saba, T. , Albasha, A. , Rehman, A. , & Kolivand, M. (2021). Viral reverse engineering using artificial intelligence and big data COVID‐19 infection with long short‐term memory (LSTM). Environmental Technology & Innovation, 12, 1–20. 10.1016/j.eti.2021.101531. [DOI] [PMC free article] [PubMed] [Google Scholar]
- He, K. , Zhang, X. , Ren, S. , & Sun, J. (2015). Delving Deep Into Rectifiers: Surpassing Human‐level Performance on Imagenet Classification. Paper presented at the Proceedings of the IEEE International Conference on Computer Vision.
- He, K. , Zhang, X. , Ren, S. , & Sun, J. (2016). Deep Residual Learning for Image Recognition. Paper Presented at the Proceedings of the IEEE Conference on Computer Vision and Pattern Recognition.
- Holshue, M. L. , DeBolt, C. , Lindquist, S. , Lofy, K. H. , Wiesman, J. , Bruce, H. , … Tural, A. (2020). First case of 2019 novel coronavirus in the United States, 38(10), 1–8. [DOI] [PMC free article] [PubMed] [Google Scholar]
- Horry, M. J. , Chakraborty, S. , Paul, M. , Ulhaq, A. , Pradhan, B. , Saha, M. , & Shukla, N. (2020). COVID‐19 detection through transfer learning using multimodal imaging data. IEEE Access, 8, 149808–149824. [DOI] [PMC free article] [PubMed] [Google Scholar]
- Huang, C. , Wang, Y. , Li, X. , Ren, L. , Zhao, J. , Hu, Y. , … Gu, X. (2020). Clinical features of patients infected with 2019 novel coronavirus in Wuhan, China, 395(10223), 497–506. [DOI] [PMC free article] [PubMed] [Google Scholar]
- Kang, C. , Yu, X. , Wang, S.‐H. , Guttery, D. , Pandey, H. , Tian, Y. , & Zhang, Y. (2020). A heuristic neural network structure relying on fuzzy logic for images scoring, 29(1), 1–12. [DOI] [PMC free article] [PubMed] [Google Scholar]
- Kassani, S. H. , Kassasni, P. H. , Wesolowski, M. J. , Schneider, K. A. , & Deters, R. (2020). Automatic Detection of Coronavirus Disease (COVID‐19) in X‐ray and CT Images: A Machine Learning‐Based Approach, arXiv:2004.10641v1, 1–18. [DOI] [PMC free article] [PubMed]
- Khan, M.A. Kadry, S. , Zhang, Y.D. , Akram, T. , Sharif, M. , Rehman, A. , Saba, T. (2021) Prediction of COVID‐19—Pneumonia based on selected deep features and one class kernel extreme learning machine, computers & electrical engineering, 90, 1–19. [DOI] [PMC free article] [PubMed] [Google Scholar]
- Kim, H.‐G. , Moreau, N. , & Sikora, T. (2006). MPEG‐7 audio and beyond: Audio content indexing and retrieval. Hoboken, NJ: John Wiley & Sons. [Google Scholar]
- Lai, C.‐C. , Shih, T.‐P. , Ko, W.‐C. , Tang, H.‐J. , & Hsueh, P.‐R. . (2020). Severe acute respiratory syndrome coronavirus 2 (SARS‐CoV‐2) and corona virus disease‐2019 (COVID‐19): The epidemic and the challenges, 55(3), 1–9. [DOI] [PMC free article] [PubMed] [Google Scholar]
- Ojala, T. , Pietikainen, M. , & Maenpaa, T. (2002). Multiresolution gray‐scale and rotation invariant texture classification with local binary patterns. IEEE Transactions on Pattern Analysis and Machine Intelligence, 24(7), 971–987. [Google Scholar]
- Rehman, A. , Saba, T. , Ayesha, N. , & Tariq, U. (2021). Deep learning‐based COVID‐19 detection using CT and X‐ray images: Current analytics and comparisons. IEEE IT Professional, 1–13. 10.1109/MITP.2020.3036820 [DOI] [PMC free article] [PubMed] [Google Scholar]
- Rehman, A. , Sadad, T. , Saba, T. , Hussain, A. , & Tariq, U. (2021). Real‐time diagnosis system of COVID‐19 using X‐ray images and deep learning. IEEE IT Professional, 10. 10.1109/MITP.2020.3042379 [DOI] [PMC free article] [PubMed] [Google Scholar]
- Saba, T. (2019). Automated lung nodule detection and classification based on multiple classifiers voting. Microscopy Research and Technique, 82(9), 1601–1609. [DOI] [PubMed] [Google Scholar]
- Saba, T. (2021). Computer vision for microscopic skin cancer diagnosis using hand‐crafted and non‐handcrafted features. Microscopy Research and Technique. 10.1002/jemt.23686 [DOI] [PubMed] [Google Scholar]
- Saba, T. , Abunadi, I. , Shahzad, M. N. , & Khan, A. R. (2021). Machine learning techniques to detect and forecast the daily total COVID‐19 infected and deaths cases under different lockdown types. Microscopy Research and Technique. 10.1002/jemt.23702 [DOI] [PMC free article] [PubMed] [Google Scholar]
- Saba, T. , Bokhari, S. T. F. , Sharif, M. , Yasmin, M. , & Raza, M. (2018). Fundus image classification methods for the detection of glaucoma: A review. Microscopy Research and Technique, 81(10), 1105–1121. [DOI] [PubMed] [Google Scholar]
- Salman, M. , Ahmed, A. W. , Khan, O. A. , Raza, B. , & Latif, K. (2017). Artificial intelligence in bio‐medical domain, 8(8). [Google Scholar]
- Seiffert, C. , Khoshgoftaar, T. M. , Van Hulse, J. , & Napolitano, A. (2008). RUSBoost: Improving Classification Performance When Training Data is Skewed. Paper presented at the 2008 19th International Conference on Pattern Recognition
- Shan, F. , Gao, Y. , Wang, J. , Shi, W. , Shi, N. , Han, M. , … Shi, Y. (2020). Lung infection quantification of covid‐19 in ct images with deep learning, 3, 1–23. [Google Scholar]
- Szegedy, C. , Vanhoucke, V. , Ioffe, S. , Shlens, J. , & Wojna, Z. (2016). Rethinking the Inception Architecture for Computer Vision. Paper Presented at the Proceedings of the IEEE Conference on Computer Vision and Pattern Recognition.
- Wang, D. , Hu, B. , Hu, C. , Zhu, F. , Liu, X. , Zhang, J. , … Xiong, Y. (2020). Clinical characteristics of 138 hospitalized patients with 2019 novel coronavirus–infected pneumonia in Wuhan, China. JAMA, 323(11), 1061–1069. [DOI] [PMC free article] [PubMed] [Google Scholar]
- Wang, S. , Sun, J. , Mehmood, I. , Pan, C. , Chen, Y. , Zhang, Y. D. , (2020). Cerebral micro‐bleeding identification based on a nine‐layer convolutional neural network with stochastic pooling. Concurrency and Computation: Practice and Experience., 32(1), 1–16. [Google Scholar]
- Wang, S. , Tang, C. , Sun, J. , & Zhang, Y. (2019). Cerebral micro‐bleeding detection based on densely connected neural network, 13, 1–11. [DOI] [PMC free article] [PubMed] [Google Scholar]
- Wang, S.‐H. , Muhammad, K. , Hong, J. , Sangaiah, A. K. , & Zhang, Y.‐D. (2020). Alcoholism identification via convolutional neural network based on parametric ReLU, dropout, and batch normalization. Neural Computer Applications, 32(3), 665–680. [Google Scholar]
- Wang, S.‐H. , Zhang, Y.‐D. , Yang, M. , Liu, B. , Ramirez, J. , & Gorriz, J. M. (2019). Unilateral sensorineural hearing loss identification based on double‐density dual‐tree complex wavelet transform and multinomial logistic regression. Integrated Computer‐Aided Engineering, 26(4), 411–426. [Google Scholar]
- Wang, Z. , Liu, Q. , & Dou, Q. (2020). Contrastive cross‐site learning with redesigned net for COVID‐19 CT classification. IEEE Journal of Biomedical and Health Informatics, 24(10), 2806–2813. [DOI] [PMC free article] [PubMed] [Google Scholar]
- Yang, X. , He, X. , Zhao, J. , Zhang, Y. , Zhang, S. , & Xie, P. (2020). COVID‐CT‐dataset: a CT scan dataset about COVID‐19. ArXiv e‐prints, arXiv: 2003.13865.
- Zhao, J. , Zhang, Y. , He, X. , & Xie, P. (2020). Covid‐CT‐dataset: A CT scan dataset about covid‐19, arXiv:2003, 1–5.
Associated Data
This section collects any data citations, data availability statements, or supplementary materials included in this article.
Data Availability Statement
The data that support the findings of this study are openly available in (covid‐CT‐dataset) at (https://covid‐19.conacyt.mx/jspui/handle/1000/4157).