

Abstract
Aim
To examine psychosocial and behavioural impacts of the novel coronavirus disease 2019 (COVID‐19) pandemic and lockdown restrictions among adults with type 2 diabetes.
Methods
Participants enrolled in the PRogrEssion of DIabetic ComplicaTions (PREDICT) cohort study in Melbourne, Australia (n = 489 with a baseline assessment pre‐2020) were invited to complete a phone/online follow‐up assessment in mid‐2020 (i.e., amidst COVID‐19 lockdown restrictions). Repeated assessments that were compared with pre‐COVID‐19 baseline levels included anxiety symptoms (7‐item Generalised Anxiety Disorder scale [GAD‐7]), depressive symptoms (8‐item Patient Health Questionnaire [PHQ‐8]), diabetes distress (Problem Areas in Diabetes scale [PAID]), physical activity/sedentary behaviour, alcohol consumption and diabetes self‐management behaviours. Additional once‐off measures at follow‐up included COVID‐19‐specific worry, quality of life (QoL), and healthcare appointment changes (telehealth engagement and appointment cancellations/avoidance).
Results
Among 470 respondents (96%; aged 66 ± 9 years, 69% men), at least ‘moderate’ worry about COVID‐19 infection was reported by 31%, and 29%–73% reported negative impacts on QoL dimensions (greatest for: leisure activities, feelings about the future, emotional well‐being). Younger participants reported more negative impacts (p < 0.05). Overall, anxiety/depressive symptoms were similar at follow‐up compared with pre‐COVID‐19, but diabetes distress reduced (p < 0.001). Worse trajectories of anxiety/depressive symptoms were observed among those who reported COVID‐19‐specific worry or negative QoL impacts (p < 0.05). Physical activity trended lower (~10%), but sitting time, alcohol consumption and glucose‐monitoring frequency remained unchanged. 73% of participants used telehealth, but 43% cancelled a healthcare appointment and 39% avoided new appointments despite perceived need.
Conclusions
COVID‐19 lockdown restrictions negatively impacted QoL, some behavioural risk factors and healthcare utilisation in adults with type 2 diabetes. However, generalised anxiety and depressive symptoms remained relatively stable.
Keywords: anxiety, delivery of health care, depression, diabetes complications, exercise, quality of life, telemedicine
What is already known?
Cross‐sectional surveys suggest that COVID‐19 lockdown restrictions may be associated with adverse psychosocial outcomes, self‐care behaviours and reduced healthcare engagement.
What this study has found?
Large proportions of adults with type 2 diabetes reported worries about COVID‐19 infection, negative impacts on quality of life, and high rates of healthcare cancellations/avoidance. However, there was no worsening of anxiety/depressive symptoms nor large changes in self‐care behaviours, compared with pre‐pandemic levels.
What are the implications of the study?
Ongoing support is essential to mitigate the negative impacts of the COVID‐19 pandemic on adults with type 2 diabetes.
1. INTRODUCTION
The novel coronavirus disease 2019 (COVID‐19) has prompted strict lockdown restrictions in numerous countries to contain the pandemic. During the initial ‘wave’ of cases in Australia in 2020, these restrictions were characterised by prohibitions on leaving home aside from four key reasons: medical care/caregiving, shopping for necessary food/supplies, essential work/education and exercise. The nature and severity of these restrictions were similar to those adopted in many countries and which remain in place in numerous locations with existent high COVID‐19 caseloads. 1 Notwithstanding the importance of restrictions for containment of the pandemic, concerns remain over potential adverse psychosocial effects related to disrupted activities of daily living, social isolation, financial loss and other unintended consequences. 2 , 3 Such impacts may be exacerbated in people with diabetes due to greater fear of adverse outcomes from COVID‐19 4 , 5 and greater reliance on access to healthcare services. 6 , 7 Although healthcare was a permitted reason to travel, face‐to‐face clinical services across Australia were scaled back and/or replaced with telehealth. 8
A limited number of cross‐sectional surveys conducted in people with type 2 diabetes during the COVID‐19 pandemic have identified high levels of stress and social isolation, high levels of worry associated with COVID‐19 infection, reduced ability to self‐manage diabetes, and lack of access to medications, equipment and care. 9 , 10 However, data from established cohorts with a pre‐pandemic baseline and a follow‐up conducted in the context of the pandemic are scarce. Therefore, the question remains as to whether COVID‐19‐specific worries or public health restrictions impair mental health or self‐care, compared with pre‐pandemic levels.
The PRogrEssion of DIabetic ComplicaTions (PREDICT) study is an ongoing population‐based cohort study of adults with type 2 diabetes designed to identify novel risk factors for diabetic complications. It commenced recruitment in 2018 and included measures of mental health, psychosocial and behavioural factors. During the initial lockdown in Australia in May–June 2020, we conducted the PREDICT COVID‐19 follow‐up study to examine changes in general and diabetes‐specific psychosocial and behavioural factors, compared with pre‐pandemic levels. Furthermore, we aimed to investigate worry about COVID‐19 and its perceived impact on quality of life and healthcare access among adults with type 2 diabetes.
2. METHODS
2.1. Participants
Eligible participants were adults (aged 18–80 years) with type 2 diabetes, living within a 10 km radius of the Baker Heart and Diabetes Institute (Melbourne, Australia). Recruitment commenced in 2018 (predominantly via mail‐outs to National Diabetes Services Scheme registrants residing in eligible postcodes and clinic‐based recruitment at the Baker Institute). Human research ethics approval was obtained from The Alfred Ethics Committee, and individuals provided written informed consent at study enrolment. Of 489 participants who completed baseline assessment prior to 2020, 470 (96%) provided verbal and/or electronic consent for the current COVID‐19‐specific substudy (median time elapsed since baseline = 1.0 years [interquartile range 0.7–1.5 years]). Completion rates of specific study components are displayed in Table S1. Baseline data included demographics, self‐reported medical history and blood biomarkers by standard hospital pathology laboratory protocols. The COVID‐19‐specific follow‐up was conducted via phone and online questionnaires administered during a ~2‐month period beginning 30 April 2020 (i.e., during the lockdown response to the first wave of cases in Australia; distribution of response dates shown in Figure S1).
2.2. Assessments specific to the COVID‐19 pandemic
Direct impacts of COVID‐19 on participants were captured using a coronavirus questionnaire (Supplementary Methods S1). Concern about infection risk (personal, or among family/friends) was assessed via two questions on a 5‐point scale drawn from the CRISIS questionnaire, 11 with ‘COVID‐19‐specific‐worry’ defined as at least ‘moderate’ worry about being/becoming infected. The impacts of COVID‐19 on quality of life dimensions were assessed using a novel 10‐item questionnaire informed by the DAWN2 Impact of Diabetes Profile (Supplementary Methods S2). 12 Participants were also asked about changes to pre‐existing healthcare appointments during the pandemic (cancellations or shifts to telehealth). Avoidance of medical care despite perceived need was also recorded.
2.3. Pre‐COVID‐19 assessments repeated during the pandemic
2.3.1. Psychosocial factors
We used the 7‐item Generalised Anxiety Disorder (GAD‐7) 13 and 8‐item Patient Health Questionnaire (PHQ‐8) 14 to quantify anxiety and depressive symptoms, respectively; the 20‐item Problem Areas in Diabetes (PAID) scale 15 to assess diabetes distress; and the 20‐item Confidence in Diabetes Self‐Care (CIDS) scale 16 , 17 and 12‐item Diabetes Support Scale (DSS). 18 Where typical questionnaire wording directed participants to reflect on a preceding period longer than 1 month, instructions at follow‐up were customised so that participants’ responses reflected the context of the ‘current pandemic.’ Classification of anxiety and depressive symptoms was based on standard cut‐points for the GAD‐7 (‘mild’ score range = 5–9; moderate/severe = 10 + out of a possible 21 13 ), and PHQ‐8, respectively (previously described diagnostic algorithm for ‘major’ and ‘other’ depressive symptoms 14 ).
2.3.2. Behavioural risk factors
Physical activity and sitting time were quantified from previously described self‐report questionnaires specific to the previous seven days. 19 , 20 Alcohol consumption was estimated as the product of drinking frequency (days/week) and usual number of standard drinks consumed.
2.3.3. Self‐care and healthcare engagement
Participants self‐reported general practitioner (GP) visits and glucose monitoring frequency over the preceding 3 months at baseline (converted to a monthly average for comparison purposes) and over the preceding one month at follow‐up. Medication taking was based on dichotomous yes/no responses to whether prescribed medications had been taken in full both: (1) the prior day and (2) every day within the preceding 2 weeks.
2.4. Statistical analysis
Data were analysed using Stata 14 (StataCorp). Determinants of COVID‐19‐specific worry levels and quality of life were based on ordinal logistic regression. Changes in psychosocial metrics and behavioural risk factors relative to pre‐COVID‐19 levels were assessed using a class of multilevel regression models that account for the within‐individual correlation of the longitudinal measurements and the distributional shape of the outcome variables. These models include the multilevel generalised gamma model for skewed continuous variables (e.g., sitting time), multilevel binomial or negative binomial model for count data (left or right skewed, respectively, e.g., minutes spent walking, relevant psychosocial questionnaire factors), and multilevel logistic regression models for binary outcomes (e.g., medication‐taking). These models enable comparisons of two time‐points (pre‐COVID‐19 vs. COVID‐19 follow‐up), akin to a paired t test, while accounting for the non‐normal distribution of the outcome variables. Potential differences in pre‐COVID‐19 versus COVID‐19 change between subgroups were assessed by adding relevant interaction terms with time to these models. Only interactions between time and the following variables were assessed: age, sex, cardiovascular disease (CVD) history, treatment with insulin, presence of COVID‐19‐specific worry, and negative impact on the ‘emotional well‐being’ dimension of quality of life (vs. neutral/positive impact). To account for multiple hypothesis testing, we adjusted p values for main and interaction terms using the Benjamini–Hochberg procedure, 21 which controls for overall false discovery rates. p values were corrected within each of two major groupings of outcome measures, i.e., psychosocial and behavioural. All main effects (i.e., overall change; pre‐COVID‐19 vs. COVID‐19 follow‐up) and interaction effects (i.e., pre‐COVID‐19 vs. COVID‐19 change according to subgroup factors) were included in false discovery rate corrections. Statistical significance was declared when adjusted p values were <0.05.
3. RESULTS
Baseline demographic/clinical characteristics are shown in Table 1. Participants were predominantly male (69%), university educated (55%), older adults (mean age 66 years). Median diabetes duration was 12 years and mean glycated haemoglobin was 56 mmol/mol (7.2%). Prior CVD was reported by 24% of participants, and 20% were treated with insulin. No participants reported a COVID‐19 diagnosis, but 7% knew someone who had been infected. Of the employed subpopulation, 33% reported changing or losing work due to the pandemic. Of those still employed, 69% were working from home some or all of the time.
TABLE 1.
Baseline demographic and clinical characteristics
| n = 470 | |
|---|---|
| Age, years | 66 ± 9 |
| Male, % | 69 |
| Education, % | |
| ≤12 years | 19 |
| Trade/Certificate | 13 |
| Associate Degree/Diploma | 14 |
| Bachelor Degree/Postgraduate | 55 |
| Employment status, % | |
| Retired | 48 |
| Working | 42 |
| Unemployed/not retired | 5 |
| Student/other | 5 |
| Recruitment source a | |
| Diabetes clinic | 48 |
| NDSS mail‐out | 37 |
| Other | 15 |
| Body mass index, kg/m2 | 30.2 ± 5.6 |
| Systolic BP, mm Hg | 128 ± 17 |
| Diastolic BP, mm Hg | 71 ± 10 |
| Smoking status, % | |
| Current | 6 |
| Former | 42 |
| Diabetes duration, years | 12 (5 – 17) |
| HbA1c, mmol/mol | 56 ± 12 |
| HbA1c, % | 7.2 ± 1.1 |
| eGFR <60 ml/min/1.73m2, % | 13 |
| Cardiovascular disease, % | 24 |
| Diabetes management, % | |
| Diet/lifestyle management only | 10 |
| Monotherapy b | 21 |
| Dual therapy b | 26 |
| Triple + therapy b | 22 |
| Insulin alone | 2 |
| Insulin in combination | 18 |
| Other medications, % | |
| ACE‐inhibitor or ARB | 66 |
| Statin | 72 |
Data are mean ± standard deviation, median (interquartile range) or %.
Abbreviations: ACE, angiotensin‐converting enzyme; ARB, angiotensin receptor blocker; BP, blood pressure; eGFR, estimated glomerular filtration rate; HbA1c, glycated haemoglobin.
Diabetes clinic refers to the specialist clinic located at the study site; participants recruited via the NDSS (National Diabetes Services Scheme) responded to letter invitations. ‘Other’ encompasses advertising and other community‐based recruitment methods.
Non‐insulin therapies only.
3.1. COVID‐19‐specific worry and quality of life
Overall, 31% of participants reported at least ‘moderate’ worry about being/becoming infected (39% for friends/family becoming infected) (see Figure S2). No associations were observed between worry level and age, sex, insulin use or CVD history. Figure 1 shows that the proportions reporting negative impacts (at least ‘slightly’) of the COVID‐19 pandemic were highest for leisure activities (73%), feelings about the future (64%) and emotional well‐being (52%); by contrast, they were lowest for diabetes (29%), within‐household relationships (31%) and sleep (32%). Younger participants reported greater negative quality of life impacts for leisure activities (p = 0.029), with similar trends observed for emotional well‐being, and work (p = 0.051 and 0.076, respectively; Figure S3 shows proportions reporting at least slightly negative impact, by age). Quality of life impacts did not differ by sex, CVD history or insulin use.
FIGURE 1.
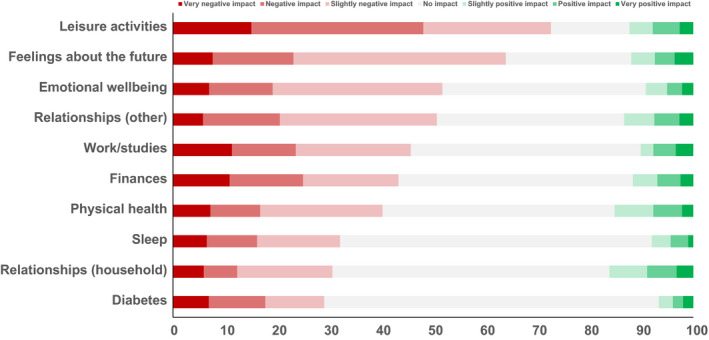
Impact of COVID‐19 on dimensions of quality of life. Data are stacked proportions (excluding ‘N/A’ responses)
3.2. Psychosocial factors
At baseline, 8% of participants reported moderate‐to‐severe anxiety symptoms (GAD‐7) and 5% reported major depressive symptoms (PHQ‐8). During the COVID‐19 follow‐up, there was no overall change compared with pre‐COVID‐19 levels (Table 2). However, subgroup analyses showed higher baseline levels and modest relative increases in anxiety and depressive symptoms in people who reported at least ‘moderate’ worry about COVID‐19 infection and in those who reported a negative impact of lockdown on the ‘emotional well‐being’ dimension of quality of life (Figure S4).
TABLE 2.
Psychosocial characteristics, at COVID‐19 follow‐up versus pre‐COVID‐19
| n | Pre‐COVID‐19 | COVID‐19 | p value | |
|---|---|---|---|---|
| Anxiety symptoms (GAD‐7) | 450 | |||
| GAD‐7 score, scoring range: 0–21 | 2.2 (1.8–2.5) | 2.0 (1.7–2.3) | 0.46 | |
| Mild symptoms, % | 22.4 | 16.4 | ||
| Moderate‐to‐severe symptoms, % | 8.4 | 8.4 | ||
| Depressive symptoms (PHQ‐8) | 450 | |||
| PHQ‐8 score, scoring range: 0–24 | 2.7 (2.4–3.0) | 2.7 (2.4–3.0) | 0.98 | |
| Other depressive symptoms, % | 5.3 | 6.7 | ||
| Major symptoms, % | 5.3 | 5.6 | ||
| Diabetes‐specific distress (PAID) | 449 | |||
| PAID score, scoring range: 0–100 | 15 (13–16) | 9 (8–10) | <0.001 | |
| Severe diabetes distress (PAID ≥40), % | 14.7 | 7.8 | ||
| Confidence in diabetes self‐care | ||||
| CIDS‐1 (insulin‐treated), % | 92 | 84 (81–87) | 83 (79–87) | 0.85 |
| CIDS‐2 (non‐insulin‐treated), % | 305 | 81 (79–83) | 83 (81–85) | 0.26 |
| Diabetes Support Scale (DSS), scoring range: 1–7 | 442 | 5.1 (5.0–5.2) | 5.0 (4.9–5.1) | 0.32 |
Data are estimated marginal means with 95% CIs.
Abbreviations: CIDS, Confidence in Diabetes Self‐Care; GAD‐7, 7‐item Generalised Anxiety Disorder scale; PAID, Problem Areas in Diabetes scale; PHQ‐8, 8‐item Patient Health Questionnaire.
At baseline, 15% of participants reported severe diabetes distress (PAID > 40), which reduced to 8% during the COVID‐19 follow‐up (p < 0.001; Table 2). During follow‐up, those who reported at least ‘moderate’ worry about infection and negative impacts on the ‘emotional well‐being’ dimension of quality of life tended to have higher pre‐COVID‐19 diabetes distress levels and, in turn, a smaller magnitude decline (Figure S4). Confidence in diabetes self‐care and diabetes support scales remained similar to baseline (Table 1, 2).
3.3. Behavioural risk factors
Figure 2 shows that total physical activity time was reduced by ~10% (p = 0.10), though this was not consistent across its components. A reduction in incidental walking was offset by a similar magnitude increase in fitness‐oriented walking. Reductions were observed in vigorous‐intensity and strength training, but not in moderate‐intensity exercise. Changes in physical activity did not vary by clinical factors or by COVID‐19‐specific worry or quality of life. Total sitting time remained similar to baseline, with a reduction in travel‐related, but not work‐related, sitting time. However, those reporting a negative impact of the pandemic on the ‘emotional well‐being’ dimension of quality of life had a greater increase in sitting time compared with baseline (+6 h vs. −1 in those who reported a neutral/positive impact; p int = 0.021). Alcohol consumption was similar at baseline and follow‐up.
FIGURE 2.
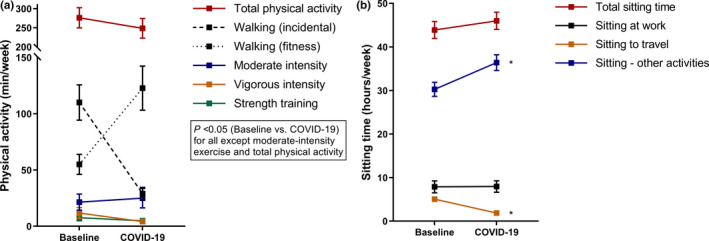
Changes in physical activity (a) and sitting time (b) versus pre‐COVID‐19 levels. Data are estimated marginal means with 95% CIs (error bars). * indicates p < 0.05 versus baseline
3.4. Self‐management and healthcare utilisation
No changes in glucose self‐monitoring or medication‐taking were observed overall (Table 3). However, GP visits (inclusive of telehealth and home visits) increased significantly compared with baseline (Table 3).
TABLE 3.
Self‐care measures, at COVID‐19 follow‐up versus pre‐COVID‐19
| n | Pre‐COVID‐19 | COVID‐19 | p value | |
|---|---|---|---|---|
| Medication taking | 429 | |||
| Prior day, % | 95% | 95% | 0.97 | |
| Last 2 weeks, % | 84% | 85% | 0.74 | |
| Glucose self‐monitoring frequency | ||||
| Checks per month | 442 | 26 (22–30) | 25 (21–28) | 0.74 |
| General practitioner visits | ||||
| No. visits per month | 467 | 0.6 (0.5–0.7) | 1.1 (1.0–1.2) | <0.001 |
Data are proportions or marginal means with 95% CIs.
Table 4 shows that appointment cancellation rates were high (43% and 61% for community‐ and hospital/day unit‐based appointments, respectively). However, of 369 participants with pre‐existing appointment(s) not subject to cancellation, 270 (73%) proceeded with ≥1 appointment after it was changed to telehealth. Among those who perceived a need for a new appointment, avoidance of doing so was reported by 39% of participants for non‐urgent community‐based bookings, and 32% for hospital emergency department attendance, while 16% reported avoiding attending a pathology collection centre. Health professionals with whom appointments were changed/cancelled/avoided are displayed in Figure S5.
TABLE 4.
Impact of the COVID‐19 pandemic on healthcare visits
| Visit scheduled or perceived as needed (no. participants) | Changed, cancelled or avoided (no. participants; %) | |
|---|---|---|
| Pre‐existing appointments | ||
| Clinic/outpatient appointments a | 392 | 170 (43) |
| Hospital/day unit appointments | 56 | 34 (61) |
| Avoidance of care despite new perceived need | ||
| Clinic/outpatient appointment booking | 266 | 105 (39) |
| Emergency department presentation | 19 | 6 (32) |
| Attendance at pathology collection centre | 187 | 29 (16) |
Twelve participants were excluded after internal logic checks identified inconsistencies.
4. DISCUSSION
We observed high levels of worry about COVID‐19 infection among adults with type 2 diabetes and prevalent negative impacts of the pandemic on multiple dimensions of quality of life. However, overall we found no evidence of an escalation in anxiety or depressive symptoms compared with pre‐COVID‐19 levels. Beyond psychosocial health, physical activity and sedentary behaviour showed modest changes, and self‐care behaviours remained unchanged. Conversely, appointment cancellations and avoidance of new healthcare bookings were common, which may increase risks of future adverse health outcomes.
The absence of increasing anxiety and depressive symptoms in the total cohort may provide some reassurance about the mental health impacts of lockdowns in adults with type 2 diabetes, even if generalisability to longer duration or repeated lockdowns remains uncertain. This somewhat surprising finding may reflect that data were collected during Australia's first wave—a period of low incidence of infections/deaths relative to other countries and during which restrictions tended to be easing (cumulative incidence of COVID‐19 in Australia at the mid‐point of our follow‐up was 28 per 100,000; cumulative testing rate: 3983 per 100,000 22 ). Nevertheless, composite markers of lockdown severity—e.g., the COVID‐19 Government Stringency Index (0–100 scale based on nine indicators including stay‐at‐home restrictions, workplace/school closures, etc. [100 = most strict])—suggest that Australia's restrictions at that time (60–70 range) were akin to many other countries, and indeed, similar to those that remain in the United States and many European and Asian countries in early 2021. 1 Thus, our data are likely generalisable to other comparable countries in terms of lockdown severity. Also noteworthy is that substantial measures to support people with diabetes were put in place by both governmental and non‐governmental agencies in Australia, so our findings may in part attest to their effectiveness (though we did not test this). 8
4.1. Psychosocial outcomes
Among the few studies to have investigated psychosocial effects of the current pandemic on people with diabetes, 9 , 10 diabetes distress, social isolation and worry about COVID‐19 infection have been common metrics, but none has had a pre‐COVID‐19 baseline. The prevalence of diabetes distress in our cohort was low at baseline (15% vs. 36% in an international systematic review), 23 and we then observed a significant reduction at follow‐up. One hypothesis for this phenomenon, consistent with conservation of resources, is that COVID‐19 concerns displaced diabetes distress. Alternatively, lifestyle changes associated with the restrictions (e.g., working from home, limited social dining) may have had unintended benefits for coping with the demands of living with diabetes.
Our study is unique in examining whether COVID‐19‐specific impacts have translated to changes in anxiety and depressive symptoms compared with pre‐COVID‐19 levels. While the prevalence of anxiety and depressive symptoms was relatively low at baseline and remained broadly unchanged, more adverse trajectories were observed in those who reported worry about infection or a negative impact on the ‘emotional well‐being’ dimension of quality of life. Even so, within these subgroups reporting worry and/or emotional well‐being impact, anxiety/depressive symptoms did not increase to moderate/severe levels, reinforcing that inferences about change over time should not be made from one‐off COVID‐19‐specific measures. Although our findings would appear to contradict the increasing mental distress compared with pre‐COVID‐19 levels observed in the general UK population, 24 such trends appear to be driven primarily by changes in younger people and in women. We observed a similar trend for age, but not for gender. The older age of many people with type 2 diabetes limits the proportion who were exposed to the stresses of home‐schooling and loss of employment.
4.2. Behavioural outcomes
Physical activity may have been expected to decline and sedentary behaviour increase due to lockdown restrictions, as reported in the majority of studies on this topic in both general and chronic disease populations. 25 Our results were similar, though overall changes (COVID‐19 follow‐up vs. pre‐COVID‐19) were modest and not significant. An increase in fitness‐oriented walking—which may be attributed to exercise being designated one of the four permissible reasons to leave home during lockdown—appeared to largely offset reductions in incidental walking and vigorous/strength training. The prospect of a link between the relative maintenance of both physical activity and anxiety/depression symptoms should not be underestimated, with cross‐sectional studies already reporting this in the context of the COVID‐19 pandemic. 26 There were no changes in overall rates of medication‐taking and glucose self‐monitoring, while diabetes‐specific self‐efficacy and social support remained stable. In contrast to anxiety/depressive symptoms, COVID‐19‐specific worry did not appear to modify self‐care factors. This is contradictory to Danish data suggesting that COVID‐19‐related worries actually conferred some benefit in people with diabetes in the form of heightened medication awareness, more frequent glucose monitoring, and increased physical activity. 9
4.3. Implications for clinical care
These findings reinforce previous reports of high rates of healthcare cancellations and avoidance, and does so for the first time in an Australian diabetes population. 10 , 27 , 28 , 29 , 30 Notwithstanding that the number of GP appointments increased (presumably reflecting widespread take‐up of telehealth services), cancellations of specialist physician and hospital/day clinic appointments were frequent. Consistent with our findings, pathology testing rates elsewhere in Australia point to a 60% decline at the height of the pandemic. 30 Healthcare services will need to continue to adapt to maximise engagement with patients and ensure adequate monitoring of risk factors.
4.4. Study limitations
Although the very high follow‐up response rate was encouraging, our cohort had an over‐representation of men, people with higher education and relatively favourable psychosocial health (as evidenced by low rates of anxiety/depressive symptoms). Beyond the demographic characteristics of the catchment area around the study site (i.e., relatively high socio‐economic status), reasons for these biases are unclear. Regardless, they may obviously limit generalisability to the broader type 2 diabetes population, who may be more vulnerable to the impacts of COVID‐19. Baseline glycated haemoglobin and other risk factor data also attest to a cohort with relatively well‐managed type 2 diabetes, though it is unclear whether these markers changed in the context of the pandemic. As previously noted, our findings also need to be considered in the context of the timing of data collection, i.e., during Australia's ‘first wave’, with lockdown restrictions still in place, but relatively low incidence of COVID‐19 cases/deaths. It is unclear the extent to which the current results can be generalised to repeated or longer lockdowns in Australia or other countries. The lack of a group without diabetes also precluded direct determination of whether changes in people with type 2 diabetes diverged from the general population or people with other chronic diseases. Finally, our reliance on questionnaires and telephone interviews gives rise to the possibility of self‐report biases.
5. CONCLUSIONS
During the first COVID‐19 lockdown in Australia, adults with type 2 diabetes reported high levels of worry about infection and substantive negative impacts of the pandemic on multiple dimensions of quality of life. These findings reinforce the need for ongoing support services to mitigate mental health decline, though it was reassuring that anxiety and depressive symptoms remained stable overall and self‐care behaviours were also largely unchanged during the first wave of the pandemic. Although most participants made use of telehealth, high rates of healthcare appointment avoidance and cancellation should urge practitioners to prioritise patient re‐engagement and risk factor monitoring to ensure ongoing quality of care during the pandemic.
CONFLICT OF INTEREST
None declared.
Supporting information
Supplementary Material
ACKNOWLEDGEMENTS
The PREDICT study gratefully acknowledges all the study participants, and the support and assistance given by T Marwick and M Cooper. Some participants in the study were recruited as registrants of the National Diabetes Services Scheme (NDSS). The NDSS is an initiative of the Australian Government administered by Diabetes Australia.
Sacre JW, Holmes‐Truscott E, Salim A, et al. Impact of the COVID‐19 pandemic and lockdown restrictions on psychosocial and behavioural outcomes among Australian adults with type 2 diabetes: findings from the PREDICT cohort study. Diabet Med. 2021;38:e14611. 10.1111/dme.14611
Funding information
Funding support for this study was provided by La Trobe University, the Ernest Heine Family Foundation–Sydney, Boehringer Ingelheim, the National Health and Medical Research Council of Australia (APP1107361 to DJM and APP1173952 to JES) and the State Government of Victoria Operational Infrastructure Support Program. EHT and JSp are supported by core funding to the Australian Centre for Behavioural Research in Diabetes provided by the collaboration between Diabetes Victoria and Deakin University. Funding sources for this study had no role in study design, data collection, analysis or interpretation of data, nor in the reporting or publication of results.
REFERENCES
- 1. Hale T, Angrist N, Cameron‐Blake E, et al. Oxford COVID‐19 government response tracker; 2020. https://www.bsg.ox.ac.uk/research/research‐projects/coronavirus‐government‐response‐tracker. Accessed January 20, 2021. [DOI] [PubMed]
- 2. Douglas M, Katikireddi SV, Taulbut M, McKee M, McCartney G. Mitigating the wider health effects of covid‐19 pandemic response. BMJ. 2020;369:m1557. [DOI] [PMC free article] [PubMed] [Google Scholar]
- 3. Campion J, Javed A, Sartorius N, Marmot M. Addressing the public mental health challenge of COVID‐19. Lancet Psychiatry. 2020;7:657‐659. [DOI] [PMC free article] [PubMed] [Google Scholar]
- 4. Williamson EJ, Walker AJ, Bhaskaran K, et al. Factors associated with COVID‐19‐related death using OpenSAFELY. Nature. 2020;584:430‐436. [DOI] [PMC free article] [PubMed] [Google Scholar]
- 5. Seiglie J, Platt J, Cromer SJ, et al. Diabetes as a risk factor for poor early outcomes in patients hospitalized with COVID‐19. Diabetes Care. 2020;43:2938‐2944. [DOI] [PMC free article] [PubMed] [Google Scholar]
- 6. Brooks SK, Webster RK, Smith LE, et al. The psychological impact of quarantine and how to reduce it: rapid review of the evidence. Lancet. 2020;395:912‐920. [DOI] [PMC free article] [PubMed] [Google Scholar]
- 7. Scott ES, Jenkins AJ, Fulcher GR. Challenges of diabetes management during the COVID‐19 pandemic. Med J Aust. 2020;213(56‐57):e51. [DOI] [PubMed] [Google Scholar]
- 8. Andrikopoulos S, Johnson G. The Australian response to the COVID‐19 pandemic and diabetes – lessons learned. Diabetes Res Clin Pract. 2020;165:108246. [DOI] [PMC free article] [PubMed] [Google Scholar]
- 9. Joensen LE, Madsen KP, Holm L, et al. Diabetes and COVID‐19: psychosocial consequences of the COVID‐19 pandemic in people with diabetes in Denmark‐what characterizes people with high levels of COVID‐19‐related worries? Diabet Med. 2020;37:1146‐1154. [DOI] [PMC free article] [PubMed] [Google Scholar]
- 10. Fisher L, Polonsky W, Asuni A, Jolly Y, Hessler D. The early impact of the COVID‐19 pandemic on adults with type 1 or type 2 diabetes: a national cohort study. J Diabetes Complications. 2020;34:107748. [DOI] [PMC free article] [PubMed] [Google Scholar]
- 11. Nikolaidis A, Paksarian D, Alexander L, et al. The Coronavirus Health and Impact Survey (CRISIS) reveals reproducible correlates of pandemic‐related mood states across the Atlantic. medRxiv. 2020. [DOI] [PMC free article] [PubMed] [Google Scholar]
- 12. Holmes‐Truscott E, Skovlund SE, Hendrieckx C, Pouwer F, Peyrot M, Speight J. Assessing the perceived impact of diabetes on quality of life: Psychometric validation of the DAWN2 Impact of Diabetes Profile in the second Diabetes MILES – Australia (MILES‐2) survey. Diabetes Res Clin Pract. 2019;150:253‐263. [DOI] [PubMed] [Google Scholar]
- 13. Spitzer RL, Kroenke K, Williams JB, Lowe B. A brief measure for assessing generalized anxiety disorder: the GAD‐7. Arch Intern Med. 2006;166:1092‐1097. [DOI] [PubMed] [Google Scholar]
- 14. Kroenke K, Strine TW, Spitzer RL, Williams JB, Berry JT, Mokdad AH. The PHQ‐8 as a measure of current depression in the general population. J Affect Disord. 2009;114:163‐173. [DOI] [PubMed] [Google Scholar]
- 15. Polonsky WH, Anderson BJ, Lohrer PA, et al. Assessment of diabetes‐related distress. Diabetes Care. 1995;18:754‐760. [DOI] [PubMed] [Google Scholar]
- 16. van der Ven NC, Weinger K, Yi J, et al. The confidence in diabetes self‐care scale: psychometric properties of a new measure of diabetes‐specific self‐efficacy in Dutch and US patients with type 1 diabetes. Diabetes Care. 2003;26:713‐718. [DOI] [PMC free article] [PubMed] [Google Scholar]
- 17. Polonsky WH, Fisher L, Snoek FJ, et al. Evaluation of the Confidence In Diabetes Scale (CIDS‐2) for patients with poorly controlled T2DM. American Diabetes Association's 69th Scientific Sessions. New Orleans, LA: Diabetes; 2009:A479. [Google Scholar]
- 18. Barrera M Jr, Glasgow RE, McKay HG, Boles SM, Feil EG. Do Internet‐based support interventions change perceptions of social support?: An experimental trial of approaches for supporting diabetes self‐management. Am J Community Psychol. 2002;30:637‐654. [DOI] [PubMed] [Google Scholar]
- 19. Australian Institute of Health and Welfare . The Active Australia Survey: A Guide and Manual for Implementation, Analysis and Reporting. Canberra, Australia: AIHW; 2003. [Google Scholar]
- 20. Clark BK, Lynch BM, Winkler EAH, et al. Validity of a multi‐context sitting questionnaire across demographically diverse population groups: AusDiab3. Int J Behav Nutr Phys Act. 2015;12:148. [DOI] [PMC free article] [PubMed] [Google Scholar]
- 21. Benjamini Y, Hochberg Y. Controlling the false discovery rate: a practical and powerful approach to multiple testing. J Roy Stat Soc: Ser B (Methodol). 1995;57:289‐300. [Google Scholar]
- 22. Roser M, Ritchie H, Ortiz‐Ospina E, Hasell J. Coronavirus pandemic (COVID‐19) 2020. https://ourworldindata.org/coronavirus. Accessed March 25, 2021.
- 23. Perrin NE, Davies MJ, Robertson N, Snoek FJ, Khunti K. The prevalence of diabetes‐specific emotional distress in people with Type 2 diabetes: a systematic review and meta‐analysis. Diabet Med. 2017;34:1508‐1520. [DOI] [PubMed] [Google Scholar]
- 24. Pierce M, Hope H, Ford T, et al. Mental health before and during the COVID‐19 pandemic: a longitudinal probability sample survey of the UK population. Lancet Psychiatry. 2020. [DOI] [PMC free article] [PubMed] [Google Scholar]
- 25. Stockwell S, Trott M, Tully M, et al. Changes in physical activity and sedentary behaviours from before to during the COVID‐19 pandemic lockdown: a systematic review. BMJ Open Sport & Exercise Medicine. 2021;7:e000960. [DOI] [PMC free article] [PubMed] [Google Scholar]
- 26. Schuch FB, Bulzing RA, Meyer J, et al. Associations of moderate to vigorous physical activity and sedentary behavior with depressive and anxiety symptoms in self‐isolating people during the COVID‐19 pandemic: a cross‐sectional survey in Brazil. Psychiatry Res. 2020;292:113339. [DOI] [PMC free article] [PubMed] [Google Scholar]
- 27. Mitchell RD, O'Reilly GM, Mitra B, Smit V, Miller JP, Cameron PA. Impact of COVID‐19 State of Emergency restrictions on presentations to two Victorian emergency departments. Emerg Med Australas. 2020;32:1027‐1033. [DOI] [PMC free article] [PubMed] [Google Scholar]
- 28. Garcia S, Albaghdadi MS, Meraj PM, et al. Reduction in ST‐segment elevation cardiac catheterization laboratory activations in the United States during COVID‐19 pandemic. J Am Coll Cardiol. 2020;75:2871‐2872. [DOI] [PMC free article] [PubMed] [Google Scholar]
- 29. Bres Bullrich M, Fridman S, Mandzia JL, et al. COVID‐19: stroke admissions, emergency department visits, and prevention clinic referrals. Can J Neurol Sci. 2020;1‐4. [DOI] [PMC free article] [PubMed] [Google Scholar]
- 30. Atlay K. Key blood tests plummeted 60% during pandemic, new figures show. Australian Doctor. 2020.
Associated Data
This section collects any data citations, data availability statements, or supplementary materials included in this article.
Supplementary Materials
Supplementary Material