

Abstract
In this opinion the antimicrobial‐resistant bacteria responsible for transmissible diseases that constitute a threat to dog and cat health have been assessed. The assessment has been performed following a methodology based on information collected via an extensive literature review and expert judgement. Details of the methodology used for this assessment are explained in a separate opinion. A global state of play of antimicrobial resistant Staphylococcus pseudintermedius, Staphylococcus aureus, Staphylococcus schleiferi, Escherichia coli, Proteus mirabilis, Klebsiella spp., Enterobacter spp., Pseudomonas aeruginosa, Clostridium perfringens, Clostridioides difficile, Enterococcus faecalis and Enterococcus faecium has been provided. Among those bacteria, EFSA identified S. pseudintermedius, E. coli and P. aeruginosa with > 90% certainty as the most relevant antimicrobial resistant bacteria in the EU based on the available evidence. The animal health impact of these most relevant bacteria, as well as their eligibility for being listed and categorised within the animal health law framework will be assessed in separate scientific opinions.
Keywords: antimicrobial resistance, animal health law, extensive literature review, dog, cat
1. Introduction
The European Food Safety Authority (EFSA) received a mandate from the European Commission to investigate the global state of play as regards antimicrobial resistant animal pathogens that cause transmissible animal diseases (ToR 1), to identify the most relevant bacteria in the EU (first part of ToR 2), to summarise the actual or potential animal health impact of those most relevant bacteria in the EU (second part of ToR 2) and to perform the assessment of those bacteria to be listed and categorised according to the criteria in Article 5, Annex IV according to Article 9, and 8 within the Regulation (EU) 2016/429 on transmissible animal diseases (‘Animal Health Law’)1 (ToR 3).
This scientific opinion presents the global state of play as regards resistant animal pathogens that cause transmissible animal diseases (ToR 1) and the results of the assessment of the most relevant bacteria in the EU (first part of ToR 2) for dogs and cats following the methodology described in EFSA AHAW Panel (2021).
1.1. Background and terms of reference as provided by the requestor
The background and terms of reference (ToR) as provided by the European Commission for the present document are reported in Sections 1.1 and 1.2 of the scientific opinion on the ad hoc method to be followed for the assessment of animal diseases caused by bacteria resistant to antimicrobials within the Animal Health Law (AHL) framework (EFSA AHAW Panel, 2021).
1.2. Interpretation of the terms of reference
The interpretation of the ToR is as in Sections 1.3.1 and 1.3.2 of the scientific opinion on the ad hoc method to be followed for the assessment of animal diseases caused by bacteria resistant to antimicrobials within the AHL framework (EFSA AHAW Panel, 2021).
The present document reports the results of the assessment of bacterial pathogens resistant to antimicrobials in dogs and cats.
2. Data and methodologies
The methodology applied for this opinion is described in a dedicated document which details the ad hoc method for the assessment of animal diseases caused by bacteria resistant to antimicrobials within the AHL framework (EFSA AHAW Panel, 2021). Additional methods specific to this opinion (data collection via an extensive literature review) are detailed below.
2.1. Extensive literature review
The process to identify the bacterial species to focus on in the extensive literature review (ELR) is described in Section 2.1.2 in the ad hoc method for the assessment of animal diseases caused by bacteria resistant to antimicrobials within the AHL (EFSA AHAW Panel, 2021). According to that methodology, the following target bacterial pathogens for dogs and cats had been agreed upon by the EFSA working group: Bordetella bronchiseptica, Clostridioides difficile, Clostridium perfringens, Enterobacter spp., Enterococcus faecalis, Enterococcus faecium, Escherichia coli, Klebsiella pneumoniae, Proteus mirabilis, Pseudomonas aeruginosa, Staphylococcus aureus, Staphylococcus pseudintermedius and Staphylococcus schleiferi. The extensive literature review was carried out by the University of Copenhagen under the contract OC/EFSA/ALPHA/2020/02 – LOT 1.2 On 3 November 2020, two different search strings (Appendix A) were applied in PubMed and Embase, respectively, resulting in the identification of 1,698 unique abstracts published since 2010. Upon import into the Rayyan software (https://rayyan.ai/terms/show), these abstracts were screened by a senior scientist following the criteria elaborated in the protocol for the inclusion and exclusion of studies. When available, the full text of the abstracts was downloaded into the Endnote software. In addition, the most recent national antimicrobial resistance (AMR) monitoring reports from Denmark, Finland, France, Germany, Norway and Sweden were downloaded. Only the latest version of the surveillance reports was included in the review, since isolates included in these reports can be assumed to originate from the same sampled populations and most recent versions would therefore include the most up‐to‐date AMR data. AMR data in the full texts and national reports were evaluated for eligibility applying the exclusion criteria as described in the ad hoc method followed for the assessment of animal diseases caused by bacteria resistant to antimicrobials within the AHL framework (EFSA AHAW Panel, 2021), with the following modifications of the standard methodology:
Exclusion criterion 2: studies that do not report AMR data separately for cats and dogs (i.e. it was not possible to determine the species of origin of each isolate) were considered acceptable.
Exclusion criterion 3: studies reporting AMR data at the genus level were accepted for Klebsiella spp., Enterobacter spp., Enterococcus spp. and Proteus spp., since species within the genus have the same breakpoints and data were often reported this way.
Exclusion criterion 8: the minimum number of isolates in a study to be considered acceptable was set at 50 for S. pseudintermedius and E. coli and at the default of 10 or more for the other bacterial species.
Information extracted from the eligible assessed full‐text reports/publications is described in the scientific opinion describing the ad hoc method applied in the assessment (EFSA AHAW Panel, 2021).
Information on all the full‐text studies that were assessed, including the reason for exclusion for those that were excluded at the full‐text screening, is presented in Appendix B.
AMR was assessed for clinically relevant antimicrobials according to the method detailed in Section 2.1.3 of the ad hoc method for the assessment of animal diseases caused by bacteria resistant to antimicrobials within the AHL (EFSA AHAW Panel, 2021). The list of clinically relevant antibiotics for each target bacterial species in dogs/cats considered in this opinion are shown in Appendix C. When more than one antimicrobial from a given class was considered eligible for inclusion in the report, the following order of preference for each antimicrobial class and bacterial pathogen was considered:
For methicillin in staphylococci, data for oxacillin, cefoxitin and the presence of the mecA gene were accepted. In case data for more than one of these antimicrobials were available in the same study, we included the one for which more isolates were tested. In case the same number of isolates was tested for each antimicrobial, the order of preference for selection was mecA > oxacillin > cefoxitin.
For third‐generation cephalosporins (3GC) in Enterobacterales (as an indicator of extended‐spectrum beta‐lactamase (ESBL)/AmpC), the order of preference was cefpodoxime > cefotaxime > ceftazidime > ceftriaxone > ceftiofur > other methods (data from a double disk synergy test) (EUCAST, 2017). In case data for more than one of these antimicrobials were available in the same study, we included the one for which more isolates were tested.
For fluoroquinolones, the order of preference was enrofloxacin > ciprofloxacin.
For lincosamide in staphylococci, the order of preference was clindamycin > lincomycin.
For tetracycline in staphylococci, the order of preference was doxycycline > tetracycline > oxytetracycline.
For polymyxin in Pseudomonas aeruginosa, the order of preference was polymyxin B > colistin.
For penicillin in enterococci, the order of preference was ampicillin > amoxicillin > penicillin.
For penicillin in Clostridia, the order of preference was ampicillin > amoxicillin.
For each study, when clinical breakpoints were used, AMR data were extracted as percentages of resistant isolates (%R) and/or as percentages of non‐susceptible isolates by combining resistant and intermediate (I) isolates (%R + I). For some drugs (e.g. sulfonamide‐trimethoprim (TMP)), there is no I category for most bacteria, hence only %R was reported. Similarly, when the presence of mecA was used as an indication of methicillin resistance (MR), the proportion of isolates carrying the gene was reported as the %R. Moreover, the following decisions were made when evaluating datasets:
When no information on the I category was provided in a study, we considered that the reported %R only comprised resistant isolates (i.e. I isolates had not been included in the R category).
When the percentage of susceptible isolates (%S) was reported with no information on I, it was not possible to calculate %R. Instead, we calculated %R + I as 100% – %S.
When %I was reported separately, we extracted that along with %R (see Appendix B), but used only %R for the analyses of this opinion.
When epidemiological cut‐offs (ECOFFs) were used, proportions of non‐wild‐type isolates were reported as %R + I, as the I category is always part of the non‐wild‐type population.
3. Assessment
3.1. ToR 1: global state of play as regards resistant bacterial animal pathogens that cause transmissible animal diseases
3.1.1. General overview of studies included and excluded
After screening 1,698 abstracts, 377 publications (including seven national AMR surveillance reports) were selected for full‐text evaluation since they were considered eligible according to the criteria described above and in the ad hoc method for the assessment of animal diseases caused by bacteria resistant to antimicrobials within the AHL (EFSA AHAW Panel, 2021). Of these, 279 (75%) publications were excluded due to one or more of the exclusion criteria listed in Section 2.1.4 of the ad hoc method for the assessment of animal diseases caused by bacteria resistant to antimicrobials within the AHL (EFSA AHAW Panel, 2021). The most common reasons for exclusion were that the study was performed on a subset of selected resistant clinical isolates that are thus not representative of the degree of resistance in the pathogen (66 studies), the number of isolates included was below the pre‐established thresholds (50 for E. coli and S. pseudintermedius, 10 for the other species; 62 studies), no availability of the full text (40 studies), and that the percentage of resistant isolates was not provided and could not be calculated (e.g. data were provided in data charts; 37 studies) (Table 1).
Table 1.
Main reasons for exclusion of studies after full‐text evaluation affecting more than one study (a study could be excluded for more than one reason)a
| Reason | Code in Appendix B | Number of studies |
|---|---|---|
| Study investigating AMR in a subset of resistant clinical isolates | 17b | 66 |
| Fewer than the minimum number of isolates are included in the study | 8 | 63 |
| Full text not available | 10 | 40 |
| Percentage of resistant isolates not reported | 7 | 38 |
| Same animals sampled repeatedly | 6 | 29 |
| AMR data from multiple host species (other than cats and dogs) reported together | 2 | 28 |
| Inclusion of non‐clinical isolates that cannot be distinguished from clinical isolates | 5 | 25 |
| AMR data reported at bacterial genus level or above (except for Klebsiella, Enterobacter, Enterococcus and Proteus) | 3 | 14 |
| Minimum inhibitory concentration data reported without interpretation | 12 | 10 |
| Study does not follow a standard for antimicrobial susceptibility testing or a standard is not reported | 4 | 7 |
| AMR data included in another included study | 9 | 6 |
| Study on clinical outcome related to AMR | 17b | 6 |
| Data for individual antimicrobials cannot be extracted | 1 | 3 |
| Antimicrobials included are not used for treatment of host species according to available treatment guidelines | 13 | 3 |
After the exclusion of these references, 91 studies and the seven national reports from Denmark, Finland, France, Norway, Germany, Sweden and Switzerland were found eligible and were subsequently used to extract the data of interest. An overview of the number of eligible studies for each target bacterium is shown in Table 2 (data at the genus level were accepted for Klebsiella, Proteus and Enterococcus as explained in the methodology section).
Table 2.
Number of eligible studies from which AMR data were extracted, by target bacterial species
| Bacterial species | Number of eligible studies for data extraction (n = 98)* |
|---|---|
| Staphylococcus pseudintermedius | 44 |
| Escherichia coli | 37 |
| Pseudomonas aeruginosa | 20 |
| Staphylococcus aureus | 14 |
| Proteus spp. | 10 |
| Klebsiella spp. | 7 |
| Staphylococcus schleiferi | 4 |
| Enterococcus spp. | 3 |
| Enterobacter spp. | 2 |
| Bordetella bronchiseptica | 1 |
| Clostridium perfringens | 1 |
| Clostridioides difficile | 0 |
One study could provide information on more than one bacterial species.
Figure 1 provides an overview of the 98 studies included (some with data on more than one bacterial species) sorted by year of publication. Most included studies were published in 2020, which is due to the inclusion of only the most recent national reports.
Figure 1.

Date of publication of the 98 studies included in the extensive literature review
Considering geographical distribution, data from the included studies originated from 33 individual countries (5 studies reported data from isolates collected in multiple countries). The most represented countries were France, the United States and Italy, with 13, 12 and 11 studies including data from isolates collected in each country, respectively (Figure 2). Altogether, Europe was the most studied continent in the ELR, with 44 of the 98 included studies (45%) reporting AMR data for dogs and cats in this region, with between 3 and 27 studies performed on the other continents.
Figure 2.
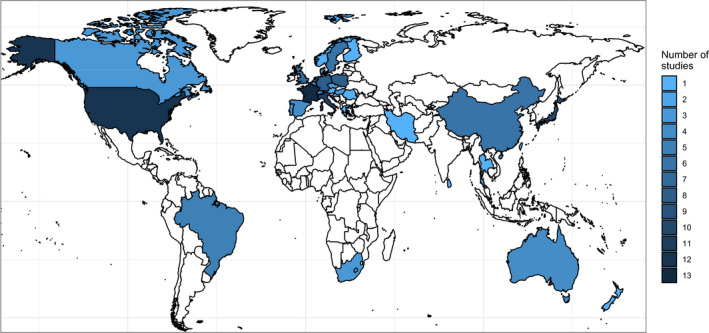
Geographical distribution of the 98 studies included
Isolates originated mostly from two main types of collection: (i) those generated through the analysis of samples collected from a clearly defined population of dogs or cats in a clinic, hospital, farm or similar (e.g. kennel) (n = 45 studies), and (ii) those coming from a diagnostic laboratory without background information on patients (n = 50 studies) (the origin was unclear for the remaining three studies).
3.1.2. AMR frequency data
The figures and tables in the following pathogen‐specific sections summarise AMR frequency data reported for dogs and cats from six continents.
It should be noted that the AMR frequency data are extremely difficult to compare, as study design, study populations, methods, interpretive criteria, etc., vary considerably between studies. The number of antimicrobial susceptibility testing (AST) results for any given antimicrobial extracted from the selected references (total of 244,513, Appendix B) varied enormously between bacterial species considered, with the first two accounting for almost 84% of all results (E. coli: 121,325; S. pseudintermedius: 83,106) and over 1,000 AST results for only four other species (P. aeruginosa: 15,115; P. mirabilis: 11,819; S. aureus: 6,365; S. schleiferi: 4,147). The laboratory methods used to determine the AST result also varied widely between studies, although the most common ones (accounting for 97% of all results) were disk diffusion (125,717 determinations), broth microdilution (88,130 results), gene identification by polymerase chain reaction (PCR) (12,292) and agar dilution (11,267), with the remaining results often coming from a combination of some of these methods (Appendix B).
In addition, AMR data from dogs and cats have been reported in the same tables and figures without distinguishing between the two species. This may give rise to bias for some antibiotic/infection combinations where breakpoints differ for dogs and cats. Therefore, the figures, tables and examples highlighted in the text below should be interpreted and cited with caution, as all specificities of individual studies cannot be taken into consideration. To correctly interpret information presented in the figures or tables (e.g. a high frequency of resistance in a certain country/continent), it is strongly recommended to consult the relevant papers and check whether results may be biased by factors such as previous antimicrobial treatment, sampling of animals in a certain environment, or the use of certain diagnostic methods or breakpoints.
3.1.3. Results of the ELR by bacterium
3.1.3.1. Staphylococcus pseudintermedius
Staphylococcus pseudintermedius resides in the skin and mucous membranes as a component of the normal flora of dogs and, to a lesser extent, of cats. It is an opportunistic pathogen, which mostly causes infections associated with the integumentary system. The vast majority of canine skin infections are caused by S. pseudintermedius. Other organs may also be affected by S. pseudintermedius, so that it is one of the most common pathogen of canine urinary tract infections (UTIs) after E. coli. A variety of drugs can be used to treat S. pseudintermedius infections, but lincosamides and beta‐lactams not affected by beta‐lactamase are most commonly recommended for systemic treatment of canine skin infections. Beta‐lactams and other drugs like potentiated sulfonamides are also commonly recommended first‐choice drugs for UTIs. A problem with recommending beta‐lactams is the recent emergence of methicillin‐resistant strains (MRSP). MRSP isolates are characterised by having the mecA gene, which causes resistance to all veterinary beta‐lactams. MRSP isolates are commonly multidrug resistant, especially the ST71 type, which has spread globally.
In total, 44 eligible studies with ≥ 50 S. pseudintermedius isolates and results for one or more of the relevant antibiotics (clindamycin/lincomycin, enrofloxacin/ciprofloxacin, gentamicin, doxycycline/tetracycline, methicillin/methicillin‐resistance surrogates, sulfonamide‐TMP) were included. Among these, 1, 11, 24, 3, 3 and 2 studies included isolates from Africa, Asia, Europe, Oceania, North America and South America, respectively.
The distribution of S. pseudintermedius isolates per animal species and site of infection is shown in Figure 3. The vast majority of isolates originated from dogs, and resistance was mostly reported together for isolates deriving from different body sites.
Figure 3.

- Mixed: isolates recovered from multiple sites reported together; SSTI: skin and soft tissue infections.
Figure 4 shows, for each continent, the proportion of resistance reported in individual studies with at least 50 S. pseudintermedius isolates. Information on proportions of resistance at country level is given in Appendix D.
Figure 4.

- Total number of studies by continent and antimicrobial is reported on the right side. Each circle represents one study and the size of each circle reflects how many isolates were included in the study. The colour of a circle illustrates whether the proportion represents resistance only (red circle) or resistance merged with the intermediate category (blue circle). The dashed lines indicate, for each antibiotic, the weighted arithmetic mean of %R (red dashed line) or %R + I (blue dashed line). The exact percentages these lines represent are listed in Appendix E.
From Figure 4, it should be noted that data are reported separately as either %R or %R + I depending on what data were available from each study. Although %R and %R + I data cannot be directly compared, it appears that there is little difference in the proportions reported for the blue (%R) and red (%R + I) circles. Only five studies (study IDs 52, 125, 157, 178 and 382 in Appendix B) reported data for the I category separately, meaning both %R and %R + I data could be differentiated. In these studies, the fraction of isolates with intermediate resistance to drugs varied from 0% to 18% (Appendix B), suggesting that the inclusion of the %I in the %R category could lead to significant changes in some cases. An arithmetic weighted average of resistance (no distinction between %R and %R + I) for each drug on each continent is provided in Table 3.
Table 3.
Weighted arithmetic mean, minimum and maximum proportions of resistance (%R or %R + I) and weighted standard deviation in S. pseudintermedius for the target antimicrobials on each continent
| Antibiotic | Continent | Number of papers | Number of isolates | Weighted arithmetic mean % of resistance | Minimum resistance % observed | Maximum resistance % observed | Weighted standard deviation |
|---|---|---|---|---|---|---|---|
| Fluoroquinolones | Africa | 1 | 278 | 6.9 | 6.9 | 6.9 | NA |
| Fluoroquinolones | Asia | 2 | 311 | 25.1 | 4.5 | 30.8 | 10.8 |
| Fluoroquinolones | Europe | 14 | 9,662 | 7.3 | 1 | 94.3 | 8.8 |
| Fluoroquinolones | Oceania | 3 | 1,902 | 3.7 | 1 | 7.9 | 3 |
| Fusidic acid | Asia | 2 | 296 | 4.7 | 0 | 27 | 10.3 |
| Fusidic acid | Europe | 5 | 6,904 | 13.3 | 6.1 | 38 | 6.1 |
| Gentamicin | Africa | 1 | 278 | 3.9 | 3.9 | 3.9 | NA |
| Gentamicin | Asia | 3 | 390 | 19.8 | 6 | 46 | 13.6 |
| Gentamicin | Europe | 12 | 10,182 | 8.2 | 1.7 | 58.6 | 6.1 |
| Gentamicin | Oceania | 1 | 831 | 1 | 1 | 1 | NA |
| Lincosamides | Africa | 1 | 278 | 31.7 | 31.7 | 31.7 | NA |
| Lincosamides | Asia | 3 | 493 | 46.9 | 20.1 | 78 | 26.7 |
| Lincosamides | Europe | 10 | 7,732 | 22.5 | 13 | 98.6 | 8.8 |
| Lincosamides | Oceania | 2 | 1,069 | 8.8 | 3.3 | 12.6 | 4.6 |
| Methicillin | Asia | 8 | 1,106 | 29.5 | 4 | 72.2 | 25.5 |
| Methicillin | Europe | 23 | 19,909 | 5.8 | 0 | 41.4 | 4.2 |
| Methicillin | North America | 3 | 274 | 32.2 | 21 | 41 | 8.8 |
| Methicillin | Oceania | 1 | 629 | 12.9 | 12.9 | 12.9 | NA |
| Methicillin | South America | 2 | 208 | 29.3 | 14.1 | 39.8 | 12.7 |
| Sulfa/TMP | Africa | 1 | 278 | 13.3 | 13.3 | 13.3 | NA |
| Sulfa/TMP | Asia | 1 | 79 | 60 | 60 | 60 | NA |
| Sulfa/TMP | Europe | 12 | 9,766 | 11.5 | 5 | 97.1 | 7.9 |
| Sulfa/TMP | Oceania | 2 | 1,069 | 28.5 | 16 | 37.2 | 10.4 |
| Tetracyclines | Africa | 1 | 278 | 13.7 | 13.7 | 13.7 | NA |
| Tetracyclines | Asia | 3 | 390 | 48.5 | 37.3 | 61 | 7.3 |
| Tetracyclines | Europe | 10 | 4,440 | 25.8 | 20.2 | 95.7 | 10.4 |
| Tetracyclines | Oceania | 1 | 629 | 22.5 | 22.5 | 22.5 | NA |
NA: Standard deviation cannot be calculated because only one study was included.
Overall, resistance to all drugs varied tremendously between studies and countries and even within countries. Such a large variation makes it difficult to emphasise one region/continent with particularly high or low resistance levels. MR has been predicted from either resistance to oxacillin or cefoxitin or the presence of the mecA gene. According to reports, MR is less common in Europe (average 7% of resistant isolates) than on other continents, especially Asia, where 34% of isolates exhibited MR. There are, however, some exceptions. For example, a study in Sri Lanka reported only 4% of isolates with MR, and the authors also noted that this result was surprisingly low given that antimicrobials are available over the counter in this country (Duim et al., 2018). An example of problems with data comparison across studies is the following: (Saputra et al., 2017) reported 12% MR in Australia, higher than the reported values of 6% MR in Denmark (DANMAP, 2019) and 2% MR in Sweden (Swedres‐Svarm, 2019). Despite having a somewhat similar study population (diagnostic lab data) and using the same method (broth microdilution) and breakpoint (≥ 0.5 μg/mL) for interpreting oxacillin resistance, MR in the Danish isolates may be overestimated because Australian and Swedish MRSP isolates were confirmed by mecA PCR, whereas the Danish isolates were not characterised further. It is well known that not all S. pseudintermedius isolates with oxacillin MIC ≥ 0.5 μg/mL are MRSP, and that was also the case for the Australian study with 5 of 81 oxacillin‐resistant isolates not having mecA. This highlights that data from these three studies should not be readily compared, since values from Denmark could be overestimated compared with what would have been obtained if exactly the same methodology had been followed.
Resistance to the lincosamides represented by clindamycin or lincomycin was generally high, exceeding 70% in some European and Asian studies. In Scandinavia, resistance was approximately 30%. Importantly, it was recently shown in Denmark that levels of clindamycin resistance were significantly lower in S. pseudintermedius from samples from non‐treated dogs with first‐time pyoderma than from samples from dogs submitted to the diagnostic laboratory in the absence of a known clinical history (Larsen et al., 2015). This finding justifies the recommendation of lincosamides for canine pyoderma in Denmark and illustrates a possible bias associated with AMR data from diagnostic laboratories, which may yield higher levels of resistance compared with those obtained from clinical isolates from non‐treated animals due to a high probability of originating from animals that have already been subjected to some antimicrobial treatment.
Resistance to sulfonamide‐TMP combinations also varied considerably between studies, even within Europe, ranging from 5% to 97%. One example of problems with comparing data is as follows: the proportion of sulfonamide‐TMP resistance reported in the Danish and Swedish national surveillance reports were 6% and 9%, respectively, but the interpretation for Swedish isolates was different from all other studies, as an ECOFF (≥ 1 μg/mL) was used instead of the human clinical breakpoint (≥ 4 μg/mL) used in all the other studies. Since Swedres‐Svarm (as one of few studies) publishes raw minimum inhibitory contribution (MIC) data (Swedres‐Svarm, 2019), it is possible to also interpret them according to other criteria. For this example, only 4% of clinical S. pseudintermedius isolates would be considered resistant if using the clinical breakpoint for sulfonamide‐TMP. It should be noted that this is just one example illustrating the issue of low comparability between reported AMR proportions. Similar in‐depth analyses have not been made for all other drugs reported here.
Resistance to fluoroquinolones was assessed using data for ciprofloxacin and enrofloxacin. The former is a human drug interpreted according to human clinical breakpoints, whereas the latter is a veterinary drug interpreted using animal‐specific clinical breakpoints or ECOFFs. Although results for these drugs are not fully comparable, studies testing both showed either identical results for the two drugs (Saputra et al., 2017) or minor variations (Awji et al., 2012). Accordingly, ciprofloxacin was considered a suitable alternative to enrofloxacin in the absence of data for the latter. Resistance to fluoroquinolones was below 15% in most studies, irrespective of geographical origin (Figures 4 and 5). However, one study from Italy (Casagrande Proietti et al., 2012) reported 94% of 70 isolates being resistant to enrofloxacin. There was no obvious bias in that study, which also reported unusually high levels of resistance to several other drugs.
Figure 5.

- Mixed: isolates recovered from multiple sites reported together; SSTI: skin and soft tissue infections.
Resistance to gentamicin was most frequently below 20%, except in two studies with proportions around 50%. Resistance to tetracycline and doxycycline was common with most studies reporting 20–60% resistance.
Fusidic acid is only registered for topical use in dogs and cats; hence the value of AST to guide treatment with this drug is very limited. Still, six studies tested this drug and reported resistance levels between 0% in Japan (Onuma et al., 2012) and 38% in Norway (Norm/Norm‐Vet, 2019).
3.1.3.2. Escherichia coli
Escherichia coli is an opportunistic pathogen residing in the intestinal microbiota of animals and humans. As in humans, E. coli is the leading cause of UTI in dogs and cats, accounting for 50–60% of those infections. Depending on the type and severity of infection, there are various recommendations for the treatment of E. coli infections. Typically, aminopenicillins and sulfonamides with trimethoprim are recommended as first‐choice drugs for UTIs, whereas fluoroquinolones and aminopenicillin with clavulanic acid are common recommendations for more severe infections. Nitrofurantoin is not registered for use in animals, but this drug, which is only suitable for treatment of UTIs due to its pharmacokinetic properties, is regularly recommended as an alternative drug when the first choices fail or resistance to those drugs is known. For the past two decades, extended‐spectrum cephalosporinase (ESC)‐producing Enterobacterales have emerged in animals. The most common types occurring in dogs and cats are the ESBL variants bla CTX‐M-1 and bla CTX‐M-15, as well as the plasmid‐encoded AmpC variant bla CMY‐2. Despite the in vitro susceptibility of ESBL producers to beta‐lactamase inhibitors, beta‐lactams are generally not recommended for treatment of infections caused by any ESC‐producing isolates. Furthermore, ESC producers are often co‐resistant to other drugs, thus limiting treatment options when these multidrug‐resistant isolates are discovered.
In total, 37 studies with ≥ 50 E. coli isolates and results for one or more of the relevant antibiotics (ampicillin/amoxicillin, enrofloxacin/ciprofloxacin, nitrofurantoin, sulfonamide‐TMP, 3GCs) were included. Among these, 1, 6, 18, 4, 8 and 0 studies included isolates from Africa, Asia, Europe, Oceania, North America and South America, respectively.
The distribution of E. coli isolates per animal species and site of infection is shown in Figure 5. The majority of isolates originated from dogs, and susceptibility data were mostly reported for UTIs.
Figure 6 shows, for each continent, the proportion of resistance reported in individual studies with at least 50 E. coli isolates. Information on proportion of resistance sorted by country is given in Appendix D.
Figure 6.

- Total number of studies by continent and antimicrobial is reported on the right side. Each circle represents one study and the size of each circle reflects how many isolates were included in the study. The colour of a circle illustrates whether the proportion represents resistance only (red circle) or resistance merged with intermediate (blue circle). The dashed lines indicate, for each antibiotic, the weighted arithmetic mean of %R (red dashed line) or %R + I (blue dashed line). The exact percentages these lines represent are listed in Appendix E.
Overall, resistance to all drugs varied tremendously between studies and countries and even within countries. Such a large variation makes it difficult to identify any one region or continent with particularly high or low resistance levels.
Considering the first‐line antibiotics for UTIs, resistance levels were relatively low in many studies for sulfonamide‐TMP combinations (Figure 6). The average proportion of resistance to potentiated sulfonamides was substantially higher in studies from Asia (52%) than other continents (range from 9% to 25%). Despite the many differences between studies, this difference appears genuine, as most studies used the same human CLSI breakpoint. One exception is the Swedish national report using ECOFFs with a cut‐off of > 1 mg/L for non‐susceptibility (Swedres‐Svarm, 2019). Despite this being twice as low as the CLSI breakpoint for resistance, only 5% of E. coli from dog and 3% from cat isolates in Sweden were resistant to this combination.
Resistance to aminopenicillins, another first‐line agent for UTIs, was somewhat higher than for sulfonamide‐TMP combinations. Data for ampicillin should, however, be interpreted with caution, as CLSI has very different veterinary breakpoints for UTIs (> 8 mg/L) and skin and soft tissue infections (SSTIs) (> 0.5 mg/L). In that regard, it was not always possible to determine whether data from a study with isolates of mixed origin were interpreted according to appropriate breakpoints or if only the UTI or SSTI/skin breakpoint was used. It is, however, clear that a few studies with isolates from skin (Ludwig et al., 2016; de Jong et al., 2020) reported 100% resistance to ampicillin for E. coli. This is a logical finding, since the very low CLSI SSTI/skin breakpoint is 16 times lower than the ECOFF (8 mg/L), and therefore even wild‐type organisms would be considered clinically resistant. Some studies used the human CLSI breakpoint for ampicillin, which is > 32 mg/L; hence resistance data from these studies are not comparable to studies using veterinary breakpoints or ECOFFs. One final reservation is that the CLSI breakpoint for cats is > 0.5 mg/L, irrespective of isolate origin, meaning no separate breakpoint for UTIs. Taken together, comparing susceptibility data for aminopenicillins is extremely complex, and Figure 6 is not able to give a comprehensive overview. Instead, studies must be assessed in more detail, also taking into account isolate origin and the other factors that vary between studies.
The breakpoints for amoxicillin–clavulanic acid are the same as for aminopenicillins without beta‐lactamase inhibitors, hence there are the same challenges of interpretation and comparison across studies. As expected, the addition of the beta‐lactamase inhibitor leads to higher susceptibility. In fact, resistance levels to amoxicillin–clavulanic acid in North America, Europe and Asia were around half of those observed for aminopenicillins alone (Table 4).
Table 4.
Weighted arithmetic mean, minimum and maximum proportion of resistance (%R or %R + I) and weighted standard deviation in E. coli for the target antimicrobials on each continent
| Antibiotic | Continent | Number of papers | Number of isolates | Weighted arithmetic mean % of resistance | Minimum resistance % observed | Maximum resistance % observed | Weighted standard deviation |
|---|---|---|---|---|---|---|---|
| 3GC | Asia | 5 | 599 | 20 | 0 | 33.3 | 11.6 |
| 3GC | Europe | 13 | 9,350 | 6.5 | 0.2 | 71.4 | 10.4 |
| 3GC | North America | 4 | 4,444 | 13.3 | 1.8 | 22 | 3.2 |
| 3GC | Oceania | 1 | 855 | 8.4 | 8.4 | 8.4 | NA |
| Aminopenicillins | Africa | 1 | 164 | 70.1 | 70.1 | 70.1 | NA |
| Aminopenicillins | Asia | 4 | 408 | 45 | 30 | 59.1 | 11.2 |
| Aminopenicillins | Europe | 12 | 8,716 | 33.1 | 12.1 | 100 | 19 |
| Aminopenicillins | North America | 8 | 12,486 | 37.2 | 8.8 | 62.9 | 10 |
| Aminopenicillins | Oceania | 2 | 1,013 | 37.8 | 37.2 | 41 | 1.4 |
| Amox/Clav | Africa | 1 | 163 | 58.3 | 58.3 | 58.3 | NA |
| Amox/Clav | Asia | 3 | 294 | 15.8 | 2.6 | 30.7 | 13.4 |
| Amox/Clav | Europe | 12 | 13,382 | 18.6 | 0 | 100 | 17.3 |
| Amox/Clav | North America | 7 | 12,408 | 22.2 | 2.7 | 40 | 11.4 |
| Amox/Clav | Oceania | 3 | 2,121 | 35.1 | 11.8 | 67.2 | 26.6 |
| Fluoroquinolones | Africa | 1 | 167 | 16.2 | 16.2 | 16.2 | NA |
| Fluoroquinolones | Asia | 6 | 703 | 45 | 5.3 | 92.5 | 31.4 |
| Fluoroquinolones | Europe | 14 | 8,820 | 8.3 | 2.1 | 39.3 | 9.6 |
| Fluoroquinolones | North America | 7 | 12,405 | 10.5 | 1.8 | 19.6 | 5.8 |
| Fluoroquinolones | Oceania | 4 | 2,267 | 4.4 | 2.3 | 8 | 2.3 |
| Nitrofurantoin | Europe | 2 | 2,056 | 1.1 | 1 | 1.6 | 0.2 |
| Sulfa/TMP | Africa | 1 | 166 | 24.7 | 24.7 | 24.7 | NA |
| Sulfa/TMP | Asia | 5 | 563 | 52.4 | 25 | 77.5 | 21.4 |
| Sulfa/TMP | Europe | 12 | 14,481 | 11.5 | 4.3 | 61.2 | 9 |
| Sulfa/TMP | North America | 6 | 12,030 | 10.1 | 0 | 17.9 | 5 |
| Sulfa/TMP | Oceania | 2 | 1,264 | 8.9 | 8 | 15 | 2.3 |
NA: Standard deviation cannot be calculated because only one study is included.
Resistance to 3GCs varied but was generally lower than for other antimicrobials considered here, and never exceeded 35%. The 3GCs were included mainly with the purpose of assessing levels of ESC‐resistant E. coli, but not all of the 3GCs are equally suited for the purpose, and some are more likely to detect one ESC resistance gene over another. As explained in the data and methodologies section, if a study lacked resistance data for all five target 3GCs, the proportion of ESBLs was calculated based on double disk synergy testing. Considering the diversity of data included under ‘3GC’ in Figure 6 and Table 4, data are rather incomparable. Despite this reservation, it is clear that 3GC resistance varies largely between studies – from 0% in Taiwan (Chang et al., 2015) and Norway (Norm/Norm‐Vet, 2019) to 33% in Japan (Tsuyuki et al., 2018).
Resistance to fluoroquinolones was assessed using data for ciprofloxacin and enrofloxacin. Although results for these drugs are not fully comparable, studies testing both agents showed fairly similar results with only minor variation between them (a few percentage points, data not shown). Therefore, in the following, both drugs are considered on equal terms. More than half of the studies reported less than 10% resistance to fluoroquinolones, and particularly low resistance levels (1–3%) were reported in three studies from Oceania. Generally, the highest levels of fluoroquinolone resistance were reported by the six Asian studies, with an average of 45%. Unlike for the other drugs, it therefore appears that there is a geographical trend concerning resistance to fluoroquinolones in E. coli.
Susceptibility of E. coli to nitrofurantoin was only tested in two studies from Sweden (Windahl et al., 2014; Swedres‐Svarm, 2019). Resistance levels were less than 2%, but the lack of data for other countries makes it difficult to extrapolate those data beyond Sweden.
3.1.3.3. Pseudomonas aeruginosa
Pseudomonas aeruginosa is an environmental organism that can reside in the intestine but is more commonly found on the integumentary system of human and animal hosts, with a preference for moist areas. It can cause various infections, but by far the most important in dogs is otitis externa. Its ability to produce biofilm and its intrinsic resistance are among the reasons why P. aeruginosa otitis in dogs can be very severe and difficult to treat. Mostly, topical treatment is recommended for P. aeruginosa otitis externa, but systemic treatment is sometimes necessary due to the severity of the infection. Fluoroquinolones are recommended for systemic treatment of these infections, but alternatives like gentamicin and polymyxin B or colistin are also possible. The main challenge of the latter three options is that they are not registered for systemic use in dogs; hence, the cascade rule must be employed.
In total, 20 studies with ≥ 10 P. aeruginosa isolates and results for one or more of the relevant antibiotics (enrofloxacin/ciprofloxacin, gentamicin, colistin/polymyxin B) were included. Among these studies 1, 5, 9, 1, 1 and 3 included isolates from Africa, Asia, Europe, Oceania, North America and South America, respectively.
The distribution of P. aeruginosa per animal species and site of infection is depicted in Figure 7. The vast majority of isolates originated from dogs, and most susceptibility data were reported for otitis.
Figure 7.

- Mixed: isolates recovered from multiple sites reported together; SSTI: skin and soft tissue infections.
Figure 8 shows, for each continent, the proportion of resistance reported in individual studies with at least 10 P. aeruginosa isolates, whereas average values are shown in Table 6. Information on proportion of resistance sorted by country is given in Appendix D.
Figure 8.

- Total number of studies by continent and antimicrobial is reported on the right side. Each circle represents one study and the size of each circle reflects how many isolates were included in the study. The colour of a circle illustrates whether the proportion represents resistance only (red circle) or resistance merged with intermediate (blue circle). The dashed lines indicate, for each antibiotic, the weighted arithmetic mean of %R (red line) or %R+I (blue dashed line). The exact percentages these lines represent are listed in Appendix E.
Table 6.
Weighted arithmetic mean, minimum and maximum proportion of resistance (%R or %R + I) and weighted standard deviation in S. aureus and S. schleiferi for the target antimicrobials in each continent/country
| Bacterium | Antibiotic | Continent/country | Number of papers | Number of isolates | Weighted arithmetic mean % of resistance | Minimum resistance % observed | Maximum resistance % observed | Weighted standard deviation |
|---|---|---|---|---|---|---|---|---|
| S. aureus | Fluoroquinolones | Africa | 1 | 36 | 2.8 | 2.8 | 2.8 | NA |
| Fluoroquinolones | Asia | 1 | 34 | 2.9 | 2.9 | 2.9 | NA | |
| Fluoroquinolones | Europe | 9 | 959 | 14.3 | 0 | 51.3 | 9.7 | |
| Fluoroquinolones | Oceania | 1 | 64 | 9.4 | 9.4 | 9.4 | NA | |
| Fusidic acid | Europe | 3 | 556 | 11.6 | 5 | 74.4 | 17.5 | |
| Gentamicin | Africa | 1 | 36 | 11.1 | 11.1 | 11.1 | NA | |
| Gentamicin | Asia | 1 | 34 | 35.3 | 35.3 | 35.3 | NA | |
| Gentamicin | Europe | 8 | 1,013 | 12.7 | 0 | 74.4 | 14.3 | |
| Lincosamides | Africa | 1 | 36 | 55.6 | 55.6 | 55.6 | NA | |
| Lincosamides | Europe | 4 | 655 | 25.2 | 4.4 | 100 | 19.7 | |
| Lincosamides | Oceania | 1 | 64 | 1.5 | 1.5 | 1.5 | NA | |
| Methicillin | Europe | 9 | 983 | 17.5 | 0 | 35.9 | 8.4 | |
| Methicillin | North America | 1 | 33 | 36.4 | 36.4 | 36.4 | NA | |
| Methicillin | Oceania | 1 | 64 | 14.1 | 14.1 | 14.1 | NA | |
| Sulfa/TMP | Africa | 1 | 36 | 25 | 25 | 25 | NA | |
| Sulfa/TMP | Europe | 9 | 980 | 13.8 | 0 | 100 | 18.3 | |
| Sulfa/TMP | Oceania | 1 | 64 | 4.7 | 4.7 | 4.7 | NA | |
| Tetracyclines | Africa | 1 | 36 | 27.8 | 27.8 | 27.8 | NA | |
| Tetracyclines | Asia | 1 | 34 | 38.2 | 38.2 | 38.2 | NA | |
| Tetracyclines | Europe | 6 | 584 | 25.9 | 10 | 60 | 6.1 | |
| Tetracyclines | Oceania | 1 | 64 | 9.4 | 9.4 | 9.4 | NA | |
| S. schleiferi | Fluoroquinolones | Europe | 1 | 240 | 3 | 3 | 3 | NA |
| Fluoroquinolones | North America | 2 | 442 | 49.1 | 45.8 | 52.5 | 3.4 | |
| Fusidic acid | Europe | 1 | 240 | 6 | 6 | 6 | NA | |
| Gentamicin | Europe | 1 | 240 | 0 | 0 | 0 | NA | |
| Gentamicin | North America | 2 | 442 | 48.1 | 47.2 | 49 | 0.9 | |
| Lincosamides | Asia | 1 | 20 | 10 | 10 | 10 | NA | |
| Lincosamides | Europe | 1 | 240 | 4 | 4 | 4 | NA | |
| Lincosamides | North America | 2 | 442 | 25.2 | 24.9 | 25.5 | 0.3 | |
| Methicillin | Asia | 1 | 20 | 30 | 30 | 30 | NA | |
| Methicillin | Europe | 1 | 240 | 0 | 0 | 0 | NA | |
| Methicillin | North America | 2 | 442 | 62.2 | 57.3 | 67.3 | 5 | |
| Sulfa/TMP | Europe | 1 | 240 | 1 | 1 | 1 | NA | |
| Sulfa/TMP | North America | 2 | 442 | 5.8 | 0.9 | 10.8 | 5 | |
| Tetracyclines | Europe | 1 | 240 | 3 | 3 | 3 | NA | |
| Tetracyclines | North America | 1 | 217 | 19 | 19 | 19 | NA |
NA: Standard deviation cannot be calculated because only one study is included.
For fluoroquinolones, resistance varied a lot between studies. It is noteworthy that one study (Arais et al., 2016) reported a large difference in proportion of resistance to enrofloxacin (26.0%) and ciprofloxacin (4.8%). By including intermediate isolates, the figures changed to 77.2% and 7.7%, respectively. A large proportion of isolates (47–82%) in three other studies (Mekic et al., 2011; Ludwig et al., 2016) also showed intermediate resistance to enrofloxacin. These findings suggest that for P. aeruginosa (i) the two fluoroquinolones are not readily comparable, and (ii) %R cannot be compared with %R + I for enrofloxacin. To illustrate this, the 73.0% enrofloxacin resistance reported among 154 canine isolates in South Africa (Eliasi et al., 2020) appears high compared with data from other continents (Figure 10), but this is impossible to conclude with no separate information on the intermediate category. Accordingly, available fluoroquinolone susceptibility data should be interpreted with caution.
Figure 10.

- Total number of studies by continent and antimicrobial is reported on the right side. Each circle represents one study and the size of each circle reflects how many isolates were included in the study. The colour of a circle illustrates whether the proportion represents resistance only (red circle) or resistance merged with intermediate (blue circle). The dashed lines indicate, for each antibiotic, the weighted arithmetic mean of %R (red line) or %R + I (blue dashed line). The exact percentages these lines represent are listed in Appendix E.
Susceptibility data for gentamicin should also be carefully evaluated, as one study (Mekic et al., 2011) reported 41.3% of isolates with intermediate resistance to that drug. As for fluoroquinolones, this hampers the comparison of the studies marked in red (%R + I) and blue (%R) in Figure 8.
The lowest level of resistance was reported for polymyxin B with five out of six studies reporting less than 10% resistance. Interestingly, two studies from Brazil reported 0% and 54.4% resistance in canine isolates, respectively (Penna et al., 2011; Arais et al., 2016). The reason for this discrepancy is unknown, as both studies appeared to use the same methods and interpretive criteria, and they both included dogs from the same geographical area (Rio de Janeiro).
3.1.3.4. Staphylococcus aureus and Staphylococcus schleiferi
Staphylococcus aureus and S. schleiferi can reside in the skin and mucous membranes of dogs and cats, and they mostly cause infections associated with the integumentary system. S. schleiferi comprises two subspecies, namely the coagulase‐negative S. schleiferi subsp. schleiferi and the coagulase‐positive S. schleiferi subsp. coagulans. They both occur in dogs and cats, although probably more commonly in dogs. S. aureus is more common in humans than in pets; hence, pets are likely to become colonised through contact with humans. This is particularly clear when studying methicillin‐resistant S. aureus (MRSA), as the MRSA variants most commonly detected in pets (e.g. ST22) are recognised human‐adapted MRSA types. While S. pseudintermedius is very predominant in dogs, S. aureus appears to be distributed more equally between cats and dogs.
In total, 14 and 4 studies with ≥ 10 S. aureus and S. schleiferi isolates, respectively, and results for one or more of the relevant antibiotics (clindamycin/lincomycin, enrofloxacin/ciprofloxacin, gentamicin, doxycycline/tetracycline, methicillin/methicillin‐resistance surrogates, sulfonamide‐TMP) were included. Among these studies, 1, 2, 11, 1, 3 and 0 included isolates from Africa, Asia, Europe, Oceania, North America and South America, respectively.
The distribution of S. aureus and S. schleiferi per animal species and site of infection is depicted in Figure 9. The vast majority of isolates originated from dogs, and most susceptibility data were reported for a mixture of infections.
Figure 9.

- Mixed: isolates recovered from multiple sites reported together; SSTI: skin and soft tissue infections.
Figure 10 shows for each continent the proportion of resistance reported in individual studies with at least 10 S. aureus isolates, whereas average values for both S. aureus and S. schleiferi are shown in Table 7. Information on the proportion of resistance sorted by country is given in Appendix D. Most data are available from studies in Europe with only sporadic studies from other continents. MR varied from 0% to 36.4% with the lowest proportion of resistance occurring among 23 canine respiratory isolates from different countries in Europe (Moyaert et al., 2019) and the highest among 33 cat isolates from the USA (Lane et al., 2018). An almost equally high MR level (35.9%) was detected in an Italian study of 39 canine isolates (Ghidini et al., 2011). This study is noteworthy because very high levels of resistance were observed for clindamycin (100%), enrofloxacin (51.3%), fusidic acid (74.4%), gentamicin (74.4%) and sulfonamide‐TMP (89.7%). One potential reason for this was that it reported %R + I, unlike most other studies, which reported %R. Another explanation might be that the dogs in that study had been referred to a veterinary teaching hospital; hence, they had most likely undergone antimicrobial treatment prior to sampling. It should be mentioned that this was not necessarily specific to this single study, as veterinary specimens are often submitted to diagnostic labs only after failure of empirical antimicrobial treatment.
Table 7.
Weighted arithmetic mean, minimum and maximum proportion of resistance (%R or %R + I) and weighted standard deviation in Proteus, Enterobacter spp. and Klebsiella spp. for the target antimicrobials in each continent
| Bacterium | Antibiotic | Continent | Number of papers | Number of isolates | Weighted arithmetic mean % of resistance | Minimum resistance % observed | Maximum resistance % observed | Weighted standard deviation |
|---|---|---|---|---|---|---|---|---|
| Proteus spp. | 3GC | Asia | 2 | 138 | 10.8 | 1.9 | 37 | 15.3 |
| 3GC | Europe | 4 | 1,165 | 4 | 1.8 | 75 | 8.6 | |
| Aminopenicillins | Asia | 2 | 138 | 24.5 | 8.7 | 71 | 27.2 | |
| Aminopenicillins | Europe | 3 | 1,144 | 27.9 | 9.1 | 28.9 | 4.2 | |
| Amox/Clav | Europe | 6 | 1,581 | 11.3 | 3.9 | 68.7 | 6.4 | |
| Amox/Clav | Oceania | 1 | 356 | 3.7 | 3.7 | 3.7 | NA | |
| Fluoroquinolones | Asia | 1 | 103 | 12.6 | 12.6 | 12.6 | NA | |
| Fluoroquinolones | Europe | 5 | 2,464 | 10.8 | 3.6 | 26.2 | 5 | |
| Fluoroquinolones | Oceania | 1 | 357 | 0.3 | 0.3 | 0.3 | NA | |
| Nitrofurantoin | Europe | 1 | 55 | 90.9 | 90.9 | 90.9 | NA | |
| Sulfa/TMP | Asia | 2 | 138 | 25.5 | 10.7 | 69 | 25.5 | |
| Sulfa/TMP | Europe | 7 | 2,595 | 23.2 | 10.9 | 87.5 | 6.8 | |
| Sulfa/TMP | Oceania | 1 | 356 | 5.3 | 5.3 | 5.3 | NA | |
| Enterobac‐ter spp. | 3GC | Asia | 1 | 60 | 33.3 | 33.3 | 33.3 | NA |
| 3GC | Europe | 1 | 422 | 5.2 | 5.2 | 5.2 | NA | |
| Aminopenicillins | Asia | 1 | 60 | 93.3 | 93.3 | 93.3 | NA | |
| Amox/Clav | Asia | 1 | 60 | 93.3 | 93.3 | 93.3 | NA | |
| Fluoroquinolones | Asia | 1 | 60 | 43.3 | 43.3 | 43.3 | NA | |
| Klebsiella spp. | 3GC | Asia | 3 | 80 | 42.6 | 12.5 | 53 | 15.4 |
| 3GC | Europe | 4 | 892 | 14.9 | 0 | 100 | 21.6 | |
| Aminopenicillins | Asia | 2 | 50 | 81.9 | 62.5 | 91 | 13.4 | |
| Aminopenicillins | Europe | 1 | 11 | 100 | 100 | 100 | NA | |
| Amox/Clav | Asia | 2 | 50 | 30.3 | 21 | 50 | 13.7 | |
| Amox/Clav | Europe | 2 | 47 | 76.6 | 27.3 | 91.7 | 27.6 | |
| Fluoroquinolones | Asia | 2 | 50 | 25.8 | 12.5 | 32 | 9.2 | |
| Fluoroquinolones | Europe | 2 | 35 | 71.4 | 9.1 | 100 | 42.8 | |
| Nitrofurantoin | Europe | 1 | 11 | 72.7 | 72.7 | 72.7 | NA | |
| Sulfa/TMP | Asia | 1 | 34 | 53 | 53 | 53 | NA | |
| Sulfa/TMP | Europe | 2 | 47 | 72.4 | 9.1 | 91.7 | 35.4 |
NA: Standard deviation cannot be calculated due to only one study being included.
Susceptibility data for S. schleiferi were available from only four studies. Most remarkably, resistance levels were exceptionally low in Sweden (Swedres‐Svarm, 2019) with 0–6% resistance reported for the six antibiotics tested in 240 isolates. This low resistance was reported despite reporting %R + I rather than %R. Two American studies found MR in 57.3% and 67.3% of the 225 and 217 isolates they included, respectively (Cain et al., 2011; Kunder et al., 2015).
3.1.3.5. Proteus mirabilis, Klebsiella spp. and Enterobacter spp.
Proteus mirabilis, Klebsiella spp. and Enterobacter spp. are opportunistic pathogens residing in the intestinal tract. Although they occur with lower frequency than E. coli, they are generally capable of causing the same types of infection in dogs and cats. For example, one study showed that each of these species accounts for less than 10% of UTIs in dogs (Lin et al., 2012). This overlap with E. coli also means that the treatment recommendations for infections caused by these bacteria are the same as for E. coli. Proteus mirabilis is special in the sense that it is among the most common aetiological agents isolated from otitis externa in dogs. However, Proteus ear infections in dogs are rarely treated with systemic antibiotics, hence no additional antibiotics for this infection type will be considered here.
In total, only 2, 7 and 10 studies with ≥ 10 Enterobacter spp., Klebsiella spp. and Proteus mirabilis isolates, respectively, and results for one or more of the relevant antibiotics (ampicillin/amoxicillin, enrofloxacin/ciprofloxacin, nitrofurantoin, sulfonamide–trimethoprim, 3GCs) were included. Among these studies, 0, 6, 10, 1, 0 and 0 included isolates from Africa, Asia, Europe, Oceania, North America and South America, respectively.
The distribution of Klebsiella spp., Enterobacter spp. and P. mirabilis isolates per animal species and site of infection is depicted in Figure 11. The vast majority of isolates originated from dogs, and most susceptibility data were reported for a mixture of infections. The reason for that is probably a shortage of isolates in diagnostic laboratories; hence it would not make sense to report few isolates for a single infection type separately.
Figure 11.

- Mixed: isolates recovered from multiple sites reported together; SSTI: skin and soft tissue infections.
Figure 12 shows, for each continent, the proportion of resistance reported in individual studies with at least 10 Proteus mirabilis, Klebsiella spp. and Enterobacter spp. isolates, whereas average values are shown in Table 5. Information on proportion of resistance sorted by country is given in Appendix D. The data set should be interpreted with care due to the few studies per continent.
Figure 12.

- Total number of studies by continent and antimicrobial is reported on the right side. Each circle represents one study and the size of each circle reflects how many isolates were included in the study. The colour of a circle illustrates whether the proportion represents resistance only (red circle) or resistance merged with intermediate (blue circle). The dashed lines indicate, for each antibiotic, the weighted arithmetic mean of %R (red dashed line) or %R + I (blue dashed line). The exact percentages these lines represent are listed in Appendix E.
Table 5.
Weighted arithmetic average, minimum and maximum proportion of resistance (%R or %R + I) and weighted standard deviation in P. aeruginosa for the target antimicrobials on each continent
| Antibiotic | Continent | Number of papers | Number of isolates | Weighted arithmetic average % of resistance | Minimum resistance % observed | Maximum resistance % observed | Weighted standard deviation |
|---|---|---|---|---|---|---|---|
| Fluoroquinolones | Africa | 1 | 154 | 73 | 73 | 73 | NA |
| Fluoroquinolones | Asia | 5 | 426 | 17.7 | 9 | 35.4 | 10.1 |
| Fluoroquinolones | Europe | 7 | 2,651 | 56.4 | 8 | 67.7 | 22.1 |
| Fluoroquinolones | North America | 1 | 1,585 | 68.5 | 68.5 | 68.5 | NA |
| Fluoroquinolones | Oceania | 1 | 1,227 | 36 | 36 | 36 | NA |
| Fluoroquinolones | South America | 3 | 292 | 51.4 | 26 | 80 | 19.4 |
| Gentamicin | Africa | 1 | 154 | 18 | 18 | 18 | NA |
| Gentamicin | Asia | 4 | 380 | 9.7 | 4.1 | 26.3 | 9 |
| Gentamicin | Europe | 9 | 3,085 | 16.6 | 2 | 56.5 | 9.2 |
| Gentamicin | North America | 1 | 1,585 | 17.7 | 17.7 | 17.7 | NA |
| Gentamicin | Oceania | 1 | 1,206 | 5 | 5 | 5 | NA |
| Gentamicin | South America | 3 | 292 | 44.6 | 4.8 | 71.4 | 31.6 |
| Polymyxin B/Colistin | Asia | 1 | 80 | 3.8 | 3.8 | 3.8 | NA |
| Polymyxin B/Colistin | Europe | 2 | 471 | 0.8 | 0 | 1 | 0.4 |
| Polymyxin B/Colistin | Oceania | 1 | 1,256 | 7 | 7 | 7 | NA |
| Polymyxin B/Colistin | South America | 2 | 271 | 33.5 | 0 | 54.4 | 26.5 |
NA: Standard deviation cannot be calculated because only one study is included.
For Proteus mirabilis the highest levels of resistance to sulfonamide–TMP (87.5%), 3GC (75.0%) and amoxicillin–clavulanic acid (87.5%) were reported from an Italian study by Rampacci et al. (2018), but this was based on only 16 isolates.
For Klebsiella spp. (K. pneumoniae and K. oxytoca), the most remarkable finding was in a hospital outbreak study from France (Haenni et al., 2012) reporting 100% of 24 K. pneumoniae isolates being resistant to both 3GCs and fluoroquinolones. Typing a subset of those isolates showed that they were genetically indistinguishable, belonging to ST15 and harbouring bla CTX‐M-15. This emphasises the challenge of including data from studies representing very few – or even a single – study unit such as a hospital. Data per continent is displayed in Figure 12 and Table 7.
One of the two studies on Enterobacter spp. (E. cloacae) showed that 3.5% and 10.2% of 314 dog and 108 cat isolates, respectively, in France were resistant to 3GCs, and all isolates were confirmed by PCR to harbour an ESBL gene (Haenni et al., 2016). The other study showed that 33.3% and 43.3% of Enterobacter spp. isolates were resistant to 3GC and ciprofloxacin, respectively (Harada et al., 2017).
3.1.3.6. Enterococcus faecalis and Enterococcus faecium
Enterococci are found in the intestinal tract of animals and humans and regarded as opportunistic pathogens. They may cause a variety of diseases, but in pets are typically associated with ear infections and UTIs. Care should be taken when assessing growth of enterococci, as they often occur as contaminants in mixed cultures.
No eligible studies were found for E. faecium, whereas one American and one Swedish study (on E. faecalis and Enterococcus spp., respectively) reported more than 50% resistance to enrofloxacin and less than 20% resistance to ampicillin (Windahl et al., 2014; KuKanich and Lubbers, 2015). A third study (Rampacci et al., 2018) reported that almost all 39 tested E. faecalis isolates were resistant to sulfonamide‐TMP (Figure 13). This is an expected result, as enterococci are known to be intrinsically resistant to folic acid synthesis inhibitors.
Figure 13.

- Total number of studies by continent and antimicrobial is reported on the right side. Each circle represents one study and the size of each circle reflects how many isolates were included in the study. The colour of a circle illustrates whether the proportion represents resistance only (red circle) or resistance merged with intermediate (blue circle). The dashed lines indicate, for each antibiotic, the weighted arithmetic mean of %R (red line) or %R + I (blue dashed line). The exact percentages these lines represent are listed in Appendix E.
3.1.3.7. Bordetella bronchiseptica
Bordetella bronchiseptica is a respiratory pathogen capable of causing upper and lower respiratory infections in dogs and cats. The organism appears more likely to cause infection in stressful or crowded conditions, e.g. when animals are housed in shelters or kennels.
Only one eligible study (Rheinwald et al., 2015) reported susceptibility data for B. bronchiseptica. The study showed that all 23 tested isolates were susceptible to doxycycline, which is generally the preferred drug for respiratory infections caused by this pathogen. Further, 0%, 8.7% and 61.5% of isolates were resistant to enrofloxacin, amoxicillin– clavulanic acid and ampicillin, respectively. It should be noted that the study was close to being considered ineligible, as it referred to ‘current CLSI guidelines’ without specifying the actual document(s) used to standardise the method and interpretation of susceptibility testing.
3.1.3.8. Clostridium perfringens and Clostridioides difficile
The role of clostridia (C. perfringens and C. difficile) in gastrointestinal infections of dogs and cats is uncertain, as the bacteria may be found in both healthy and diseased animals (e.g. up to 80% intestinal carriage is reported in both healthy and diarrhoeic dogs). Toxigenic strains, more commonly found in diarrhoeic than in healthy animals, may have a potential role as pathogens.
No eligible studies reported resistance in C. difficile, whereas a single study reported resistance in C. perfringens isolated from dogs with diarrhoea (Gobeli et al., 2012). In that study, none of the 50 isolates tested (with various combinations of toxins) displayed resistance to the clinically relevant antibiotics ampicillin and metronidazole. It should be noted that the dogs all originated from the same veterinary practice in Switzerland, and there are no veterinary breakpoints for this anaerobic bacterium; hence, data should be interpreted carefully and not extrapolated to other geographical areas.
3.1.4. Assessment of data from national AMR surveillance reports
Seven national AMR reports (DANMAP – Denmark, NORMVET – Norway, FINRES – Finland, SWEDRES‐Svarm – Sweden, RESAPATH – France, ANRESIS/ARCH‐Vet – Switzerland and GERM‐Vet – Germany) reporting relevant data on antimicrobial resistance in one or more of the pathogens of interest in this opinion were also included in the literature review. Data from the latest reports published at the time the ELR were conducted are included in Appendix B and were used to describe the global state of play in the previous sections. Additional detail on the information available in each report, with a focus on historic data (up to the previous five years), and the differences/similarities with the results presented in Section 3.1.3 follows. Data provided in all reports except one were obtained from isolates that were either directly isolated and tested for resistance in a specific laboratory that received the clinical samples, or to which isolates were submitted from other laboratories for AST. In the remaining report (RESAPATH), AST results submitted to 71 laboratories (in 2018) were presented together. Assessment of changes in AMR over time in the pathogens under evaluation based on the data in the reports is hampered in certain cases by the lack of consistent reporting over the years (i.e. only data from specific years were reported) and/or because data on isolates retrieved over several years were presented together. Furthermore, between‐country comparisons must be performed carefully, since different methodologies are applied to obtain the results presented in each report, and results provided here are those provided in the reports (e.g. without accounting for the use of different breakpoints). A comparison of the methodology, bacterial pathogens, number of isolates and temporal coverage of the information provided in the last five reports of each monitoring programme is provided below (Table 8), and additional details on each programme follow.
Table 8.
AMR methodology, bacterial species, host species, number of isolates and temporal coverage of the information on pathogens of interest from cats and dogs provided in the seven national AMR surveillance reports (up to the last five) reviewed in this opinion
| Programme | DANMAP | NORMVET | FINRES | SWEDRES‐Svarm | RESAPATH | ANRESIS | GERM‐Vet |
|---|---|---|---|---|---|---|---|
| Country | Denmark | Norway | Finland | Sweden | France | Switzerland | Germany |
| Laboratory method | Broth microdilution | Broth microdilution | Disk diffusion | Broth microdilution | Disk diffusion | Broth microdilution | Broth microdilution |
| AST interpretation | Clinical breakpoints | ECOFFs | Clinical breakpoints | ECOFFs | ECOFFs | Clinical breakpoints | Clinical breakpoints |
| S. pseudintermedius | Yes | Yes | Yes | Yes | Yes | Yes | Yes |
| Origin (number of isolates) | Cats and dogs (1,763) | Dogs (157) | Dogs (396–936/year) | Dogs (376–1,005/yearb) | Dogs (198–1,138/yearb) | Dogs (22) | Dogs (29–124/year) |
| Years covereda | 2011–12 and 2016– 19 | 2017–2018 | 2014–2019 | 2014–2018 | 2017–2018 | 2019 | 2014–2018 |
| E. coli | Yes | Yes | Yes | Yes | Yes | Yes | Yes |
| Origin (number of isolates) | Cats and dogs (1,177) | Dogs (132) | Cats (50–211/year) Dogs (310–1,041/year) | Cats (455–545/year) Dogs (943–1,162/year) | Cats (322– 1,351/year) Dogs (41–1,539/yearb) | Cats (35) Dogs (40) | Cats and dogs (59– 131/year) |
| Years covereda | 2011–12 and 2016–19 | 2016–2018 | 2014–2019 | 2014–2018 | 2014–2018 | 2019 | 2014–2018 |
| P. aeruginosa | No | No | Yes | Yes | No | No | No |
| Origin (number of isolates) | Dogs (105) | Dogs (306–389/year) | |||||
| Years covereda | 2018 | 2014–2018 | |||||
| S. schleiferi | No | No | Yes | No | No | No | |
| Origin | Dogs (163–297/year) | ||||||
| Years covereda | 2014–2018 | ||||||
| S. aureus | No | No | No | No | Yes | No | Yes |
| Origin (number of isolates) | Dogs (246–488/year) | Cats and dogs (10– 24/year) | |||||
| Years covereda | 2017–2018 | 2014–2018 | |||||
| P. mirabilis | No | No | No | No | Yes | No | No |
| Origin (number of isolates) | Dogs (366–384/year) | ||||||
| Years covereda | 2015–2018 |
AST: antimicrobial susceptibility testing; ECOFF: epidemiological cut‐off.
Among those reported in the last five published reports.
Number of isolates provided stratified by clinical specimen.
3.1.4.1. DANMAP (Denmark)
Since there is no systematic surveillance system for AMR in cats and dogs, data included in the report (DANMAP, 2019) came from a study conducted using 1,177 E. coli and 1,763 S. pseudintermedius isolates from cat and dog clinical samples submitted in 2011–2012 and 2016–2019 to the Veterinary Diagnostic Microbiology Laboratory at the University of Copenhagen, which receives samples from the whole country. Resistance data were generated using broth microdilution methods and interpreted according to veterinary CLSI clinical breakpoints. Two periods (before/after 2012) were considered to assess the potential impact of the release of the national guidelines for antimicrobial treatment of companion animals (launched in late 2012), and resistance data are provided separately for isolates from 2011–2012, 2016–2017 and 2018–2019 (with 2018–2019 being included in Appendix B).
When considering the evolution of resistance, no major overall fluctuations over time were found: for S. pseudintermedius similar values in the proportion of resistant isolates were obtained in all sampling periods for which data were available for fluoroquinolones (2–3% resistance depending on the year), gentamicin (2–3%), lincosamides (25–28%), oxacillin (surrogate for MR) (6–8%), sulfonamide‐TMP(5–6%) and tetracyclines (29–33%). These values were similar to the weighted arithmetic means provided for these antimicrobials in Table 3 for European countries, except for fluoroquinolones and aminoglycosides; lower values were found in Danish isolates, although this is not surprising given the high dispersion of results from European countries as expressed by the large weighted standard deviations for these antimicrobial classes (Table 3).
Similarly, in the case of E. coli, no clear trends in the percentage of resistant isolates in all sampling periods were reported for 3GC (4–7% resistance depending on the year), aminopenicillins (with a larger change over the periods considered, 14–28%), amoxicillin/clavulanic acid (4–9%) and fluoroquinolones (3–8%), while a decrease from 15% in 2011–2012 to 7–9% in 2016–2017 and 2018–2019 for sulfonamide‐TMP was found. This decrease was attributed to the withdrawal of the only sulfonamide‐TMP product licensed for dogs and cats in 2014. Compared with the weighted arithmetic means for isolates in Europe presented in Table 4, values recorded in clinical E. coli included in the DANMAP report were close for all antimicrobials except amoxicillin/clavulanic acid, for which lower values were found.
3.1.4.2. NORMVET (Norway)
Isolates subjected to AST from dogs included in the NORMVET report (Norm/Norm‐Vet, 2019) were retrieved from clinical submissions sent to the Norwegian Veterinary Institute and included S. pseudintermedius and E. coli. Resistance data were generated using broth microdilution, and results were interpreted according to the ECOFFs recommended by the European Committee on Antimicrobial Susceptibility Testing (EUCAST). Although isolates were retrieved over several years (2017 and 2018 for S. pseudintermedius, 2016– 2018 for E. coli), sample size was reduced (89 E. coli isolates from UTIs and 43 from other infections, 157 S. pseudintermedius isolates) and the proportion of resistant isolates is provided grouped; therefore, it is not possible or feasible to assess the existence of changes over time, since, in addition, previous reports have not included data on isolates from cats and dogs.
For S. pseudintermedius, the proportion of resistant isolates found was below (fluoroquinolones: 1.3%; gentamicin: 1.9%; lincosamides: 12.7%; presence of mecA gene (conferring MR): 4.4%) or close to the weighted arithmetic mean provided in Table 3 (tetracyclines: 26.8%), except for fusidic acid providing the maximum value (38.2%) registered for this antimicrobial in a European country.
In the case of E. coli, resistance levels in isolates retrieved from UTIs were lower than in isolates from other infections for the three antimicrobials included in the ELR in the report. With the weighted arithmetic mean found for E. coli, resistance levels in isolates retrieved from UTIs were lower than in isolates from other infections for the three target antimicrobials included in this opinion (3GC: 0 vs 7.0%; aminopenicillins: 20.2 vs 46.5%; fluoroquinolones: 4.5 vs 16.3%). The weighted arithmetic mean found for E. coli isolates from Europe presented in Table 4 falls between both estimates for the three antimicrobials.
3.1.4.3. FINRES (Finland)
Data on AMR from clinical isolates retrieved from cats and dogs reported in this national report (FINRES‐Vet, 2019) originated from isolates submitted to the Clinical Microbiology Laboratory of the Faculty of Veterinary Medicine of the University of Helsinki, which receives isolates from both the Veterinary Teaching Hospital of the University (~36% of specimens) and private veterinary clinics (~ 64%). Resistance was tested using the disk diffusion technique and results were interpreted using (when available, veterinary) CLSI clinical breakpoints. Results of AST on clinical S. pseudintermedius, E. coli and P. aeruginosa starting after 2014 (2015 for certain antimicrobials) are provided in the reports, allowing for an assessment of changes in the proportion of resistance over time. Yearly data (exact proportion of resistant isolates) were kindly provided by Thomas Grönthal (University of Helsinki, Faculty of Veterinary Medicine) for this scientific opinion.
For S. pseudintermedius, information on all seven antimicrobial classes of interest was available on isolates retrieved from dog samples (Figure 14), with between 396 and 936 isolates tested per year. The proportion of resistance in clinical isolates varied, largely depending on the antimicrobial, but in general decreasing (tetracyclines, lincosamides, fusidic acid, methicillin, gentamicin and enrofloxacin) or stable (sulfonamides‐TMP) levels were observed in the most recent years compared with the earliest. Levels of resistance were in line with the weighted arithmetic means provided in Table 3, except for fluoroquinolones and gentamicin (lower values) and fusidic acid (higher values), although reported values were well within 1–2 standard deviations from the weighted means (Table 3).
Figure 14.

- CLI: clindamycin; DOX: doxycycline; ENR: enrofloxacin; FUS: fusidic acid; GEN: gentamicin; OXA: oxacillin; SXT: sulfonamides‐TMP.
For E. coli, results are presented separately for cat (50–211 isolates/year reported) and dog (310–1,041 isolates/year reported) clinical isolates. The proportion of resistance followed a similar pattern in isolates from both host species (e.g. higher resistance levels to aminopenicillins followed by amoxicillin–clavulanic acid combinations) in line with data from European studies reported in Table 4, although lower levels in the majority of the antimicrobials were reported in isolates from cats (Figure 15). In terms of changes in resistance over time, lower resistance levels were observed in more recent years for amoxicillin–clavulanic acid, 3GC and fluoroquinolones in canine isolates, while values fluctuated without a clear trend for the remaining antimicrobials. Values observed were in line with the weighted arithmetic means calculated from European studies for most antimicrobials except for aminopenicillins, for which higher values were observed (Table 4).
Figure 15.

- AMC: amoxicillin–clavulanic acid; AMP: ampicillin; CPD: cefpodoxime; ENR: enrofloxacin; SXT: sulfonamides‐TMP.
Finally, data on resistance to the three antimicrobials of interest for P. aeruginosa (enrofloxacin, gentamicin and polymyxin B) were provided for 105 canine isolates tested in 2018: resistance levels provided for each antimicrobial were similar (polymyxin B = 0%) or lower (gentamicin = 4%; enrofloxacin = 18%) than weighted arithmetic means provided for European studies in Table 6, although this should be interpreted carefully given the limited number of isolates (and the difficulties with interpreting fluoroquinolone susceptibility data for this bacteria already mentioned in Section 3.1.3.4).
3.1.4.4. SWEDRES‐Svarm (Sweden)
Reports from the SWEDRES report (Swedres‐Svarm, 2019) include data on resistance from clinical isolates retrieved from clinical samples from cats and dogs primarily performed at the National Veterinary Institute. These data have been included for more than 15 years, although the bacterial species analysed and the origin of the isolates (i.e. type of clinical specimen) have been modified over time. If the last five reports are considered (those published between 2014 and 2019, reporting data on isolates cultured the previous year), data on several antimicrobials of interest for this scientific opinion are reported for S. pseudintermedius, S. schleiferi and P. aeruginosa from dogs, and E. coli from both dogs and cats. Isolates were analysed using the broth microdilution method, and results were interpreted according to the ECOFFs recommended by EUCAST.
For S. pseudintermedius, data on resistance to fluoroquinolones (enrofloxacin), fusidic acid, gentamicin, lincosamides (clindamycin), oxacillin (surrogate for MR), sulfonamides‐TMP and tetracycline in isolates retrieved from skin samples have been included in the five annual reports considered (although enrofloxacin was not included in 2015). The number of isolates tested every year ranged between 376 and 784), and showed stable levels of resistance for most antimicrobials, which were consistently higher (> 15–20%) for tetracyclines and fusidic acid than for enrofloxacin, gentamicin and oxacillin (< 5%), while data for clindamycin and sulfonamides‐TMP were much more variable (with a decreasing trend in the last two years) (Figure 16). Resistance levels reported in the annual reports were relatively similar to the weighted arithmetic means for clinical isolates from Europe reported in Table 3 for tetracyclines and sulfonamides‐TMP, lower for fluoroquinolones, methicillin, gentamicin and clindamycin (particularly for values observed after 2016), and higher in the case of fusidic acid.
Figure 16.

Proportion of resistance in clinical S. pseudintermedius from skin samples from dogs reported in the SWEDRES‐Svarm report
In the reports published in 2018 and 2019, additional resistance data are provided for S. pseudintermedius retrieved in the previous year from samples from the external ear canal and from wounds (with 415–517 and 844–1005 isolates tested each year, respectively). Resistance levels are more or less consistent across origins (i.e. higher resistance levels are observed for tetracyclines, fusidic acid, clindamycin and sulfonamides‐TMP, regardless of the specimen from which isolates were cultured) but certain differences can be observed in the two years for which data are available from all three sites (e.g. higher levels of clindamycin resistance for samples from the external ear canal) (Figure 17).
Figure 17.

Proportion of resistance in clinical S. pseudintermedius retrieved in 2017 and 2018 from different specimens from dogs as reported in the SWEDRES‐Svarm report
For E. coli, resistance data to cefotaxime, ampicillin, enrofloxacin, nitrofurantoin and sulfonamides‐TMP in isolates from urine samples from cats (between 455 and 545 isolates/year) and dogs (943–1,162 isolates/year) was provided in the five reports reviewed. Resistance levels in isolates from cats and dogs were relatively similar for ampicillin (> 12%), and cefotaxime and nitrofurantoin (≤ 2%). For the remaining two antimicrobials, opposite trends were observed, with dog isolates showing lower levels of resistance (and a decreasing trend over the five years) to enrofloxacin and higher levels to sulfonamides‐TMP (Figure 18).
Figure 18.

Proportion of resistance in clinical E. coli retrieved from clinical samples from various locations from cats and dogs reported in the SWEDRES‐Svarm report
When compared with the weighted arithmetic mean of resistance estimated from European studies for E. coli (Table 4), resistance levels were lower for ampicillin, cefotaxime and sulfonamides‐TMP, and similar for nitrofurantoin (for which only one other study in addition to the SWEDRES‐Svarm report provided data) and enrofloxacin (lower if considering dog isolates).
Regarding resistance in P. aeruginosa, between 306 and 389 isolates retrieved from clinical dog samples collected from the external ear canal were tested for resistance to colistin, gentamicin and enrofloxacin between 2014 and 2018. Levels of resistance were low (≤ 2%) for the two‐first antimicrobials, while enrofloxacin resistance levels ranged between 8 and 13% (with a decreasing trend in the most recent years) (Figure 19).
Figure 19.

Proportion of resistance in clinical P. aeruginosa from clinical samples from the external ear canal of dogs reported in the SWEDRES‐Svarm report
Finally, for S. schleiferi, between 163 and 297 isolates from clinical submissions from various locations (primarily from the external ear canal, skin and wounds) were tested every year between 2014 and 2018. As reported in Section 3.1.3.4, levels of resistance were low for all seven antimicrobials tested by the end of this period, although somewhat higher levels of resistance were found in 2016 for most antimicrobials (Figure 20). Values for the last year are in agreement with those presented in Table 7 for Europe because in fact this is the study that was used to provide those values.
Figure 20.

Proportion of resistance in clinical S. schleiferi from clinical samples from various locations of dogs reported in the SWEDRES‐Svarm report
3.1.4.5. RESAPATH (France)
The RESAPATH reports (Resapath, 2021) provide resistance data on clinical isolates from cats and dogs belonging to several bacterial species and antimicrobials of interest, generated at laboratories that are part of the French surveillance network for AMR in bacteria from diseased animals. Resistance is determined according to the disk diffusion method (AFNOR NF U47‐107 standard), and results are interpreted according to the veterinary guidelines of the Antibiogram Committee of the French Society of Microbiology (CA‐SFM). When considering the last five years, resistance data for E. coli were available from cats and dogs (2014–2018), P. mirabilis from dogs (2015–2018) and S. pseudintermedius and S. aureus from dogs (2017–2018). Because data are generated in various laboratories, the number of isolates from each bacterial species tested each year varies and isolates are not always tested against the same panel of antimicrobials.
When considering S. pseudintermedius, data on resistance to all seven antimicrobials/antimicrobial classes of interest were available from clinical isolates retrieved in 2017 and 2018 for three different clinical presentations (kidney and urinary tract pathology, otitis, SSTI) although in very variable numbers: while the number of isolates from otitis tested for any antimicrobials was the largest (between 807 and 1,138), results for isolates from skin and soft tissue infections (between 529 and 800 isolates tested for any of the selected antimicrobials) and kidney and urinary tract (between 198 and 311 isolates tested for any of the selected antimicrobials except fusidic acid, with only 30 strains tested in 2017) were more limited. Nevertheless, similar patterns irrespective of the type of clinical presentation were observed, with higher resistance levels for tetracyclines (> 35%) and lincosamides (lincomycin, ≥ 30%), although somewhat higher levels of resistance were observed for isolates from SSTIs for several antimicrobials (Figure 20). When comparing these results with the weighted arithmetic means for Europe reported in Table 3, they are similar for fluoroquinolones, gentamicin, lincosamides, methicillin (except for samples from SSTIs, with higher resistance levels according to the French data), and sulfonamides‐TMP, higher for tetracyclines, and lower for fusidic acid. If these results are compared with the S. pseudintermedius data provided in the SWEDRES‐Svarm reports for the same years, values are consistently higher for all antimicrobials and locations, although comparisons must be interpreted carefully due to possible differences in the AST methodologies and interpretative criteria (Table 6).
For E. coli, resistance data from isolates from both cats and dogs are reported for the five years considered, though sampling site is only specified in the case of canine strains. Again, numbers of isolates tested each year for each antimicrobial varies, with larger sample sizes in general in the most recent years, and overall numbers ranging from 488 to 1,539 for kidney and urinary tract samples, 73 to 277 for otitis and 41 to 153 for SSTIs (all from dogs), and from 322 to 1,351 from cats (all pathologies reported together). Levels of resistance to each antimicrobial are relatively stable over time albeit with lower levels for most antimicrobials in the most recent years (Figure 21). Higher levels of resistance to amoxicillin and amoxicillin–clavulanic acid for all categories followed by sulfonamides‐TMP and then ceftiofur and enrofloxacin. Similar to what was reported for S. pseudintermedius, somewhat higher levels of resistance were reported for E. coli canine isolates from SSTIs, although this should be interpreted with care, particularly given the limited sample size for this specific category.
Figure 21.

- SSTI: skin and soft tissue infections.
Values reported in the RESAPATH reports were close to the weighted arithmetic means reported in Table 4 for European isolates for 3GC, aminopenicillins (except for isolates from SSTIs, in which higher levels of resistance were reported) and sulfonamides‐TMP (particularly when considering the later years), and somewhat higher (especially for the SSTI isolates) for amoxicillin–clavulanic acid, while lower values (particularly for the later years) were reported for fluoroquinolones.
Figure 22.

- SSTI: skin and soft tissue infections.
For S. aureus, resistance data for between 246 and 488 canine isolates tested against one of the seven antimicrobials of interest were provided for 2017 and 2018 with the exception of fusidic acid in 2018, for which only 30 isolates were tested. Relatively similar levels were found for all antimicrobials except for fusidic acid, which was tested in a very small sample size (Figure 23). Resistance levels to tetracycline and lincomycin were higher (> 20%) than those found in all other antimicrobials, which were around or below 10%. Values reported in RESAPATH were similar to the weighted arithmetic means for Europe provided in Table 7 for all antimicrobials except for oxacillin, where lower levels of resistance were found for the French isolates.
Figure 23.
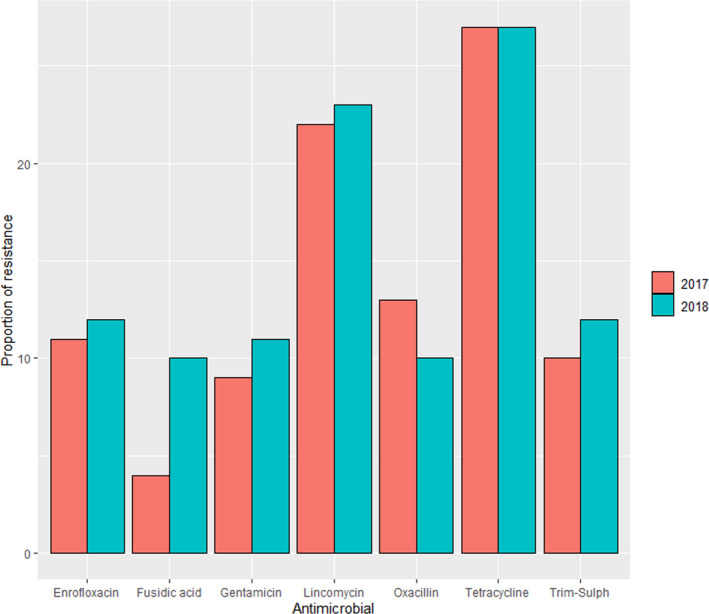
Proportions of resistance in clinical S. aureus retrieved in 2017 and 2018 from all pathologies from dogs reported in the RESAPATH reports
Finally, for P. mirabilis, data on resistance were provided for canine isolates from different pathologies reported together and retrieved between 2015 and 2018. The number of isolates tested against each of four antimicrobials of interest each year was lower in 2015 (between 366 and 384) and increased in the following three years (between 1,100 and 1,468 isolates for 2016–2018). Resistance levels in this case were the highest for sulfonamides‐TMP (> 20%), although values recorded each year were decreasing to some extent (Figure 24). Decreasing values in the later years were also observed for enrofloxacin (from 16% to 7%) and ceftiofur (from 3% to 1%), while resistance levels for amoxicillin–clavulanic acid ranged between 8% and 11% over the four years (Figure 24). These values were similar to the weighted arithmetic means provided in Table 5 for isolates in Europe, except for the latter estimates for 3GC and fluoroquinolones, which were somewhat lower.
Figure 24.
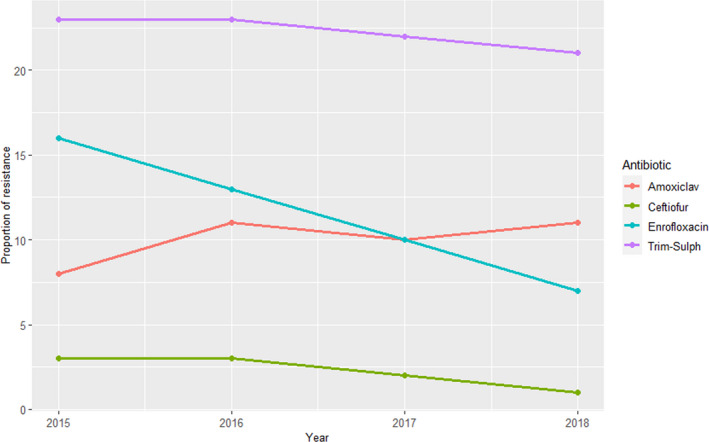
Proportions of resistance in P. mirabilis from clinical samples of dogs (all pathologies) reported in the RESAPATH reports
3.1.4.6. ANRESIS/ARCH‐Vet (Switzerland)
The Swiss AMR report (Anresis, 2020) included data from cats and dogs for the first time in the report published in 2020 (corresponding to isolates retrieved in 2019), and therefore there is only one year's worth of data. Isolates included in the report originate from veterinary diagnostic laboratories in the country that are submitted to the Swiss national reference laboratory for AMR and are retrieved from animals not subjected to antimicrobial treatment prior to sampling. Resistance data, generated using the broth microdilution method and interpreted according to CLSI clinical breakpoints, were provided for a limited number of S. pseudintermedius isolates from skin infections from dogs (n = 22) and of E. coli from canine (n = 40) and feline (n = 35) urogenital tract infections.
Resistance levels (R + I) for the antimicrobials of interest tested in 22 canine S. pseudintermedius isolates were somewhat lower (ciprofloxacin: 0%; gentamicin: 5%) or in the same range (clindamycin: 32%; tetracycline: 23%) compared with weighted arithmetic means calculated for all Europe (Table 3).
In the case of the E. coli isolates, resistance levels were either similar to or below (3GC for dog isolates, aminopenicillin in both species) the weighted average mean estimates for European studies presented in Table 4, except for fluoroquinolone in dog isolates (Table 7).
Table 9.
Proportion of E. coli isolates from canine and feline urogenital tract infections resistant to selected antimicrobials in 2019
| Antimicrobial | Dog (n = 40) | Cat (n = 35) |
|---|---|---|
| 3GC (cefotaxime) | 0% | 6% |
| Aminopenicillin (ampicillin) | 15% | 17.1% |
| Fluoroquinolone (ciprofloxacin) | 15% | 3% |
3.1.4.7. GERM‐VET (Germany)
Since 2001, the Bundesamt für Verbraucherschutz und Lebensmittelsicherheit (BVL) started to monitor resistance in animal bacterial pathogens and it reports data in GERM‐Vet (Germ‐Vet, 2020) according to a yearly sampling plan, sampled each year from mid‐April of the reporting year to the end of March of the following year. In 2014 and 2015, between 22 and 32 public, private and university laboratories were included. Resistance monitoring was performed according to CLSI guidelines. Resistance was defined using clinical breakpoints that, however, changed over the years. Among the bacterial species of interest, resistance data on E. coli and B. bronchiseptica isolates retrieved from diseased animals identified in the submitting laboratories (a proportion of them rechecked at the BVL laboratory) have been included in the reports.
Resistance data for E. coli were provided separately for intestinal and UTI isolates. The number of isolates tested each year was in any case limited, ranging from 59 to 131 (considering both locations together). Regarding isolates from the gastrointestinal tract, resistance levels to ampicillin and amoxicillin/clavulanic acid based on clinical breakpoints in canine and feline isolates (reported together) ranged between 18 and 40% for 2014–2016, while the proportion of resistance to ampicillin and amoxicillin/clavulanic acid in isolates from cats in the years 2017 and 2018 was defined as 100%. Resistance rates to fluoroquinolones (determined from UTI isolates) ranged over the years between 0 and 25%. Sulfonamide‐TMP resistance decreased from over 15–20% in 2015–2017 to less than 10% in 2018.
3.2. ToR 2: identifying the most relevant bacteria in the EU
Following the methodology presented in the scientific opinion on the ad hoc method for the assessment of animal diseases caused by bacteria resistant to antimicrobials within the AHL framework (EFSA AHAW Panel, 2021), the evidence available was assessed individually by all working group members who provided individual judgements on the perceived relevance to dogs and cats of the antimicrobial‐resistant bacteria included in the list.
After discussion of the individual judgements for each bacterium (relevant/non‐relevant/cannot be assessed based on available evidence), it was agreed with > 90% certainty that the three most relevant antimicrobial resistant bacteria for the EU were S. pseudintermedius, E. coli and P. aeruginosa (Figure 25). This is due to their frequent implication in clinical disease in cats and dogs and the high levels of resistance to clinically relevant antimicrobials both globally and in some cases also in the EU (methicillin, lincosamide and fluoroquinolones for S. pseudintermedius (Table 3), aminopenicillin, 3GCs and fluoroquinolones for E. coli (Table 4) and aminoglycosides and fluoroquinolones for P. aeruginosa (Table 6). Their potential relevance as antimicrobial resistant pathogens is evidenced by the very large number of AST results for the antimicrobials of interest retrieved through this ELR for these three species (~ 121,000 test results for E. coli, ~ 83,000 for S. pseudintermedius and ~ 15,000 for P. aeruginosa) (Appendix B).
Figure 25.

Level of certainty regarding the inclusion of the selected antimicrobial resistant pathogens of cats and dogs among the most relevant in the EU
Among the remaining bacteria considered in the ELR but not considered among the most relevant for the EU, there was a much higher uncertainty regarding their inclusion among the most relevant antimicrobial resistant pathogens in the EU (Figure 25). For four of them (Klebsiella spp., P. mirabilis, S. aureus and Enterobacter spp.), there was already sufficient evidence suggesting that resistant strains can cause clinical problems at present, particularly considering that mechanisms mediating resistance dynamics (e.g. transmission, persistence) are similar to those of some of the bacteria considered as most relevant (e.g. the epidemiology of AMR in Enterobacter or Klebsiella can be expected to follow similar patterns to that of E. coli). Still, there were limited data suggesting that antimicrobial resistant phenotypes of these bacterial species are a significant concern at this time, especially taking into consideration their relatively low frequency in clinical specimens from dogs and cats.
The clostridial species included in the assessment (C. perfringens, C. difficile) were not considered relevant, since treatment of enteritis does not typically pose therapeutic problems. Furthermore, given that they can be retrieved from both healthy and diseased individuals, the evaluation of their clinical relevance is contentious.
Finally, for the remaining four species (S. schleiferi, E. faecalis, E. faecium and B. bronchiseptica), very limited data on AMR were available (four studies testing between 20 and 240 isolates each for S. schleiferi, three studies with results for 11–55 isolates each for Enterococcus spp., one study with 23 isolates for B. bronchiseptica). Even if the resistance levels found were non‐negligible for certain antimicrobial–pathogen combinations outside Europe (e.g. methicillin and fluoroquinolone resistance in S. schleiferi in the US), lower levels of resistance were observed in European isolates. Moreover, S. schleiferi is not a frequent cause of infection in dogs and cats in Europe, B. bronchiseptica appears to be consistently susceptible to the first‐choice drug for treatment of respiratory infections (doxycycline), and enterococci were not perceived as a major cause of treatment failure, also in view of their role as secondary pathogens in UTIs, often in combination with E. coli or other primary pathogens that are the main target of antimicrobial treatment.
4. Conclusions
In this opinion, EFSA presents the results of the assessment conducted to answer ToR 1 (global state of play of antimicrobial‐resistant animal bacteria) and the first part of ToR 2 (identifying the most relevant in the EU) as they are described and interpreted in the ad hoc methodology (EFSA AHAW Panel, 2021). The second part of ToR 2 and ToR 3, namely the animal health impact of the selected species on swine in the EU, and their eligibility for being listed and categorised in the framework of the AHL, will be assessed in the next step of this EFSA project.
The scientific assessment of the global state of play of the resistant bacterial pathogens of cats and dogs included in this opinion and of their EU relevance is hampered by several important sources of uncertainty derived from the available data and the methodology followed in this assessment, as mentioned in Section 2.4 of EFSA AHAW Panel (2021) and in the preceding sections of this opinion:
Due to the scope of the ELR, only studies published in the last 10 years and in English were considered eligible (with the only exception of the GERMVET report), thus introducing a selection bias that could lead to the absence of data from several areas of the world where these resistant pathogens may be highly relevant.
Information on the rationale and study design for the references retrieved in the ELR was limited and very heterogeneous, making the detailed assessment of the representativeness of the isolates included in each study very difficult. For example, approximately half of the references (46/98) included isolates collected through the regular testing of veterinary diagnostic laboratories for which typically very limited information is available. Moreover, they often originate from animals subjected to previous antimicrobial treatments, which has been demonstrated to be associated with higher levels of resistance in tested isolates. Furthermore, several of the bacterial species included here can also be found in healthy animals (e.g. E. coli, S. pseudintermedius). Therefore, even if they originated from diseased animals, they may not have been the causative agent in a proportion of cases that cannot be quantified.
Even though only studies exceeding a minimum quality threshold were included (e.g. use of internationally accepted standards) the methodology used was also diverse (e.g. use of disk diffusion or microdilution methods, clinical breakpoints or ECOFFs, consideration or not of the intermediate category, etc.). Thus, descriptive statistics provided here (average proportion of resistant isolates for bacterium, country and antimicrobial) should be considered carefully, since they may not be representative of the true underlying situation, particularly in cases where the sample size was small.
AMR data referring to one or more of the bacterial pathogens of interest were retrieved from seven national AMR monitoring reports. However, due to the lack of standardized methodologies and different scopes, comparison of data reported in the different countries is difficult due to differences in (a) the bacterial species considered, (b) the geographical and temporal coverage of each report, (c) the choice of antimicrobials included in the panel for AST, and d) the methods for antimicrobial susceptibility determination (disk diffusion vs broth microdilution, clinical breakpoints vs ECOFFs).
EFSA has provided a global state of play for the following bacteria: Staphylococcus pseudintermedius, Escherichia coli, Pseudomonas aeruginosa, Staphylococcus aureus, Staphylococcus schleiferi, Proteus mirabilis, Klebsiella spp., Enterobacter spp., Enterococcus faecalis and Enterococcus faecium, Bordetella bronchiseptica, Clostridium perfringens and Clostridioides difficile.
Among those bacteria, based on the evidence available and expert opinion, EFSA identified S. pseudintermedius, E. coli and P. aeruginosa as the most relevant in the EU with > 90% certainty.
Several major data gaps were identified, derived mainly from the lack of information from many countries in the world (and to a lesser extent from some regions in Europe), the insufficient information on the origins of the bacterial isolates tested (which could result in unknown selection biases) and the variety of antimicrobials, methodologies and breakpoints used to generate the data considered in this assessment.
The impact of the uncertainties deriving from these data gaps on the scientific assessment was incorporated into the results through expert opinion.
5. Recommendation
Data on AMR in bacterial pathogens are necessary to enhance animal health, promote the rational use of antimicrobials, and identify specific therapeutic challenges attributable to AMR. The very wide ranges of AMR percentages observed in pathogenic bacteria isolated from cats and dogs in the same region or country highlight the difficulties in obtaining reliable and comparable estimates from scientific publications, which are often based on susceptibility testing of specific (and often biased) strain collections. National monitoring systems for AMR in diseased animals are only available in a few countries and there are limitations that hamper the comparability of data reported by different countries (Mader et al., 2021). Moreover, the few available national reports have a limited geographical scope when considering the global situation, particularly outside Europe. Nevertheless, among the EU national reports assessed in this opinion, stable or somewhat decreasing AMR trends were found for most pathogen–drug combinations. Although the significance of these observations should not be over‐interpreted due to the above‐mentioned limitations, assuming that sampling and methodological biases are relatively constant over time for a given monitoring programme, these longitudinal data can be helpful to detect the emergence of new antimicrobial resistant phenotypes of clinical importance in pathogens of cats and dogs, and thus help to guide antimicrobial stewardship. In the future, standardisation and harmonisation of the methodology employed by national surveillance programmes, including selection criteria for collecting bacterial isolates and performance of AST, would allow more meaningful comparisons between countries. Alternatively, access to raw AST data generated by such programmes could enable analysis of data from different countries using the same interpretive criteria (clinical breakpoints or epidemiological cut‐offs), thereby facilitating identification of geographical differences in the distribution of specific antimicrobial resistant phenotypes of clinical relevance.
Abbreviations
- 3GC
third‐generation cephalosporin
- AHL
animal health law
- AST
antimicrobial susceptibility testing
- CLSI
Clinical and Laboratory Standards Institute
- ECOFF
epidemiological cut‐off
- ELR
extensive literature review
- ESBL
extended‐spectrum beta‐lactamase
- ESC
extended‐spectrum cephalosporinase
- EUCAST
European Committee on Antimicrobial Susceptibility Testing
- I
intermediate
- MIC
minimum inhibitory concentration
- MR
methicillin resistance
- MRSA
methicillin‐resistant Staphylococcus aureus
- MRSP
methicillin‐resistant Staphylococcus pseudintermedius
- PCR
polymerase chain reaction
- R
resistant
- S
susceptible
- UTI
urinary tract infection
Appendix A – Search strings applied
A.1. Pubmed
A.1.1. Common search string “Antimicrobials”
((“antibiotic”[Title/Abstract] OR “antibiotics”[Title/Abstract] OR “antimicrobial”[Title/Abstract] OR “antimicrobials”[Title/Abstract] OR “Anti‐Bacterial Agents”[MeSH Terms:noexp]) AND (“resistan*”[Title/Abstract] OR “susceptib*”[Title/Abstract])) OR (“Microbial Sensitivity Tests”[MeSH Terms] OR “drug resistance, microbial”[MeSH Terms])
A.1.2. Host‐based strings
A.1.2.1. “Host”
A.1.2.1.1. Companion animals
“Dog”[Title/Abstract] OR “Dogs”[Title/Abstract] OR “Cat”[Title/Abstract] OR “Cats”[Title/Abstract] OR “Pets”[Title/Abstract] OR “companion animal”[Title/Abstract] OR “companion animals”[Title/Abstract] OR “canine”[Title/Abstract] OR “feline”[Title/Abstract] OR “Dogs”[MeSH Terms] OR “Cats”[MeSH Terms] OR “Pets”[MeSH Terms]
A.1.2.2. “Bacterial species”
A.1.2.2.1. Companion animals
“Enterobacter”[MeSH Terms] OR “Staphylococcus aureus”[MeSH Terms] OR “Staphylococcus intermedius”[MeSH Terms] OR “Enterococcus faecalis”[MeSH Terms] OR “Enterococcus faecium”[MeSH Terms] OR “Escherichia coli”[MeSH Terms] OR “Klebsiella pneumoniae”[MeSH Terms] OR “Proteus mirabilis”[MeSH Terms] OR “Bordetella bronchiseptica”[MeSH Terms] OR “Borrelia burgdorferi”[MeSH Terms] OR “Clostridium perfringens”[MeSH Terms] OR “Pseudomonas aeruginosa”[MeSH Terms] OR “Enterobacter”[Title/Abstract] OR “Staphylococcus pseudintermedius”[Title/Abstract] OR “Staphylococcus schleiferi”[Title/Abstract] OR “Enterococcus faecalis”[Title/Abstract] OR “Enterococcus faecium”[Title/Abstract] OR “Escherichia coli”[Title/Abstract] OR “Klebsiella pneumoniae”[Title/Abstract] OR “Proteus mirabilis”[Title/Abstract] OR “Staphylococcus aureus”[Title/Abstract] OR “Bordetella bronchiseptica”[Title/Abstract] OR “Borrelia burgdorferi”[Title/Abstract] OR “Clostridium difficile”[Title/Abstract] OR “Clostridium perfringens”[Title/Abstract] OR “Pseudomonas aeruginosa”[Title/Abstract]
A.2. Embase
A.2.1. Common search string “Antimicrobials”
1. antibiotic resistance/or exp antibiotic sensitivity/or exp drug resistance/
2. susceptib*.mp. [mp=title, abstract, heading word, drug trade name, original title, device manufacturer, drug manufacturer, device trade name, keyword, floating subheading word, candidate term word]
3. resistan*.mp. [mp=title, abstract, heading word, drug trade name, original title, device manufacturer, drug manufacturer, device trade name, keyword, floating subheading word, candidate term word]
4. 2 or 3
5. antibiotic.mp. [mp=title, abstract, heading word, drug trade name, original title, device manufacturer, drug manufacturer, device trade name, keyword, floating subheading word, candidate term word]
6. antibiotics.mp. [mp=title, abstract, heading word, drug trade name, original title, device manufacturer, drug manufacturer, device trade name, keyword, floating subheading word, candidate term word]
7. antimicrobial.mp. [mp=title, abstract, heading word, drug trade name, original title, device manufacturer, drug manufacturer, device trade name, keyword, floating subheading word, candidate term word]
8. antimicrobials.mp. [mp=title, abstract, heading word, drug trade name, original title, device manufacturer, drug manufacturer, device trade name, keyword, floating subheading word, candidate term word]
9. 5 or 6 or 7 or 8
10. antibiotic agent/
11. 10 or 9
12. 11 and 4
13. 12 or 1
A.2.2. Host‐based strings
A.2.2.1. “Host”
A.2.2.1.1. Companion animals
1. dog/
2. cat/
3. 1 or 2
4. Dog.mp. [mp=title, abstract, heading word, drug trade name, original title, device manufacturer, drug manufacturer, device trade name, keyword, floating subheading word, candidate term word]
5. Dogs.mp. [mp=title, abstract, heading word, drug trade name, original title, device manufacturer, drug manufacturer, device trade name, keyword, floating subheading word, candidate term word]
6. Cat.mp. [mp=title, abstract, heading word, drug trade name, original title, device manufacturer, drug manufacturer, device trade name, keyword, floating subheading word, candidate term word]
7. Cats.mp. [mp=title, abstract, heading word, drug trade name, original title, device manufacturer, drug manufacturer, device trade name, keyword, floating subheading word, candidate term word]
8. Canine.mp. [mp=title, abstract, heading word, drug trade name, original title, device manufacturer, drug manufacturer, device trade name, keyword, floating subheading word, candidate term word]
9. Feline.mp. [mp=title, abstract, heading word, drug trade name, original title, device manufacturer, drug manufacturer, device trade name, keyword, floating subheading word, candidate term word]
10. “Companion animal”.mp. [mp=title, abstract, heading word, drug trade name, original title, device manufacturer, drug manufacturer, device trade name, keyword, floating subheading word, candidate term word]
11. “Companion animals”.mp. [mp=title, abstract, heading word, drug trade name, original title, device manufacturer, drug manufacturer, device trade name, keyword, floating subheading word, candidate term word]
12. 4 or 5 or 6 or 7 or 8 or 9 or 10 or 11
13. 3 or 12
A.2.2.2. “Bacterial species”
A.2.2.2.1. Companion animals
1. Enterobacter/
2. Staphylococcus pseudintermedius/
3. Staphylococcus schleiferi/
4. Enterococcus faecalis/
5. Enterococcus faecium/
6. Escherichia coli/
7. Klebsiella pneumoniae/
8. Proteus mirabilis/
9. Staphylococcus aureus/
10. Bordetella bronchiseptica/
11. Borrelia burgdorferi/
12. Clostridioides difficile/
13. Clostridium perfringens/
14. Pseudomonas aeruginosa/
15. 1 or 2 or 3 or 4 or 5 or 6 or 7 or 8 or 9 or 10 or 11 or 12 or 13 or 14
16. Enterobacter.mp. [mp=title, abstract, heading word, drug trade name, original title, device manufacturer, drug manufacturer, device trade name, keyword, floating subheading word, candidate term word]
17. Staphylococcus pseudintermedius.mp.
18. Staphylococcus schleiferi.mp. [mp=title, abstract, heading word, drug trade name, original title, device manufacturer, drug manufacturer, device trade name, keyword, floating subheading word, candidate term word]
19. Enterococcus faecalis.mp. [mp=title, abstract, heading word, drug trade name, original title, device manufacturer, drug manufacturer, device trade name, keyword, floating subheading word, candidate term word]
20. Enterococcus faecium.mp. [mp=title, abstract, heading word, drug trade name, original title, device manufacturer, drug manufacturer, device trade name, keyword, floating subheading word, candidate term word]
21. Escherichia coli.mp. [mp=title, abstract, heading word, drug trade name, original title, device manufacturer, drug manufacturer, device trade name, keyword, floating subheading word, candidate term word]
22. Klebsiella pneumoniae.mp. [mp=title, abstract, heading word, drug trade name, original title, device manufacturer, drug manufacturer, device trade name, keyword, floating subheading word, candidate term word]
23. Proteus mirabilis.mp. [mp=title, abstract, heading word, drug trade name, original title, device manufacturer, drug manufacturer, device trade name, keyword, floating subheading word, candidate term word]
24. Staphylococcus aureus.mp. [mp=title, abstract, heading word, drug trade name, original title, device manufacturer, drug manufacturer, device trade name, keyword, floating subheading word, candidate term word]
25. Bordetella bronchiseptica.mp. [mp=title, abstract, heading word, drug trade name, original title, device manufacturer, drug manufacturer, device trade name, keyword, floating subheading word, candidate term word]
26. Borrelia burgdorferi.mp. [mp=title, abstract, heading word, drug trade name, original title, device manufacturer, drug manufacturer, device trade name, keyword, floating subheading word, candidate term word]
27. Clostridium difficile.mp. [mp=title, abstract, heading word, drug trade name, original title, device manufacturer, drug manufacturer, device trade name, keyword, floating subheading word, candidate term word]
28. Clostridium perfringens.mp. [mp=title, abstract, heading word, drug trade name, original title, device manufacturer, drug manufacturer, device trade name, keyword, floating subheading word, candidate term word]
29. Pseudomonas aeruginosa.mp. [mp=title, abstract, heading word, drug trade name, original title, device manufacturer, drug manufacturer, device trade name, keyword, floating subheading word, candidate term word]
30. 16 or 17 or 18 or 19 or 20 or 21 or 22 or 23 or 24 or 25 or 26 or 27 or 28 or 29
31. 15 or 30
Appendix B – Excel file with all the data extracted
1.
Information on all the full‐text studies that were assessed, including the reason for exclusion for those that were excluded at the full‐text screening and the data extracted from the included studies, can be consulted at https://doi.org/10.5281/zenodo.4912394.
Appendix C – Clinically relevant antibiotics for which data were extracted
1.
| Bacterial species/group | Common infections | Antibiotics used | Relevant resistance tested |
|---|---|---|---|
| STAPHYLOCOCCI S. aureus S. pseudintermedius S. schleiferi | Skin infections Otitis Skin and soft tissue infections | First choice (Hillier et al., 2014): Clindamycin or lincomycin Amoxicillin clav 1G cephalosporins Sulfa/TMP Second choice Second choice (Hillier et al., 2014): Doxycycline 3G cephalosporins Fluoroquinolones First choice (topical) (Jessen et al., 2019): Fusidic acid Second choice (topical) (Jessen et al., 2019): Gentamicin Fluoroquinolones First choice (prophylaxis) (Jessen et al., 2019): Cefazolin | Clindamycin/lincomycin Methicillin Methicillin Sulfa/TMP Doxycycline/tetracycline Methicillin Enrofloxacin/ciprofloxacin Fusidic acid Gentamicin Enrofloxacin or ciprofloxacin Methicillin |
| ENTEROBACTERIACEAE Escherichia coli Klebsiella pneumoniaeProteus mirabilis Enterobacter spp. | Urinary tract infections Pyometra Bacteraemia | First choice (Jessen et al., 2019; Weese et al., 2019) Amoxicillin Amoxicillin clav Sulfa/TMP Second choice (Jessen et al., 2019; Weese et al., 2019): Fluoroquinolones Nitrofurantoin 3GCs First choice (Jessen et al., 2019): Fluoroquinolones Second choice (Jessen et al., 2019): Amoxicillin clav First choice (Jessen et al., 2019): Fluoroquinolone + ampicillin | Ampicillin/amoxicillin Amoxicillin clav Sulfa/TMP Enrofloxacin/ciprofloxacin Nitrofurantoin Cefpodoxime, cefotaxime, ceftazidime or ceftriaxone Enrofloxacin or ciprofloxacin Amoxicillin clav Enrofloxacin/ciprofloxacin Ampicillin/amoxicillin |
| PSEUDOMONAS P. aeruginosa | Otitis Wound infections | First choice (Jessen et al., 2019): Polymyxin Second choice (Jessen et al., 2019): Fluoroquinolones Gentamicin | Polymyxin/colistin Enrofloxacin/ciprofloxacin Gentamicin |
| ENTEROCOCCI E. faecalis E. faecium | Urinary tract infections Bacteraemia | First choice (Weese et al., 2019): Amoxicillin First choice (Jessen et al., 2019): Ampicillin + fluoroquinolone | Ampicillin/amoxicillin Sulfa/TMP Enrofloxacin/ciprofloxacin Ampicillin/amoxicillin Enrofloxacin/ciprofloxacin |
| CLOSTRIDIA C. difficile C. perfringens | Acute diarrhoea | First choice (Jessen et al., 2019): Amoxicillin Second choice: Metronidazole | Ampicillin/amoxicillin Metronidaxole |
Appendix D – Data on proportion of resistance, sorted by country
1.
The figures below show, for each pathogen, the available data on the proportion of resistance sorted by country. The total number of studies by country and antimicrobial is reported on the right side. Each circle represents one study and the size of each circle reflects how many isolates were included in the study. The colour of a circle illustrates whether the proportion represents resistance only (red circle) or resistance merged with intermediate (blue circle). The dashed lines indicate, for each antibiotic, the weighted arithmetic mean of % resistance, not taking into account the difference between %R and %R + I.


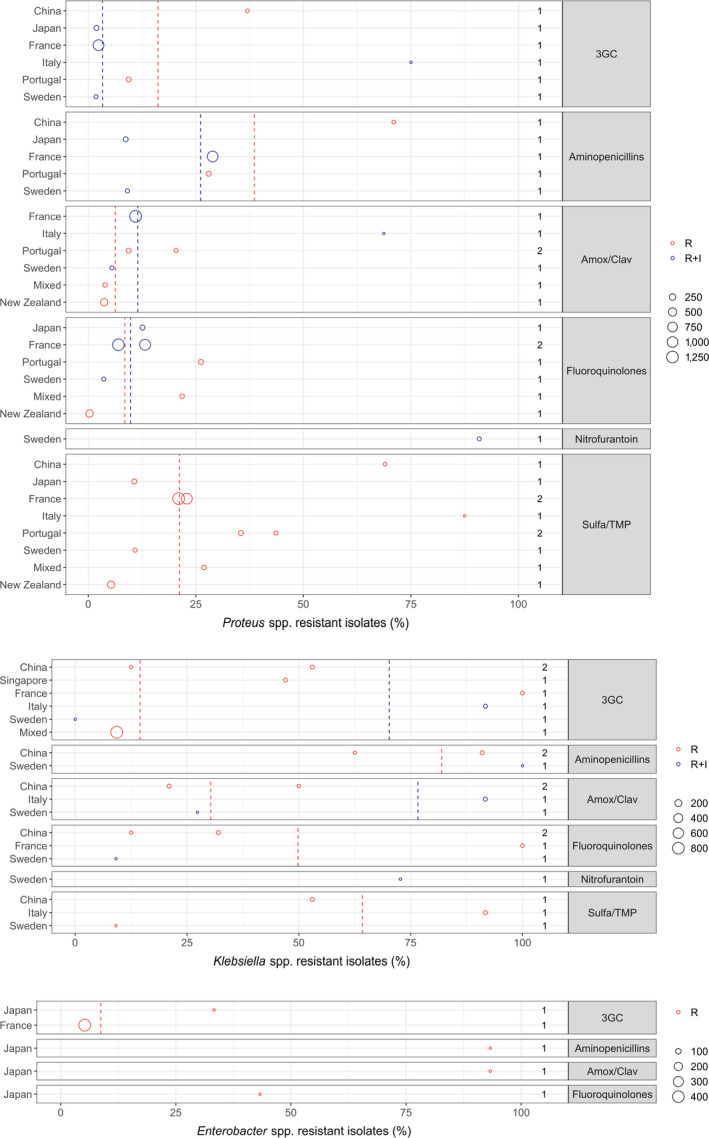
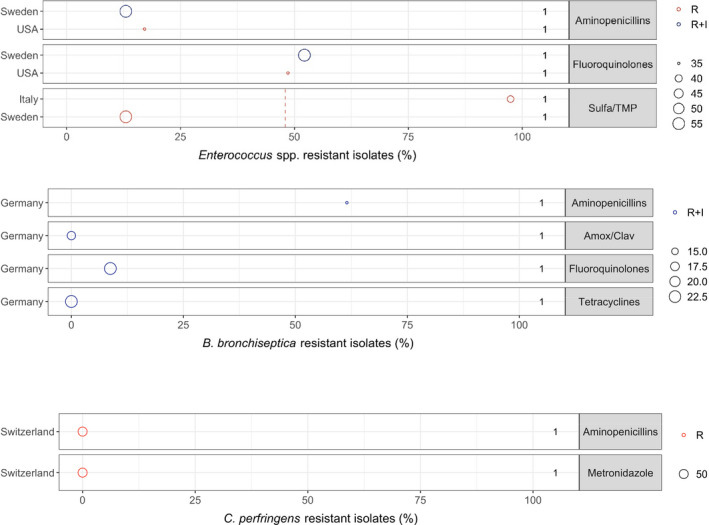
Appendix E – Exact percentages of weighted arithmetic means of %R and %R + I, respectively, displayed as dashed lines in figures
1.
| Antibiotic | How resistance is reported (%R or %R + I) | Weighted arithmetic mean prevalence of resistance (%) | Maximum resistance % observed | Minimum resistance % observed | Weighted standard deviation | Bacterial species/genus |
|---|---|---|---|---|---|---|
| Fluoroquinolones | R | 7.4 | 94.3 | 1 | 12.2 | S. pseudintermedius |
| Fluoroquinolones | R + I | 7.1 | 13 | 1 | 5 | S. pseudintermedius |
| Fusidic acid | R + I | 12.9 | 38 | 0 | 6.4 | S. pseudintermedius |
| Gentamicin | R | 7.2 | 58.6 | 1 | 10.3 | S. pseudintermedius |
| Gentamicin | R + I | 8.3 | 13.5 | 1.7 | 4.6 | S. pseudintermedius |
| Lincosamides | R | 26 | 98.6 | 3.3 | 17.6 | S. pseudintermedius |
| Lincosamides | R + I | 19.8 | 24.9 | 13 | 4.6 | S. pseudintermedius |
| Methicillin | R | 7.7 | 72.2 | 0.9 | 9.5 | S. pseudintermedius |
| Sulfa/TMP | R | 13.5 | 97.1 | 5 | 10.2 | S. pseudintermedius |
| Tetracyclines | R | 31.8 | 95.7 | 13.7 | 16.4 | S. pseudintermedius |
| Tetracyclines | R + I | 23.2 | 33.8 | 20.2 | 4.2 | S. pseudintermedius |
| 3GC | R | 6.5 | 33.3 | 0 | 6.3 | E. coli |
| 3GC | R + I | 11.1 | 71.4 | 0.2 | 10.8 | E. coli |
| Aminopenicillins | R | 30.7 | 100 | 8.8 | 15.8 | E. coli |
| Aminopenicillins | R + I | 39.3 | 70.2 | 28.1 | 12.5 | E. coli |
| Amox/Clav | R | 16.7 | 100 | 0 | 18 | E. coli |
| Amox/Clav | R + I | 26.5 | 76.5 | 12.3 | 13.2 | E. coli |
| Fluoroquinolones | R | 14.4 | 92.5 | 1.8 | 14.6 | E. coli |
| Fluoroquinolones | R + I | 8 | 39.3 | 2.1 | 7.6 | E. coli |
| Nitrofurantoin | R + I | 1.1 | 1.6 | 1 | 0.2 | E. coli |
| Sulfa/TMP | R | 11.7 | 77.5 | 0 | 9.5 | E. coli |
| Fluoroquinolones | R | 34.4 | 63.6 | 9 | 13.8 | P. aeruginosa |
| Fluoroquinolones | R + I | 62.9 | 80 | 8 | 17.2 | P. aeruginosa |
| Gentamicin | R | 14.5 | 71.4 | 4.1 | 19.3 | P. aeruginosa |
| Gentamicin | R + I | 16.2 | 36.4 | 2 | 5 | P. aeruginosa |
| Polymyxin B/Colistin | R | 11.3 | 54.4 | 0 | 14.8 | P. aeruginosa |
| Polymyxin B/Colistin | R + I | 0.8 | 1 | 0 | 0.4 | P. aeruginosa |
| 3GC | R | 14.5 | 100 | 9.3 | 17.4 | Klebsiella spp. |
| 3GC | R + I | 70.2 | 91.7 | 0 | 39.2 | Klebsiella spp. |
| Aminopenicillins | R | 81.9 | 91 | 62.5 | 13.4 | Klebsiella spp. |
| Amox/Clav | R | 30.3 | 50 | 21 | 13.7 | Klebsiella spp. |
| Amox/Clav | R + I | 76.6 | 91.7 | 27.3 | 27.6 | Klebsiella spp. |
| Fluoroquinolones | R | 49.8 | 100 | 12.5 | 35.8 | Klebsiella spp. |
| Sulfa/TMP | R | 64.2 | 91.7 | 9.1 | 28.5 | Klebsiella spp. |
| 3GC | R | 8.7 | 33.3 | 5.2 | 9.3 | Enterobacter spp. |
| Sulfa/TMP | R | 48 | 97.4 | 13 | 41.8 | Enterococcus spp. |
| 3GC | R | 16.2 | 37 | 9.4 | 11.9 | Proteus spp. |
| 3GC | R + I | 3.3 | 75 | 1.8 | 8.5 | Proteus spp. |
| Aminopenicillins | R | 38.6 | 71 | 28 | 18.6 | Proteus spp. |
| Aminopenicillins | R + I | 26.1 | 28.9 | 8.7 | 6.9 | Proteus spp. |
| Amox/Clav | R | 6.3 | 20.4 | 3.7 | 5 | Proteus spp. |
| Amox/Clav | R + I | 11.5 | 68.7 | 5.5 | 6.4 | Proteus spp. |
| Fluoroquinolones | R | 8.5 | 26.2 | 0.3 | 11.5 | Proteus spp. |
| Fluoroquinolones | R + I | 9.8 | 13.2 | 3.6 | 3.2 | Proteus spp. |
| Sulfa/TMP | R | 21.2 | 87.5 | 5.3 | 10.1 | Proteus spp. |
| Fluoroquinolones | R + I | 32.9 | 52.5 | 3 | 22.2 | S. schleiferi |
| Gentamicin | R + I | 31.2 | 49 | 0 | 23 | S. schleiferi |
| Lincosamides | R + I | 17.7 | 25.5 | 4 | 10.1 | S. schleiferi |
| Methicillin | R | 40 | 67.3 | 0 | 29.6 | S. schleiferi |
| Sulfa/TMP | R | 4.1 | 10.8 | 0.9 | 4.6 | S. schleiferi |
| Tetracyclines | R + I | 10.6 | 19 | 3 | 8 | S. schleiferi |
| Fluoroquinolones | R | 11.9 | 27.5 | 2.7 | 10.3 | S. aureus |
| Fluoroquinolones | R + I | 14 | 51.3 | 0 | 9 | S. aureus |
| Fusidic acid | R + I | 11.6 | 74.4 | 5 | 17.5 | S. aureus |
| Gentamicin | R | 7.4 | 35.3 | 0 | 11.5 | S. aureus |
| Gentamicin | R + I | 15.2 | 74.4 | 0 | 14.7 | S. aureus |
| Lincosamides | R | 15.5 | 55.6 | 1.5 | 18.4 | S. aureus |
| Lincosamides | R + I | 28.8 | 100 | 23 | 20.4 | S. aureus |
| Methicillin | R | 17.8 | 36.4 | 0 | 8.7 | S. aureus |
| Sulfa/TMP | R | 13.6 | 100 | 0 | 17.7 | S. aureus |
| Tetracyclines | R | 19.9 | 38.2 | 9.4 | 11.1 | S. aureus |
| Tetracyclines | R + I | 26.8 | 60 | 10 | 5.4 | S. aureus |
Suggested citation: EFSA AHAW Panel (EFSA Panel on Animal Health and Welfare) , Nielsen SS, Bicout DJ, Calistri P, Canali E, Drewe JA, Garin‐Bastuji B, Gonzales Rojas JL, Gortazar Schmidt C, Herskin M, Michel V, Miranda Chueca MA, Padalino B, Pasquali P, Roberts HC, Sihvonen LH, Spoolder H, Stahl K, Velarde A, Viltrop A, Winckler C, Guardabassi L, Hilbert F, Mader R, Aznar I, Baldinelli F and Alvarez J, 2021. Scientific Opinion on the assessment of animal diseases caused by bacteria resistant to antimicrobials: Dogs and cats. EFSA Journal 2021;19(6):6680, 58 pp. 10.2903/j.efsa.2021.6680
Requestor: European Commission
Question number: EFSA‐Q‐2019‐00760
Panel members: Søren Saxmose Nielsen, Julio Alvarez, Dominique Joseph Bicout, Paolo Calistri, Elisabetta Canali, Julian Ashley Drewe, Bruno Garin‐Bastuji, Jose Luis Gonzales Rojas, Christian Gortazar Schmidt, Mette Herskin, Virginie Michel, Miguel Angel Miranda Chueca, Barbara Padalino, Paolo Pasquali, Helen Clare Roberts, Liisa Helena Sihvonen, Hans Spoolder, Karl Stahl, Antonio Velarde, Arvo Viltrop and Christoph Winckler.
Declarations of interest: The declarations of interest of all scientific experts active in EFSA's work are available at https://ess.efsa.europa.eu/doi/doiweb/doisearch.
Acknowledgements: The AHAW Panel wishes to thank Peter Damborg, Carmen Espinosa‐Gongora, Steffen Lynge Jørgensen and Frida Svanberg Frisinger from the University of Copenhagen for conducting the extensive literature review under the contract OC/EFSA/ALPHA/2020/02 – LOT 1, Thomas Grönthal from University of Helsinki for the data provided on FINRES, Verena Oswaldi from EFSA and Jeroen Dewulf from Ghent University for the support provided for this scientific output.
Adopted: 19 May 2021
Notes
References
- Anresis (Federal Office of Public Health and Federal Food Safety and Veterinary Office), 2020. Swiss Antibiotic Resistance Report 2020. Usage of Antibiotics and Occurrence of Antibiotic Resistance in Bacteria from Humans and Animals in Switzerland. Available online: https://www.anresis.ch/wp-content/uploads/2020/11/Swiss-Antibiotic-Resistance-Report-2020_def_WEB.pdf
- Arais LR, Barbosa AV, Carvalho CA and Cerqueira AM, 2016. Antimicrobial resistance, integron carriage, and gyrA and gyrB mutations in Pseudomonas aeruginosa isolated from dogs with otitis externa and pyoderma in Brazil. Veterinary Dermatology, 27, 113–117e131. 10.1111/vde.12290 Epub 2016 Feb 1. [DOI] [PubMed] [Google Scholar]
- Awji EG, Damte D, Lee SJ, Lee JS, Kim YH and Park SC, 2012. The in vitro activity of 15 antimicrobial agents against bacterial isolates from dogs. Journal of Veterinary Medical Science, 74, 1091–1094. 10.1292/jvms.12-0043 Epub 2012 Apr 20. [DOI] [PubMed] [Google Scholar]
- Cain CL, Morris DO and Rankin SC, 2011. Clinical characterization of Staphylococcus schleiferi infections and identification of risk factors for acquisition of oxacillin‐resistant strains in dogs: 225 cases (2003–2009). Journal of the American Veterinary Medical Association, 239, 1566–1573. 10.2460/javma.239.12.1566 [DOI] [PubMed] [Google Scholar]
- Casagrande Proietti P, Bietta A, Coletti M, Marenzoni ML, Scorza AV and Passamonti F, 2012. Insertion sequence IS256 in canine pyoderma isolates of Staphylococcus pseudintermedius associated with antibiotic resistance. Veterinary Microbiology, 157, 376–382. 10.1016/j.vetmic.2011.12.028 Epub 2011 Dec 30. [DOI] [PubMed] [Google Scholar]
- Chang SK, Lo DY, Wei HW and Kuo HC, 2015. Antimicrobial resistance of Escherichia coli isolates from canine urinary tract infections. Journal of Veterinary Medical Science, 77, 59–65. 10.1292/jvms.13-0281 Epub 2014 Oct 28. [DOI] [PMC free article] [PubMed] [Google Scholar]
- DANMAP , 2019. Use of antimicrobial agents and occurrence of antimicrobial resistance in bacteria from food animals, food and humans in Denmark. 1600‐2032. Available online: https://www.danmap.org/Reports/2019
- Duim B, Verstappen K, Kalupahana RS, Ranathunga L, Fluit AC and Wagenaar JA, 2018. Methicillin‐resistant Staphylococcus pseudintermedius among dogs in the description of novel SCCmec variants. Veterinary Microbiology, 213, 136–141. 10.1016/j.vetmic.2017.11.022 Epub 2017 Nov 21. [DOI] [PubMed] [Google Scholar]
- EFSA AHAW Panel (EFSA Panel on Animal Health and Welfare), Nielsen SS, Bicout DJ, Calistri P, Canali E, Drewe JA, Garin‐Bastuji B, Gonzales Rojas JL, Gortazar Schmidt C, Herskin M, Michel V, Miranda Chueca MA, Padalino B, Pasquali P, Roberts HC, Sihvonen LH, Spoolder H, Stahl K, Velarde A, Viltrop A, Winckler C, Dewulf J, Guardabassi L, Hilbert F, Mader R, Smith P, Aznar I, Baldinelli F and J A, 2021. Ad hoc method for the assessment of animal diseases caused by bacteria resistant to antimicrobials. EFSA Journal 2021;19(6):6645, 29 pp. 10.2903/j.efsa.2021.6645 [DOI] [PMC free article] [PubMed] [Google Scholar]
- Eliasi UL, Sebola D, Oguttu JW and Qekwana DN, 2020. Antimicrobial resistance patterns of Pseudomonas aeruginosa isolated from canine clinical cases at a veterinary academic hospital in South Africa. Journal of the South African Veterinary Association, 91, e1–e6. 10.4102/jsava.v91i0.2052 [DOI] [PMC free article] [PubMed] [Google Scholar]
- EUCAST , 2017. EUCAST guidelines for detection of resistance mechanisms and specific resistances of clinical and/or epidemiological importance.
- FINRES‐Vet (Finnish Food Authority), 2019. Finnish Veterinary Antimicrobial Resistance Monitoring and Consumption of Antimicrobial Agents. 2669‐8307, Helsinki, Finland. Available online: https://www.ruokavirasto.fi/globalassets/viljelijat/elaintenpito/elainten-laakitseminen/antibioottiresistenssin_seuranta/finres-vet_2019_summary_en.pdf
- Germ‐Vet , 2020. Bericht zur Resistenzmonitoringstudie 2018 Resistenzsituation bei klinisch wichtigen tierpathogenen Bakterien. (BVL) BfVuL, Berlin, Germany. Available online: https://www.bvl.bund.de/SharedDocs/Berichte/07_Resistenzmonitoringstudie/Bericht_Resistenzmonitoring_2018.pdf?__blob=publicationFile&v=4
- Ghidini F, Piancastelli C, Taddei S, olfo E, Cavirani S and Cabassi CS, 2011. Antibiotic sensitivity of bacterial isolates from cases of canine dermatitis. New Microbiologica, 34, 403–408. [PubMed] [Google Scholar]
- Gobeli S, Berset C, Burgener I and Perreten V, 2012. Antimicrobial susceptibility of canine Clostridium perfringens strains from Switzerland. Schweizer Archiv fur Tierheilkunde, 154, 247–250. 10.1024/0036-7281/a000340 [DOI] [PubMed] [Google Scholar]
- Haenni M, Ponsin C, Metayer V, Medaille C and Madec JY, 2012. Veterinary hospital‐acquired infections in pets with a ciprofloxacin‐resistant CTX‐M‐15‐producing Klebsiella pneumoniae ST15 clone. Journal of Antimicrobial Chemotherapy, 67, 770–771. 10.1093/jac/dkr527 Epub 2011 Dec 16. [DOI] [PubMed] [Google Scholar]
- Haenni M, Saras E, Ponsin C, Dahmen S, Petitjean M, Hocquet D and Madec JY, 2016. High prevalence of international ESBL CTX‐M‐15‐producing Enterobacter cloacae ST114 clone in animals. Journal of Antimicrobial Chemotherapy, 71, 1497–1500. 10.1093/jac/dkw006 Epub 2016 Feb 4. [DOI] [PubMed] [Google Scholar]
- Harada K, Shimizu T, Mukai Y, Kuwajima K, Sato T, Kajino A, Usui M, Tamura Y, Kimura Y, Miyamoto T, Tsuyuki Y, Ohki A and Kataoka Y, 2017. Phenotypic and molecular characterization of antimicrobial resistance in Enterobacter spp. isolates from companion animals in Japan. PLoS ONE, 12, e0174178. 10.1371/journal.pone.0174178. eCollection 2017. [DOI] [PMC free article] [PubMed] [Google Scholar]
- Hillier A, Lloyd DH, Weese JS, Blondeau JM, Boothe D, Breitschwerdt E, Guardabassi L, Papich MG, Rankin S and Turnidge JD, 2014. Guidelines for the diagnosis and antimicrobial therapy of canine superficial bacterial folliculitis (A ntimicrobial G uidelines W orking G roup of the I nternational S ociety for C ompanion A nimal I nfectious D iseases). Veterinary Dermatology, 25, 163‐e143. [DOI] [PubMed] [Google Scholar]
- Jessen L, Damborg P, Spohr A, Sørensen T, Langhorn R, Goericke‐Pesch S, Houser G, Willesen J, Schjærff M and Eriksen T, 2019. Antibiotic Use Guidelines for Companion Animal Practice. 2nd Edition. [Google Scholar]
- de Jong A, Youala M, El Garch F, Simjee S, Rose M, Morrissey I and Moyaert H, 2020. Antimicrobial susceptibility monitoring of canine and feline skin and ear pathogens isolated from European veterinary clinics: results of the ComPath Surveillance programme. Veterinary Dermatology, 31, 431‐e114. 10.1111/vde.12886 Epub 2020 Sep 13. [DOI] [PubMed] [Google Scholar]
- KuKanich KS and Lubbers BV, 2015. Review of enterococci isolated from canine and feline urine specimens from 2006 to 2011. Journal of the American Animal Hospital Association, 51, 148–154. 10.5326/JAAHA-MS-6070 [DOI] [PubMed] [Google Scholar]
- Kunder DA, Cain CL, O'Shea K, Cole SD and Rankin SC, 2015. Genotypic relatedness and antimicrobial resistance of Staphylococcus schleiferi in clinical samples from dogs in different geographic regions of the United States. Veterinary Dermatology, 26, 406–410. 10.1111/vde.12254 Epub 2015 Sep 15. [DOI] [PubMed] [Google Scholar]
- Lane MJ, Roy AF, Kearney MT and Pucheu‐Haston CM, 2018. Characterization, distribution, antimicrobial resistance and resistance risk factors in staphylococci isolated from cats from 2001 to 2014. Vet Med Sci, 4, 315–325. 10.1002/vms3.122 Epub 2018 Sep 10. [DOI] [PMC free article] [PubMed] [Google Scholar]
- Larsen R, Boysen L, Berg J, Guardabassi L and Damborg P, 2015. Lincosamide resistance is less frequent in Denmark in Staphylococcus pseudintermedius from first‐time canine superficial pyoderma compared with skin isolates from clinical samples with unknown clinical background. Veterinary Dermatology, 26, 202–205, e243‐204. 10.1111/vde.12209 Epub 2015 Apr 18. [DOI] [PubMed] [Google Scholar]
- Lin D, Foley SL, Qi Y, Han J, Ji C, Li R, Wu C, Shen J and Wang Y, 2012. Characterization of antimicrobial resistance of Pseudomonas aeruginosa isolated from canine infections. Journal of Applied Microbiology, 113, 16–23. 10.1111/j.1365-2672.2012.05304.x Epub 2012 May 3. [DOI] [PubMed] [Google Scholar]
- Ludwig C, de Jong A, Moyaert H, El Garch F, Janes R, Klein U, Morrissey I, Thiry J and Youala M, 2016. Antimicrobial susceptibility monitoring of dermatological bacterial pathogens isolated from diseased dogs and cats across Europe (ComPath results). Journal of Applied Microbiology, 121, 1254–1267. 10.1111/jam.13287 [DOI] [PubMed] [Google Scholar]
- Mader R, Damborg P, Amat J‐P, Bengtsson B, Bourély C, Broens EM, Busani L, Crespo‐Robledo P, Filippitzi M‐E and Fitzgerald W, 2021. Building the European Antimicrobial Resistance Surveillance network in veterinary medicine (EARS‐Vet). Eurosurveillance, 26, 2001359. [DOI] [PMC free article] [PubMed] [Google Scholar]
- Mekic S, Matanovic K and Seol B, 2011. Antimicrobial susceptibility of Pseudomonas aeruginosa isolates from dogs with otitis externa. Veterinary Record, 169, 125. 10.1136/vr.d2393 Epub 2011 Jul 8. [DOI] [PubMed] [Google Scholar]
- Moyaert H, de Jong A, Simjee S, Rose M, Youala M, El Garch F, Vila T, Klein U, Rzewuska M and Morrissey I, 2019. Survey of antimicrobial susceptibility of bacterial pathogens isolated from dogs and cats with respiratory tract infections in Europe: ComPath results. Journal of Applied Microbiology, 127, 29–46. 10.1111/jam.14274 Epub 2019 May 16. [DOI] [PubMed] [Google Scholar]
- Norm/Norm-Vet , 2019. Usage of Antimicrobial Agents and Occurrence of Antimicrobial Resistance in Norway. 1502‐2307 (print)/1890-9965 (electronic), Tromsø/Oslo 2020. Available online: https://www.vetinst.no/en/surveillance-programmes/norm-norm-vet-report
- Onuma K, Tanabe T and Sato H, 2012. Antimicrobial resistance of Staphylococcus pseudintermedius isolates from healthy dogs and dogs affected with pyoderma in Japan. Veterinary Dermatology, 23, 17–22. 10.1111/j.1365-3164.2011.00995.x Epub 2011 Jul 11. [DOI] [PubMed] [Google Scholar]
- Penna B, Thomé S, Martins R, Martins G and Lilenbaum W, 2011. In vitro antimicrobial resistance of Pseudomonas aeruginosa isolated from canine otitis externa in Rio de Janeiro, Brazil. Braz J Microbiol, 42, 1434–1436. 10.1590/S1517-838220110004000027 Epub 2011 Dec 1. [DOI] [PMC free article] [PubMed] [Google Scholar]
- Rampacci E, Bottinelli M, Stefanetti V, Hyatt DR, Sgariglia E, Coletti M and Passamonti F, 2018. Antimicrobial susceptibility survey on bacterial agents of canine and feline urinary tract infections: weight of the empirical treatment. J Glob Antimicrob Resist, 13, 192–196. 10.1016/j.jgar.2018.01.011 Epub 2018 Feb 3. [DOI] [PubMed] [Google Scholar]
- Resapath (ANSES) , 2021. French surveillance network for antimicrobial resistance in bacteria from diseased animals 2019 Annual report. Available online: https://www.anses.fr/fr/system/files/LABO-Ra-Resapath2019EN.pdf
- Rheinwald M, Hartmann K, Hahner M, Wolf G, Straubinger RK and Schulz B, 2015. Antibiotic susceptibility of bacterial isolates from 502 dogs with respiratory signs. The Veterinary Record, 176, 357. 10.1136/vr.102694 Epub 2014 Dec 2. [DOI] [PubMed] [Google Scholar]
- Saputra S, Jordan D, Worthing KA, Norris JM, Wong HS, Abraham R, Trott DJ and Abraham S, 2017. Antimicrobial resistance in coagulase‐positive staphylococci isolated from companion animals in Australia: a one year study. PLoS ONE, 12, e0176379. 10.1371/journal.pone.0176379.eCollection [DOI] [PMC free article] [PubMed] [Google Scholar]
- Swedres‐Svarm , 2019. Sales of antibiotics and occurrence of resistance in Sweden. 1650‐6332 Solna/Uppsala. Available online: https://www.sva.se/media/0hihej1c/swedres-svarm-2019.pdf
- Tsuyuki Y, Kurita G, Murata Y and Takahashi T and Veterinary Infection Control Association Sepsis Working G, 2018. Bacteria isolated from companion animals in Japan (2014‐2016) by blood culture. Journal of Infection and Chemotherapy: Official Journal of the Japan Society of Chemotherapy, 24, 583–587. 10.1016/j.jiac.2018.01.014. Epub 2018 Feb 24. [DOI] [PubMed] [Google Scholar]
- Weese JS, Blondeau J, Boothe D, Guardabassi LG, Gumley N, Papich M, Jessen LR, Lappin M, Rankin S and Westropp JL, 2019. International Society for Companion Animal Infectious Diseases (ISCAID) guidelines for the diagnosis and management of bacterial urinary tract infections in dogs and cats. The Veterinary Journal, 247, 8–25. [DOI] [PubMed] [Google Scholar]
- Windahl U, Holst BS, Nyman A, Gronlund U and Bengtsson B, 2014. Characterisation of bacterial growth and antimicrobial susceptibility patterns in canine urinary tract infections. BMC Veterinary Research, 10, 217. 10.1186/s12917-014-0217-4 [DOI] [PMC free article] [PubMed] [Google Scholar]