

Abstract
Background:
The International Agency for Research on Cancer (IARC) classifies diesel engine exhaust as carcinogenic to humans based on sufficient evidence for lung cancer. IARC noted, however, an increased risk of bladder cancer (based on limited evidence).
Objective:
To evaluate the association between quantitative, lifetime occupational diesel exhaust exposure and risk of urothelial cell carcinoma of the bladder (UBC) overall and according to pathological subtypes.
Methods:
Data from personal interviews with 1944 UBC cases, as well as formalin-fixed paraffin-embedded tumor tissue blocks, and 2135 controls were pooled from two case-control studies conducted in the U.S. and Spain. Lifetime occupational histories combined with exposure-oriented questions were used to estimate cumulative exposure to respirable elemental carbon (REC), a primary surrogate for diesel exhaust. Unconditional logistic regression and two-stage polytomous logistic regression were used to calculate odds ratios (ORs) and 95% confidence intervals (CIs), adjusting for smoking and other risk factors.
Results:
Exposure to cumulative REC was associated with an increased risk of UBC; workers with cumulative REC > 396 μg/m3-years had an OR of 1.61 (95% CI, 1.08–2.40). At this level of cumulative exposure, similar results were observed in the U.S. and Spain, OR = 1.75 (95% CI, 0.97–3.15) and OR = 1.54 (95% CI, 0.89–2.68), respectively. In lagged analysis, we also observed a consistent increased risk among workers with cumulative REC > 396 μg/m3-years (range of ORs = 1.52–1.93) for all lag intervals evaluated (5–40 years). When we accounted for tumor subtypes defined by stage and grade, a significant association between diesel exhaust exposure and UBC was apparent (global test for association p = 0.0019).
Conclusions:
Combining data from two large epidemiologic studies, our results provide further evidence that diesel exhaust exposure increases the risk of UBC.
Keywords: Bladder cancer, Diesel exhaust, Occupation
1. Introduction
In 2012, the International Agency for Research on Cancer (IARC) classified diesel engine exhaust as carcinogenic to humans (Group 1) based on sufficient positive evidence for lung cancer. The working group also noted a positive association between diesel exhaust and risk of bladder cancer based on limited evidence in humans (Benbrahim-Tallaa et al., 2012; IARC, 2014). The link between diesel exhaust and bladder cancer risk has largely come from studies of specific occupations where diesel exhaust exposure was inferred (including truck drivers, mechanics, railroad workers, and operators of heavy equipment). Boffetta & Silverman conducted a meta-analysis of diesel exhaust exposure among occupations with high exposure and found that the summary relative risks for bladder cancer were 1.23 (95% CI, 1.12–1.36) for any exposure and 1.44 (95% CI, 1.18–1.76) for high exposure to diesel exhaust (Boffetta and Silverman, 2001). Few studies have been able to go beyond job title to assess lifetime individual diesel exhaust exposure (IARC, 2014), and none have incorporated quantitative estimates for respirable elemental carbon (REC), the primary surrogate for diesel exhaust exposure (Birch and Cary, 1996). Further, little is known about the mechanisms by which diesel exhaust might lead to bladder cancer. Although new molecular subtypes of bladder cancer are being uncovered, alterations in TP53 and FGFR3 still delineate the two major subtypes, where FGFR3 alterations are commonly found in non-muscle invasive bladder cancer and TP53 alterations are common in the more aggressive subtype, muscle-invasive bladder cancer (stage T2+) (Knowles and Hurst, 2015).
Here we examined the association between quantitative, lifetime occupational diesel exhaust exposure and risk of urothelial cell carcinoma (UBC) in two large case-control studies in the United States (U.S.) and Spain. In addition, we evaluated heterogeneity in the diesel exhaust-UBC relationship by tumor subtypes including stage, grade, as well as expression and mutation of TP53 and FGFR3.
2. Methods
2.1. Study populations
Data from two UBC case-control studies were included in the current analysis. The New England Bladder Cancer Study (NEBCS), a large population-based case-control study, included 1213 cases and 1418 controls from three New England states. Cases in the NEBCS were all patients with histologically confirmed UBC newly diagnosed between 2001 and 2004 among residents of Maine, New Hampshire, and Vermont, ages 30 to 79 years. A total of 1213 UBC patients were ascertained through hospital pathology departments and hospital and state cancer registries and interviewed (65% of eligible cases were interviewed). Control subjects were selected randomly from state Department of Motor Vehicle records (age 30–64 years) and Centers for Medicare and Medicaid Services beneficiary records (age 65–79 years), frequency matched to case patients on state, sex, and five-year age group at diagnosis/interview. A total of 1418 (594 Department of Motor Vehicle, 824 Centers for Medicare and Medicaid Services) control subjects (65% of eligible Department of Motor Vehicle and 65% of eligible Centers for Medicare and Medicaid Services control subjects) were interviewed.
The Spanish Bladder Cancer Study (SBCS), a large hospital-based case-control study of 1219 cases and 1271 controls, was conducted in 18 hospitals from 5 areas in Spain. Cases in the SBCS were patients newly diagnosed with histologically confirmed UBC in 1998–2001, aged 21–80 years. A total of 1219 cases were interviewed (84% of eligible cases). For each case, one control was selected and individually matched on age (within 5 years) at diagnosis/interview, gender, race/ethnicity and hospital. Controls were selected from patients admitted to the same hospital around the same time as the cases for diseases/conditions unrelated to the exposures under study. A total of 1271 controls were interviewed (88% of eligible controls).
A standardized histopathology review to assign stage and grade was carried out for each study by a study pathologist (A.S. for NEBCS and J.L. and Y.A. for SBCS). Tumors were staged according to TNM criteria of the American Joint Commission on Cancer (Sobin, 2009; Sobin, 2002) and for grade according to both the 1973 WHO and 2004 WHO/ISUP criteria (Eble et al., 2004; Mostfi, 1973). For both studies, participants were interviewed by trained interviewers using the same instrument, a computer-assisted personal interview. We obtained detailed information on demographics, use of tobacco products, lifetime occupational histories, family history of cancer, dietary factors, and residential histories.
The current analysis includes 1944 newly diagnosed UBC cases and 2135 controls among eligible males with occupational histories. Women were excluded due to few diesel-exposed jobs. Representative high diesel-exposed jobs among men were heavy and tractor-trailer truck drivers, bus, truck and heavy equipment engine mechanics and repairers, and material moving equipment operators (e.g., grader, dozer, and scraper and industrial truck and tractor). Analytic exclusions for each study were as follows: in the NEBCS, of the 1213 interviewed cases, we excluded 20 patients who were found not to have UBC based on a pathologist’s review, 23 patients with non-urothelial carcinomas and 273 female patients, leaving 897 cases for analysis. Among the 1418 interviewed controls, we excluded 9 participants based on incomplete work histories, and 372 females, leaving 1037 controls for analysis. In the SBCS, among 1219 interviewed cases, we excluded 16 patients with non-urothelial carcinomas, 36 with incomplete work histories and 120 female patients, leaving 1047 cases for analysis. Among the 1271 interviewed controls, we excluded 50 participants based on incomplete work histories and 123 females, leaving 1098 controls for analysis.
All participants provided written consent. The study protocol was approved by all appropriate institutional review boards.
2.1.1. Tumor markers
Formalin-fixed paraffin-embedded tumor tissue blocks assembled as tissue microarrays (TMAs) from UBC cases enrolled in the Maine and Vermont components of the NEBCS and individual slides in the SBCS were used to examine protein expression of TP53 and FGFR3. Details of the immunohistochemical (IHC) methods for each marker have been published elsewhere (for NEBCS: p53 (Lenz et al., 2012) and FGFR3 (Figueroa et al., 2015); for SBCS: p53 (Balbas-Martinez et al., 2013) and FGFR3 (Amaral et al., 2012)). Antibodies used for P53 and FGFR3 expression were the same in both studies. Immunohistochemical scoring for P53 and FGFR3 expression in both the NEBCS and SBCS have been previously described (Lenz et al., 2012; Figueroa et al., 2015; Balbas-Martinez et al., 2013; Amaral et al., 2012). Briefly, f or T P 53,quantitative scoring models were used to compute the percentage of positive cells. In addition, immunoreactivity was scored according to levels of intensity and a histoscore was calculated as the product of intensity and percentage of positive cells. FGFR3 expression was found to be both cytoplasmic and membranous. Cells were scored according to staining intensity and location (NEBCS) as well as the proportion of reactive cells (SBCS).
Serial sections from tumor blocks (5-μm in NEBCS and 10-μm in SBCS) were cut to extract nucleic acids for characterization of TP53 and FGFR3 somatic mutations. In the NEBCS, tumor regions as annotated on digital images were hand macrodissected from three 5 μm sections and placed into 1.5 ml microcentrifuge tubes. DNA was isolated using the phenol-based AutoGenprep 245 T Animal Tissue DNA Extraction Kit (Autogen) according to the manufacturer’s method. Yield and purity were determined by NanoDrop 1000 spectrophotometer (Thermo Fisher Scientific, Waltham, MA). In the SBCS, areas containing > 50% tumor cells were manually macrodissected from three to five consecutive 10-μm sections and DNA was extracted using the DNeasy tissue kit (Qiagen GmbH, Hilden, Germany). Exons 7, 10, and 15 of FGFR3 and Exons 5 to 8 of TP53, which harbor the majority of mutations observed in bladder tumors, were amplified and sequenced u sing the SnapSHOT assay (for 11 known FGFR3 mutations) or double stranded Sanger Sequencing using Big Dye v.3.1 (Thermo Fisher Scientific) in both studies (described elsewhere) (Balbas-Martinez et al., 2013; Hernandez et al., 2005; Hafner et al., 2006).
In the current analysis, immunophenotype was dichotomized as follows: “P 53 IHC” (≤5% of positive cells and > 5% positive cells), “P53 Histoscore” (greater and less than the median histoscore), “FGFR3 IHC” (high expression/strong staining vs. intermediate/weak). Mutation status (“TP53 Mut” and “FGFR3 Mut”) was dichotomized as the presence or absence of any observed mutation.
Tumor characteristics were available on a subset of all analytic cases (58.8% of cases for P 53 immunohistochemistry, 21.7% of cases for TP53 mutation, 44.4% of cases for FGFR3 mutation, and 46.4% of cases for FGFR3 immunohistochemistry).
2.2. Lifetime occupational histories and diesel exhaust exposure assessment
The main metric of analysis in the current study was cumulative respirable elemental carbon (REC) exposure. The cumulative exposure calculation was limited to jobs with a probability of exposure ≥50% (jobs where the estimated proportion of workers exposed to diesel exhaust was ≥50%). This metric was calculated by summing the product of intensity of exposure, frequency of exposure and duration of exposure over all jobs. Exposure intensity was assessed on a continuous scale as the estimated average REC exposure level (μg/m3) for a given job based on an extensive review of the diesel exhaust occupational health literature that identified diesel-exposed tasks, jobs, industries, and secular changes in the prevalence of diesel engine use (Pronk et al., 2009). Frequency (hours/week) and duration (years) of exposure were collected in both studies using lifetime occupational histories (all jobs a subject held for at least 6 months since age 16) (Colt et al., 2011; Samanic et al., 2008). In the occupational histories, participants were queried about location (indoor/outdoor), job dates, activities performed, products/services made/provided, and equipment/chemicals handled. For each job, two additional questions were asked about working near engines or about smelling engine exhaust, including diesel. Additional exposure-oriented questions were asked to obtain detailed information on diesel exposure for subjects responding “yes” to the engine questions and for those in jobs or industries with potential for diesel exhaust.
In the NEBCS, an industrial hygienist blindly assigned probability and intensity of diesel exposure for each job (while frequency and duration came from direct participant response). Based on the NEBCS, decision rules were extracted from the industrial hygienists estimates and questionnaire response patterns using a classification tree model (CART) in order to obtain estimates of probability (< 5%, 5–49%, 50–79%, ≥80%), intensity (< 0.25, 0.25 to < 5, 5 to < 20, and ≥20 µg/m3 REC), and frequency (< 0.25, 0.25– < 8, 8– < 20, ≥20 h/week) of diesel exhaust exposure. The decision rules from the NEBCS were then applied to questionnaire response patterns in the SBCS in order to obtain estimates of probability, intensity, and frequency of exposure to diesel exhaust (Friesen et al., 2016). An additional focused expert review of a subset of jobs was employed in the SBCS when we were less confident in the classification tree models’ estimates or the classification tree estimates of different metrics were discordant.
A list of the main job titles contributing to diesel exposure in the two study populations is provided in Appendix A.1.
2.3. Statistical analysis
Unconditional logistic regression was used to calculate odds ratios (ORs) and 95% confidence intervals (CIs) for the relationship between diesel exhaust and UBC. Models were adjusted for age, race, study, smoking, and non-diesel exposed high-risk occupations for UBC (Silverman et al., 2018). Exposure categories were defined in quartiles with the top quartile further divided at the > 75–90th percentile, > 90–95th percentile, > 95th percentile based on the distribution of exposure in the controls. We also evaluated the risk of bladder cancer for cumulative REC exposure by decade of first diesel exposed job, as well as by various lag periods (5–40 years). We calculated tests for linear trend using the Wald test, treating the median value for each category (including unexposed) among control subjects as continuous. P-values for interaction were computed by comparing nested models with and without the cross-product terms based on a likelihood ratio test.
We used a novel two-stage polytomous logistic regression model (Zhang et al., 2018) as modified from Chatterjee (Chatterjee, 2004) to evaluate the relationship between diesel exhaust and UBC risk while assessing heterogeneity by tumor subtypes as defined by stage (Ta, T1, T2+), grade (G1, G2, G3), p53 and FGFR3 immunohistochemical (IHC) phenotype (positive vs. negative expression, see supplementary methods for dichotomization) and TP53 and FGFR3 somatic mutations (dichotomized as the presence/absence of mutation). This method allows for efficient testing of exposure-disease associations in the presence of tumor subtype heterogeneity defined by multiple disease characteristics, while accounting for multiple comparisons and missing data on tumor markers/features. The model provides a global test for association (diesel exhaust-UBC) in the presence of heterogeneity by tumor features, as well as individual tests for heterogeneity of each tumor marker, adjusting for the other markers in the model. In the current analysis, we fitted separate models for each tumor marker (TP53 and FGFR3) with stage and grade. The final model included only the significant tumor markers, stage and grade.
3. Results
Table 1 shows the characteristics of male cases of UBC and controls in both studies. Cases who were exposed to diesel exhaust had a median of 26 years of exposure while controls had a median of 27 years of exposure; cumulative REC exposure among controls was more than twice as high in the SBCS compared to the NEBCS. Compared with cases from the NEBCS, incident tumors of cases in the SBCS were more likely to be muscle-invasive (23.0% vs. 13.2%) and have a higher grade.
Table 1.
Descriptive characteristics of male UBC cases and controls in the New England and Spanish Bladder Cancer Studies.
| Characteristic | Total | New England | Spain | |||
|---|---|---|---|---|---|---|
| Cases n (%) N = 1944 |
Controls n (%)N = 2135 |
Cases n (%)N = 897 |
Controls n (%) N = 1037 |
Cases n (%) N = 1047 |
Controls n (%) N = 1098 |
|
| Age | ||||||
| < 65 | 762 (39.2) | 894 (41.9) | 377 (42.0) | 421 (40.6) | 385 (36.8) | 473 (43.1) |
| 65–74 | 796 (40.9) | 870 (40.7) | 340 (37.9) | 409 (39.4) | 456 (43.5) | 461 (41.9) |
| 75+ | 386 (19.9) | 371 (17.4) | 180 (20.0) | 207 (20.0) | 206 (19.7) | 164 (14.9) |
| Smoking Status | ||||||
| Never | 170 (8.7) | 534 (25.0) | 114 (12.7) | 307 (29.6) | 56 (5.3) | 227 (20.7) |
| Occasional | 54 (2.7) | 107 (5.0) | 19 (2.1) | 24 (2.3) | 35 (3.3) | 83 (7.6) |
| Regular | ||||||
| Former | 968 (49.8) | 1058 (49.6) | 484 (54.0) | 556 (53.6) | 484 (46.2) | 502 (45.7) |
| Current | 745 (38.3) | 429 (20.1) | 279 (31.1) | 149 (14.4) | 466 (44.5) | 280 (25.5) |
| Missing | 7 (<1) | 7 (<1) | 1 (<1) | 1 (<1) | 6 (<1) | 6 (<1) |
| Stage | ||||||
| Carcinoma in situ | 50 (2.6) | – | 50 (5.6) | – | 0 | – |
| Ta | 1215 (62.5) | – | 568 (63.3) | – | 647 (61.8) | – |
| T1 | 281 (14.5) | – | 159 (17.7) | – | 122 (11.7) | – |
| T2+ | 359 (18.5) | – | 118 (13.2) | – | 241 (23.0) | – |
| Grade | ||||||
| G1 | 712 (37.6) | – | 397 (44.3) | – | 315 (30.1) | – |
| G2 | 473 (25.0) | – | 176 (20.8) | – | 297 (28.4) | – |
| G3 | 664 (35.1) | – | 266 (31.4) | – | 398 (38.0) | – |
| Probability of diesel exposure | ||||||
| Unexposed | 760 (39) | 857 (40) | 240 (27) | 319 (31) | 520 (50) | 538 (50) |
| < 50% exposure probability | 258 (13) | 245 (12) | 154 (17) | 153 (15) | 104 (10) | 92 (8) |
| ≥50% exposure probability | 926 (48) | 1033 (48) | 503 (56) | 565 (55) | 423 (40) | 468 (43) |
| Duration of diesel-exposed jobs (median years, IQR) | 26 (9–45) | 27 (9–46) | 23 (8–48) | 24 (8–47) | 28 (11–43) | 29 (11–45) |
| Cumulative Diesel Exposure (μg/m3 REC-years) (median, IQR) | 26 (6–96) | 26 (5–98) | 16 (3–85) | 15 (3–69) | 38 (10–112) | 39 (10–116) |
Percentages may not sum to 100 due to rounding.
No significant associations between ever exposure, duration (alone), or intensity of exposure (alone) and risk of bladder cancer were observed (data not shown). Table 2 shows the ORs and 95% CIs for cumulative REC exposure, by study and stratified by smoking status. Cumulative REC was associated with an increased risk of UBC, with the highest level of cumulative REC > 396 μg/m3-years having an OR of 1.61 (95% CI, 1.08–2.40) compared to unexposed subjects (p-trend = 0.08). At this level of cumulative exposure, nonsignificant, elevated risks were observed in both the NEBCS (OR = 1.75; 95% CI, 0.97–3.15) and SBCS (OR = 1.54; 95% CI, 0.89–2.68). Among never smokers, we observed a trend in risk with increasing cumulative REC (p-trend = 0.05); subjects with levels of cumulative REC > 254 μg/m3-years had an OR of 1.94 (95% CI, 0.91–4.12), while little or no excess risks were seen among former and current smokers (Table 2). The p-value for interaction between diesel exhaust and smoking among all participants was not statistically significant (p = 0.49), although evidence of an interaction was more pronounced in New England than in Spain (p-value for interaction in NEBCS = 0.14 and SBCS = 0.79).
Table 2.
Odds ratios (ORs) and 95% confidence intervals (CIs) for cumulative REC exposure overall, by study and smoking status.
| Exposure Metric | Ca | Co | Overall OR* 95% CI |
Ca | Co | NEBCS OR* 95% CI |
Ca | Co | SBCS OR* 95% CI |
|
|---|---|---|---|---|---|---|---|---|---|---|
| Cumulative REC (μg/m3-years)¶ | ||||||||||
| Overall | ||||||||||
| Unexposed | 760 | 857 | 1.0 | 240 | 319 | 1.0 | 520 | 538 | 1.0 | |
| > 0–5 | 225 | 258 | 1.01 (0.81, 1.27) | 161 | 186 | 1.08 (0.81, 1.45) | 64 | 72 | 0.86 (0.59, 1.26) | |
| > 5–25 | 232 | 258 | 0.96 (0.78, 1.20) | 128 | 140 | 0.95 (0.69, 1.3) | 104 | 118 | 1.00 (0.73, 1.36) | |
| > 25–98 | 241 | 258 | 1.09 (0.88, 1.35) | 101 | 124 | 0.90 (0.64, 1.25) | 140 | 134 | 1.28 (0.96, 1.71) | |
| > 98–254 | 126 | 154 | 0.95 (0.72, 1.24) | 62 | 69 | 1.00 (0.67, 1.50) | 64 | 85 | 0.91 (0.63, 1.33) | |
| > 254–396 | 36 | 53 | 0.81 (0.51, 1.29) | 19 | 22 | 1.04 (0.53, 2.05) | 17 | 31 | 0.69 (0.36, 1.30) | |
| > 396 | 66 | 52 | 1.61 (1.08, 2.40) | 32 | 24 | 1.75 (0.97, 3.15) | 34 | 28 | 1.54 (0.89, 2.68) | |
| p-trend | 0.08 | 0.09 | 0.33 | |||||||
| Among Never Smokers | ||||||||||
| Unexposed | 71 | 226 | 1.0 | 42 | 117 | 1.0 | 29 | 109 | 1.0 | |
| > 0–25 | 42 | 142 | 0.81 (0.51, 1.29) | 34 | 104 | 0.83 (0.48, 1.44) | 8 | 38 | 0.84 (0.33, 2.14) | |
| > 25–254 | 25 | 93 | 1.03 (0.59, 1.78) | 13 | 41 | 0.96 (0.45, 2.07) | 12 | 52 | 1.11 (0.49, 2.49) | |
| > 254 | 14 | 27 | 1.94 (0.91, 4.12) | 8 | 11 | 2.47 (0.85, 7.17) | 6 | 16 | 1.66 (0.55, 5.04) | |
| p-trend | 0.05 | 0.07 | 0.31 | |||||||
| Among Former Smokers | ||||||||||
| Unexposed | 364 | 410 | 1.0 | 126 | 153 | 1.0 | 238 | 257 | 1.0 | |
| > 0–25 | 216 | 258 | 0.96 (0.75, 1.23) | 151 | 179 | 0.95 (0.68, 1.33) | 65 | 79 | 0.95 (0.64, 1.40) | |
| > 25–254 | 179 | 186 | 1.22 (0.94, 1.58) | 85 | 106 | 1.02 (0.70, 1.50) | 94 | 80 | 1.44 (1.00, 2.08) | |
| > 254 | 50 | 50 | 1.25 (0.81, 1.91) | 26 | 23 | 1.53 (0.82, 2.86) | 24 | 27 | 1.05 (0.58, 1.91) | |
| p-trend | 0.19 | 0.14 | 0.61 | |||||||
| Among Current Smokers | ||||||||||
| Unexposed | 295 | 171 | 1.0 | 65 | 44 | 1.0 | 230 | 127 | 1.0 | |
| > 0–25 | 185 | 97 | 1.12 (0.81, 1.55) | 99 | 32 | 1.79 (1.01, 3.17) | 86 | 65 | 0.81 (0.54, 1.22) | |
| > 25–254 | 155 | 102 | 0.91 (0.66, 1.26) | 62 | 42 | 0.87 (0.49, 1.53) | 93 | 60 | 0.93 (0.62, 1.40) | |
| > 254 | 37 | 23 | 1.00 (0.57, 1.78) | 17 | 11 | 1.04 (0.43, 2.50) | 20 | 12 | 1.03 (0.48, 2.21) | |
| p-trend | 0.77 | 0.46 | 0.82 | |||||||
| psmoking-interaction | 0.49 | 0.14 | 0.79 | |||||||
Abbreviations: Odds ratio (OR), confidence interval (CI), Cases (Ca), Controls (Co), respirable elemental carbon (REC).
Adjusted for age, race, study, smoking status, and non-diesel exposed high-risk occupations.
Cumulative REC categories defined by 25th (5 μg/m3-years), 50th (25 μg/m3-years), 75th (98 μg/m3-years) with the top quartile further divided at the 90th (254 μg/m3-years) and 95th percentile (396 μg/m3-years) among exposed controls.
Time-period analyses by decade of first diesel exhaust-exposed job showed a statistically significant increased risk among heavily exposed men who were first exposed in the 1950s in both studies (overall cumulative REC > 396 μg/m3-years: OR = 1.97, 95% CI, 1.05–3.72) (Table 3). To accommodate this secular effect, we estimated the exposure-response by various lag intervals (Table 4). We observed a consistent positive association between cumulative REC > 396 μg/m3-years (vs. unexposed) and bladder cancer risk for all lag intervals evaluated: lagged 5-years, OR = 1.52, 95% CI, 1.01–2.29; lagged 10-years, OR = 1.65, 95% CI, 1.07–2.55; lagged 15-years, OR = 1.73, 95% CI, 1.10–2.71; lagged 20-years, OR = 1.93, 95% CI, 1.19–3.15; lagged 25-years, OR = 1.83, 95% CI, 1.06–3.18; lagged 30-years, OR = 1.79, 95% CI, 0.93–3.45; lagged 35-years, OR = 1.92, 95% CI, 0.85–4.31; lagged 40-years, OR = 1.66, 95% CI, 0.68–4.05. In contrast, a gradient in risk with increasing cumulative REC was only apparent when exposure was lagged 40 years.
Table 3.
Odds ratios and 95% confidence intervals for cumulative REC exposure by decade of first diesel exposed job.
| Cumulative REC (μg/m3-years)* | Decade of 1st diesel exposed job¶ |
|||||||||||
|---|---|---|---|---|---|---|---|---|---|---|---|---|
| < 1950 | 1950s | 1960s | 1970s | |||||||||
| Ca | Co | OR** 95% CI | Ca | Co | OR** 95% CI | Ca | Co | OR** 95% CI | Ca | Co | OR** 95% CI | |
| Unexposed | 760 | 857 | 1.0 | 760 | 857 | 1.0 | 760 | 857 | 1.0 | 760 | 857 | 1.0 |
| > 0–25 | 35 | 34 | 1.11 (0.66, 1.86) | 150 | 155 | 1.08 (0.83, 1.42) | 115 | 132 | 0.88 (0.66, 1.18) | 83 | 109 | 0.84 (0.60, 1.17) |
| > 25–254 | 52 | 41 | 1.39 (0.89, 2.18) | 120 | 144 | 0.96 (0.72, 1.27) | 116 | 137 | 0.97 (0.73, 1.30) | 60 | 75 | 0.96 (0.66, 1.41) |
| > 254–396 | 8 | 15 | 0.63 (0.25, 1.55) | 12 | 16 | 0.93 (0.42, 2.03) | 6 | 11 | 0.67 (0.23, 1.97) | 8 | 9 | 0.84 (0.30, 2.39) |
| > 396 | 17 | 14 | 1.50 (0.71, 3.18) | 25 | 20 | 1.97 (1.05, 3.72) | 19 | 14 | 1.40 (0.67, 2.90) | 5 | 4 | 1.21 (0.29, 5.06) |
| p-trend | 0.44 | 0.08 | 0.51 | 0.96 | ||||||||
Exposure categories as unexposed, > 0–50th percentile, > 50–90th percentile, > 90–95th percentile, and > 95th percentile.
Adjusted for age, race, study, smoking status, and non-diesel exposed high-risk occupations.
Estimates for 1980s and 1990s not shown due to few exposed cases.
Table 4.
Odds ratios and 95% confidence intervals for cumulative REC exposure lagged by various intervals.
| Cumulative REC (μg/m3-years)* | Ca | Co | OR** 95% CI |
|---|---|---|---|
| Lag-5 years | |||
| Unexposed | 773 | 869 | 1.0 |
| > 0–5 | 222 | 256 | 0.99 (0.79, 1.24) |
| > 5–25 | 233 | 263 | 0.95 (0.77, 1.18) |
| > 25–98 | 239 | 261 | 1.06 (0.85, 1.31) |
| > 98–254 | 123 | 138 | 1.03 (0.78, 1.36) |
| > 254–396 | 35 | 53 | 0.78 (0.49, 1.24) |
| > 396 | 61 | 50 | 1.52 (1.01, 2.29) |
| p-trend | 0.12 | ||
| Lag-10 years | |||
| Unexposed | 785 | 884 | |
| > 0–5 | 225 | 256 | 1.01 (0.81, 1.27) |
| > 5–25 | 237 | 270 | 0.93 (0.75, 1.16) |
| > 25–98 | 233 | 264 | 1.03 (0.83, 1.27) |
| > 98–254 | 115 | 121 | 1.11 (0.83, 1.48) |
| > 254–396 | 36 | 52 | 0.81 (0.51, 1.29) |
| > 396 | 55 | 43 | 1.65 (1.07, 2.55) |
| p-trend | 0.053 | ||
| Lag-15 years | |||
| Unexposed | 805 | 901 | 1.0 |
| > 0–5 | 231 | 269 | 0.97 (0.78, 1.21) |
| > 5–25 | 242 | 259 | 0.98 (0.79, 1.21) |
| > 25–98 | 221 | 266 | 0.96 (0.77, 1.19) |
| > 98–254 | 107 | 109 | 1.12 (0.83, 1.51) |
| > 254–396 | 29 | 47 | 0.73 (0.44, 1.2=0) |
| > 396 | 51 | 39 | 1.73 (1.10, 2.71) |
| p-trend | 0.057 | ||
| Lag-20 years | |||
| Unexposed | 835 | 941 | 1.0 |
| > 0–5 | 231 | 281 | 0.92 (0.74, 1.15) |
| > 5–25 | 234 | 250 | 0.98 (0.79, 1.22) |
| > 25–98 | 227 | 244 | 1.10 (0.88, 1.36) |
| > 98–254 | 94 | 103 | 1.03 (0.75, 1.41) |
| > 254–396 | 19 | 40 | 0.58 (0.33, 1.05) |
| > 396 | 46 | 31 | 1.93 (1.19, 3.15) |
| p-trend | 0.050 | ||
| Lag-25 years | |||
| Unexposed | 898 | 1003 | 1.0 |
| > 0–5 | 243 | 281 | 0.95 (0.77, 1.17) |
| > 5–25 | 219 | 235 | 1.03 (0.83, 1.28) |
| > 25–98 | 188 | 233 | 0.91 (0.73, 1.14) |
| > 98–254 | 82 | 86 | 1.14 (0.81, 1.59) |
| > 254–396 | 21 | 27 | 0.99 (0.54, 1.82) |
| > 396 | 35 | 25 | 1.83 (1.06, 3.18) |
| p-trend | 0.039 | ||
| Lag-30 years | |||
| Unexposed | 965 | 1093 | 1.0 |
| > 0–5 | 244 | 278 | 0.95 (0.77, 1.17) |
| > 5–25 | 210 | 220 | 1.09 (0.88, 1.37) |
| > 25–98 | 164 | 191 | 0.99 (0.78, 1.26) |
| > 98–254 | 59 | 70 | 1.02 (0.70, 1.49) |
| > 254–396 | 20 | 20 | 1.18 (0.61, 2.29) |
| > 396 | 24 | 18 | 1.79 (0.93, 3.45) |
| p-trend | 0.09 | ||
| Lag-35 years | |||
| Unexposed | 1082 | 1225 | 1.0 |
| > 0–5 | 235 | 247 | 1.05 (0.85, 1.30) |
| > 5–25 | 158 | 205 | 0.92 (0.72, 1.16) |
| > 25–98 | 135 | 134 | 1.13 (0.86, 1.47) |
| > 98–254 | 46 | 50 | 1.14 (0.74, 1.76) |
| > 254–396 | 12 | 19 | 0.95 (0.44, 2.06) |
| > 396 | 18 | 10 | 1.92 (0.85, 4.31) |
| p-trend | 0.12 | ||
| Lag-40 years | |||
| Unexposed | 1207 | 1386 | 1.0 |
| > 0–5 | 198 | 207 | 1.06 (0.84, 1.33) |
| > 5–25 | 149 | 154 | 1.15 (0.89, 1.48) |
| > 25–98 | 79 | 91 | 1.00 (0.72, 1.40) |
| > 98–254 | 32 | 38 | 1.23 (0.74, 2.03) |
| > 254–396 | 8 | 5 | 1.60 (0.50, 5.16) |
| > 396 | 13 | 9 | 1.66 (0.68, 4.05) |
| p-trend | 0.16 |
Exposure categories as unexposed, > 0–50th percentile, > 50–90th percentile, > 90–95th percentile, and > 95th percentile.
Adjusted for age, race, study, smoking status, and non-diesel exposed high-risk occupations.
After controlling for stage and grade using the two-stage regression model, we observed no heterogeneity in the relationship between diesel exhaust exposure and UBC when considering tumor subtypes characterized by expression or mutation of TP53 and FGFR3 (see Appendix A.2 for all TP53 and FGFR3 case-case parameters p > 0.05). When we account for heterogeneity in tumor subtypes as defined by stage and grade alone, we observed a significant association between diesel exhaust exposure and UBC (global test for association for diesel exhaust exposure and UBC in the presence of heterogeneity by stage and grade: p = 0.0019; global test for heterogeneity: p = 0.0196). When we explored the increased risk associated with cumulative REC by stage (Ta, T1, T2+) and grade (G1, G2, G3/G4), we observed a consistent association between cumulative REC across stage and grade categories (Fig. 1). The increased risk associated with cumulative REC by pathologic stage was stronger among those with muscle-invasive bladder cancer: (T2 + OR = 2.03 (95%CI, 1.11–3.74), p = trend = 0.014 as well as for those with low grade tumors (G1, OR = 2.08 (95%CI, 1.28, 3.38), p-trend = 0.002 (Appendix A.3 and Fig. 1).
Fig. 1.
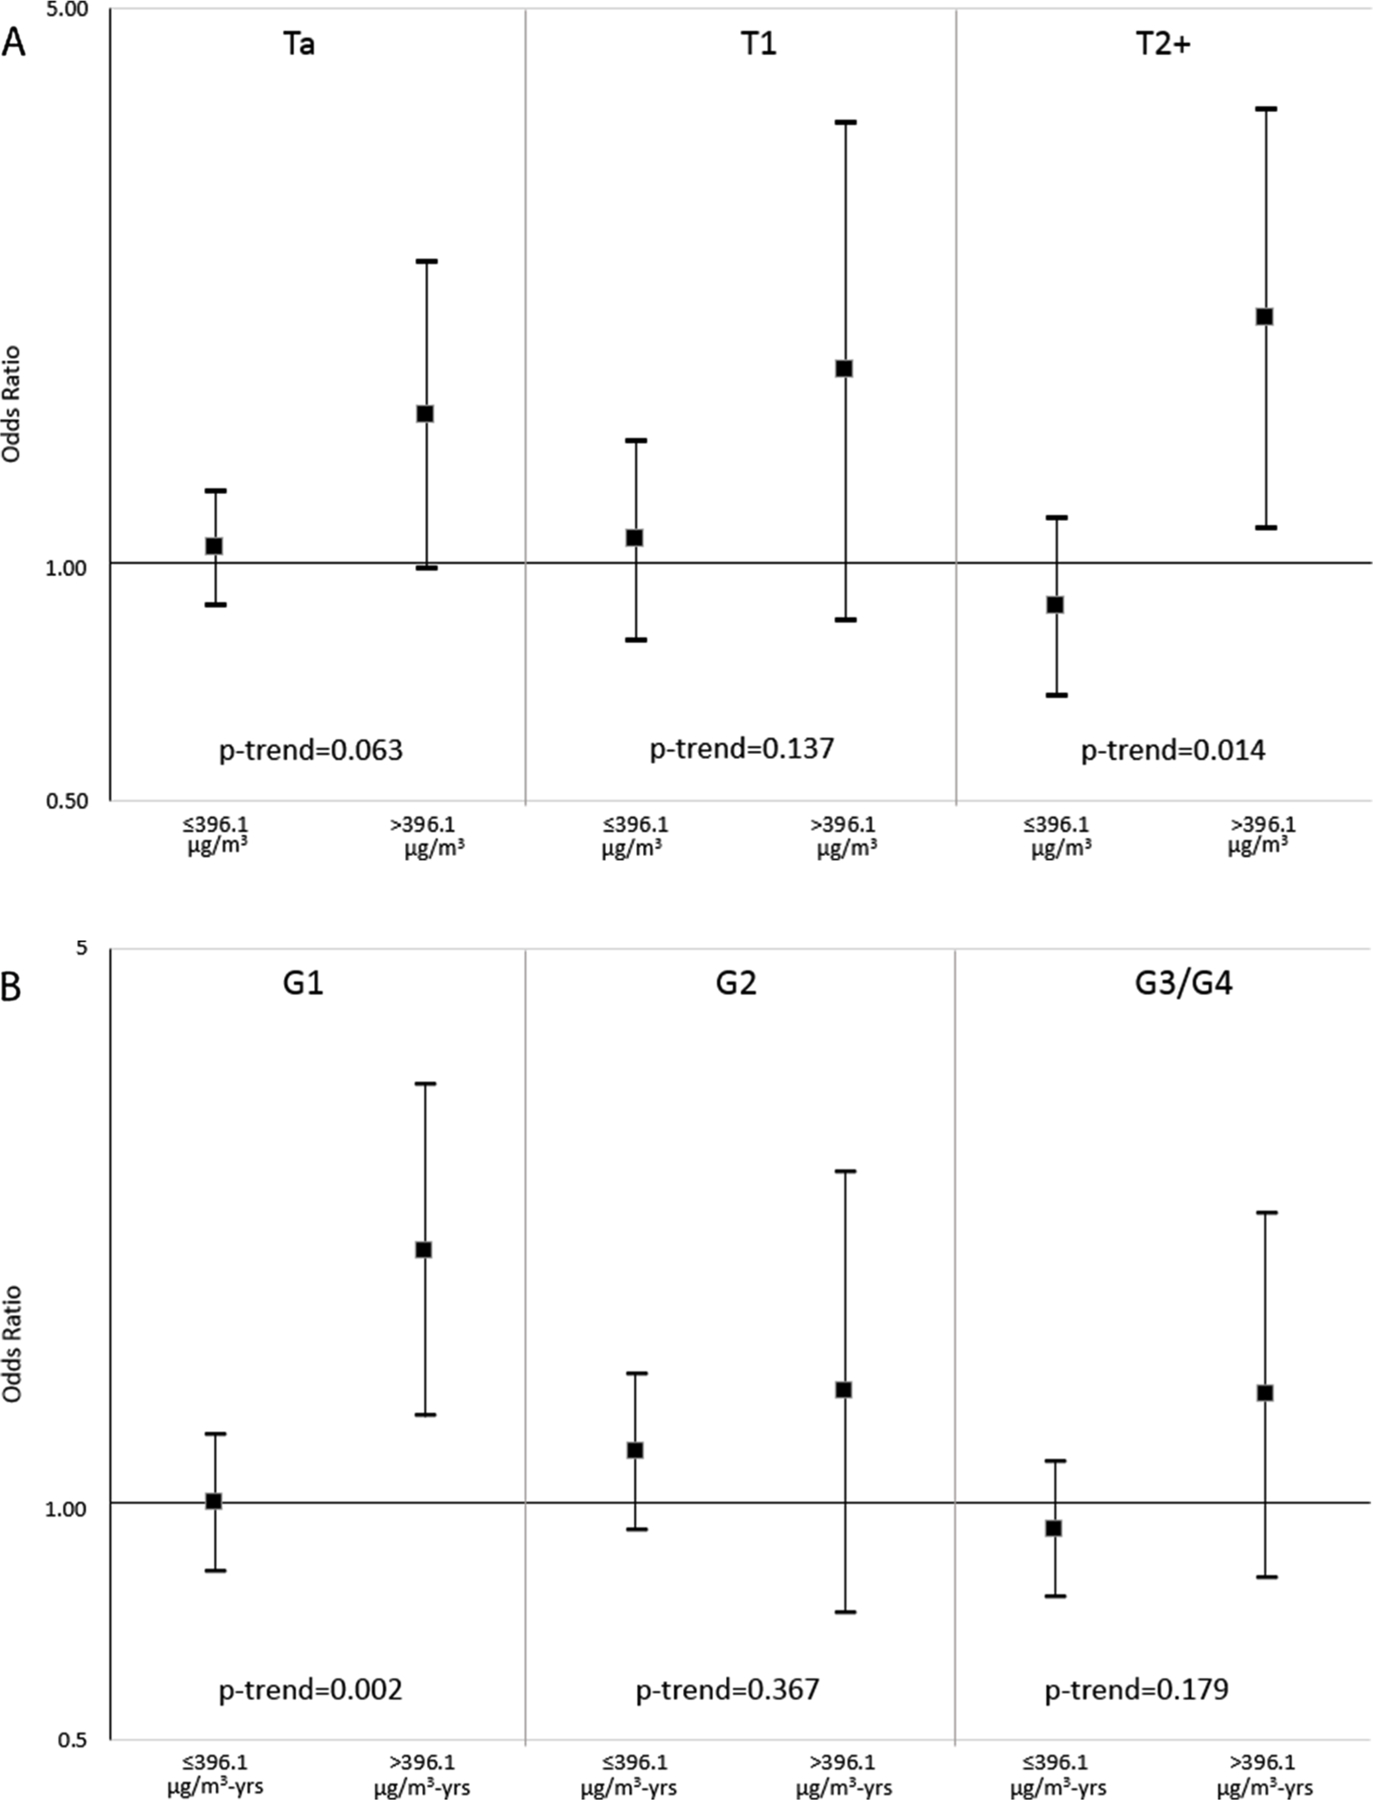
Odds ratios from polytomous logistic regression for categories of cumulative REC (μg/m3-years), ≤396 μg/m3-years and > 396 μg/m3-years compared to the unexposed, and risk of UBC by pathologic stage (Panel A) and grade (Panel B). Models are adjusted for age, race, study, smoking status, and non-diesel exposed high-risk occupations. See also Supplemental Table A.3 for point estimates.
4. Discussion
Findings from these two large, case-control studies show a significant positive association between heavy exposure to diesel exhaust and UBC risk, providing further evidence that diesel exhaust causes bladder cancer. These studies were designed, in part, to improve upon prior limitations in exposure assessment for diesel exhaust and fill in critical gaps in the literature linking this exposure to UBC by incorporating quantitative levels of REC based on expert assessment and lifetime occupational histories.
The link between diesel exhaust exposure and UBC risk was first suggested in diesel exhaust-exposed truck drivers in Detroit in 1983 (Silverman et al., 1983). Since then, several case-control studies reported increased risk associated with employment in diesel-exposed occupations such as truck drivers, bus drivers, railroad workers and mechanics (IARC, 2014; Silverman et al., 1986). More convincing evidence comes from studies that have estimated risk for workers with known exposure to diesel exhaust, rather than inferring subjects were exposed because they held possible diesel-exposed jobs. In these studies, exposure to diesel exhaust is consistently related to increased risk of UBC in the range of 1.2–1.7 (Latifovic et al., 2015; Pesch et al., 2000; Richardson et al., 2007; Risch et al., 1988; Siemiatycki et al., 1994). This finding is in line with our finding of a 61% increase in risk for UBC at the high end of exposure. Results were consistent in the two studies, with slightly higher cumulative REC observed in Spain compared to New England due to differences in reported work patterns (median reported work week in Spain was 48 hr/wk vs. 40 hr/wk in New England and longer duration worked in diesel-exposed jobs in Spain). Our data are consistent with a previous study in Montreal showing a similar prevalence of occupational diesel exposure in the general population as well as an increased risk for bladder cancer (Latifovic et al., 2015).
Analyses exploring the exposure-response relationship by lagging from 5 to 40 years showed a consistent increased risk at the top end of exposure, cumulative REC > 396.1 μg/m3-years, for all lag intervals. Our results also suggested a monotonic gradient in risk with cumulative REC lagged 40 years, but the numbers become limited, precluding us from drawing any firm conclusion regarding the shape of the exposure-response curve. A long latent period (up to 50 years) for bladder cancer has been previously observed in truck drivers (a major diesel-exposed occupation) in the National Bladder Cancer Study (Silverman et al., 1986). More studies are needed to better estimate the exposure-response relationship and the latent period for diesel-induced bladder cancer.
Our findings suggest that diesel is consistently associated with both low-grade tumors and in the development of muscle-invasive bladder cancer. Unfortunately, we do not have follow-up data to evaluate whether the group of low-grade tumors would have progressed to tumors with a worse prognosis. Similarly, we also do not have information on time to death among those initially diagnosed with muscle-invasive bladder cancer among patients with higher cumulative REC. Recently, we reported that a history of occupational diesel exhaust exposure was also associated with shorter time to recurrence among patients with muscle-invasive bladder cancer (Wilcox et al., 2016). Population-based estimates of incident bladder cancer indicate that 20–30% of bladder cancer is muscle-invasive and about 70–80% is non-muscle invasive. Further characterization of the tumors in these two case-control studies is underway to evaluate if diesel exhaust exposure is related to specific molecular subtypes or other tumor features (Choi et al., 2017).
Mechanistic evidence suggests that diesel exhaust may induce cancer in humans (IARC, 2014). Chromosomal damage, altered gene expression patterns, and inflammation have been found among people exposed to diesel exhaust (IARC, 2014). Urinary biomonitoring studies have demonstrated the presence of excreted polycyclic aromatic hydrocarbons and nitroarene metabolites, many of which are known to be genotoxic, after exposure to diesel exhaust (IARC, 2014; Seidel et al., 2002). Thus, direct contact with the bladder urothelium may be one pathway by which diesel exhaust initiates bladder carcinogenesis. Evidence from experimental studies also suggests that some components of diesel exhaust influence expression of genes related to critical cancer signaling pathways (IARC, 2014; Landvik et al., 2007; Yun et al., 2009).
Our study is one of the first to estimate UBC risk by quantitative estimates of lifetime occupational diesel exposure. The assessment of exposure was based on detailed subject-reported information on diesel-related work activities and intensity estimates derived from the published literature, reflecting an important advance in the characterization of diesel exhaust exposure compared with most previous case-control studies of UBC. This approach was also used in a study of occupational exposure to metalworking fluids in the NEBCS, revealing increased cancer risks similar to those observed in cohort studies (Silverman et al., 2018). Other strengths of our study include its large size (and consistency of observed associations in studies conducted in two different populations in different countries), as well as the ability to control for confounding from smoking and employment in other high-risk occupations. Further, the incorporation of pathology data provided the insight that the diesel exhaust-UBC relationship may be more pronounced in patients with later-stage tumors. This observation will help guide future mechanistic work to better understand diesel-induced bladder carcinogenesis.
Some limitations, however, must be noted. Non-differential exposure misclassification likely occurred, probably leading to an attenuation of the observed associations and may have obscured effect at low levels of diesel-exposure (i.e., REC < 396 μg/m3). In addition, the published literature was insufficient to extract time trends in exposure intensity. Time trends in the probability of exposure were, however, incorporated to take into account slight differences by country and regulations/technology that impacted the prevalence of diesel exposure. Interestingly, analyses by decade of first diesel-exposed job showed a statistically significant increased risk a mongmen first exposed in the 1950s, when diesel equipment started becoming wide-spread. The observed greater risk for those first exposed in the 1950s may reflect secular differences in exposure by type or age of diesel engine, or alternatively, a long latent period for UBC. Despite the large size of these two case-control studies, the analysis was underpowered to detect a significant exposure-response; further exploration in other studies is warranted.
5. Conclusion
Our results provide further evidence that diesel exhaust exposure increases the risk of UBC in humans. The incorporation of quantitative historical information combined with pathologic characteristics of tumors and molecular epidemiology studies of exposed workers may provide evidence of biologic plausibility that this association is causal.
Supplementary Material
Acknowledgements
The authors thank Dr. Francisco X. Real for his contribution to the Spanish Bladder Cancer Study and molecular characterization of tumors.
Funding
This work was supported by the Intramural Research Program of the National Institutes of Health, National Cancer Institute, Division of Cancer Epidemiology and Genetics (Z01 CP010121-23 and Z01 CP010125-23).
Abbreviations:
- CI
confidence intervals
- IHC
immunohistochemical
- IARC
International Agency for Research on Cancer
- NEBCS
New England Bladder Cancer Study
- ORs
odds ratios
- REC
respirable elemental carbon
- SBCS
Spanish Bladder Cancer Study
- UBC
urothelial cell carcinoma
Appendix
Table A1.
Job titles (in rank order) for most frequently reported occupations with diesel exhaust exposure.
| Job titles |
|---|
| Truck drivers, tractor-trailer |
| Truck drivers, heavy |
| Grader, dozer, and scraper operators |
| Motor vehicle operators |
| Military occupations |
| Bus and truck engine, and diesel engine mechanics |
| Automobile mechanics |
| Timber cutting and related occupations |
| Garage and service station related occupations |
| Industrial truck and tractor equipment operators |
| Truck drivers, light |
Table A2.
Specific UBC tumor marker test for heterogeneity in cumulative REC exposure (linear trend) using a two-stage model.
| Tumor Characteristic | Cumulative REC (μg/m3-years) |
|
|---|---|---|
| Case-case OR* (95% CI) | p-value | |
| P53 expression ± (+/–) | 1.07 (0.97, 1.19) | 0.15 |
| P53 Histoscore ± (+/–) | 1.04 (0.94, 1.15) | 0.42 |
| TP53 Mutation ± (+/–) | 0.96 (0.82, 1.13) | 0.62 |
| FGFR3 expression ± (+/–) | 1.00 (0.90, 1.12) | 0.94 |
| FGFR3 Mutation ± (+/–) | 1.08 (0.95, 1.23) | 0.22 |
Adjusted for age, race, study, smoking status, and non-diesel exposed high-risk occupations.
Model includes noted tumor marker as well as stage and grade.
Table A3.
Odds ratios for cumulative REC by tumor subtype from polytomous logistic regression presented in Fig. 1.
| Stage | N Cases | N Controls | OR* (95% CI) |
|---|---|---|---|
| Ta | |||
| Unexposed | 464 | 857 | 1.0 |
| ≤396 μg/m3-years | 543 | 981 | 1.04 (0.89, 1.23) |
| > 396 μg/m3-years | 39 | 52 | 1.54 (0.98, 2.40) |
| p-trend | 0.063 | ||
| T1 | |||
| Unexposed | 100 | 857 | 1.0 |
| ≤ 396 μg/m3-years | 132 | 981 | 1.07 (0.80, 1.43) |
| > 396 μg/m3-years | 10 | 52 | 1.75 (0.85, 3.61) |
| p-trend | 0.137 | ||
| (T2 + ) Muscle-invasive bladder cancer | |||
| Unexposed | 161 | 857 | 1.0 |
| ≤ 396 μg/m3-years | 143 | 981 | 0.88 (0.68, 1.14) |
| > 396 μg/m3-years | 16 | 52 | 2.03 (1.11, 3.74) |
| p-trend | 0.014 | ||
| Grade | |||
| G1 | |||
| Unexposed | 253 | 857 | 1.0 |
| ≤396 μg/m3-yrs | 316 | 981 | 1.00 (0.81, 1.22) |
| > 396 μg/m3-yrs | 31 | 52 | 2.08 (1.28, 3.38) |
| p-trend | 0.002 | ||
| G2 | |||
| Unexposed | 186 | 857 | 1.0 |
| ≤396 μg/m3-years | 218 | 981 | 1.16 (0.92, 1.46) |
| > 396 μg/m3-years | 13 | 52 | 1.37 (0.72, 2.62) |
| p-trend | 0.367 | ||
| G3/G4 | |||
| Unexposed | 283 | 857 | 1.0 |
| ≤ 396 μg/m3-years | 281 | 981 | 0.93 (0.76, 1.13) |
| > 396 μg/m3-years | 21 | 52 | 1.37 (0.80, 2.33) |
| p-trend | 0.179 |
ORtrend for CIS = 0.97 (0.71, 1.34).
Adjusted for age, race, study, smoking status, and non-diesel exposed high-risk occupations.
Footnotes
Declaration of Competing Interest
The authors declare no competing financial interests.
Appendix A. Supplementary material
Supplementary data to this article can be found online at https://doi.org/10.1016/j.envint.2019.105346.
References
- Amaral AF, Mendez-Pertuz M, Munoz A, Silverman DT, Allory Y, Kogevinas M, Lloreta J, Rothman N, Carrato A, Rivas del Fresno M, Real FX, Malats N, et al. , 2012. Plasma 25-hydroxyvitamin D(3) and bladder cancer risk according to tumor stage and FGFR3 status: a mechanism-based epidemiological study. J. Natl. Cancer Inst 104, 1897–1904. [DOI] [PMC free article] [PubMed] [Google Scholar]
- Balbas-Martinez C, Rodriguez-Pinilla M, Casanova A, Dominguez O, Pisano DG, Gomez G, Lloreta J, Lorente JA, Malats N, Real FX, 2013. ARID1A alterations are associated with FGFR3-wild type, poor-prognosis, urothelial bladder tumors. PLoS One 8, e62483. [DOI] [PMC free article] [PubMed] [Google Scholar]
- Benbrahim-Tallaa L, Baan RA, Grosse Y, Lauby-Secretan B, El Ghissassi F, Bouvard V, Guha N, Loomis D, Straif K, 2012. International Agency for Research on Cancer Monograph Working G. Carcinogenicity of diesel-engine and gasoline-engine exhausts and some nitroarenes. Lancet Oncol. 13, 663–664. [DOI] [PubMed] [Google Scholar]
- Birch ME, Cary RA, 1996. Elemental carbon-based method for occupational monitoring of particulate diesel exhaust: methodology and exposure issues. Analyst 121, 1183–1190. [DOI] [PubMed] [Google Scholar]
- Boffetta P, Silverman DT, 2001. A meta-analysis of bladder cancer and diesel exhaust exposure. Epidemiology 12, 125–130. [DOI] [PubMed] [Google Scholar]
- Chatterjee N, 2004. A two-stage regression model for epidemiological studies with multivariate disease classification data. J. Am. Stat. Assoc 99, 127–138. [Google Scholar]
- Choi W, Ochoa A, McConkey DJ, Aine M, Hoglund M, Kim WY, Real FX, Kiltie AE, Milsom I, Dyrskjot L, Lerner SP, 2017. Genetic alterations in the molecular subtypes of bladder cancer: illustration in the Cancer Genome Atlas dataset. Eur. Urol 72, 354–365. [DOI] [PMC free article] [PubMed] [Google Scholar]
- Colt JS, Karagas MR, Schwenn M, Baris D, Johnson A, Stewart P, Verrill C, Moore LE, Lubin J, Ward MH, Samanic C, Rothman N, et al. , 2011. Occupation and bladder cancer in a population-based case-control study in Northern New England. Occup. Environ. Med 68, 239–249. [DOI] [PMC free article] [PubMed] [Google Scholar]
- Eble JL, Sauter G, Epstein JI, Sesterhenn IA, 2004. World Health Organization Classification of Tumours, Pathology and Genetics of Tumours of the Urinary System and Male Genital Organs, in: (IARC) International Agency for Research on Cancer, ed. IARC Press, Lyon. [Google Scholar]
- Figueroa JD, Koutros S, Colt JS, Kogevinas M, Garcia-Closas M, Real FX, Friesen MC, Baris D, Stewart P, Schwenn M, Johnson A, Karagas MR, et al. , 2015. Modification of occupational exposures on bladder cancer risk by common genetic polymorphisms. J. Natl. Cancer Inst 107 (11). 10.1093/jnci/djv223. pii: djv223. [DOI] [PMC free article] [PubMed] [Google Scholar]
- Friesen MC, Wheeler DC, Vermeulen R, Locke SJ, Zaebst DD, Koutros S, Pronk A, Colt JS, Baris D, Karagas MR, Malats N, Schwenn M, et al. , 2016. Combining decision rules from classification tree models and expert assessment to estimate occupational exposure to diesel exhaust for a case-control study. Ann. Occup. Hyg 60, 467–478. [DOI] [PMC free article] [PubMed] [Google Scholar]
- Hafner C, van Oers JM, Vogt T, Landthaler M, Stoehr R, Blaszyk H, Hofstaedter F, Zwarthoff EC, Hartmann A, 2006. Mosaicism of activating FGFR3 mutations in human skin causes epidermal nevi. J. Clin. Invest 116, 2201–2207. [DOI] [PMC free article] [PubMed] [Google Scholar]
- Hernandez S, Lopez-Knowles E, Lloreta J, Kogevinas M, Jaramillo R, Amoros A, Tardon A, Garcia-Closas R, Serra C, Carrato A, Malats N, Real FX, 2005. FGFR3 and Tp53 mutations in T1G3 transitional bladder carcinomas: independent distribution and lack of association with prognosis. Clin. Cancer Res 11, 5444–5450. [DOI] [PubMed] [Google Scholar]
- IARC, 2014. Diesel and gasoline engine exhausts and some nitroarenes. IARC Monogr. Eval. Carcinog. Risks Hum 105, 9–699. [PMC free article] [PubMed] [Google Scholar]
- Knowles MA, Hurst CD, 2015. Molecular biology of bladder cancer: new insights into pathogenesis and clinical diversity. Nat. Rev. Cancer 15, 25–41. [DOI] [PubMed] [Google Scholar]
- Lenz P, Pfeiffer R, Baris D, Schned AR, Takikita M, Poscablo MC, Schwenn M, Johnson A, Jones M, Kida M, Cantor KP, Rothman N, et al. , 2012. Cell-cycle control in urothelial carcinoma: large-scale tissue array analysis of tumor tissue from Maine and Vermont. Cancer Epidemiol. Biomarkers Prev 21, 1555–1564. [DOI] [PMC free article] [PubMed] [Google Scholar]
- Landvik NE, Gorria M, Arlt VM, Asare N, Solhaug A, Lagadic-Gossmann D, Holme JA, 2007. Effects of nitrated-polycyclic aromatic hydrocarbons and diesel exhaust particle extracts on cell signalling related to apoptosis: possible implications for their mutagenic and carcinogenic effects. Toxicology 231, 159–174. [DOI] [PubMed] [Google Scholar]
- Latifovic L, Villeneuve PJ, Parent ME, Johnson KC, Kachuri L, Canadian Cancer Registries Epidemiology G, Harris SA, 2015. Bladder cancer and occupational exposure to diesel and gasoline engine emissions among Canadian men. Cancer Med 4, 1948–1962. [DOI] [PMC free article] [PubMed] [Google Scholar]
- Mostfi FK, Sobin LH, Torloni H, 1973. Histological Typing of Urinary Bladder Tumours, in: Organization WH, ed. Geneva. [Google Scholar]
- Pesch B, Haerting J, Ranft U, Klimpel A, Oelschlagel B, Schill W, 2000. Occupational risk factors for urothelial carcinoma: agent-specific results from a case-control study in Germany. MURC Study Group. Multicenter Urothelial and Renal Cancer. Int. J. Epidemiol 29, 238–247. [DOI] [PubMed] [Google Scholar]
- Pronk A, Coble J, Stewart PA, 2009. Occupational exposure to diesel engine exhaust: a literature review. J. Expo. Sci. Environ. Epidemiol 19, 443–457. [DOI] [PMC free article] [PubMed] [Google Scholar]
- Richardson K, Band PR, Astrakianakis G, Le ND, 2007. Male bladder cancer risk and occupational exposure according to a job-exposure matrix-a case-control study in British Columbia, Canada. Scand J. Work Environ. Health 33, 454–464. [DOI] [PubMed] [Google Scholar]
- Risch HA, Burch JD, Miller AB, Hill GB, Steele R, Howe GR, 1988. Occupational factors and the incidence of cancer of the bladder in Canada. Br. J. Ind. Med 45, 361–367. [DOI] [PMC free article] [PubMed] [Google Scholar]
- Samanic CM, Kogevinas M, Silverman DT, Tardon A, Serra C, Malats N, Real FX, Carrato A, Garcia-Closas R, Sala M, Lloreta J, Rothman N, et al. , 2008. Occupation and bladder cancer in a hospital-based case-control study in Spain. Occup. Environ. Med 65, 347–353. [DOI] [PubMed] [Google Scholar]
- Sobin LH, Gospodarowicz LH, Wittekind C, 2009. UICC TNM Classification of Malignant Tumours, Seventh ed. New York. [Google Scholar]
- Sobin LHW, Ch., 2002. UICC TNM Classification of Malignant Tumours, Sixth ed. New York. [Google Scholar]
- Silverman DT, Koutros S, Figueroa JD, Prokunina-Olsson L, Rothman N, 2018. Bladder cancer. In: Thun MJ, Linet MS, Cerhan C, Haiman C, Schottenfeld D (Eds.), Schottenfeld and Fraumeni Cancer Epidemiology and Prevention, 4th ed. Oxford University Press, New York, pp. 977–996. [Google Scholar]
- Silverman DT, Hoover RN, Albert S, Graff KM, 1983. Occupation and cancer of the lower urinary tract in Detroit. J. Natl. Cancer Inst 70, 237–245. [PubMed] [Google Scholar]
- Silverman DT, Hoover RN, Mason TJ, Swanson GM, 1986. Motor exhaust-related occupations and bladder cancer. Cancer Res 46, 2113–2116. [PubMed] [Google Scholar]
- Siemiatycki J, Dewar R, Nadon L, Gerin M, 1994. Occupational risk factors for bladder cancer: results from a case-control study in Montreal, Quebec, Canada. Am. J. Epidemiol 140, 1061–1080. [DOI] [PubMed] [Google Scholar]
- Seidel A, Dahmann D, Krekeler H, Jacob J, 2002. Biomonitoring of polycyclic aromatic compounds in the urine of mining workers occupationally exposed to diesel exhaust. Int. J. Hyg. Environ. Health 204, 333–338. [DOI] [PubMed] [Google Scholar]
- Wilcox AN, Silverman DT, Friesen MC, Locke SJ, Russ DE, Hyun N, Colt JS, Figueroa JD, Rothman N, Moore LE, Koutros S, 2016. Smoking status, usual adult occupation, and risk of recurrent urothelial bladder carcinoma: data from The Cancer Genome Atlas (TCGA) Project. Cancer Causes Control 27, 1429–1435. [DOI] [PMC free article] [PubMed] [Google Scholar]
- Yun YP, Lee JY, Ahn EK, Lee KH, Yoon HK, Lim Y, 2009. Diesel exhaust particles induce apoptosis via p53 and Mdm2 in J774A.1 macrophage cell line. Toxicol. In Vitro 23, 21–28. [DOI] [PubMed] [Google Scholar]
- Zhang Hz N., Ahearn TU, William W, Garcia-Closas M, Chatterjee N, 2018. A mixed-model approach for powerful testing of genetic associations with cancer risk incorporating tumor characteristics. BioRxiv [DOI] [PMC free article] [PubMed]
Associated Data
This section collects any data citations, data availability statements, or supplementary materials included in this article.