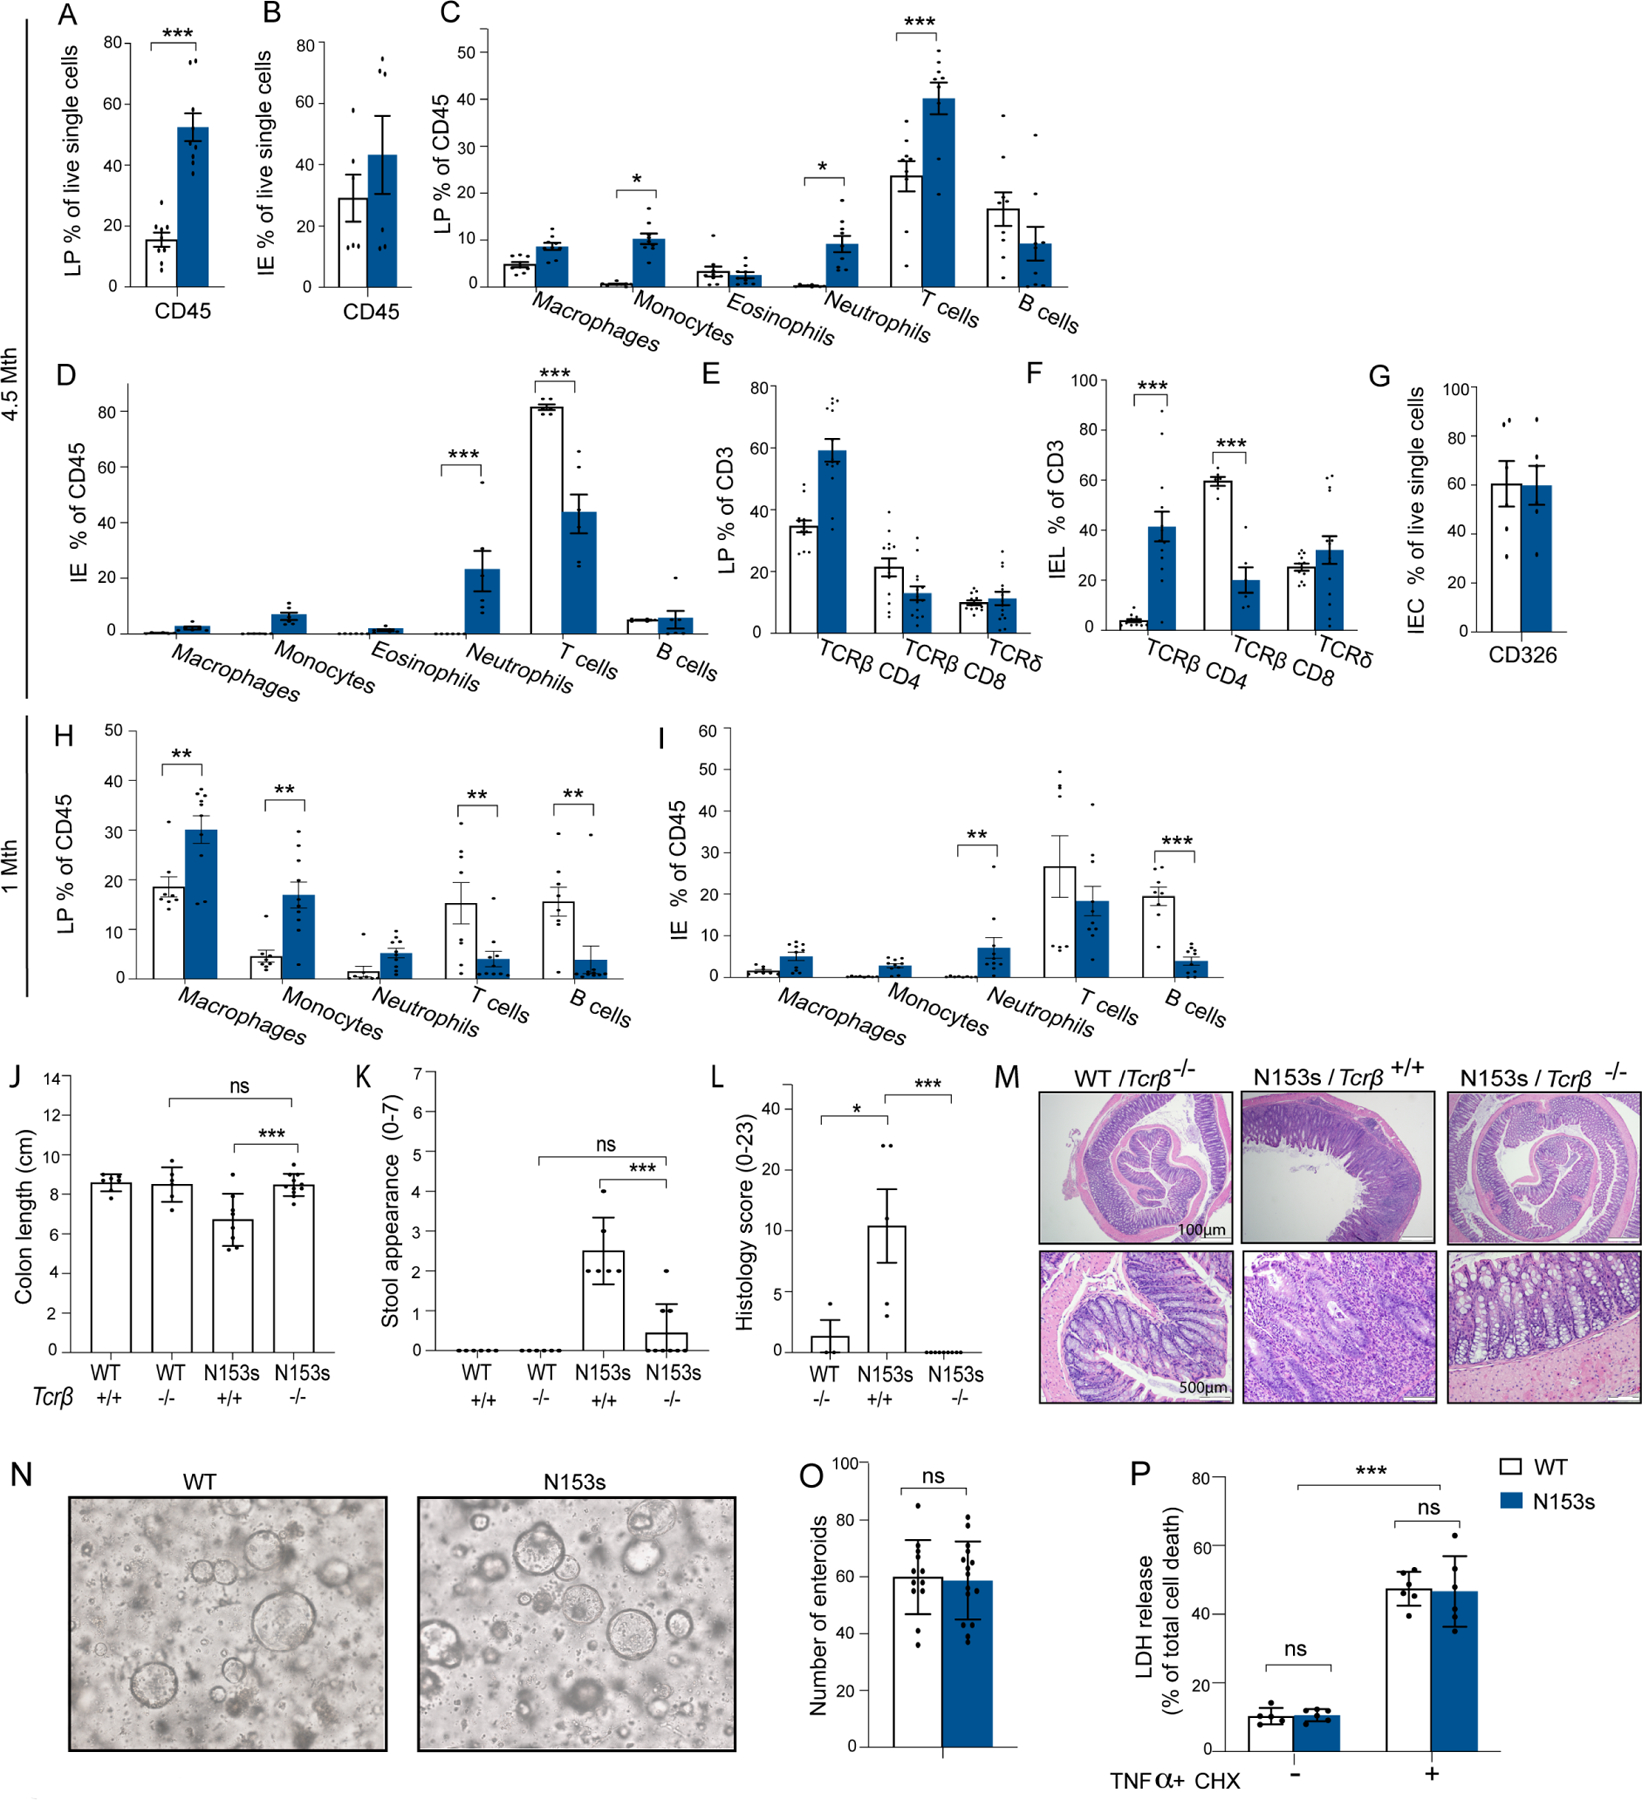
Figure 2. N153s mice exhibit immune cell alterations in the colon.

Graphical summary of flow cytometry analysis of colonic LP (A) and IE (B) of N153s and WT mice at the age of 4.5-month-old mice. CD45+ cells presented as % out of live single cells. Graphical summary of LP (C) and IE (D) immune cell populations from 4.5-month-old N153s and WT littermate control mice presented as % out of CD45+ cells. Graphical summary of LP (E) and IE (F) TCRβ CD4, TCRβ CD8 and TCRδ T cells presented as % out of CD3+ cells. (G) CD326 positive IE cells presented as % out of live single cells. (Data are represented as mean ±SEM, for J-K n=3 from 3 independent experiments, for M-N, P n=3 from 2 independent experiments, for L, O n=1–4 from 5 independent experiments). LP (H) and IE (I) immune cell populations presented as % out of CD45+ cells from 1-month-old N153s and WT mice. (*P<0.05, **P<0.01, ***P<0.001. Data are represented as mean ±SEM of n=2–3 from 5 independent experiments). Intestinal inflammation in N153s mice is dependent on TCRβ T-cells not on intestinal epithelial cells. (J) colon length colitis score, (K) stool appearance, (L) pathology score and (M) representative H&E images of colon sections of the indicated mice at 2.5 to 4.5-months of age. (*P<0.05, ***P<0.001. Data are represented as mean ±SEM of n=2–6 from 5 independent experiments). (N) Representative images of mature enteroids and (O) enteroid numbers cultured from N153s and WT intestinal epithelial stem cells for 5 days (Data are represented as mean ±SEM of n=5–6 from 2 independent experiments). (P) Percentage LDH release of single layer intestinal epithelial cells (5×10^4) treated with or without TNFα (50ng/ml) and CHX (10μg/ml) for 24 hours (***P<0.001. Data are represented as mean ±SEM of n=3 of 2 independent experiments).
