

SUMMARY
Emerging evidence suggests a key contribution to non-alcoholic fatty liver disease (NAFLD) pathogenesis by Th17 cells. The pathogenic characteristics and mechanisms of hepatic Th17 cells, however remain unknown. Here, we uncover and characterize a distinct population of inflammatory hepatic CXCR3+Th17 cells (ihTh17) sufficient to exacerbate NAFLD pathogenesis. Hepatic ihTh17 cell accrual was dependent on the liver microenvironment and CXCR3 axis activation. Mechanistically, the pathogenic potential of ihTh17 cells correlated with increased chromatin accessibility, glycolytic output and concomitant production of IFNγ and TNFα Modulation of glycolysis using 2-DG or cell-specific PKM2 deletion was sufficient to reverse ihTh17-centric inflammatory vigor and NAFLD severity. Importantly, ihTh17 cell characteristics, CXCR3 axis activation and hepatic expression of glycolytic genes were conserved in human NAFLD. Together, our data show that the steatotic liver microenvironment regulates Th17 cell accrual, metabolism and competence towards an ihTh17 fate. Modulation of these pathways holds potential for development of novel therapeutic strategies for NAFLD.
Keywords: obesity, Th17, CXCR3, TNF, IFNγ, cellular metabolism, PKM, liver
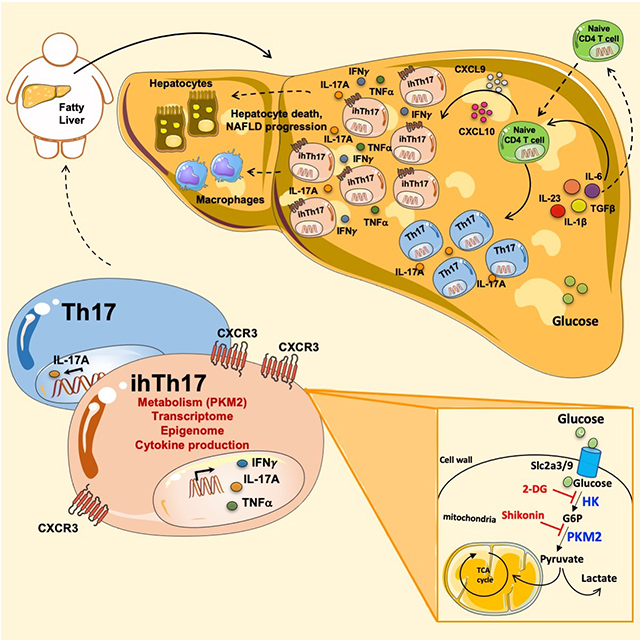
Graphical Abstract
eTOC
Nonalcoholic fatty liver disease (NAFLD) is associated with increased inflammation. Maria E. Moreno-Fernandez and colleagues now show that the steatotic liver microenvironment gives rise to a distinct inflammatory hepatic Th17 (ihTh17) cell subset, which preferentially utilizes the glycolytic pathway to fuel tissue inflammation and promote NAFLD progression.
INTRODUCTION
Obesity, a public health problem of the first order, is a major risk factor for the development of chronic comorbidities, including non-alcoholic fatty liver disease (NAFLD) (Finucane et al., 2011; Weiskirchen and Tacke, 2014). NAFLD, the world’s most common chronic liver disorder, represents a spectrum of diseases ranging from benign hepatic lipid accumulation (non-alcoholic steatosis; NAFL) to inflammation and fibrosis (non-alcoholic steatohepatitis; NASH) and can progress to cirrhosis, as well as hepatocellular carcinoma (HCC) (Schenk et al., 2008; Tiniakos et al., 2010). However, despite its clinical and public health significance, the mechanisms underlying the etiopathogenesis of NAFLD remain ill-defined.
The immune system provides a key pathogenic link between obesity and NAFLD progression (de Heredia et al., 2012; Weisberg et al., 2003). For example, T cells contribute to the pathogenesis of obesity-associated diseases, as mice lacking T cells are susceptible to diet- induced weight gain but are protected from glucose dysmetabolism and steatohepatitis (Bhattacharjee et al., 2014; Liu et al., 2015). In addition, obesity promotes peripheral Th17 cell expansion (Harley et al., 2014; Sumarac-Dumanovic et al., 2009; Winer et al., 2009) and is associated with Th17 cell infiltration into the adipose tissue and liver (Bertola et al., 2012; Giles et al., 2017; Pandolfi et al., 2016). Congruently, activation of the IL-17A/IL-17 receptor A (IL- 17RA) signaling axis in the context of obesity amplifies NAFLD progression in multiple experimental models (Gomes et al., 2016; Harley et al., 2014; Tang et al., 2011; Zuniga et al., 2010), including a novel, more human-like experimental model of NAFLD (Giles et al., 2017). In addition, single nucleotide polymorphisms associated with genes linked to the IL-17 axis (e.g., STAT4, RORA (Chambers et al., 2011) and IL17RA (Bahram Namjou, 2019)) have been associated with human hepatobiliary disease and NAFLD respectively.
Th17 cells are a primary culprit in the pathogenesis of multiple inflammatory disease, including Crohn’s disease (Ramesh et al., 2014), experimental encephalomyelitis (Yang et al., 2009) and cardiovascular disease (Wang et al., 2011). Th17 cell plasticity strongly contributes to their heterogeneous phenotype and variable effector function (Gaublomme et al., 2015; Karmaus et al., 2019; Lee et al., 2012; Ramesh et al., 2014; Yang et al., 2009). Specifically, a unique transcriptional and metabolic signature accompanied by expression of proinflammatory markers (e.g., CXCR3, IL-17A, IFNγ, CCL5) (Ramesh et al., 2014) and reduced IL-10 expression differentiates pathogenic Th17 from conventional Th17 cells (Hu et al., 2017), in the aforementioned disease states. The alteration of cell-intrinsic metabolic pathways, as shown by us and others, play a vital role in regulating Th17 cell inflammatory potential and IL-17 responses in NAFLD pathogenesis (Moreno-Fernandez et al., 2018; Nguyen et al., 2016; Shi et al., 2011).
In the current study, we demonstrate that the steatotic liver microenvironment favors accrual of a distinct population of inflammatory hepatic CXCR3+Th17 (ihTh17) cells that correlate with disease pathogenesis in both humans and multiple mouse experimental models of NAFLD. Diet-driven modification of the liver microenvironment was essential for hepatic induction of CXCR3 activating ligands and for hepatic ihTh17 cell accrual. Notably, adoptive transfer of ihTh17 cells, but not conventional hepatic CXCR3−Th17 (chTh17) cells, was sufficient to accelerate and exacerbate NAFLD pathogenesis. Mechanistically, ihTh17 cells, compared to chTh17 cells, exhibited augmented expression of inflammatory and metabolic genes and increased glycolytic capacity, which correlated with open chromatin in proximal genomic enhancer regions of metabolic and inflammatory genes. Modulation of the CXCR3-CXCL9/10 axis and the ihTh17 glycolytic pathway via 2-Deoxy-D-Glucose (2-DG) and/or cell-specific deletion of the gene encoding pyruvate kinase M2 (PKM2) were sufficient to reverse ihTh17 accrual and inflammatory vigor, respectively, and restrict NAFLD severity. Thus, our data demonstrate that ihTh17 cells represent a novel hepatic Th17 cell subset, distinct from other pathogenic Th17 cells, and that they are important in driving NAFLD pathogenesis.
RESULTS
The hepatic microenvironment promotes accrual of an inflammatory CD4+IL-17- expressing cell subset
To define whether obesity facilitated an environment for hepatic accrual of Th17 cells, we used a well-established mouse model of diet-induced obesity (DIO) that is accompanied with the development of glucose dysregulation and an increase in liver weight and triglyceride accumulation (Figures S1A–E). Congruently, histological and flow cytometric analysis revealed hepatic immune cell infiltration in this model (Figures S1F–G). DIO also augmented systemic IL- 17A levels (Figure S1H), hepatic and adipose expression of well-established Th17 cell polarizing cytokines (Figure S1I) (Gaublomme et al., 2015; Lee et al., 2012; Ramesh et al., 2014) and hepatic and adipose accumulation of IL-17A expressing immune cells (Figure S1J). Antibody-mediated blockade of IL-17A, in the context of established obesity, was sufficient to decrease hepatocellular damage, as evidenced by reduced systemic alanine transaminase (ALT) levels (Figure S1K). Notably, the liver and adipose tissue greatly differed in the composition of key IL-17A producing cells. Specifically, while the primary hepatic IL-17A producers were CD4+ T cells, the γδT cells were the dominant IL-17A source in adipose tissue (Figure S1L). Hence, the divergent cellular expression of IL-17A in liver and adipose tissue prompted an in-depth cellular and molecular characterization of IL-17A producing cells in the liver.
Cellular plasticity and subset heterogeneity are considered to be primary culprits of Th17 cell-mediated pathogenesis in inflammatory diseases (Gaublomme et al., 2015; Karmaus et al., 2019; Lee et al., 2012; Ramesh et al., 2014; Yang et al., 2009). To define the impact of DIO on total hepatic Th17 (TCRβ+CD4+IL-17A+) cell composition, cell characteristics and gene signatures, a single-cell RNA-sequencing (scRNA-seq) approach was employed. Analysis of in vivo isolated hepatic Th17 cells (Figure 1A) with unsupervised population discovery using ICGS software revealed the presence of two major hepatic Th17 cell clusters, termed here as Th17 A and Th17 B (Figure 1B). The presence and gene expression profiles of these distinct hepatic Th17 cell clusters were also conserved in female mice (to ensure robust obesity female mice were fed a high-fat diet (HFD) and housed at thermoneutrality (Giles et al., 2017); Figures S1M–N and data not shown). Initial characterization of hepatic Th17 A and Th17 B cluster gene signatures uncovered a significant divergence in the expression of genes associated with inflammation (e.g., Rora, Ifng, and Stat1), surface markers (Cxcr3, Cd2 and Cd6) and cellular metabolism (e.g., Pkm, Gapdh and Eno). Notably, such genes were more robustly expressed by the hepatic Th17 A cell cluster (Figure 1C).
Figure 1. Obesity promotes accumulation of distinct hepatic Th17 cell subsets.
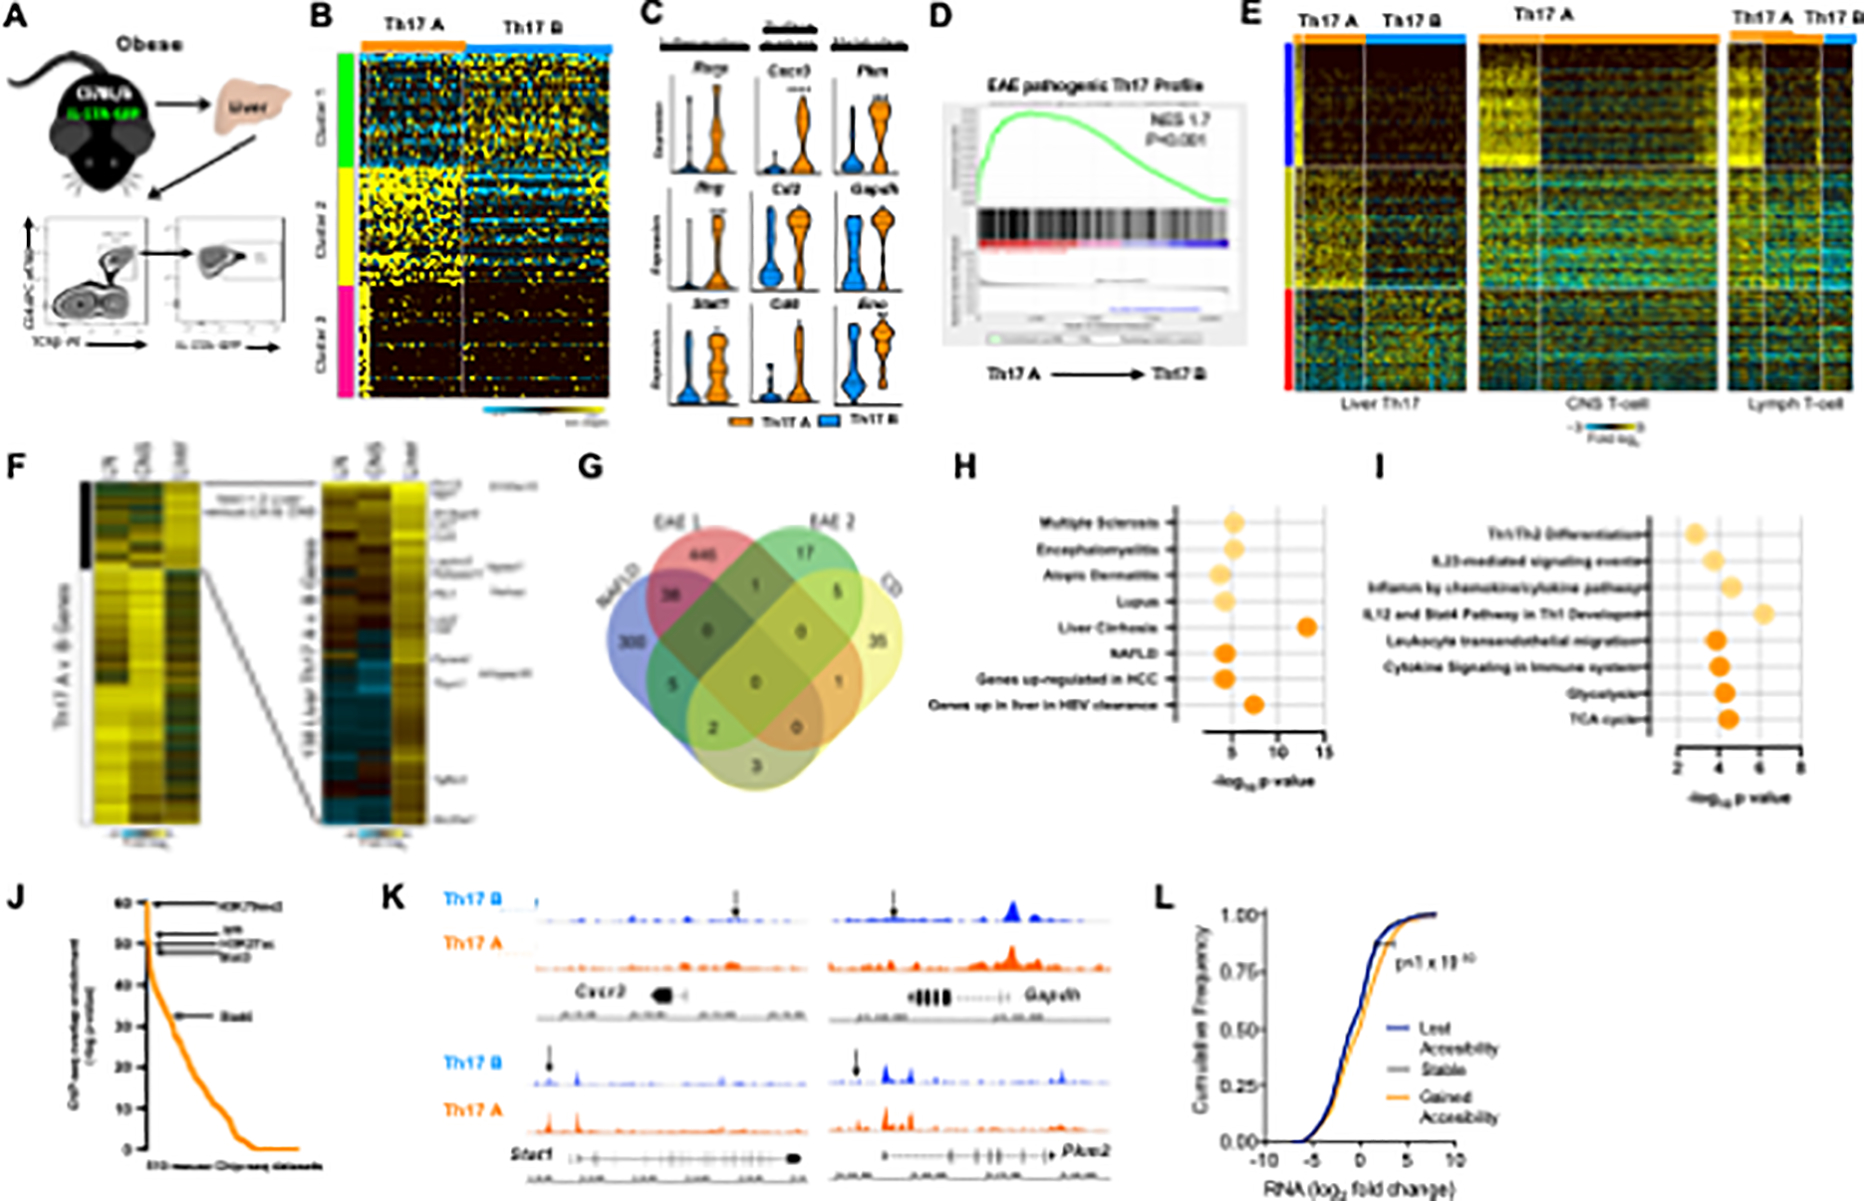
(A-L) A schematic diagram illustrating that 8-week-old male II-17A-GFP C57BL/6-mice (n = 3) were fed a HFD diet up to 20 weeks before liver Th17 cells isolation, along with a schematic representation of FACS isolation of liver TCRp+CD4+IL-17A-GFP+ cells.
(B) Heatmap of unsupervised scRNA-seq clusters of in vivo-isolated hepatic Th17 (TCRβ+CD4+IL-17A-GFP+) cells performed in Alt Analyze with the ICGS algorithm.
(C) Violin plots of selected differential gene expression between Th17 A (orange) and Th17 B (blue) subsets. 3 functional groups: inflammation-related, metabolism-related, and surface markers.
(D) GSEA analysis of Th17 A cells and pathogenic Th17 from the CNS of an EAE model.
(E) Heatmap of scRNA-seq clusters of Liver (left panel), CNS (middle panel) and Lymph node. (right panel) Th17 cells performed in Alt Analyze with the ICGS algorithm.
(F) Heatmap of pathogenic Th17 genes principally upregulated in liver versus CNS or lymph node.
(G) Venn diagram of differentially expressed genes that are shared by Th17 A and EAE/CD pathogenic Th17 cells.
(H) ToppGene functional enrichment analysis of shared (light orange) and unique (dark orange) genes associated with diseases between hepatic Th17 A subset and EAE/CD pathogenic Th17 cells.
(I) ToppGene functional enrichment analysis of shared (light orange) and unique (dark orange) genes associated with biological processes between hepatic Th17 A subset and EAE/CD pathogenic Th17 cells.
(J) ChIP-seq peak enrichment analysis of promoters of genes with elevated expression in ihTh17 cells (determined by scRNA-seq).
(K) Genome-tracks of ATAC-seq signals at indicated loci in ihT 17 and chTh17 cells.
(L) Magnitude of change in transcripts and chromatin accessibility in genes related to immune activation and metabolic pathways in ihTh17 cells.
Violin plots, the mid dotted line represents the mean, and plot show the full range of values.
(B and C) Data represent combined samples of 3 individual technical replicates of 9 biological replicates. (C and L) Student’s t-test. *P < 0.05, **P < 0.005, ***P < 0.001, ****P < 0.0001.
The increased gene expression associated with inflammatory pathways prompted us to perform an in-depth phenotypic investigation of the hepatic Th17 A cluster. Gene set enrichment analysis (GSEA) revealed that the well-established pathogenic Th17 gene signature from the encephalomyelitis (EAE) model (Gaublomme et al., 2015) was significantly enriched in the overall gene expression profile of the hepatic Th17 A cluster of cells (Figure 1D). To provide greater support for our hypothesis that obesity-driven NAFLD results in the enrichment of a subset of inflammatory Th17 cells in the liver, we analyzed the previously published Th17 scRNA-seq data collected from the central nervous system (CNS) and lymph nodes (LN) in the same single-cell platform (Gaublomme et al., 2015). Alignment of Th17-cells from the CNS and LN to the hepatic Th17A cell cluster showed that CNS Th17 cells are exclusively pathogenic (Th17 subset-A) (Figure 1E, middle panel) and LN Th17 cells are a mix of both pathogenic and non-pathogenic Th17 (Figure 1E, right panel). To define whether hepatic Th17 A cluster of cells have a distinct gene expression signature relative to Th17 cells from the CNS and LN, we compared the differential expression fold changes from each of these respective datasets. To avoid consideration of batch effects between these different data sources, folds were computed within as opposed to between the two datasets (i.e., CNS Th17 A vs. LN Th17 B and LN Th17 A vs. LN Th17 B, liver Th17 A vs. liver Th17). Focusing on pathogenic Th17 genes principally upregulated in the liver versus the CNS or LN, we found considerable unique genes (n=138, Figure 1F), with distinctive disease association (i.e., Liver Cirrhosis, viral response, cancer, gene-sets human disease terms, DisGeNET) (Figure S2A–B) and GO biological process (i.e., Glucose metabolism, and the TCA cycle) relative to genes that were specific to CNS pathogenic Th17 cells (Figure S2C–D). We further examined the breadth of the shared phenotype between hepatic Th17 A cell cluster and other described pathogenic Th17 (pTh17) cells in an additional model of EAE (Gaublomme et al., 2015; Lee et al., 2012) and Crohn’s disease (CD) (Ramesh et al., 2014) using the publicly available gene signatures. Comparison of the upregulated genes between hepatic Th17 A cluster of cells and pTh17 from EAE and CD populations revealed an overlap of 48 genes (~37%; Figure 1G and Table S1). Gene pathway analysis examining the expression of common genes (light orange circles) showed association with various human inflammatory diseases including encephalomyelitis, multiple sclerosis and processes linked to Th1 cell differentiation and inflammation (Figures 1H and 1I). In contrast, the 300 genes strictly expressed by the hepatic Th17 A cluster (dark orange circles) were associated with liver diseases, including liver cirrhosis and NAFLD, and with processes linked to inflammation and cellular metabolism (i.e., glycolysis and the TCA cycle) (Figures 1H and 1I, and Table S1).
Computational analyses of publicly available ChIP-seq datasets with enriched peaks in the promoters of Th17 A signature genes highlighted the enrichment of active chromatin marks (e.g., H3K79me2) and increased binding of transcription factors (TFs) associated with Th17 cells and inflammatory pathways (e.g., STATs, IRFs; Figure 1J). Thus, we next determined if increased expression of hepatic Th17 A cell cluster signature genes correlated with increased chromatin accessibility. ATAC-seq analysis (Figure S2A) showed an increase in chromatin accessible sites (peaks) in hepatic Th17 A cell cluster cells compared to hepatic Th17 B cell cluster (Figures S2F–H). Such an increase in chromatin accessibility was observed in the regulatory regions of genes related to immune activation and metabolic pathways in the hepatic Th17 A cluster compared to Th17 B cluster (Figure S2I), including Cxcr3, Stat1, Gapdh and Pkm2 (Figures 1K and S2J). In addition, the magnitude of the change in transcripts and chromatin accessibility in genes related to immune activation and metabolic pathways (Figure S2K) validated the differential transcriptional landscape contributing to inflammatory and metabolic capacity of hepatic Th17 A cell cluster. The regulatory regions of signature genes in hepatic Th17 A cell cluster also had an increase in chromatin accessible sites (Figures 1L and S2G). Distinct TF binding motifs commonly associated with the expression of inflammatory genes were similarly enriched in hepatic Th17 A cell cluster compared to hepatic Th17 B cell cluster (Figure S2L). Together, these data suggest that hepatic Th17 A cluster of cells exhibit a conserved inflammatory and metabolic axes-associated transcriptome that may contribute to liver disease pathogenesis.
The steatotic liver microenvironment promotes the accrual of a population of inflammatory hepatic CXCR3+Th17 (ihTh17) cells that correlate with NAFLD pathogenesis
To formally test whether the steatotic liver microenvironment is responsible for the accrual of hepatic Th17 A cluster of cells, we explored the expression of CXCR3 in obese mice as a surrogate surface marker of these cells (as the Th17 B cluster of cells express very low levels of CXCR3; Figure 1C). We found that obese mice exhibited an increased hepatic presence of CD4+TCRβ+IL-17A+CXCR3+ cells (Figures 2A–B) with longitudinal hepatic accrual of Th17 A cluster of cells and a reduction in the Th17 B cluster of cells (Figure 2C). Increased frequency of the hepatic Th17 A cell cluster accrual positively correlated with hepatocellular damage (Figure 2D). As proinflammatory cytokines promote hepatocellular damage, we next examined the proinflammatory cytokine production by hepatic Th17 A (CXCR3+) and Th17 B (CXCR3low) cell clusters. Indeed, the CXCR3+ cells, compared to CXCR3low cells, were enhanced in the ability to co-produce IL-17A, IFNγ and TNFα (IL-17A/TNFα = 1.2-fold increase; IL-17A/IFNγ = 8-fold increase; IL-17A/IFNγ/TNFα = 2-fold increase; Figure 2E). Given the unique inflammatory properties of the hepatic Th17 A (CD4+TCRβ+IL-17A+CXCR3+) cluster of cells and their association with pathways that regulate NAFLD progression, we termed these cells as inflammatory hepatic Th17 (ihTh17) cells. In contrast, given the low level of CXCR3 expression by the Th17 B cluster of cells and their restricted proinflammatory cytokine production we termed these cells as conventional hepatic Th17 (chTh17) cells.
Figure 2. ihTh17 cells exacerbate NAFLD pathogenesis.
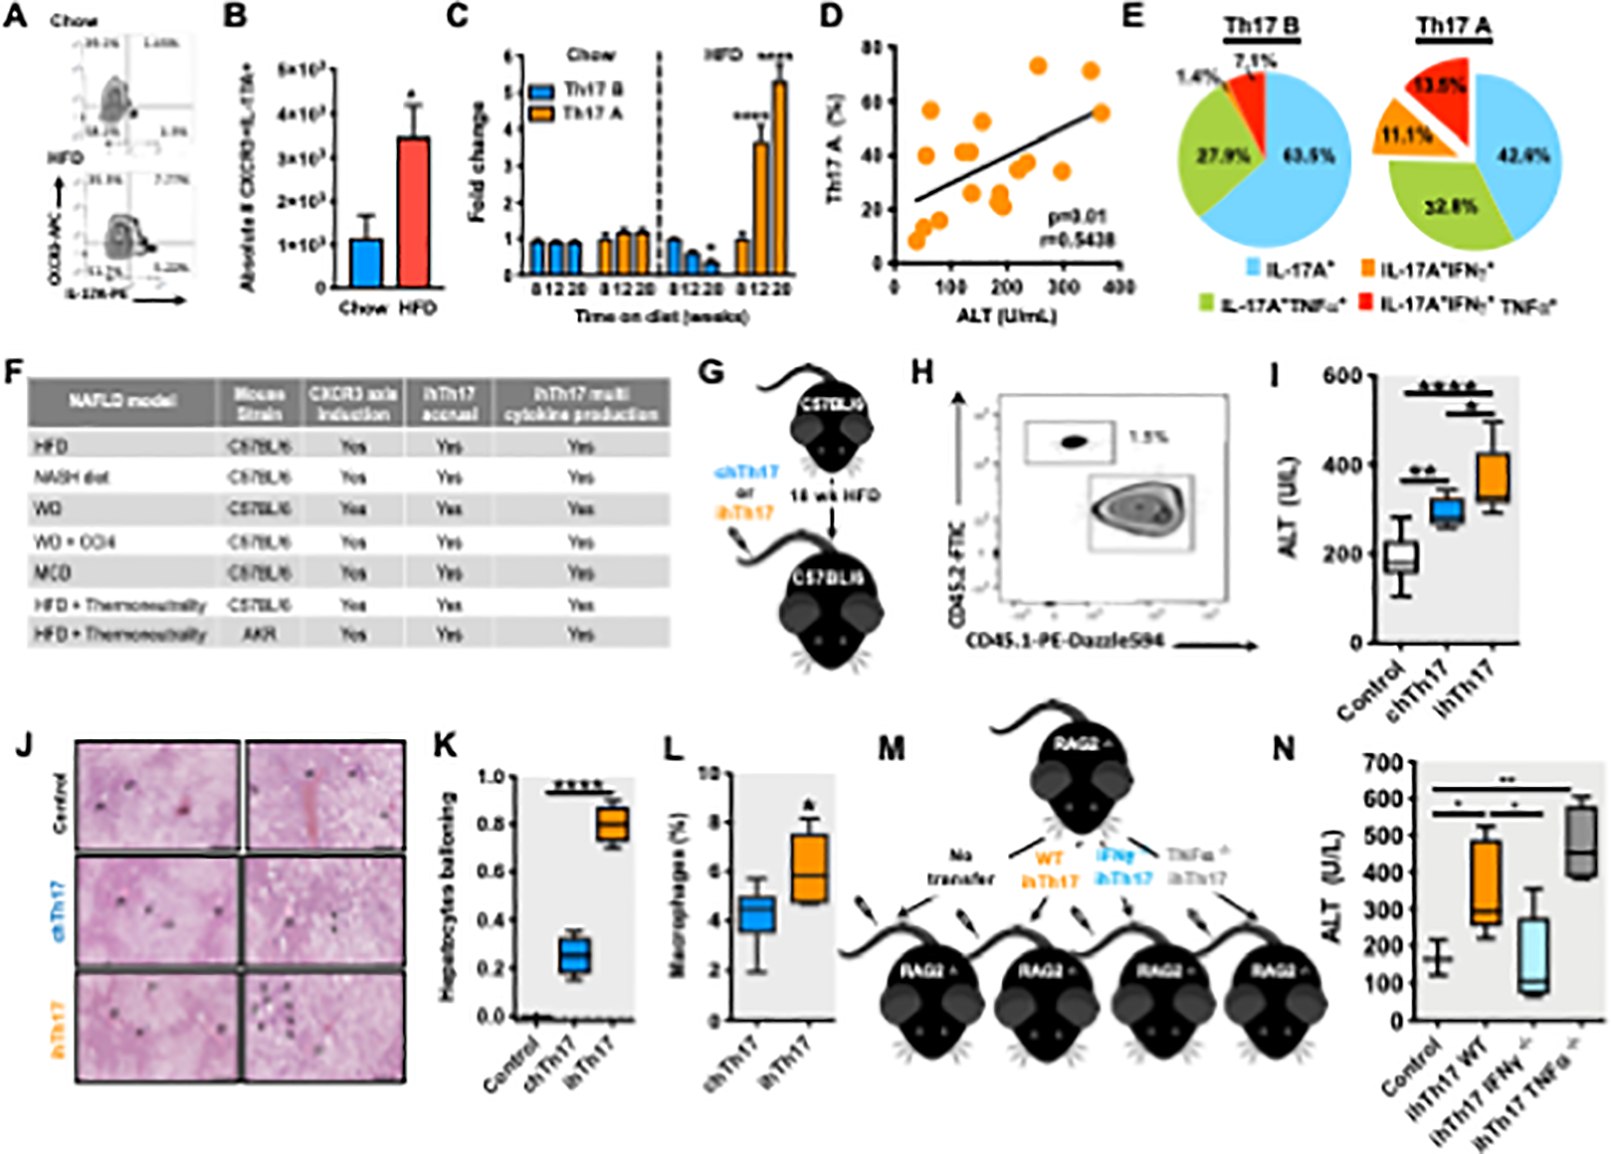
(A-E) 8-week-old male C57BL/6 mice (n = 3–6/condition) were fed HFD diet up to 20 weeks.
(A) Representative Flow cytometry of liver-infiltrating Th17 (TCRβ+CD4+CXCR3+IL-17A+) cells.
(B) Absolute number (#) of T CRβ+CD4+CXCR3+IL-17A+ cells; chow (blue) HFD (red) (n = 3).
(C) Kinetic analysis of Th17 A (CXCR3+, orange) and Th17 B (CXCR3low, blue) cells (n = 3).
(D) Kinetic (up to 20 weeks) correlation of Th17 A cells with serum alanine transaminase (ALT) (n = 18).
(E) Cytokine production (IL-17A, IFNγ and TNFα), post PMA/Ionomycin (50 ng/ml and 1 mg/ml respectively) stimulation, by flow cytometry (n = 6).
(F) 8-week-old male C57BL/6 mice (n = 3–6/condition) or AKR mice were fed specified diets and housed at standard (22°C) or thermoneutral (30°C) temperatures. HFD, NASH, WD and WD +CCl4 and MCD diet. Summary of CXCR3 axis activation and ihTh17 accrual in several mouse models of NAFLD.
(G) Schematic representation of ihTh17 and chT17 transfer. Sorted ihTh17 and chT17 cells were transferred i.v. into HFD-fed (18 weeks on diet) C57BL/6 mice (n = 3–6/condition).
(H) Representative Flow cytometry depicting transferred cells in the liver of recipient congenic HFD fed mice in mice described in G.
(I) Serum ALT levels 3 weeks post i.v. transfer of splenic naive CD4+ T cells (control), chTh17 and ihTh17 cells into congenic WT mice (n = 6) in mice described in G.
(J) Liver hematoxylin eosin (H&E) staining after cell transfer in mice described in C. Left: lower magnification, scale bar = 200μm; Right: higher magnification, scale bar = 100μm.
(K) Hepatocyte ballooning quantification analyzed from H&E staining (n = 4) in mice described in G.
(L) Frequency of liver macrophage infiltration after T cell transfer determined by flow cytometry (n = 4) in mice described in G.
(M) Schematic representation of WT, IFNγ/- and TNFβ−/− ihTh17 transfer. ihTh17 cells were transferred i.v. into HFD fed (18 weeks on diet) Rag2−/− mice (n = 3–5/condition).
(N) Serum ALT levels 3 weeks post i.v. transfer of control (splenic naive CD4+ T cells), WT, IFNγ−/− and TNFβ−/− ihTh17 cells into Rag2−/− mice (n = 3–5) in mice described in M.
In bar graphs, data represent mean + SEM. For box plots, the midline represents the mean, boxes represent the interquartile range and whiskers show the full range of values. (B) A representative of 3 individual technical replicates of 3–6 biological replicates. (C) A representative of 2 individual technical replicates of 3 biological replicates. (D) Data represent combined data of 6 individual experiments 6 individual technical replicates of 3 biological replicates. (E) Data represent combined data of 2 individual technical replicates of 3 biological replicates. (F) Data represent an individual technical replicate of 3–6 biological replicates (H-J) A representative of 4 individual technical replicates of 3–6 biological replicates. (N) Data represent an individual technical replicate of 3–5 biological replicates. (B, C, L) Student’s t-test. (D) Pearson correlation. (I, K and N) One-way ANOVA. *P < 0.05, **P < 0.005, ***P < 0.0005, ****p < 0.0001.
To determine whether the appearance of newly identified ihTh17 cells is a hallmark of NAFLD, we recapitulated studies focused on the emergence of ihTh17 cells in multiple commonly used diet-induced NAFLD models (see the STAR Methods for the details of these models). All diets used recapitulated well-established NAFLD and metabolic parameters (Table S2). Importantly, in all examined NAFLD models, dietary challenge exacerbated hepatic steatosis, hepatic activation of the CXCR3 axis (Figure 2F and Table S2) and hepatic accrual of ihTh17 cells compared to chow fed animals (Figure 2F and Table S2). Akin to HFD, ihTh17 cells in these models had the capacity to co-produce multiple pro-inflammatory cytokines (Figure 2F and Figures Table S3). These effects were not unique to WT C57BL/6 mice and AKR mice housed at thermoneutrality and fed a HFD similarly displayed hepatic activation of the CXCR3 axis (Figure 2F and Table S2) and hepatic ihTh17 cells accrual and production of multiple proinflammatory cytokines (Figure 2F and Table S3). Together, these data demonstrate that diet-modified hepatic microenvironment promotes accrual of ihTh17 cells that in turn may contribute to NAFLD progression.
ihTh17 cells are sufficient to exacerbate hepatocellular damage
To determine whether ihTh17 cells amplify NAFLD pathogenesis, similar to other pathogenic Th17 cells that are known to promote CD and EAE pathogenesis (Gaublomme et al., 2015; Hu et al., 2017; Lee et al., 2012; Ramesh et al., 2014), we performed adoptive transfer of ihTh17 or chTh17 cells into obese mice (Figure 2G). Given the limited cell availability of in vivo ihTh17 and chTh17 cells, we used in vitro generated ihTh17 and chTh17 cells (Figure S3A), which maintain a similar phenotype to in vivo ihTh17 and chTh17 cells (Figure S3B–E). Despite similar body weight gain, adiposity and liver weight between ihTh17, chTh17 and mock-transfer (saline) recipient mice (Figures S3F–H), animals receiving ihTh17 cells had detectable transferred ihTh17 cells in the liver (Figure 2H) and displayed exacerbated hepatocellular damage, exceeding the levels induced by chTh17 cells (Figure 2I). Further, histological analysis of the liver revealed increased hepatocyte ballooning (Figure 2J–K), hepatic triglyceride accumulation (Figure S3I) and hepatic macrophage (CD11+F4/80+) accrual (Figure 2L), in mice that received ihTh17 cells. Importantly, the amplified hepatocellular damage was not unique to in vitro polarized ihTh17 cells as transfer of in vivo harnessed ihTh17 cells was similarly sufficient to exacerbate hepatocellular damage in obese mice (Figure S3J–P). The ability of ihTh17 cells to directly impact hepatocellular damage was examined in vitro by employing the Th17 cell and primary hepatocyte coculture system (Figure S4A). As expected, ihTh17, compared to chTh17, cells produced increased levels of IFNγ and TNFα (Figure S4B). The co-culture of ihTh17 cells with primary hepatocytes was sufficient to increase ALT levels in the culture supernatants (Figure S4C), which was abrogated following the TNFα and IFNγ neutralization (Figures S4D).
To formally examine whether ihTh17 cells were sufficient to exacerbate hepatocellular damage we adoptively transferred ihTh17 cells into Rag2−/−mice (Figure 2M), which do not develop NASH (Sun et al., 2018). HFD-fed Rag2−/− mice became obese (Figure S4E–F), and developed hepatic steatosis (Figure S4G–I), but did not develop hepatocellular damage (Figure 2N). Transfer of WT ihTh17 cells into Rag2−/− recipient mice was sufficient to induce hepatocellular damage, which correlated with hepatic accrual of WT ihTh17 cells and their ability to co-produce IL-17A, IFNγ, and TNFα (Figure 2N and Figure S4J–K). We next examined if ihTh17 cell-produced proinflammatory cytokines were sufficient to drive hepatocellular damage. Lack of IFNγ expression by transferred ihTh17 cells was sufficient to abrogate hepatocellular damage (Figure 2N). Surprisingly, lack of TNFα expression by transferred ihTh17 cells potentiated ihTh17 cell pathogenic potential (Figure 2N). Notably, these findings were not limited to in vivo transfer studies as they were recapitulated in a setting employing co-cultures of ihTh17 cells with primary hepatocytes (Figures S4L–M). Together, these data suggest that ihTh17 cells contribute to NAFLD pathogenesis directly, and their ability to coproduce multiple proinflammatory cytokines, and in particular IFNγ, may represent the key means of their effect in amplifying hepatocellular damage. Additionally, ihTh17 cells also exerted indirect pathogenic effects by promoting the recruitment (Figure 2L) and activation of hepatic macrophages, which are central to NAFLD pathogenesis (Kazankov et al., 2019).
The CXCR3 axis activation regulates inflammatory hepatic Th17 cell accrual
To begin to determine the processes underlying ihTh17-dependent NAFLD pathogenesis, we first focused on the mechanisms driving ihTh17 cell hepatic accrual. ihTh 17, but not chTh17, cells express high levels of CXCR3 (Figure 1C). CXCL9, CXCL10 and CXCL11 promote T cell migration to inflamed sites via engagement of CXCR3 (Coppieters et al., 2013; Groom and Luster, 2011). Among T cell-recruiting chemokines, CXCL9 and CXCL10 (a frame shift mutation in C57BL/6 mice prevents CXCL11 expression (Sierro et al., 2007)) were prominently expressed in the liver of obese mice (Figure 3A). Of note, CXCL9 and CXCL10 expression longitudinally increased with the duration of the obesogenic diet feeding (Figure 3B). Hence, we next examined the necessity of the CXCR3 axis for ihTh17 hepatic accrual (Figure 3C). Antibody mediated neutralization of either CXCR3 or CXCL9/CXCL10 during established obesity conferred protection from hepatocellular damage (Figures 3D and S5A–B) and hepatic accrual of ihTh17 cells and macrophages (Figures 3E and S5C). These finding was recapitulated in a model of western diet (WD)-induced NAFLD (Tsuchida et al., 2018) (Figure S5D–K), suggesting that activation of the CXCR3 axis may represent an important hallmark of NAFLD progression. As CXCR3 expression was dispensable for naïve CD4 T cell polarization towards ihTh17 cell proinflammatory cytokine production (Figures S5L–M), we further validated the contribution of ihTh17 cell-intrinsic CXCR3 expression to NAFLD severity following adoptive transfer of CXCR3-deficient ihTh17 cells into obese WT mice (Figure 3F). Adoptive transfer of CXCR3-deficient, compared to CXCR3-sufficient, ihTh17 cells failed to exacerbate hepatocellular damage (Figures 3G and S5N–P). We next established if hepatic accrual of ihTh17 cells was dependent on obesity and hepatic steatosis. Obese mice (12 weeks on obesogenic diet) were either maintained on an obesogenic diet for an additional 8 weeks to promote severe DIO or were switched to a chow diet to induce weight loss (Figure 3H). The switch to a chow diet reversed HFD-associated obesity, adiposity, glucose dysmetabolism, hepatomegaly and hepatic steatosis/triglyceride content (Figures S5Q–U). Dietary switch- associated weight loss was also sufficient to reverse hepatic accrual of ihTh17 cells (Figure 3I) and macrophages (Figure S5V), normalize systemic ALT levels (Figure 3J) and was correlated with decreased hepatic Cxcl9 and Cxcl10 expression (Figure S5W). Collectively, these findings suggest that weight/diet-driven liver microenvironment changes in CXCR3/CXCL9/CXCL10 axis activation is pivotal for hepatic accrual of ihTh17 cells and inflammation driven NAFLD pathogenesis.
Figure 3. The obesogenic liver environment favors CXCR3 axis activation and promotes ihTh17 cell accrual.
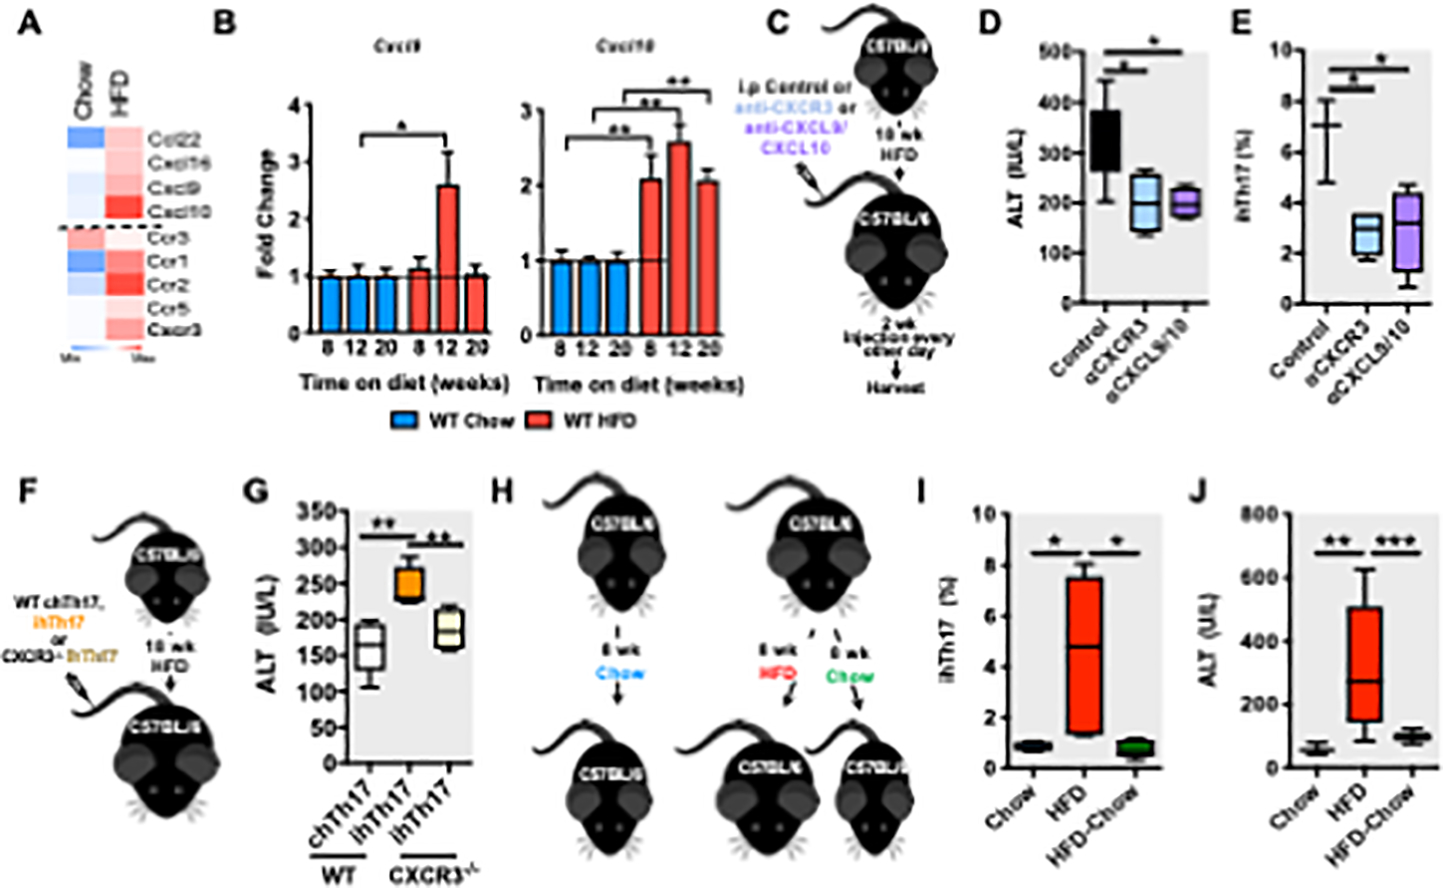
(A-B) 8-week-old male C57BL/6 WT mice were fed chow or HFD for up to 20 weeks.
(A) Heatmap of RNA-seq analysis (n = 2) of hepatic T cell recruiting chemokines and chemokine receptors.
(B) Kinetic analysis of hepatic CXCL9 and CXCL10 mRNA expression by qPCR (n = 3–6/group).
(C) A schematic diagram of CXCR3 and CXCL9/CXL10 blockade in vivo. C57BL/6 mice (n = 3– 4/group) were fed HFD for 20 weeks. At week 18, mice were mock-treated (saline) or treated, twice weekly, for 2 weeks, with CXCR3 (100 μg/mice) or CXCL9/CXCL10 (100 ĝ/mice each) neutralizing Abs.
(D) Serum ALT levels in mice described in C.
(E) Hepatic accrual of ihTh17 cells by flow cytometry in mice described in C.
(F) Schematic representation of the adoptive transfer of WT and CXCR3−/− ihTh17 cells. WT ihTh17, WT chT17 and CXCR3−/− ihTh17 cells, were transferred i.v. into HFD fed (18 weeks on diet) C57BL/6 mice (n = 3–6/condition).
(G) Serum ALT levels 3 weeks post transfer in mice described in F.
(H) A schematic diagram of weight gain/loss model. 8-week-old male C57BL/6 mice, (n = 4– 6/condition) were fed chow (blue) or HFD diet for 8 weeks. Subsequently the HFD fed cohort was split into a continuous HFD fed group (red) or a chow diet fed group (green) for an additional 8 weeks.
(I) Frequency of hepatic Th17 A (TCRβ+CD4+CXCR3+IL-17A+) cells after weight loss in mice described in H.
(J) Serum ALT levels after weight loss in mice described in H.
In bar graphs, data represent mean + SEM. For box plots, the midline represents the mean, boxes represent the interquartile range and whiskers show the full range of values. (A, D, E, G, I and J) Data represent an individual technical replicate of 2–5 biological replicates. (B) Data represents 2 individual technical replicates of 3–6 biological replicates. (D, E, G, I and J) One-way ANOVA. (B) Student’s t-test. *P < 0.05, **P < 0.005, ***P < 0.0005.
Cellular metabolism shapes the inflammatory potential of ihTh17 cells
Imprinted metabolic landscapes regulate immune cell proinflammatory capacity (Chisolm and Weinmann, 2018; Gubser et al., 2013; van der Windt et al., 2013). We therefore sought to identify molecular contributors to the functional differences between ihTh17 and chTh17 cells. ihTh17 cells, compared to chTh17 cells, showed a strong increase in the expression of genes associated with the glycolytic process and the TCA cycle (Figures 4A and 1G). GSEA also revealed that a glycolytic signature from KEGG pathways was significantly enriched in ihTh17 cells (Figure 4B). Further, the expression of key glycolytic enzymes, including Pkm2 (Pyruvate kinase), Pgk1 (Phosphoglycerate kinase 1) and Hk (Hexokinase), as well as the glucose transporters Slc2a3 (Solute carrier family 2) and Slc2a9, were upregulated in ihTh17 cells, compared to chTh17 cells (Figure 4C). Functionally, increased expression of glucose transporters correlated with increased glucose uptake by ihTh17 cells in vivo and in vitro (Figure 4D), while quantification of cellular bioenergetics using Seahorse (Moreno-Fernandez et al., 2018) confirmed a higher glycolytic rate (Figure 4E) and increased basal mitochondrial respiration following mitochondrial uncoupling (Figure 4F) in ihTh17 cells compared to chTh17 cells. Metabolomic analysis using nuclear magnetic resonance (NMR) also revealed changes in the secreted and intracellular metabolic profile (Figures 4G and S6A) with decreased glucose and increased lactate production observed in ihTh17 cells compared to chTh17 cells (Figure S6B). The analysis of intracellular metabolites demonstrated altered 4-aminobutyrate (GABA)/formate, GABA/guanosine-5’-triphosphate (GTP), aspartate/alanine and aspartate/glutamine ratios between ihTh17 and chTh17 cells (Figure S6C), which further supports the invoked glycolytic phenotype and higher metabolic demands of ihTh17 cells.
Figure 4. Inflammatory hepatic Th17 cells exhibit increased glycolytic capacity.
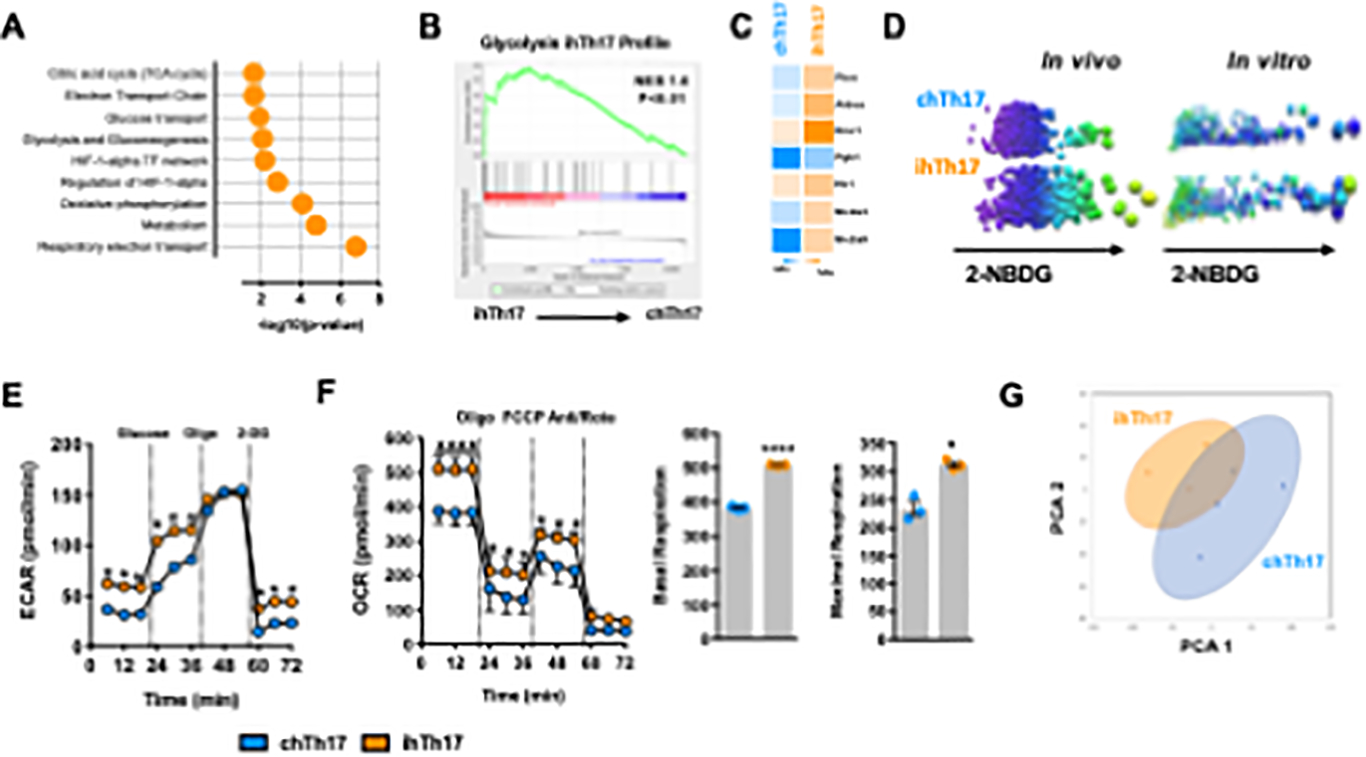
(A-C) Toppgene, GSEA and heatmap analysis of WT ihTh17 and chTh17 cells
(A) Toppgene Pathway enrichment analysis of significantly upregulated genes associated with metabolism in ihTh17 vs chTh17 cells from data depicted in Figure 1.
(B) GSEA analysis of ihTh17 cells and KEGG glycolytic pathway.
(C) Heatmap of glycolytic gene expression between hepatic ihTh17 and chTh17 cells as determined by scRNA-seq from data depicted in Figure 1.
(D) Glucose (2-NBDG) uptake by ihTh17 and chTh17 cells in the liver of obese mice (in vivo) and polarized ihTh17 and chTh17 (in vitro) respectively.
(E-F) Cellular metabolic capacity of WT ihTh17 and chTh17 cells as determined by Seahorse XF96 analyzer. (E) Cellular glycolytic capacity (Extracellular acidification rate [ECAR]) (n = 3).
(F) Cellular mitochondrial respiratory capacity (Oxygen consumption rate [OCR]) (left). Basal and Maximal OCR (right).
(G) PCA analysis of ihTh17 and chTh17 cells (n = 3) metabolic profile as determined by NMR.
Data represent means + SE. (A-C) Data represent combined samples of 3 individual technical replicates of 3 biological replicates. (D) Data represent 1 individual technical replicate of 1 biological replicate. (E) A representative experiment of 3 individual technical replicates of 3 biological replicates. (G) Data represent samples of 1 individual technical replicate of 3–4 biological replicates. (E-F) Student’s t-test, *P < 0.05 and ****p < 0.0001.
To examine whether skewed cellular metabolism, and specifically glycolytic potential, contributes to ihTh17 cell inflammatory capacity, ihTh17 cells were treated with the glycolysis inhibitor 2-DG in vitro (Figure S6D). Inhibition of glycolysis in ihTh17 cells reduced ihTh17 cell capacity to produce IL-17A, IFNγ and TNFα in vitro without impacting CXCR3 expression (Figure S6E–F). We next determined if such effects are maintained in vivo and possibly contribute to NAFLD severity. Short term 2-DG treatment of obese mice in vivo (Figure 5A) did not alter adiposity (Figure S5G) or hepatic triglyceride accumulation (Figure S6H) but was sufficient to reduce hepatocellular damage (Figure 5B), hepatic Cxcr3, Cxcl9 and Cxcl10 expression (Figures 5C and S6I), and ihTh17 cell and macrophage accrual in the liver (Figures 5D and S6J). Notably, ihTh17 cells from 2-DG-treated mice exhibited reduced production of IL- 17A and IFNγ following ex vivo re-stimulation (Figure 5E).
Figure 5. Glycolytic skewing of inflammatory hepatic Th17 cells shapes their proinflammatory cytokine production and NAFLD pathogenesis.
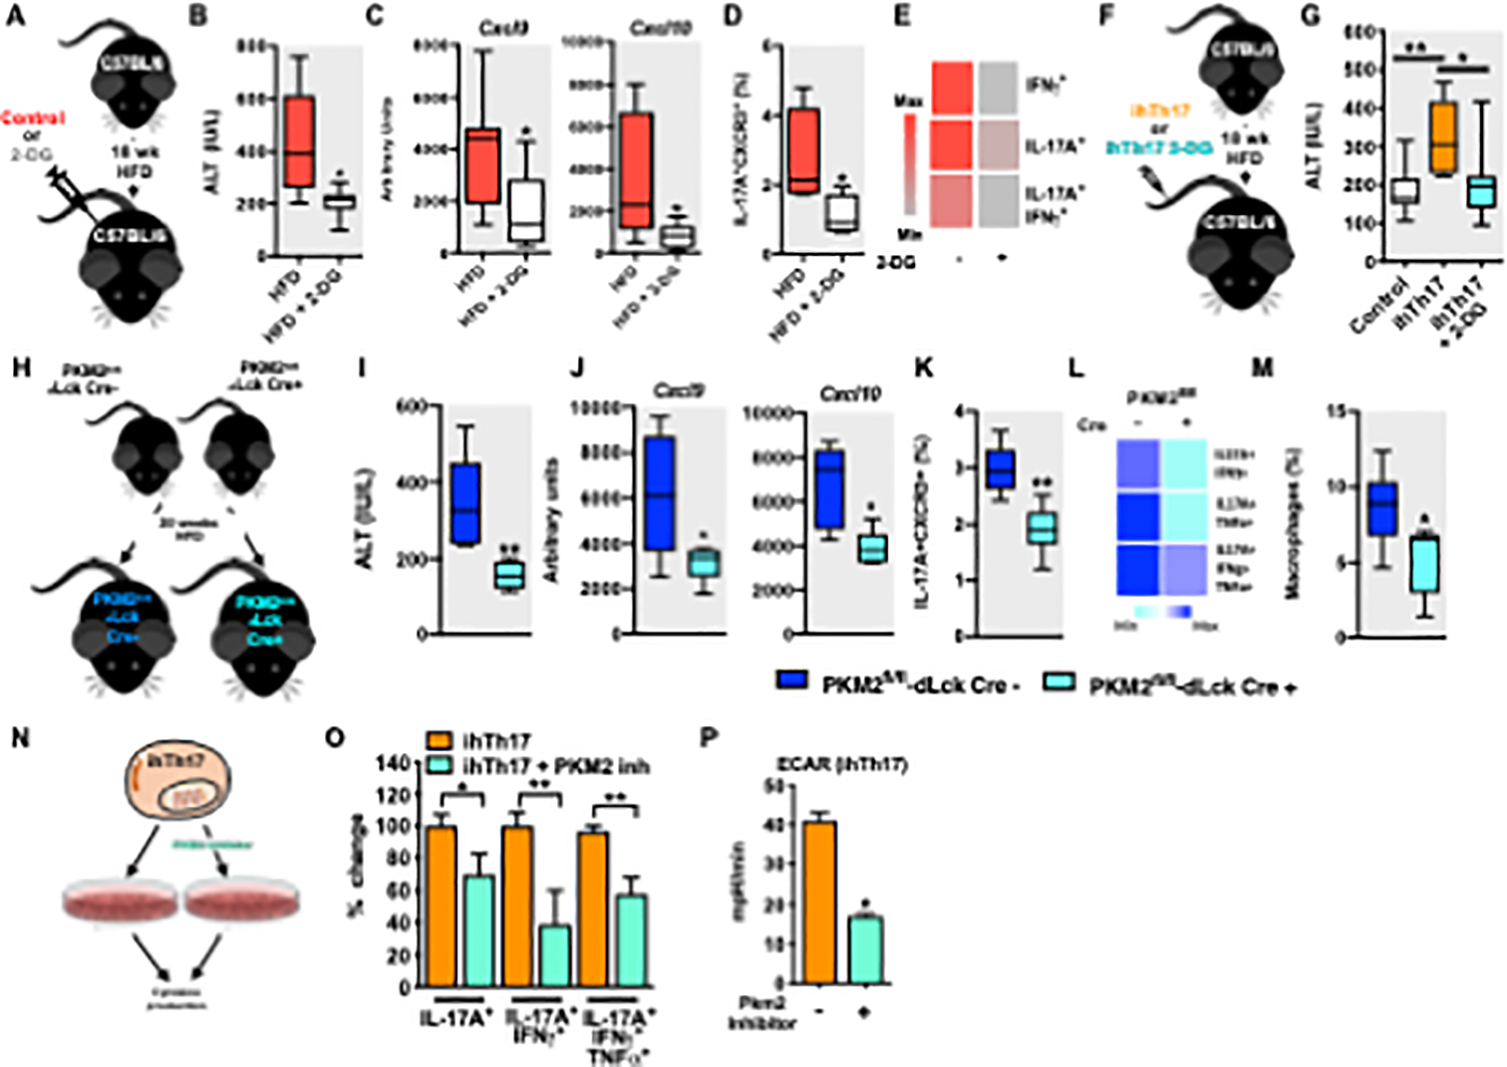
(A-E) 8-week-old male C57BL/6 mice (n = 7–8/condition) were fed HFD for 18 weeks and mock- treated (saline) or treated, every other day, for 1 week with 2-DG (1 g/kg).
(A) Schematic representation of in vivo glycolysis inhibition.
(B) Serum ALT levels after 2-DG treatment in mice described in A.
(C) Hepatic mRNA levels of CXCL9 and CXCL10 (n = 6–7) in mice described in A.
(D) Frequency of liver ihTh17 (CD4+IL-17A+CXCR3+) cells after 2-DG treatment in mice described in A.
(E) Cytokine production (IL-17A, IFNγ and TNFα) by liver isolated ihTh17 cells in context of 2- DG treatment post PMA/Ionomycin (50 ng/ml and 1 mg/ml respectively) stimulation as determined by flow cytometry in mice described in A.
(F) Schematic representation of glycolysis inhibition in ihTh17 cells. Sorted GFP+ ihTh17 were mock treated or treated with 2-DG ex vivo. ihTh17 cells were i.v transferred into C57BL/6 mice fed HFD for 18 weeks (n = 9–10/condition).
(G) Serum ALT levels after transfer in mice described in F.
(H) Schematic representation, 8-week-old male PKM2fl/fl/dLCk-Cre- and PKM2fl/fl/dLCk-Cre+ mice (n = 6/condition) were fed HFD for 20 weeks.
(I) Serum ALT levels after 2-DG treatment in mice described in H.
(J) Hepatic mRNA levels of CXCL9 and CXCL10 (n = 6–7) in mice described in H.
(K) Frequency of liver ihTh17 (CD4+IL-17A+CXCR3+) cells after 2-DG treatment in mice described in H.
(L) Cytokine production (IL-17A, IFNγ and TNFα by liver isolated ihTh17 cells in context of 2-DG treatment.
(M) Frequency of liver macrophage infiltration after T cell transfer determined by flow cytometry.
(N) Schematic representation inflammatory Th17 cell polarization. Naïve splenic CD4+ T cells isolated by negative selection using magnetic beads were cultured under inflammatory Th17 polarizing conditions for 3 days in the presence or absence of the glycolysis inhibitor Shikonin.
(O) % change of frequency of IL-17A, IFNγ and TNFα expressing cells were quantified by flow cytometry after Shikonin treatment (n = 3).
(P) Cellular glycolytic capacity (Extracellular acidification rate [ECAR]) of ihTh17 cells as determined by Seahorse XF96 analyzer after Shikonin treatment.
For box plots, the midline represents the mean, boxes represent the interquartile range and whiskers show the full range of values. In bar graphs, data represent mean + SEM. (B-E and I-M) Data represent combined samples of 2 individual technical replicates of 6–8 biological replicates. (G) Data represent combined samples of 3 individual technical replicates of 9–10 biological replicates. (O-P) Data represent samples of 1 individual technical replicate of 3–5 biological replicates. (B-E, I-M, and O-P) Unpaired Student t-test *P < 0.05 and **P < 0.005. (G) One-way ANOVA, *P < 0.05, **P < 0.005.
To formally examine the intrinsic role of glycolysis in ihTh17 cell inflammatory potential and its sufficiency to modify NAFLD pathogenesis, we first adoptively transferred ex vivo mock- treated or 2-DG-treated ihTh17 cells into obese mice (Figure 5F). Transfer of ex vivo 2-DG treated ihTh17 did not alter adiposity, hepatic triglyceride and Cxcl9/Cxcl10 levels (Figures S6K–M). Importantly, ex vivo 2-DG treatment of ihTh17 cells was sufficient to limit the amplification of hepatocellular damage (Figure 5G). Given these robust findings we next examined the direct impact of T cell glycolysis on NAFLD development and progression. Genetic deletion of PKM2 in T cells (PKM2fl/fl-dLckCre) in HFD-fed mice, compared to controls, (Figure 5H) was sufficient to reduce hepatocellular damage (Figure 5I), hepatic Cxcl9 and Cxcl10 expression (Figures 5J), and hepatic accrual of ihTh17 cells (Figures 5K). Further, PKM2 deletion in T cells reduced ihTh17-cell-dependent IL-17A IFNγ and TNFα production following ex vivo re-stimulation (Figure 5L) and macrophage accrual in the liver (Figures 5M). Notably, treatment of ihTh17 cells with a PKM2 inhibitor, shikonin (Figure 5N), similarly diminished ihTh17 cell inflammatory vigor and their glycolytic capacity in vitro (Figure 5O–P). These data collectively support a critical role for glycolysis and PKM2 in the modulation of ihTh17 proinflammatory potential and their pathogenic function in NAFLD.
Hepatic accumulation of ihTh17-like cells correlates with NAFLD severity in humans
To formally examine the translation of our discoveries to humans we recruited a cohort of severely obese persons with or without (controls) histologically confirmed NAFLD (Table S4) and examined biological parameters associated with the activation of the IL-17 axis. As expected, obese individuals with NAFLD, graded using NASH Clinical Research Network histological criteria (Kleiner et al., 2005), displayed histological evidence of steatosis compared to equally obese controls without NAFLD (Figure 6A). Obese individuals with NAFLD displayed hepatocellular ballooning (Figure 6B left) and inflammation (Figure 6B right), pericentral sinusoidal fibrosis (Figure 6C left) and mild periportal fibrosis (Figure 6C right). Full quantification of NAFLD parameters in our cohort is depicted in Table S4. The obese individuals with NAFLD also displayed higher serum triglycerides and liver enzymes associated with hepatocellular damage compared to obese controls (Figure 6D and Table S4). Despite similar ages and BMIs (Table S4), systemic levels of inflammatory mediators associated with naive CD4 T cell subset polarization into Th17 cells (e.g., IL-6, IL-1β), recruitment of CXCR3 expressing cells (e.g., CXCL9 and CXCL10) and inflammation (e.g., IFNγ, IL-17A, IL-6) were augmented in the obese individuals with NAFLD compared to obese controls (Figure 6E). Increases in the activation of these inflammatory pathways was similarly observed in the liver, as evidenced by increased expression of CXCL9, CXCL10, CXCL11 and CXCR3 (Figures 6F–G) and TNFA and IFNG (Figure 6H) in obese individuals with NAFLD compared to obese controls.
Figure 6. Presence of ihTh17-like cells positively correlates with NAFLD severity in humans.
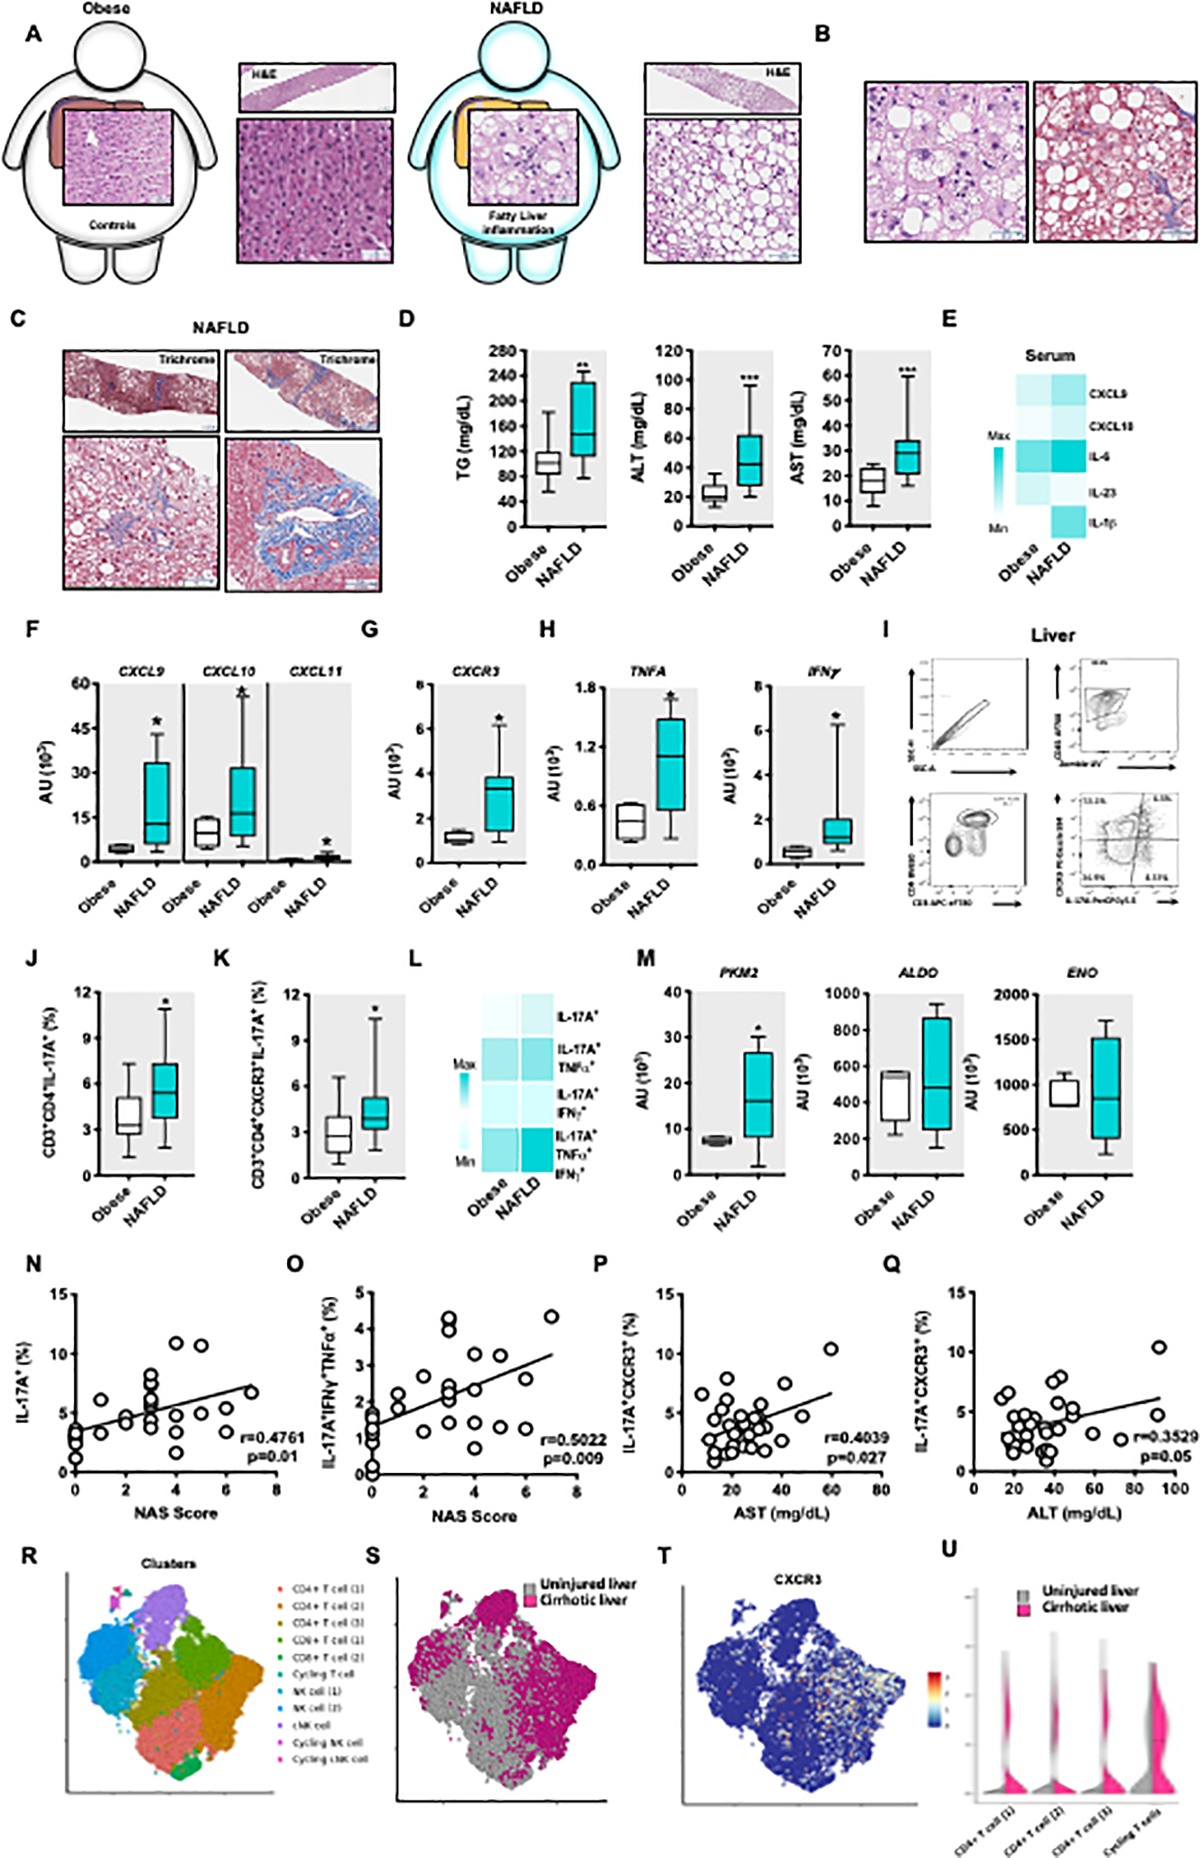
(A-C) Representative histology pictures.
(A) A schematic diagram of individuals with severe obesity with and without NAFLD: Obese individuals without NAFLD (n = 15) and obese individuals with NAFLD (n = 15). A representative H&E stain. Left, normal liver (no fatty liver disease with few binucleated hepatocytes present). Top left = lower magnification, Scale bar = 237μm; Bottom left = higher magnification, Scale bar = 63μm. Right, steatotic liver (steatosis, grade 3 and macrovesicular steatosis). Top right = lower magnification, Scale bar = 237pm; Bottom right = Scale bar = 72pm.
(B) Histological representation of liver from an obese individual with NAFLD. Left = A representative H&E stain. Focal lobular inflammation and ballooning, with spotty macro- and microvesicular steatosis in the background; Scale bar = 42μm. Right = A representative Trichrome stain. Ballooning degeneration in the settings of macrovesicular steatosis, with sinusoidal fibrosis (blue); Scale bar = 63μm.
(C) Histological representation of liver fibrosis from obese individuals with NAFLD. Trichrome stain. Top left = steatosis, pericentral (zone 3–2), with periportal sparing (Scale bar = 237μm). Bottom left = Pericentral sinusoidal fibrosis, associated with pericentral (zone 3) steatosis, sparing of zone 1 (Scale bar = 76μm). Top right = Steatosis, with pre-cirrhotic fibrosis (stage 3 of 4), regional extensive sinusoidal fibrosis (Scale bar = 237μm). Bottom right = periportal fibrosis (Scale bar = 131μm).
(D) Serum triglycerides (TG), alanine transaminase (ALT) and Aspartate Aminotransferase (AST) levels.
(E) Heat map depiction of indicated average serum cytokine and chemokine protein levels determined by Luminex Assay.
(F-H) Hepatic mRNA expression of CXCR3 axis (CXCL9, CXCL10, CXCL11, CXCR3) and inflammatory (TNFA, IFNG) genes from obese individuals without NAFLD and obese individuals with NAFLD.
(I) Representative gating strategy of isolation and quantification of hepatic Th17 infiltrating cells from liver wedge biopsies of obese individuals without NAFLD and obese individuals with NAFLD.
(J-K) Frequency of hepatic Th17 cells and the frequency of hepatic Th17 expressing CXCR3 cells in liver wedge biopsies from obese individuals without NAFLD and obese individuals with NAFLD.
(L) Heat map depiction of IL-17A, IFNγ and TNFα producing, IL-17A expressing hepatic Th17CXCR3+ cells in obese individuals without NAFLD and obese individuals with NAFLD post PMA/Ionomycin (50 ng/ml and 1 mg/ml respectively) stimulation, by flow cytometry.
(M) Hepatic mRNA levels of PKM2, ALDO AND ENO from obese individuals without NAFLD and obese individuals with NAFLD.
(N-Q) Correlation analysis of Th17 and ihTh7 cells with NAFLD activity score (NAS), AST and ALT levels in our human cohort.
(R) Clustering from sc-RNASeq of leucocytes (CD45+) from healthy and cirrhotic human livers. Cell lineage inferred from expression of marker gene signatures. CD4 T cells, CD8 T cells, NK cells and cycling markers.
(S) Enrichment of CD4 T cells in cirrhotic compared to healthy human livers
(T) CXCR3 expression in inferred cell linages.
(U) CXCR3 expression in CD4 T cells from A above from cirrhotic compared to healthy human livers.
For box plots, the midline represents the mean, boxes represent the interquartile range and whiskers show the full range of values. (D, J-L, N-Q) Data represent n = 30 human samples. (E) Data represent n = 24 human samples. (F-H, M) Data represent n = 14 human samples. (D-M) Unpaired Mann Whitney test *P < 0.05, **P < 0.005, ****P < 0.0001. (N-Q) Pearson correlation.
We next characterized liver wedge biopsy immune infiltration using flow cytometry (Figure 6I) and found that obese individuals with NAFLD, compared to obese controls, had increased hepatic frequency of total Th17 cells (CD45+CD3+CD4+IL-17A+) (Figure 6J) and an increase in the frequency of ihTh17 cells (CD45+CD3+CD4+CXCR3+IL-17A+) (Figure 6K). Importantly, the hepatic CXCR3+ ihTh17 cells from obese individuals with NAFLD exhibited an increased capacity to concomitantly produce multiple proinflammatory cytokines, including IL- 17A, TNFα and IFNα (IL-17A/TNFα = 1.2-fold increase; IL-17A/IFNγ = 2-fold increase; IL- 17A/IFNγ/TNFα = 2-fold increase; Figure 6L). Obese individuals with NAFLD also displayed increased hepatic expression of the glycolytic enzymes including PKM2, ALDOA, and ENO (Figure 6M) compared to obese controls. Lastly, in agreement with our multiple mouse experimental model findings, the frequency of Th17 cells concomitantly producing proinflammatory cytokines positively correlated with the histological NAFLD activity score (NAS) (Figures 6N–O), as well as serum AST and ALT levels (Figure 6P–Q).
Lastly, to provide additional support for the role of the CXCR3 axis in human NAFLD severity, we analyzed publicly available scRNA-seq from the livers of uninjured individuals and individuals with cirrhosis (Ramachandran et al., 2019). Unbiased analysis using single-cell genomics of the hepatic infiltrating immune cells demonstrated the presence of T and NK cells in the liver of uninjured individuals and those with cirrhosis (Figure 6R). Among all liver T cells in these cohorts there was an enrichment of CD4+ T cells in individual with cirrhosis compared to uninjured subjects (Figure 6S). Specifically, in this setting the CXCR3 expression was directly increased within the CD4+ T cells in individuals with cirrhosis compared to the uninjured controls (Figure 6T and 6U). In sum, our data suggest that akin to mouse models, human NASH is associated with the activation of the CXCR3 axis in the liver that correlates with the accrual and inflammatory vigor of the ihTh17 cells. Hence, the liver microenvironment likely plays a dominant role in shaping the fate, accrual, function and contribution of the ihTh17 cells to NASH-associated liver pathology.
DISCUSSION
Here, we show that the liver microenvironment promotes NAFLD progression in part via alteration of hepatic Th17 cell characteristics. Specifically, we show that the obesity-associated systemic and hepatic milieu favors ihTh17 cell development, hepatic accrual and shapes their cellular metabolism and epigenetics. Mechanistically, our findings demonstrate that ihTh17- dependent NAFLD progression is associated with activation of the CXCR3-CXCL9/10 axis and unique metabolic and proinflammatory characteristics that in conjunction are sufficient to accelerate and amplify NAFLD pathogenesis in mice and humans.
Th17 cells comprise a heterogeneous population and can expand their proinflammatory cytokine repertoire to concomitantly produce IL-17A, IFNγ and TNFα (Gaublomme et al., 2015; Hu et al., 2017; Karmaus et al., 2019; Lee et al., 2012; Ramesh et al., 2014). Th17 cell plasticity plays a pivotal role in their pathogenic function (Gaublomme et al., 2015; Karmaus et al., 2019; Lee et al., 2012; Ramesh et al., 2014; Yang et al., 2009). Comparison of our dataset from obesogenic diet-driven hepatic Th17 cells with previously published gene expression data corroborates the inflammatory skewed phenotype of previously identified markers thought to promote Th17 cell pathogenicity (e.g., Cxcr3, Ccl5, Ifng, Tigit, Stat4). These uniquely expressed genes in ihTh17 cells were associated with multiple liver diseases including NAFLD, suggesting that skewed ihTh17 cell development may play a key pathogenic role in NAFLD progression. Further studies comparing peripheral blood and tissue resident Th17 cell surface markers and gene expression profiles may aid in the understanding and possibly prediction of NAFLD development and progression.
Th17 cell plasticity and function is microenvironment dependent (Gagliani et al., 2015; Guery and Hugues, 2015; Karmaus et al., 2019). We show that the hepatic microenvironment is a key driver of ihTh17 cell hepatic accrual. Microbial dysbiosis, a hallmark of obesity (Boulange et al., 2016; Saltzman et al., 2018; Turnbaugh et al., 2008), is known to shape Th17 cell polarization (Ivanov et al., 2008). Germ-free mice lack intestinal Th17 cells (Ivanov et al., 2009), and are protected from obesity (Backhed et al., 2007) and its sequelae (Boulange et al., 2016). We and others have demonstrated that the microbiome (Abu-Shanab and Quigley, 2010; Harley et al., 2014; Henao-Mejia et al., 2012) plays an important role in NAFLD pathogenesis. Specifically, systemic IL-17A-induced by segmented filamentous bacteria (SFB), amplified systemic inflammation, pathophysiologic consequences (Kriegel et al., 2011; Lee et al., 2011; Wu et al., 2010) and exacerbated NAFLD in obesity (Harley et al., 2014; Ivanov et al., 2009). It is possible that within our NAFLD models, the combination of diet-induced intestinal damage and dysbiosis may favor a more inflammatory Th17 cell phenotype. This is in line with a recent report demonstrating that colonization with pathogenic microflora promotes a high degree of plasticity, proinflammatory cytokine production and metabolic skewing towards aerobic glycolysis and oxidative phosphorylation in Th17 cells. In contrast, commensal microflora promotes Th17 cells that are limited in production of proinflammatory cytokine production and exhibit metabolic characteristics of quiescent or memory T cells (Omenetti et al., 2019). Thus, interrogation of the role of the obesity-associated microbiome shaping hepatic microenvironment and ihTh17 cell development, hepatic accrual and NAFLD pathogenesis warrants further investigation.
Our data show that adoptive transfer of ihTh17 cells exacerbated NAFLD pathogenesis and heightened macrophage infiltration and hepatocyte ballooning. Liver resident and recruited macrophages contribute to NAFLD pathogenesis (Seidman et al., 2020). Macrophages exacerbate NAFLD pathogenesis via activation of proinflammatory cascades (e.g., JNK1, TNFα, IL-6, IL-12), ROS production and activation of hepatic stellate cell-driven fibrosis (Wenfeng et al., 2014; Yi and Jeong, 2013). Thus, whether ihTh17 cells mediate recruitment/activation of resident and/or peripheral macrophages into the liver, an area of further investigation, would advance our understanding of the crosstalk among hepatic immune cells in NAFLD pathogenesis. Stimulation of liver resident macrophages with IL-17A promotes secretion of cytokines (e.g., IL-6, TGFβ, TNFα, IFNγ) (Meng et al., 2012) that favor proinflammatory macrophage polarization (Alisi et al., 2017; Grunhut et al., 2018). In addition to macrophages, the impact of ihTh17 cells on liver non-parenchymal cells (e.g., hepatic stellate cells) remains undefined. Hepatocyte ballooning is one of the main histological findings used to identify the presence of NASH and is associated with greater risk of disease progression in humans (Tiniakos et al., 2010). Lobular inflammation is strongly linked with hepatocyte ballooning in NASH (Richardson et al., 2007); however, the immunological mechanisms driving this phenomenon are underdefined. Traditional HFD-dependent NAFLD mouse models do not robustly induce hepatocyte ballooning (Anstee and Goldin, 2006; Denk et al., 2019). In our study, transfer of ihTh17 was sufficient to exacerbate hepatocyte ballooning and hepatocellular damage in HFD feeding models. Thus, interrogating the mechanism underlying ihTh17-driven hepatocyte ballooning would directly advance our understanding of important immunopathogenic aspects of NASH.
Th17 cell plasticity strongly contributes to their variable effector function, with pathogenic Th17 cell capacity to produce proinflammatory cytokines other than IL-17A and promote disease pathogenesis established as one of their hallmarks (Gaublomme et al., 2015; Karmaus et al., 2019; Lee et al., 2012; Ramesh et al., 2014; Yang et al., 2009). Our data suggest that IFNγ was in part required for ihTh17 cell capacity to promote hepatocellular damage. Surprising, lack of TNFα potentiated ihTh17 cell pathogenic potential. Indeed, TNFα-deficient CD4+ T cells produce more IFNγ (Fromm et al., 2015; Kruglov et al., 2020). In agreement with this report, our data showed that TNFγ deficient ihTh17 cells produced higher levels of IL-17A and IFNγ compared to WT ihTh17 cells. Interrogation of the simultaneous IFNγ and TNFα contribution would help dissect whether multiple production of these cytokines is essential for ihTh17 cell-dependent effects to NAFLD pathogenesis.
Activation of naïve T cells rapidly induces CXCR3 expression. CXCR3 is also expressed on pathogenic Th17, Th1, effector CD8+ T cells (Groom and Luster, 2011) and macrophages (Tomita et al., 2016). CXCR3 activation via CXCL9, CXCL10 and CXCL11 sensing promotes T cell migration to inflamed sites (Groom and Luster, 2011). Our data suggest that steatotic liver microenvironment, via the CXCR3-CXCL9/10 axis, contributes to the hepatic accrual of ihTh17 cells. CXCR3 expression by ihTh17 cells was pivotal for their hepatic pathogenic function in our NAFLD model. In agreement with our data, CXCR3-null and CXCL10-null mice are protected from methionine-choline deficient diet-induced steatohepatitis (Zhang et al., 2014), and they exhibit decreased hepatic accrual of CD4+IL-17A+ and CD4+IFNγ+ cells and macrophages. CXCL9 and CXCL10 were the most prominently expressed hepatic T cell chemokines in our mouse obesity model and preceded the accrual of ihTh17 cells. Indeed, CXCL10 expression was maintained after 12 weeks of obesogenic diet feeding, suggesting that CXCL10 may play a prominent role in the accrual of ihTh17 cells. However, the mechanism of CXCL9/CXCL10 induction and the cellular origin within the steatotic liver remain unknown. Accumulation of triglycerides in hepatocytes is believed to be a central driver of chemokine production (Tilg and Moschen, 2010). Thus, whether steatotic hepatocytes, or hepatic resident non-parenchymal cells (e.g., stellate cells, Kupffer cells, etc.), are the cellular source of CXCL9/10 remains to be determined.
Imprinted metabolic features enable rapid acquisition of immune cell effector functions (Gubser et al., 2013; van der Windt et al., 2013). Glycolysis impacts the transcriptome and the inflammatory vigor of T cells (Gubser et al., 2013; Moreno-Fernandez et al., 2018; Nguyen et al., 2016; van der Windt et al., 2013). ihTh17 cells exhibit a distinct metabolic profile that is biased towards glycolysis, and glycolysis further impacted ihTh17 cell cytokine production and their ability to exacerbate NAFLD. Metabolic control of cellular Th17 plasticity in NAFLD progression is unclear. Nonetheless, our data demonstrate that ihTh17 cells have a distinct metabolic profile compared to chTh17 cells. The increased glycolytic capacity of ihTh7 cells and the decreased proinflammatory cytokine production and pathogenic potential upon glycolysis inhibition suggest that metabolic alteration of ihTh 17 cell regulates their effector functions. This aligns with recently published studies on the role of glycolysis in regulation of inflammatory Th17 cell plasticity in the context of autoimmune and bacterial infections (Karmaus et al., 2019; Omenetti et al., 2019). In fact, increased ratios of GABA to formate in ihTh17 cells reinforces a role for glycolysis in determining the ihTh17 cell phenotype. Importantly, GABA drives IL-17A expression (Ren et al., 2016) and activates mTORC1 (Ren et al., 2016) which favors aerobic glycolysis (Finlay, 2012). Of note, mTOR signaling is a central regulator of Th17-cell pathogenicity fate decisions through coordination of metabolic and transcriptional programs, in part by regulating Hif1α expression (Karmaus et al., 2019; Zeng and Chi, 2017). An increase in Hif1 a pathway genes, observed in the ihTh17 cells, suggests an interplay between GABA and mTOR/Hif1α signaling in the maintenance of effector ihT 17 cell activity. In rapidly proliferating cells, the primary source of cytosolic one-carbon units is mitochondrial formate (Ducker and Rabinowitz, 2017). Decreased formate levels in ihTh17 cells invokes the possibility that mitochondrial one-carbon metabolism may be enhanced in this cell population. The correlation between elevated GABA synthesis and utilization of free GTP in ihTh17 cells also suggests a correlation between GABA-dependent mTOR activation and the activation of downstream glycolysis and mitochondrial metabolism. In fact, the increase in intracellular aspartate and subsequent decrease in alanine and glutamine insinuates that the metabolic shift within ihTh17 cells promotes anabolic growth and biomass accumulation that leads to the downstream engagement of aerobic glycolysis.
Carbon metabolism from glucose via glycolysis and the TCA cycle is tightly linked to de novo lipogenesis (DNL). Carbons derived from glycolysis are detected in the fatty acid palmitate isolated from in vitro differentiated Th17 cells (Berod et al., 2014). Thus, DNL might be an important contributor to Th17 polarization. In fact, Acetyl-coenzyme A carboxylase 1 (ACC1), an enzyme crucial for DNL, regulates IL-17A production by human and mouse T cells (Berod et al., 2014; Endo et al., 2015). Increased ACC1 expression in splenic Th17 cells from obese mice is linked to pathogenic Th17 cell polarization. However, the functional impact of ACC1 in tissue accruing Th17 cells remains undefined. Given the importance of DNL and glycolysis in shaping Th17 cell polarization and function, it is conceivable that both of these metabolic pathways may conjunctively maintain pathogenic potential of liver Th17 cells. Our data shows that in vivo 2-DG treatment decreased hepatic CXCL9 and CXCL10 expression, T cell inflammatory potential and attenuated hepatocellular damage. In contrast, hepatic CXCL9 and CXCL10 expression was not altered in mice that received ihTh17 cells exogenously treated with 2-DG. Combined, these data suggest that inhibition of glycolysis may directly regulate inflammatory mediators in multiple cell types, including immune cells and liver parenchymal cells.
The flux through glycolysis is regulated by a series of enzymes including the rate limiting enzyme PKM2 (Israelsen et al., 2013). PKM2 plays an important role in T cell inflammatory vigor via both its glycolytic and transcriptional regulatory functions. In a model of hyperhomocysteinemia-induce atherosclerosis, pharmacological inhibition or silencing of PKM2 reduced IFNγ and IL-17A production by CD4+ T cells and ameliorated disease severity (Lu et al., 2018). In EAE, T cell-specific PKM2 deletion impaired Th17 cell differentiation and ameliorated disease severity (Kono et al., 2019). In addition, treatment of T cells with TEPP-46, an allosteric activator that induces PKM2 tetramerization and blocks its nuclear translocation and prevents induction of glycolysis, inhibited Th1 and Th17 cells polarization an ameliorated EAE severity (Angiari et al., 2020). In contrast, modulation of PKM activity by TEPP-46 affected Th17 cell differentiation but promoted T cell GM-CSF production which affected EAE outcomes (Seki et al., 2020). Our data show for the first time that PKM2 deletion in T cells was sufficient to reverse ihTh17-centric inflammatory vigor and NAFLD severity. All together, these data suggest that simultaneous manipulation of metabolic pathways including glycolysis (PKM2) and DNL (ACC1) may represent amenable targets to reduce inflammation and subsequently NAFLD pathogenesis. Of note, previous studies targeting DNL via ACC1 or DGAT2 manipulation or glycolysis via acetyl-shikonin significantly improved liver inflammation, steatosis, hepatocellular ballooning and fibrosis (Amin et al., 2019; Goedeke et al., 2018; Su et al., 2016).
The conservation of cellular processes, uncovered in animal models, within human hepatic ihTh17 cells and the extension to human disease, remains ill-defined. Increased systemic and hepatic IL-17A and CXCR3/CXCL10 expression is robustly observed in individuals with NASH (Gomes et al., 2016). Our data demonstrate that obese individuals with NASH exhibit increased systemic and hepatic activation of the CXCR3 axis and IFNγ and TNFα expression, supporting the hypothesis that the CXCR3 axis may likewise contribute to ihTh17 accrual in humans. Although the presence of CD4+IL-17A+ (Th17) cells by immunohistochemical and flow cytometric analysis in the liver of obese individuals with NASH (Gomes et al., 2016; Rau et al., 2016) has been demonstrated, deep characterization of this cell subset was lacking. We show for the first time that NAFLD is directly associated with hepatic accrual of a specific subset of Th17 cells, ihTh17 cells, that display a pathogenic phenotype expressing CXCR3 and producing multiple proinflammatory cytokines. Hepatic presence of these cells correlated with histological NAS score and circulating markers of hepatocellular damage, ALT and AST. The ability of Th17 cells to co-produce multiple inflammatory cytokines correlates with severity of other human inflammatory diseases (Ramesh et al., 2014; Wang et al., 2011; Yang et al., 2009). Together, these data suggest that ihTh17 proinflammatory potential may play an important role in human NAFLD pathogenesis. Thus, characterization of Th17 cells in peripheral blood, and molecules associated with their emergence, could lead to discovery of biomarkers for the identification of disease progression. Additionally, increased expression of glycolytic enzymes in individuals with NAFLD suggest that these enzymes, either in liver parenchymal or immune cells, may contribute to NAFLD pathogenesis. PKM2 is highly expressed by immune cells, in whole liver tissue of subjects with HCC (Lv et al., 2018; Palsson-McDermott et al., 2017) and was highly upregulated in obese individuals with NAFLD within our cohort. New evidence suggests that PKM2 can also interact directly with transcription factors (e.g., Hif1α) (Zhao et al., 2019) and impact cellular metabolism and transcription. Thus, future investigations focused on the role of PKM2 in modulation of ihTh17 cells function in NAFLD are warranted.
In conclusion, our results demonstrate an existence of a distinct pathogenic subset of hepatic Th17 cells, here termed inflammatory hepatic Th17 cells (ihTh17). Our findings show that ihTh17 cells represent an important component of the complex pathogenesis of NAFLD. Thus, better insights into the cellular and molecular mechanisms underlying the development of ihTh17 cells, CXCR3 pathway activation, metabolic changes and/or IL-17A axis-driven NAFLD progression, and how these cells interact with both immune and parenchymal and non-parenchymal liver cells in obese individuals may hold potential for the development of novel, widely effective therapies for NAFLD.
Limitations of Study
Our new insights into hepatic ihTh17 cell heterogeneity and function provide the opportunity to deeply characterize liver Th17 cells in NALFD pathogenesis. However, our study did not investigate the source and the mechanisms underlying ihTh17 cell temporal emergence and maintenance. Notably, obesity-associated microbiome plays a role in NAFLD pathogenesis and microbiome regulates Th17 responses (Omenetti et al., 2019). Thus, the role of the obesity- associated microbiome in shaping liver microenvironment and ihTh17 cell hepatic accrual in NAFLD warrants further investigation. In this report we also did not investigate whether PKM2 modifies ihTh17 inflammatory vigor via metabolic or transcriptional activity. Further, how these distinct modes of PKM activity impact NAFLD pathogenesis and whether pharmacologic targeting of PKM2-specific activities or DNL holds therapeutic promise in NAFLD should be studied. Notably, PKM2 therapeutic modulation has provided promising outcomes in models of EAE and atherosclerosis (Angiari et al., 2020; Kono et al., 2019; Lu et al., 2018). Lastly, our study did not exploit deep characterization of human hepatic Th17 cells. Future investigations in this area will be critical to pinpoint ihTh17 molecular signatures directly relevant to NAFLD progression in humans.
STAR*METHODS
RESOURCE AVAILABILITY
Lead contact
Further information and requests for resources and reagents should be directed to and will be fulfilled by the Lead Contact, Senad Divanovic (Senad.Divanovic@cchmc.org).
Materials availability
This study did not generate new unique reagents.
Data and code availability
The raw data of RNA-seq used in this study were deposited in GEO under GSE138763, the raw ATAC-seq data in this study were deposited in the NCBI BioProject repository under accession number PRJNA573520 (http://www.ncbi.nlm.nih.gov/bioproject/573520). The accession number for the bulk RNA-seq from the study used in this paper is GSE80976. All other data supporting the findings of this study are available from the lead contact author upon request.
EXPERIMENTAL MODELS AND SUBJECT DETAILS
Mice
All male and female mice used were on a C57BL/6 background. WT, IL-17A-GFP, CXCR3−/−, TNF alpha−/−, IFN-gamma−/−, PKM2fl/fldLck-Cre+ and PKM2fl/fldLck-Cre” litter mate controls mice were bred at Cincinnati Children’s Hospital Medical Center (CCHMC) in a specific-pathogen- free (spf) facility with free access to food and water. Rag-2−/− and AKR mice were obtained from The Jackson Laboratories acclimated to CCHMC animal facility for 1 week before dietary studies were initiated. All animals were housed in the Cincinnati Children’s Research Foundation animal facility. Animal care will be administered under the direction of Dr. Sai Tummala, DVM, MS, MBA, Director of Veterinary Services. Veterinary care was provided and ensured by Laboratory Animal Veterinarians. A qualified team of Veterinary Technicians provided animal care, quality assurance and husbandry to the animals in their stewardship. Animals are housed at 22°C or 30°C (the latter for thermoneutrality studies), with free access to food and water, and 10 hrs dark, 14 hrs light cycle is automatically maintained. Animal health status checks were conducted daily by trained veterinary personnel. For all studies, food and water were replaced weekly. Body weight and food consumption were quantified weekly. All the procedures were reviewed and approved by CCHMC Animal Care and Use Committee and are in compliance with NIH regulations, as outlined in DHHS publication Guide for the Care and Use of Laboratory Animals, the Animal Welfare Act (H12336, 12/7/85) and other relevant Federal and local laws.
Human Samples
Participants with severe obesity were recruited and informed consent obtained from the Cincinnati Children’s Hospital Medical Center (CCHMC) Pediatric Diabetes and Obesity Center. Patients with alcohol abuse, viral and autoimmune hepatitis, immunosuppressive or steroid use were excluded. Liver core biopsies were obtained at time of bariatric surgery per standard clinical protocols, sectioned and stained using hematoxylin and eosin and Masson trichrome stains, and subsequently scored using the pediatric NASH-CRN scoring system by a single, liver pathologist experienced in application of this scoring system (Kleiner et al., 2005). The NAFLD activity score (NAS) is a sum of scores for steatosis, lobular inflammation and ballooning. Fibrosis was separately staged. Individuals were segregated into obese with non-metabolic disease (NAFLD or T2D; Obese Controls), and obese with NAFLD, inclusive of patients with non-alcoholic fatty liver (NAFL) and patients with non-alcoholic steatohepatitis (NASH), based on the well-established clinical parameters of hepatocellular disease (Obese Controls, n = 15; Obese with NAFLD = 15). In addition, clinical characteristics including serum triglyceride and aminotransferase levels (ALT, AST) levels were obtained. Clinical characteristics used for patient categorization is provided in Extended Data Table S4. Recruitment and study protocols were approved by the institutional review board at CCHMC.
Dietary modulation
High Fat Diet (HFD):
Mice (8 weeks old) were fed either regular chow (fat 13.5% kcal, carbohydrate 59% kcal, protein 27.5% kcal; LAB Diet #5010) or a high-fat diet (HFD; 60% of kcal from fat, carbohydrate 20% kcal, protein 20% kcal; Research Diets #D12492) as previously described (Giles et al., 2017; Harley et al., 2014).
NASH Diet:
WT C57BL/6 mice (8 weeks old) were fed either a regular chow or a NASH diet (high fat 40% kcal fat, high fructose 20% kcal fructose and high cholesterol diet, 2% kcal cholesterol) as previously described (Boland et al., 2019; Drescher et al., 2019; Kawashita et al., 2019)
Western Diet (WD):
WT C57BL/6 mice (8 weeks old) were fed either a regular chow diet and normal tap water or a Western diet-WD (21.1% fat, 41% Sucrose, and 1.25% Cholesterol by weight-Teklad diets, TD. 120528) plus and a high sugar solution (23.1 g/L d-fructose (Sigma- Aldrich, F0127) and 18.9 g/L d-glucose (Sigma-Aldrich, G8270) as previously described (Tsuchida et al., 2018).
WD + Carbon tetrachloride (CCl4):
WT C57BL/6 mice (8 weeks old) were fed either a regular chow diet and normal tap water or a WD (21.1% fat, 41% Sucrose, and 1.25% Cholesterol by weight (Teklad diets, TD. 120528) and a high sugar solution (23.1 g/L d-fructose and 18.9 g/L d- glucose. CCl4 (Sigma-Aldrich, 289116–100ML), and injected with the dose of 0.2 μl (0.32μg)/g of body weight, of CCl4 alone or its control vehicle (corn oil) intra-peritoneally once per week, starting simultaneously with the diet administration as previously described (Tsuchida et al., 2018).
Methionine-choline deficient (MCD) diet:
WT C57BL/6 mice (8 weeks old) were fed either a regular chow or a methionine and choline deficient diet (MCD; Research Diets #A02082002B; 16% Protein, 63% Carbohydrate and 21% Fat kcal/ gram) as previously described (Giles et al., 2016; Itagaki et al., 2013).
Neutralization of IL-17A
Mice fed a HFD for 12 weeks, were treated intraperitoneally (i.p.) once a week for 3 weeks, with 250 μg/mouse of rat anti-mouse IL-17A mAb (clone M210, Amgen) or IgG2a (clone GL117). Serum ALT levels were quantified at week 15 of HFD feeding.
Neutralization of CXCR3 and CXCL9/CXCL10
Mice fed HFD for 18 weeks or WD for 10 weeks, were treated intraperitoneally (i.p.) every other day for 2 weeks, with 100 μ/mouse of anti-mouse CXCR3 mAb (clone CXCR3–173, BioXCell) or anti-mouse CXCL9 (clone MIG-2F5.5, BioXCell) and anti-mouse CXCL10 (clone 134013, Invitrogen) mAb. Serum ALT levels were quantified at week 20 of HFD or at 12 weeks of WD feeding
Inhibition of glycolysis in vivo using 2-Deoxy-D-glucose (2-DG)
Mice fed HFD for 18 weeks, were treated intraperitoneally (i.p.) every other day for 1 week, with 1 g/kg/mouse of 2-Deoxy-D-glucose (2-DG). Serum ALT levels were quantified after 1 week of treatment.
METHOD DETAILS
Murine hepatic function and phenotyping
Hepatic triglycerides were quantified using Triglyceride Reagent and Triglyceride Standards (Pointe Scientific) as previously described (Giles et al., 2016; Giles et al., 2017; Harley et al., 2014; Moreno-Fernandez et al., 2018; Mukherjee et al., 2018). Serum alanine transaminase (ALT) levels were quantified using ALT Reagent and Catatrol I and II (Catachem). For histology, liver tissue was fixed in 10% buffered formalin, and stained with H&E. NAFLD activity score (NAS) was determined from H&E staining by a certified pathologist according to standard practice (Brunt et al., 2011; Giles et al., 2016; Giles et al., 2017; Harley et al., 2014; Moreno- Fernandez et al., 2018).
Hepatic immune cell infiltration isolation
Hepatic infiltrating immune cells were isolated using Miltenyi biotech Gentlemax technology followed by Percoll gradient. Briefly, whole liver was homogenized using Miltenyi Genltemax C tubes using RPMI + 10 % fetal bovine serum (FBS). After homogenization cells were centrifuged at 2000 rpm for 10 minutes. Cell pellets were homogenized in a 33% Percoll solution (Sigma-Aldrich) diluted in RPMI medium 1640 (Gibco). Following gradient separation, and lysing of red blood cells, hepatic infiltrating immune cells were subsequently analyzed by flow cytometry (Giles et al., 2017; Harley et al., 2014; Moreno-Fernandez et al., 2018).
Adipose tissue immune cell isolation
Adipose infiltrating immune cells were isolated using enzymatic digestion. Briefly, fat pads were dissected and cut into small pieces. Tissue was digested using Liberase TM (21ug/ml, Roche) and DNase I (8.8 ug/ml, Roche) in DMEM containing hepes and 2% BSA. Tissue was incubated at 37oC for 30 min at 220 RPM. After digestion cells were filtered through a 100uM strainer and centrifuged at 800g for 5 minutes. Followed by red blood cells lysis. Single cell suspension was subsequently analyzed by flow cytometry (Giles et al., 2017; Harley et al., 2014; Moreno- Fernandez et al., 2018).
Quantification of cytokine levels
For quantification of liver cytokine levels, liver homogenates were used. TGF-β1 (Invitrogen, 888350–22), IL-23 (BioLegend 433704), IL-1β (R&D Systems, DY401–05) and IL-6 (BD-Bioscience 555240) ELISA kits were utilized according to the manufacturer’s instruction.
Flow cytometry
To determine immune cell population single cell suspensions derived from hepatic and adipose tissues, isolated immune cells were labeled with monoclonal antibodies. For cytokine production, total single cells were stimulated for 4 hours with Phorbol 12-myristate 13-acetate (PMA; 50 ng/ml) (Sigma-Aldrich, St. Louis, MO) and Ionomycin (1 μg/ml) (EMD Millipore), in presence of Brefeldin A (10 μg/mL) (GoldBio). Subsequently, data were collected using an LSR Fortessa (BD) and analyzed using FlowJo X software (vX10). Briefly, for Th17 cells characterization mouse cells were stained with Live/Dead stain (Zombie UV Dye: Biolegend) and with directly-conjugated monoclonal antibodies to CD45-PE-Dazzle594 (Biolegend, 104), CD3-AF700 (Biolegend, 17A2), TCRγδ-FITC (Miltenyi, GL3), CD4-APC-ef780 (e-Biosciences, GK1.5), CXCR3-PE or APC (Miltenyi, CXCR3–173), then fixed, permeabilized and stain for the cytokines IL-17A-PerCpCy5.5 or PE (e-Biosciences, 17B7), IFNγ-PE-Cy7 (e-Biosciences, XMG1.2) and TNFα-BV650 (Biolegend, MP6-XT22). For macrophages infiltration mouse cells were stained with Live/Dead stain (Zombie UV Dye: Biolegend) and with directly-conjugated monoclonal antibodies to CD45-PE-Dazzle594 (Biolegend, 104), CD11b-eF450 (Biolegend, 17A2), F4/80-APC (eBiosciences, BM8). Human cells were stained with Live/Dead stain (Zombie UV Dye: Biolegend), CD45-AF700 (Biolegend, 2D1), CD3-APCef780 (e-Biosciences, OKT3), CD8-BV510 (Biolegend, RPA-T8), CD4-BV650 (Biolegend, RPA-T4), CXCR3-PE- Dazzle594 (Biolegend, G025H7) then fixed, permeabilized and stained for the cytokines IL-17A- PerCp-Cy5.5 (e-Biosciences, eBio64DEC17), IFNy-PECy7 (e-Biosciences, 4S.B3) and TNFα- AF488 (Biolegend, MAb11).
In vitro ihTh17 and chTh17 cell polarization
Naïve CD4+ T cells from either WT, IFNγ−/− and TNFα−/− mice were isolated from the spleen by negative selection using magnetic beads per manufacture instruction (Miltenyi). 3×10⁵ cells were cultured with anti-CD3/CD28 (1 μg /ml and 0.5 μg/ml, respectively), in DMEM supplemented with FBS, non-essential amino-acids (CellGro) and vitamins (Gibco). Polarization of naïve CD4+ T cell to chTh17 or ihTh17 cells was achieved via supplementation of culture media [DMEM (Gibco) + 10% FBS (VWR, Seradigm Life Science) + 1% glutamine (Gibco)] with polarizing cytokines for 6 days at 37°C and 5% CO2. chTh17 skewing was induced by supplementation of TGF-β1 (1 ng/ml), IL-6 (10 ng/ml) and ihTh17 skewing was induced by supplementation TGF-β3 (10 ng/ml), IL-6 (10 ng/ml) IL-23 (20 ng/ml) and IL-1β (1 ng/ml) (Gaublomme et al., 2015; Lee et al., 2012; Ramesh et al., 2014). All antibodies and cytokines were from eBiosciences. Media containing polarizing cytokines was replaced 3 days after initial polarization. Cells were used at day 6 after polarization. For some experiments, ihTh17 cells from WT mice were treated with 2- DG (2 mM) (Abcam) or Shikonin (10uM) (Sigma) 3 days after differentiation until day 6 of culture.
Adoptive transfer of chTh17 and ihTh17 cells
CD4+ T cells from C57BL/6-IL-17A-GFP obese mice were isolated from the liver based on their CXCR3 expression via cell sorting or naive CD4+ T cells were cultured under chTh17 and ihTh17 polarizing condition. For the latter, after 6 days of differentiation IL-17A expressing cells were sorted using GFP expression. 5×10⁵ sorted chTh17, ihTh17 or ihTh17+2-DG cells were transferred into obese male mice (fed HFD diet for 16 weeks) and followed for three weeks after transfer.
In vitro culture of primary hepatocytes with chTh17 and ihTh17 cells
Primary hepatocytes were isolated from C57BL/6 WT mice. Hepatocytes (1×10⁵) were seeded in 48 well plate in William’s Media (Gibco). After overnight culture, cells were cocultured with either chTh17 or ihTh17 cells (1×10⁵) for 24 hours in DMEM (Gibco) + 10% FBS (VWR, Seradigm Life Science) at 37°C and 5% CO2. ALT levels were measured in culture supernatants.
Fluorescence glucose (2-NBDG) uptake assay
For in vivo studies, obese mice were i.p. injected 2-NBDG (200 μg/mouse) (Molecular probes), after 20 minutes single cell suspensions were isolated from the liver and stained with Live/Dead stain (Zombie UV Dye: Biolegend) and with directly-conjugated monoclonal antibodies to CD45- PE-Dazzle594 (Biolegend, 104), CD3-AF700 (Biolegend, 17A2), CD4-APC-ef780 (e- Biosciences, GK1.5) and CXCR3-PE (Miltenyi, CXCR3–173) and analyzed by flow cytometry. For in vitro studies, 2-NBDG (100 μM/well) was added to the polarized ihTh17 and chTh17 cells in culture media, after 10 minutes at 37°C cells were washed, stained with Live/Dead stain and directly conjugated monoclonal antibodies and analyzed by flow cytometry.
Quantification of cellular bioenergetics
chTh17 and ihTh17 were plated in 96-well XF cell culture microplates XF Assay (Agilent Technologies). Cells were incubated for 1 hour at 37 °C without CO2. Oxygen consumption rates (OCR) were measured under basal conditions and following the injection of either oligomycin (2 μM), an inhibitor of oxidative phosphorylation, the uncoupler flurocarbonyl cynade phenylhydrazon (FCCP; 2 μM), and Rotenone (10 μM) (Glycolysis Stress Test Kit from Agilent Technologies). Basal respiration was determined by OCR prior to supplementation with any additional compounds. Extracellular acidification rate (ECAR) was measured under basal conditions and following the injection of Glucose (1mM), oligomycin (2 μM), and the glycolytic inhibitor 2-DG (2 mM) (Cell Mito Stress Test Kit from Agilent Technologies). All measurements were taken using a Seahorse 96FX Extracellular Flux Analyzer (Agilent Technologies).
NMR-Based Metabolomics Analysis
Cell and supernatants were separated by centrifuged at 800g and 4 °C for 5 minutes then snap frozen using liquid nitrogen and store liquid nitrogen tank until processing. On the day of data collection, samples were thawed on ice and centrifuged at 4000 × g and 4 °C for 5 minutes. The 500 μL supernatant of media samples were aliquoted onto pre-washed 3 kDa spin filters (NANOSEP 3K) (Pall Life Sciences), and centrifuged at 10000 × g for 90 minutes at 4 °C. The 400 μL of plasma filtrate was mixed with 550 μL of NMR buffer containing 100 mM phosphate buffer in D2O, pH 7.3, which included 1.0 mM TMSP (3-Trimethylsilyl 2,2,3,3-d4 propionate). The experiments were conducted using 550 μL media samples in 103.5 mm × 3 mm NMR tubes (Bruker). One-dimensional 1H NMR spectra were acquired on a Bruker Avance II 600 MHz spectrometer using Prodigy BBO cryoprobe. All data were collected at 298 K with the noesygppr1d pulse sequence in the Bruker pulse sequence library based on the previously described parameters (Matrka et al., 2017). Metabolites found in cell extract were assigned based on 1D 1H and 2D NMR experiments and reference spectra found in databases, such as the Human Metabolome Database (HMDB) (Wishart et al., 2007), and Chenomx® NMR Suite profiling software (Chenomx Inc. version 8.1). The concentrations of 32 media metabolites were calculated using Chenomx based on the internal standard, TMSP. These metabolite concentrations were then assessed by principal components analysis (PCA) using MetaboAnalyst (Xia et al., 2015). The media metabolite concentrations were normalized by sum and scaled by mean centering to correct for the potential dilution during the sample preparation, as well as differences in the number of cells per sample.
Single cell RNA-seq and bulk RNA sequencing and gene expression quantification
Single cell RNA-sequencing of FACS sorted hepatic Th17 cells (TCRβ+CD4+IL-17AGFP+) was performed as previously described with other immune cells (Emig et al., 2010; Harley et al., 2018; Olsson et al., 2016). Single cells were separated into 6 C1 capture chips and RNA sequencing was performed at an average depth of 3 million paired-end reads (75 nt) using the Illumina HiSeq 2500, with SMART-Seq2 version 2 chemistry as recommended by the manufacturer. An unsupervised analysis of distinct Th17 single-cell populations was done using the software Iterative Clustering and Guide-gene Selection (ICGS) in AltAnalyze version 2.1.1 (http://altanalyze.org) (Olsson et al., 2016), following gene-level quantification with the software RSEM. ICGS was selected as it previously was demonstrated to have excellent sensitivity to discover rare populations of functionally distinct cell populations (Emig et al., 2010; Lu et al., 2014; Salomonis et al., 2010). One contaminant cell populations was observed from ICGS (B- cells), which were excluded prior to repeating the analysis. To compare hepatic Th17 cells from obese and healthy mice, the program cellHarmony was used to project healthy Th17 C1 profiles onto the obese mice using the default software options (DePasquale et al., 2019). Bulk RNA- seq analysis was performed from total RNA following quantification (Qubit RNA assay kit) and library preparation (Illumina TrueSeq RNA preparation kit) by running 50 base pair single-end reads (~20 million reads per sample). Bulk RNA-seq analysis was determined by running 50 base pair single-end reads (~20 million reads per sample). All analysis was performed in Cufflinks 1.3.0, Tophat 1.4.0, and GeneSpring 7.0. Single-end 50bp reads were aligned to the mouse genome (mm9) in TopHat v1.4.0. Following alignment, transcripts were quantified following the protocol described (Trapnell et al., 2012). Functional enrichments of differentially expressed genes were assessed through ToppGene, with a p-value cutoff of 0.05 and FDR to correct for multiple testing.
ChIP-seq enrichment analysis
To identify transcription factors (TFs) and epigenetic marks that might be regulating genes expressed in ihTh17 compared to chTh17 cells, we used the RELI algorithm (Harley et al., 2018) to overlap the genomic coordinates of the promoters of ihTh17-specific genes with a large library of functional genomics datasets. We created the library by compiling 510 mouse ChIP- seq and DNase-seq datasets from a variety of sources, including modENCODE (Muers, 2011), PAZAR (Portales-Casamar et al., 2009), and the UCSC Genome Browser (Rosenbloom et al., 2015). As input, RELI takes a set of genomic regions of interest (e.g, promoters of genes whose expression changes upon stimulation), and systematically overlaps them with each ChIP-seq/DNase-seq dataset. The observed overlap of the input set with each dataset is calculated by counting the number of input regions this dataset overlaps (where overlap is defined as sharing at least one base). Next, a P-value describing the significance of this overlap is estimated using a simulation-based procedure. Specifically, a distribution of expected overlap values is created from 2,000 iterations of randomly choosing RefSeq gene promoters with the same length as the input set (e.g., if 50 promoters of length 2000 bp are used as input, then 50 randomly chosen promoters of length 2000 bp will be used in each simulation). The distribution of the expected overlap values from the randomized data resembles a normal distribution and is used to generate a Z-score and P-value estimating the significance of the observed number of input regions that overlap each dataset. The resulting data thus provide ranked lists of datasets (TFs, histone marks, or open chromatin), based on experimentally- determined data located in the promoters of each gene set. We applied this procedure to the ihTh17-specific gene list using three different promoter definitions: (−1000,+500), (−1000,+1000), and (−2000,+1), relative to the transcription start site. Results were virtually identical regardless of promoter length (data not shown).
Gene set enrichment analysis (GSEA)
GSEA analysis was performed using the Broad Institute Software (Mootha et al., 2003; Subramanian et al., 2005). GSEA analysis was used to assess significant enrichment of biological pathways or signatures in ihTh17 cells in relative to that reported in pathogenic Th17 cells from CNS and EAE models. GSEA determines whether an a prior defined ‘set’ of genes (such as a signature) show significant cumulative changes in gene expression between phenotypic subgroups. In brief, all genes are ranked on the basis of their differential expression in one group versus their expression in another group. Next, a running enrichment score (RES) is calculated for a given gene set on the basis of how often its members appear at the top or bottom of the ranked differential list. 1000 random permutations of the phenotypic subgroups are used to establish a null distribution of RES against which a normalized running enrichment score (NES) and false-discovery-rate-corrected q values are calculated using Kolmogorov- Smirnov statistic. GSEA was run with a focused group of gene signatures encoding products related pathogenic Th17 cells present in the central nervous system of mice with EAE (Gaublomme et al., 2015). These gene signatures (Extended Data Table 1) were selected to test the hypothesis that obesity drives hepatic accumulation of a unique population of inflammatory hepatic Th17 cells.
ATAC-seq library preparation
ATAC-seq library preparations were performed as previously described (Buenrostro et al., 2013), with minor modifications. Briefly, 50000 cells were washed once in PBS before incubation for 10 minutes in lysis buffer (10 mM Tris pH 7.5, 10 mM NaCl, 3 mM MgCl2, 0.1% NP-40). After lysis, cells were resuspended in 50 μl 1x TD Buffer containing 2.5 μl Nextera enzyme (Illumina). Transposition reactions were incubated for 30 minutes at 37°C before purification with QiaQuick MinElute columns (Qiagen). Purified DNA was amplified by PCR using Kapa Hi-Fi real-time library amplification kit (Kapa) with 10–12 cycles, according to the manufacturer’s instructions with barcoded primers, as described previously (Buenrostro et al., 2013). Amplified libraries were purified with QiaQuick MinElute columns (Qiagen) and quantitated with Kapa real-time library quantification kit (Kapa). Paired-end sequencing was performed with an Illumina HiSeq 2500 (Illumina).
ATAC-seq peak calling
The transposase adapters were trimmed with Trim-Galore (version 0.6.2) using the parameters --paired --nextera --length 30 --stringency 3 -- three_prime_clip_R1 1 --three_prime_clip_R2 1. Sequencing reads were mapped to mouse genome (mm10) using bowtie (version 2.3.4.2) (Langmead et al., 2009), with default parameters. The resulting bam files were processed with picard MarkDuplicates to remove duplicate reads and subsequently filtered to remove reads mapping to the mitochondrial genome. For peak calling, all positive-strand reads were shifted 4 bp downstream and all negative-strand reads were shifted 5 bp upstream to center the reads on the transposon binding event (Buenrostro et al., 2013). Shifted, concordantly aligned paired mates were used for peak calling by MACS2 (v2.1.1.20160309) at a P value of 0.01 (Zhang et al., 2008). The peaks overlapping the blacklisted regions from the ENCODE project(Hoffman et al., 2013) and peaks on the Y chromosome were excluded. Irreproducible discovery rate (IDR) calculations using scripts provided by the ENCODE project (https://www.encodeproiect.org/software/idr/; v2.0.2 and v2.0.3) were performed on all pairs of replicates keeping only reproducible peaks showing an IDR value of 0.05 or less.
Differentially accessible chromatin regions
Differentially accessible chromatin regions were determined using Diffbind (version 2.6.6.4) (Ross-Innes et al., 2012) based on an fdr adjusted p-value of less than 1×10⁻³ and an estimated fold-change of > 2. Intersections, subtractions and merging of the predicted peaks were made with BedTools. Proportional Venn diagrams were generated with VennMaster (Kestler et al., 2008). Genomic annotations for peaks and motif enrichment were computed with HOMER (version 4.10) (Heinz et al., 2010), and the identification of peaks near genes was compared using GREAT (version 3.0.0) (http://great.stanford.edu/public/html/) (McLean et al., 2010), using default parameters.
Pathway analysis
BED files of peak regions were used as input for pathway analysis by GREAT (version 3.0.0) (McLean et al., 2010). All analyses used default settings with the whole genome as background, considering analyses from the MSigDB Canonical Pathway databases. Only pathway terms with a minimum of 25 genes were considered and used for multiple-hypothesis correction. Enriched pathways were filtered for those that showed Padj<0.05 for both binomial and hypergeometric P values as calculated by GREAT and for those that had more than 10 or 20 gene hits.
Correlation between accessibility and transcription
The distribution of RNA-seq log2 fold changes for genes within 25kb was compared using an empirical distribution function and a two-sample Kolmogorov-Smirnov test computed in R (Conover, 1972).
Chromatin accessibility heatmaps and gene tracks
Genome coverage files (bedgraph files) for visualization were generated by makeUCSCfile.pl (HOMER) and then converted into tdf files using igvtools with ‘toTDF’ option. For peak-centered heatmaps, average sample counts normalized using size factors calculated by DESeq2 (Love et al., 2014) were plotted in 40-bp bins across a 2-kb window.
Motif analysis
De novo motif discovery was performed on the 100 bp vicinity of the peak summits using findMotifsGenome.pl with options ‘-len “10,12,14,16”’ and ‘-size 200’ on the repeat-masked mouse genome (mm10) from HOMER.
Quantitative Reverse-Transcription Polymerase Chain Reaction (qRT-PCR)
Tissue samples were homogenized in TRIzol, RNA was extracted, reverse transcribed to complementary DNA (cDNA), and subjected to qPCR analysis (Light Cycler 480 II; Roche) as previously described (Giles et al., 2016; Harley et al., 2014). The primer sequences, all from Life Technologies and are listed in Tables S1 and S2.
Human Systemic Cytokine Quantification
Human plasma cytokines and chemokines concentrations from obese and NAFLD patients were determined by ELISA using Milliplex™ Multiplex kits (Millipore) according to manufacturer’s protocol. Briefly, 25 μl of plasma, plated in duplicate on a 96 well black plate, was incubated with 25 μl of antibody coated beads. Plates were subsequently washed and 25 μl of secondary antibody was then added, followed by 25 μl of strept-avidin-RPE. Plates were washed and then read using luminex technology on a Milliplex Analyzer (milliporeSigma). Data analysis was performed by the CCHMC Research Flow Cytometry Core.
QUANTIFICATION AND STATISTICAL ANALYSIS
Data Representation and Statistical Analysis
For statistical analysis, a normal distribution was generally assumed, and parametric tests were employed. Student’s f-test (mouse) or Mann Whitney t-test (human) were used when the comparison was between two groups, while a one-way ANOVA was employed for three or more groups, with Tukey’s post hoc test to assess differences between specific groups. Statistical analysis was completed using Prism 7 (GraphPad Software, Inc.). All values are represented as means ± standard error mean (SEM). No power analysis was performed to determine the sample size. The sample size in each study was based on experience with previous studies employing dietary challenges in mice. No animals were excluded from the analyses and none of the studies were blinded.
Supplementary Material
Research Highlights.
Obesity promotes accrual of a unique inflammatory hepatic Th17 (ihTh17) cell subset
ihTh17 cells are sufficient to exacerbate NAFLD progression
The activation of CXCR3 axis in steatotic liver promotes ihTh17 cell accrual
Glycolysis-associated PKM2 activity shapes the ihTh17 inflammatory potential
ACKNOWLEDGMENTS
This work was supported in part by NIH R01DK099222 and American Diabetes Association (ADA) 1–18-IBS-100 (to S.D.); CCHMC Pediatric Diabetes and Obesity Center (to S.D., M.H., and T.H.I.); Department of Defense (DoD) W81XWH2010392 (to S.D. and M.A.H.); R01DK099222–02S1 (associated with S.D., and M.E.M.F, and J.R.O); American Heart Association (AHA) 17POST33650045 and ADA 1–19-PMF-019 (to M.E.M.F); CCRF Endowed Scholar Award (to M.T.W.); NIH T32AI118697 (associated with D.A.G. and C.C.C); University of Cincinnati Provost Graduate Fellowship (to J.R.O) and PHS Grant P30 DK078392 Pathology of the Digestive Disease Research Core Center at CCHMC (associated with S.D). We thank S. Waggoner for providing CXCR3 deficient mice, C. Pasare for providing TNFα deficient mice and M. Jordan for providing IFNγ deficient mice.
Footnotes
COMPETING FINANCIAL INTERESTS
S.D. is a consultant for Janssen Research & Development.
Publisher's Disclaimer: This is a PDF file of an unedited manuscript that has been accepted for publication. As a service to our customers we are providing this early version of the manuscript. The manuscript will undergo copyediting, typesetting, and review of the resulting proof before it is published in its final form. Please note that during the production process errors may be discovered which could affect the content, and all legal disclaimers that apply to the journal pertain.
REFERENCES
- Abu-Shanab A, and Quigley EM (2010). The role of the gut microbiota in nonalcoholic fatty liver disease. Nature reviews Gastroenterology & hepatology 7, 691–701. [DOI] [PubMed] [Google Scholar]
- Alisi A, Carpino G, Oliveira FL, Panera N, Nobili V, and Gaudio E (2017). The Role of Tissue Macrophage-Mediated Inflammation on NAFLD Pathogenesis and Its Clinical Implications. Mediators Inflamm 2017, 8162421. [DOI] [PMC free article] [PubMed] [Google Scholar]
- Amin NB, Carvajal-Gonzalez S, Purkal J, Zhu T, Crowley C, Perez S, Chidsey K, Kim AM, and Goodwin B (2019). Targeting diacylglycerol acyltransferase 2 for the treatment of nonalcoholic steatohepatitis. Sci Transl Med 11. [DOI] [PubMed] [Google Scholar]
- Angiari S, Runtsch MC, Sutton CE, Palsson-McDermott EM, Kelly B, Rana N, Kane H, Papadopoulou G, Pearce EL, Mills KHG, et al. (2020). Pharmacological Activation of Pyruvate Kinase M2 Inhibits CD4(+) T Cell Pathogenicity and Suppresses Autoimmunity. Cell Metab 31, 391–405 e398. [DOI] [PMC free article] [PubMed] [Google Scholar]
- Anstee QM, and Goldin RD (2006). Mouse models in non-alcoholic fatty liver disease and steatohepatitis research. Int J Exp Pathol 87, 1–16. [DOI] [PMC free article] [PubMed] [Google Scholar]
- Backhed F, Manchester JK, Semenkovich CF, and Gordon JI (2007). Mechanisms underlying the resistance to diet-induced obesity in germ-free mice. Proceedings of the National Academy of Sciences of the United States of America 104, 979–984. [DOI] [PMC free article] [PubMed] [Google Scholar]
- Bahram Namjou TL, Huang Yongbo, Parameswaran Sreeja, Cobb Beth L., Stanaway Ian B., Connolly John J., Mentch Frank D., Benoit Barbara, Niu Xinnan, Carroll Wei-Qi Wei Robert J., Pacheco Jennifer A., Harley Isaac T.W., Divanovic Senad, Carrell David S., Larson Eric B., Carey David J., Verma Shefali, Ritchie Marylyn D., Gharavi Ali G., Murphy Shawn, Williams Marc S., Crosslin David R., Jarvik Gail P., Kullo Iftikhar J., Hakonarson Hakon, Li Rongling, (2019). The eMERGE Network, Stavra A. Xanthakos, John B. Harley. GWAS and enrichment analyses of Non-alcoholic fatty liver disease identify new trait-associated genes and pathways across eMERGE network. BMC Medicine In Press. [DOI] [PMC free article] [PubMed] [Google Scholar]
- Berod L, Friedrich C, Nandan A, Freitag J, Hagemann S, Harmrolfs K, Sandouk A, Hesse C, Castro CN, Bahre H, et al. (2014). De novo fatty acid synthesis controls the fate between regulatory T and T helper 17 cells. Nature medicine 20, 1327–1333. [DOI] [PubMed] [Google Scholar]
- Bertola A, Ciucci T, Rousseau D, Bourlier V, Duffaut C, Bonnafous S, Blin-Wakkach C, Anty R, Iannelli A, Gugenheim J, et al. (2012). Identification of adipose tissue dendritic cells correlated with obesity-associated insulin-resistance and inducing Th17 responses in mice and patients. Diabetes 61, 2238–2247. [DOI] [PMC free article] [PubMed] [Google Scholar]
- Bhattacharjee J, Kumar JM, Arindkar S, Das B, Pramod U, Juyal RC, Majumdar SS, and Nagarajan P (2014). Role of immunodeficient animal models in the development of fructose induced NAFLD. The Journal of nutritional biochemistry 25, 219–226. [DOI] [PubMed] [Google Scholar]
- Boland ML, Oro D, Tolbol KS, Thrane ST, Nielsen JC, Cohen TS, Tabor DE, Fernandes F, Tovchigrechko A, Veidal SS, et al. (2019). Towards a standard diet-induced and biopsy-confirmed mouse model of non-alcoholic steatohepatitis: Impact of dietary fat source. World journal of gastroenterology : WJG 25, 4904–4920. [DOI] [PMC free article] [PubMed] [Google Scholar]
- Boulange CL, Neves AL, Chilloux J, Nicholson JK, and Dumas ME (2016). Impact of the gut microbiota on inflammation, obesity, and metabolic disease. Genome Med 8, 42. [DOI] [PMC free article] [PubMed] [Google Scholar]
- Brunt EM, Kleiner DE, Wilson LA, Belt P, Neuschwander-Tetri BA, and Network NCR (2011). Nonalcoholic fatty liver disease (NAFLD) activity score and the histopathologic diagnosis in NAFLD: distinct clinicopathologic meanings. Hepatology 53, 810–820. [DOI] [PMC free article] [PubMed] [Google Scholar]
- Buenrostro JD, Giresi PG, Zaba LC, Chang HY, and Greenleaf WJ (2013). Transposition of native chromatin for fast and sensitive epigenomic profiling of open chromatin, DNA-binding proteins and nucleosome position. Nat Methods 10, 1213–1218. [DOI] [PMC free article] [PubMed] [Google Scholar]
- Chambers JC, Zhang W, Sehmi J, Li X, Wass MN, Van der Harst P, Holm H, Sanna S, Kavousi M, Baumeister SE, et al. (2011). Genome-wide association study identifies loci influencing concentrations of liver enzymes in plasma. Nat Genet 43, 1131–1138. [DOI] [PMC free article] [PubMed] [Google Scholar]
- Chisolm DA, and Weinmann AS (2018). Connections Between Metabolism and Epigenetics in Programming Cellular Differentiation. Annu Rev Immunol 36, 221–246. [DOI] [PubMed] [Google Scholar]
- Conover WJ (1972). Kolmogorov Goodness-of-Fit Test for Discontinuous Distributions. J Am Stat Assoc 67, 591–596. [Google Scholar]
- Coppieters KT, Amirian N, Pagni PP, Baca Jones C, Wiberg A, Lasch S, Hintermann E, Christen U, and von Herrath MG (2013). Functional redundancy of CXCR3/CXCL10 signaling in the recruitment of diabetogenic cytotoxic T lymphocytes to pancreatic islets in a virally induced autoimmune diabetes model. Diabetes 62, 2492–2499. [DOI] [PMC free article] [PubMed] [Google Scholar]
- de Heredia FP, Gomez-Martinez S, and Marcos A (2012). Obesity, inflammation and the immune system. Proc Nutr Soc 71, 332–338. [DOI] [PubMed] [Google Scholar]
- Denk H, Abuja PM, and Zatloukal K (2019). Animal models of NAFLD from the pathologist’s point of view. Biochim Biophys Acta Mol Basis Dis 1865, 929–942. [DOI] [PubMed] [Google Scholar]
- DePasquale EAK, Schnell D, Dexheimer P, Ferchen K, Hay S, Chetal K, Valiente- Alandi I, Blaxall BC, Grimes HL, and Salomonis N (2019). cellHarmony: cell-level matching and holistic comparison of single-cell transcriptomes. Nucleic Acids Res. [DOI] [PMC free article] [PubMed] [Google Scholar]
- Drescher HK, Weiskirchen R, Fulop A, Hopf C, de San Roman EG, Huesgen PF, de Bruin A, Bongiovanni L, Christ A, Tolba R, et al. (2019). The Influence of Different Fat Sources on Steatohepatitis and Fibrosis Development in the Western Diet Mouse Model of Nonalcoholic Steatohepatitis (NASH). Front Physiol 10, 770. [DOI] [PMC free article] [PubMed] [Google Scholar]
- Ducker GS, and Rabinowitz JD (2017). One-Carbon Metabolism in Health and Disease. Cell Metab 25, 27–42. [DOI] [PMC free article] [PubMed] [Google Scholar]
- Emig D, Salomonis N, Baumbach J, Lengauer T, Conklin BR, and Albrecht M (2010). AltAnalyze and DomainGraph: analyzing and visualizing exon expression data. Nucleic Acids Res 38, W755–762. [DOI] [PMC free article] [PubMed] [Google Scholar]
- Endo Y, Asou HK, Matsugae N, Hirahara K, Shinoda K, Tumes DJ, Tokuyama H, Yokote K, and Nakayama T (2015). Obesity Drives Th17 Cell Differentiation by Inducing the Lipid Metabolic Kinase, ACC1. Cell Rep 12, 1042–1055. [DOI] [PubMed] [Google Scholar]
- Finlay DK (2012). Regulation of glucose metabolism in T cells: new insight into the role of Phosphoinositide 3-kinases. Frontiers in immunology 3, 247. [DOI] [PMC free article] [PubMed] [Google Scholar]
- Finucane MM, Stevens GA, Cowan MJ, Danaei G, Lin JK, Paciorek CJ, Singh GM, Gutierrez HR, Lu Y, Bahalim AN, et al. (2011). National, regional, and global trends in body-mass index since 1980: systematic analysis of health examination surveys and epidemiological studies with 960 country-years and 91 million participants. The Lancet 377, 557–567. [DOI] [PMC free article] [PubMed] [Google Scholar]
- Fromm PD, Kling JC, Remke A, Bogdan C, and Korner H (2015). Fatal Leishmaniasis in the Absence of TNF Despite a Strong Th1 Response. Front Microbiol 6, 1520. [DOI] [PMC free article] [PubMed] [Google Scholar]
- Gagliani N, Vesely MCA, Iseppon A, Brockmann L, Xu H, Palm NW, de Zoete MR, Licona-Limon P, Paiva RS, Ching T, et al. (2015). TH17 cells transdifferentiate into regulatory T cells during resolution of inflammation. Nature 523, 221–U225. [DOI] [PMC free article] [PubMed] [Google Scholar]
- Gaublomme JT, Yosef N, Lee Y, Gertner RS, Yang LV, Wu C, Pandolfi PP, Mak T, Satija R, Shalek AK, et al. (2015). Single-Cell Genomics Unveils Critical Regulators of Th17 Cell Pathogenicity. Cell 163, 1400–1412. [DOI] [PMC free article] [PubMed] [Google Scholar]
- Giles DA, Moreno-Fernandez ME, Stankiewicz TE, Cappelletti M, Huppert SS, Iwakura Y, Dong C, Shanmukhappa SK, and Divanovic S (2016). Regulation of Inflammation by IL- 17A and IL-17F Modulates Non-Alcoholic Fatty Liver Disease Pathogenesis. PloS one 11, e0149783. [DOI] [PMC free article] [PubMed] [Google Scholar]
- Giles DA, Moreno-Fernandez ME, Stankiewicz TE, Graspeuntner S, Cappelletti M, Wu D, Mukherjee R, Chan CC, Lawson MJ, Klarquist J, et al. (2017). Thermoneutral housing exacerbates nonalcoholic fatty liver disease in mice and allows for sex-independent disease modeling. Nature medicine 23, 829–838. [DOI] [PMC free article] [PubMed] [Google Scholar]
- Goedeke L, Bates J, Vatner DF, Perry RJ, Wang T, Ramirez R, Li L, Ellis MW, Zhang D, Wong KE, et al. (2018). Acetyl-CoA Carboxylase Inhibition Reverses NAFLD and Hepatic Insulin Resistance but Promotes Hypertriglyceridemia in Rodents. Hepatology 68, 2197–2211. [DOI] [PMC free article] [PubMed] [Google Scholar]
- Gomes AL, Teijeiro A, Buren S, Tummala KS, Yilmaz M, Waisman A, Theurillat JP, Perna C, and Djouder N (2016). Metabolic Inflammation-Associated IL-17A Causes Nonalcoholic Steatohepatitis and Hepatocellular Carcinoma. Cancer cell 30, 161–175. [DOI] [PubMed] [Google Scholar]
- Groom JR, and Luster AD (2011). CXCR3 in T cell function. Exp Cell Res 317, 620–631. [DOI] [PMC free article] [PubMed] [Google Scholar]
- Grunhut J, Wang W, Aykut B, Gakhal I, Torres-Hernandez A, and Miller G (2018). Macrophages in Nonalcoholic Steatohepatitis: Friend or Foe? Eur Med J Hepatol 6, 100–109. [PMC free article] [PubMed] [Google Scholar]
- Gubser PM, Bantug GR, Razik L, Fischer M, Dimeloe S, Hoenger G, Durovic B, Jauch A, and Hess C (2013). Rapid effector function of memory CD8+ T cells requires an immediate-early glycolytic switch. Nature immunology 14, 1064–1072. [DOI] [PubMed] [Google Scholar]
- Guery L, and Hugues S (2015). Th17 Cell Plasticity and Functions in Cancer Immunity. Biomed Res Int 2015, 314620. [DOI] [PMC free article] [PubMed] [Google Scholar]
- Harley IT, Stankiewicz TE, Giles DA, Softic S, Flick LM, Cappelletti M, Sheridan R, Xanthakos SA, Steinbrecher KA, Sartor RB, et al. (2014). IL-17 signaling accelerates the progression of nonalcoholic fatty liver disease in mice. Hepatology 59, 1830–1839. [DOI] [PMC free article] [PubMed] [Google Scholar]
- Harley JB, Chen X, Pujato M, Miller D, Maddox A, Forney C, Magnusen AF, Lynch A, Chetal K, Yukawa M, et al. (2018). Transcription factors operate across disease loci, with EBNA2 implicated in autoimmunity. Nat Genet 50, 699–707. [DOI] [PMC free article] [PubMed] [Google Scholar]
- Heinz S, Benner C, Spann N, Bertolino E, Lin YC, Laslo P, Cheng JX, Murre C, Singh H, and Glass CK (2010). Simple combinations of lineage-determining transcription factors prime cis-regulatory elements required for macrophage and B cell identities. Mol Cell 38, 576–589. [DOI] [PMC free article] [PubMed] [Google Scholar]
- Henao-Mejia J, Elinav E, Jin C, Hao L, Mehal WZ, Strowig T, Thaiss CA, Kau AL, Eisenbarth SC, Jurczak MJ, et al. (2012). Inflammasome-mediated dysbiosis regulates progression of NAFLD and obesity. Nature 482, 179–185. [DOI] [PMC free article] [PubMed] [Google Scholar]
- Hoffman MM, Ernst J, Wilder SP, Kundaje A, Harris RS, Libbrecht M, Giardine B, Ellenbogen PM, Bilmes JA, Birney E, et al. (2013). Integrative annotation of chromatin elements from ENCODE data. Nucleic Acids Res 41, 827–841. [DOI] [PMC free article] [PubMed] [Google Scholar]
- Hu D, Notarbartolo S, Croonenborghs T, Patel B, Cialic R, Yang TH, Aschenbrenner D, Andersson KM, Gattorno M, Pham M, et al. (2017). Transcriptional signature of human pro-inflammatory TH17 cells identifies reduced IL10 gene expression in multiple sclerosis. Nat Commun 8, 1600. [DOI] [PMC free article] [PubMed] [Google Scholar]
- Israelsen WJ, Dayton TL, Davidson SM, Fiske BP, Hosios AM, Bellinger G, Li J, Yu Y, Sasaki M, Horner JW, et al. (2013). PKM2 isoform-specific deletion reveals a differential requirement for pyruvate kinase in tumor cells. Cell 155, 397–409. [DOI] [PMC free article] [PubMed] [Google Scholar]
- Itagaki H, Shimizu K, Morikawa S, Ogawa K, and Ezaki T (2013). Morphological and functional characterization of non-alcoholic fatty liver disease induced by a methionine-choline- deficient diet in C57BL/6 mice. Int J Clin Exp Pathol 6, 2683–2696. [PMC free article] [PubMed] [Google Scholar]
- Ivanov II, Atarashi K, Manel N, Brodie EL, Shima T, Karaoz U, Wei D, Goldfarb KC, Santee CA, Lynch SV, et al. (2009). Induction of intestinal Th17 cells by segmented filamentous bacteria. Cell 139, 485–498. [DOI] [PMC free article] [PubMed] [Google Scholar]
- Ivanov II, Frutos Rde L, Manel N, Yoshinaga K, Rifkin DB, Sartor RB, Finlay BB, and Littman DR (2008). Specific microbiota direct the differentiation of IL-17-producing T-helper cells in the mucosa of the small intestine. Cell Host Microbe 4, 337–349. [DOI] [PMC free article] [PubMed] [Google Scholar]
- Karmaus PWF, Chen X, Lim SA, Herrada AA, Nguyen TM, Xu B, Dhungana Y, Rankin S, Chen W, Rosencrance C, et al. (2019). Metabolic heterogeneity underlies reciprocal fates of TH17 cell sternness and plasticity. Nature 565, 101–105. [DOI] [PMC free article] [PubMed] [Google Scholar]
- Kawashita E, Ishihara K, Nomoto M, Taniguchi M, and Akiba S (2019). A comparative analysis of hepatic pathological phenotypes in C57BL/6J and C57BL/6N mouse strains in nonalcoholic steatohepatitis models. Sci Rep 9, 204. [DOI] [PMC free article] [PubMed] [Google Scholar]
- Kazankov K, Jorgensen SMD, Thomsen KL, Moller HJ, Vilstrup H, George J, Schuppan D, and Gronbaek H (2019). The role of macrophages in nonalcoholic fatty liver disease and nonalcoholic steatohepatitis. Nature reviews Gastroenterology & hepatology 16, 145–159. [DOI] [PubMed] [Google Scholar]
- Kestler HA, Muller A, Kraus JM, Buchholz M, Gress TM, Liu H, Kane DW, Zeeberg BR, and Weinstein JN (2008). VennMaster: area-proportional Euler diagrams for functional GO analysis of microarrays. BMC Bioinformatics 9, 67. [DOI] [PMC free article] [PubMed] [Google Scholar]
- Kleiner DE, Brunt EM, Van Natta M, Behling C, Contos MJ, Cummings OW, Ferrell LD, Liu YC, Torbenson MS, Unalp-Arida A, et al. (2005). Design and validation of a histological scoring system for nonalcoholic fatty liver disease. Hepatology 41, 1313–1321. [DOI] [PubMed] [Google Scholar]
- Kono M, Maeda K, Stocton-Gavanescu I, Pan W, Umeda M, Katsuyama E, Burbano C, Orite SYK, Vukelic M, Tsokos MG, et al. (2019). Pyruvate kinase M2 is requisite for Th1 and Th17 differentiation. JCI Insight 4. [DOI] [PMC free article] [PubMed] [Google Scholar]
- Kriegel MA, Sefik E, Hill JA, Wu HJ, Benoist C, and Mathis D (2011). Naturally transmitted segmented filamentous bacteria segregate with diabetes protection in nonobese diabetic mice. Proceedings of the National Academy of Sciences of the United States of America 108, 11548–11553. [DOI] [PMC free article] [PubMed] [Google Scholar]
- Kruglov A, Drutskaya M, Schlienz D, Gorshkova E, Kurz K, Morawietz L, and Nedospasov S (2020). Contrasting contributions of TNF from distinct cellular sources in arthritis. Ann Rheum Dis 79, 1453–1459. [DOI] [PMC free article] [PubMed] [Google Scholar]
- Langmead B, Trapnell C, Pop M, and Salzberg SL (2009). Ultrafast and memory-efficient alignment of short DNA sequences to the human genome. Genome Biol 10, R25. [DOI] [PMC free article] [PubMed] [Google Scholar]
- Lee Y, Awasthi A, Yosef N, Quintana FJ, Xiao S, Peters A, Wu C, Kleinewietfeld M, Kunder S, Hafler DA, et al. (2012). Induction and molecular signature of pathogenic TH17 cells. Nature immunology 13, 991–999. [DOI] [PMC free article] [PubMed] [Google Scholar]
- Lee YK, Menezes JS, Umesaki Y, and Mazmanian SK (2011). Proinflammatory T-cell responses to gut microbiota promote experimental autoimmune encephalomyelitis. Proceedings of the National Academy of Sciences of the United States of America 108 Suppl 1, 4615–4622. [DOI] [PMC free article] [PubMed] [Google Scholar]
- Liu X, Huh JY, Gong H, Chamberland JP, Brinkoetter MT, Hamnvik OP, and Mantzoros CS (2015). Lack of mature lymphocytes results in obese but metabolically healthy mice when fed a high-fat diet. International journal of obesity 39, 1548–1557. [DOI] [PMC free article] [PubMed] [Google Scholar]
- Love MI, Huber W, and Anders S (2014). Moderated estimation of fold change and dispersion for RNA-seq data with DESeq2. Genome Biol 15, 550. [DOI] [PMC free article] [PubMed] [Google Scholar]
- Lu S, Deng J, Liu H, Liu B, Yang J, Miao Y, Li J, Wang N, Jiang C, Xu Q, et al. (2018). PKM2-dependent metabolic reprogramming in CD4(+) T cells is crucial for hyperhomocysteinemia-accelerated atherosclerosis. J Mol Med (Berl) 96, 585–600. [DOI] [PubMed] [Google Scholar]
- Lu Y, Loh YH, Li H, Cesana M, Ficarro SB, Parikh JR, Salomonis N, Toh CX, Andreadis ST, Luckey CJ, et al. (2014). Alternative splicing of MBD2 supports self-renewal in human pluripotent stem cells. Cell Stem Cell 15, 92–101. [DOI] [PMC free article] [PubMed] [Google Scholar]
- Lv WW, Liu D, Liu XC, Feng TN, Li L, Qian BY, and Li WX (2018). Effects of PKM2 on global metabolic changes and prognosis in hepatocellular carcinoma: from gene expression to drug discovery. BMC Cancer 18, 1150. [DOI] [PMC free article] [PubMed] [Google Scholar]
- Matrka MC, Watanabe M, Muraleedharan R, Lambert PF, Lane AN, Romick-Rosendale LE, and Wells SI (2017). Overexpression of the human DEK oncogene reprograms cellular metabolism and promotes glycolysis. PloS one 12, e0177952. [DOI] [PMC free article] [PubMed] [Google Scholar]
- McLean CY, Bristor D, Hiller M, Clarke SL, Schaar BT, Lowe CB, Wenger AM, and Bejerano G (2010). GREAT improves functional interpretation of cis-regulatory regions. Nat Biotechnol 28, 495–501. [DOI] [PMC free article] [PubMed] [Google Scholar]
- Meng F, Wang K, Aoyama T, Grivennikov SI, Paik Y, Scholten D, Cong M, Iwaisako K, Liu X, Zhang M, et al. (2012). Interleukin-17 signaling in inflammatory, Kupffer cells, and hepatic stellate cells exacerbates liver fibrosis in mice. Gastroenterology 143, 765–776 e761–763. [DOI] [PMC free article] [PubMed] [Google Scholar]
- Mootha VK, Lindgren CM, Eriksson KF, Subramanian A, Sihag S, Lehar J, Puigserver P, Carlsson E, Ridderstrale M, Laurila E, et al. (2003). PGC-1alpha-responsive genes involved in oxidative phosphorylation are coordinately downregulated in human diabetes. Nat Genet 34, 267–273. [DOI] [PubMed] [Google Scholar]
- Moreno-Fernandez ME, Giles DA, Stankiewicz TE, Sheridan R, Karns R, Cappelletti M, Lampe K, Mukherjee R, Sina C, Sallese A, et al. (2018). Peroxisomal beta-oxidation regulates whole body metabolism, inflammatory vigor, and pathogenesis of nonalcoholic fatty liver disease. JCI Insight 3. [DOI] [PMC free article] [PubMed] [Google Scholar]
- Muers M (2011). Functional genomics: the modENCODE guide to the genome. Nat Rev Genet 12, 80. [DOI] [PubMed] [Google Scholar]
- Mukherjee R, Moreno-Fernandez ME, Giles DA, Cappelletti M, Stankiewicz TE, Chan CC, and Divanovic S (2018). Nicotinamide adenine dinucleotide phosphate (reduced) oxidase 2 modulates inflammatory vigor during nonalcoholic fatty liver disease progression in mice. Hepatol Commun 2, 546–560. [DOI] [PMC free article] [PubMed] [Google Scholar]
- Nguyen HD, Chatterjee S, Haarberg KM, Wu Y, Bastian D, Heinrichs J, Fu J, Daenthanasanmak A, Schutt S, Shrestha S, et al. (2016). Metabolic reprogramming of alloantigen-activated T cells after hematopoietic cell transplantation. The Journal of clinical investigation 126, 1337–1352. [DOI] [PMC free article] [PubMed] [Google Scholar]
- Olsson A, Venkatasubramanian M, Chaudhri VK, Aronow BJ, Salomonis N, Singh H, and Grimes HL (2016). Single-cell analysis of mixed-lineage states leading to a binary cell fate choice. Nature 537, 698–702. [DOI] [PMC free article] [PubMed] [Google Scholar]
- Omenetti S, Bussi C, Metidji A, Iseppon A, Lee S, Tolaini M, Li Y, Kelly G, Chakravarty P, Shoaie S, et al. (2019). The Intestine Harbors Functionally Distinct Homeostatic Tissue-Resident and Inflammatory Th17 Cells. Immunity 51, 77–89 e76. [DOI] [PMC free article] [PubMed] [Google Scholar]
- Palsson-McDermott EM, Dyck L, Zaslona Z, Menon D, McGettrick AF, Mills KHG, and O’Neill LA (2017). Pyruvate Kinase M2 Is Required for the Expression of the Immune Checkpoint PD-L1 in Immune Cells and Tumors. Frontiers in immunology 8, 1300. [DOI] [PMC free article] [PubMed] [Google Scholar]
- Pandolfi JB, Ferraro AA, Sananez I, Gancedo MC, Baz P, Billordo LA, Fainboim L, and Arruvito L (2016). ATP-Induced Inflammation Drives Tissue-Resident Th17 Cells in Metabolically Unhealthy Obesity. Journal of immunology 196, 3287–3296. [DOI] [PubMed] [Google Scholar]
- Portales-Casamar E, Arenillas D, Lim J, Swanson MI, Jiang S, McCallum A, Kirov S, and Wasserman WW (2009). The PAZAR database of gene regulatory information coupled to the ORCA toolkit for the study of regulatory sequences. Nucleic Acids Res 37, D54–60. [DOI] [PMC free article] [PubMed] [Google Scholar]
- Ramachandran P, Dobie R, Wilson-Kanamori JR, Dora EF, Henderson BEP, Luu NT, Portman JR, Matchett KP, Brice M, Marwick JA, et al. (2019). Resolving the fibrotic niche of human liver cirrhosis at single-cell level. Nature 575, 512–518. [DOI] [PMC free article] [PubMed] [Google Scholar]
- Ramesh R, Kozhaya L, McKevitt K, Djuretic IM, Carlson TJ, Quintero MA, McCauley JL, Abreu MT, Unutmaz D, and Sundrud MS (2014). Pro-inflammatory human Th17 cells selectively express P-glycoprotein and are refractory to glucocorticoids. J Exp Med 211, 89–104. [DOI] [PMC free article] [PubMed] [Google Scholar]
- Rau M, Schilling AK, Meertens J, Hering I, Weiss J, Jurowich C, Kudlich T, Hermanns HM, Bantel H, Beyersdorf N, et al. (2016). Progression from Nonalcoholic Fatty Liver to Nonalcoholic Steatohepatitis Is Marked by a Higher Frequency of Th17 Cells in the Liver and an Increased Th17/Resting Regulatory T Cell Ratio in Peripheral Blood and in the Liver. Journal of immunology 196, 97–105. [DOI] [PubMed] [Google Scholar]
- Ren W, Yin J, Xiao H, Chen S, Liu G, Tan B, Li N, Peng Y, Li T, Zeng B, et al. (2016). Intestinal Microbiota-Derived GABA Mediates Interleukin-17 Expression during Enterotoxigenic Escherichia coli Infection. Frontiers in immunology 7, 685. [DOI] [PMC free article] [PubMed] [Google Scholar]
- Richardson MM, Jonsson JR, Powell EE, Brunt EM, Neuschwander-Tetri BA, Bhathal PS, Dixon JB, Weltman MD, Tilg H, Moschen AR, et al. (2007). Progressive fibrosis in nonalcoholic steatohepatitis: association with altered regeneration and a ductular reaction. Gastroenterology 133, 80–90. [DOI] [PubMed] [Google Scholar]
- Rosenbloom KR, Armstrong J, Barber GP, Casper J, Clawson H, Diekhans M, Dreszer TR, Fujita PA, Guruvadoo L, Haeussler M, et al. (2015). The UCSC Genome Browser database: 2015 update. Nucleic Acids Res 43, D670–681. [DOI] [PMC free article] [PubMed] [Google Scholar]
- Ross-Innes CS, Stark R, Teschendorff AE, Holmes KA, Ali HR, Dunning MJ, Brown GD, Gojis O, Ellis IO, Green AR, et al. (2012). Differential oestrogen receptor binding is associated with clinical outcome in breast cancer. Nature 481, 389–393. [DOI] [PMC free article] [PubMed] [Google Scholar]
- Salomonis N, Schlieve CR, Pereira L, Wahlquist C, Colas A, Zambon AC, Vranizan K, Spindler MJ, Pico AR, Cline MS, et al. (2010). Alternative splicing regulates mouse embryonic stem cell pluripotency and differentiation. Proceedings of the National Academy of Sciences of the United States of America 107, 10514–10519. [DOI] [PMC free article] [PubMed] [Google Scholar]
- Saltzman ET, Palacios T, Thomsen M, and Vitetta L (2018). Intestinal Microbiome Shifts, Dysbiosis, Inflammation, and Non-alcoholic Fatty Liver Disease. Front Microbiol 9, 61. [DOI] [PMC free article] [PubMed] [Google Scholar]
- Schenk S, Saberi M, and Olefsky JM (2008). Insulin sensitivity: modulation by nutrients and inflammation. The Journal of clinical investigation 118, 2992–3002. [DOI] [PMC free article] [PubMed] [Google Scholar]
- Seidman JS, Troutman TD, Sakai M, Gola A, Spann NJ, Bennett H, Bruni CM, Ouyang Z, Li RZ, Sun X, et al. (2020). Niche-Specific Reprogramming of Epigenetic Landscapes Drives Myeloid Cell Diversity in Nonalcoholic Steatohepatitis. Immunity 52, 10571074 e1057. [DOI] [PMC free article] [PubMed] [Google Scholar]
- Seki SM, Posyniak K, McCloud R, Rosen DA, Fernandez-Castaneda A, Beiter RM, Serbulea V, Nanziri SC, Hayes N, Spivey C, et al. (2020). Modulation of PKM activity affects the differentiation of TH17 cells. Sci Signal 13. [DOI] [PMC free article] [PubMed] [Google Scholar]
- Shi LZ, Wang R, Huang G, Vogel P, Neale G, Green DR, and Chi H (2011). HIF1alpha-dependent glycolytic pathway orchestrates a metabolic checkpoint for the differentiation of TH17 and Treg cells. J Exp Med 208, 1367–1376. [DOI] [PMC free article] [PubMed] [Google Scholar]
- Sierro F, Biben C, Martinez-Munoz L, Mellado M, Ransohoff RM, Li M, Woehl B, Leung H, Groom J, Batten M, et al. (2007). Disrupted cardiac development but normal hematopoiesis in mice deficient in the second CXCL12/SDF-1 receptor, CXCR7. Proceedings of the National Academy of Sciences of the United States of America 104, 14759–14764. [DOI] [PMC free article] [PubMed] [Google Scholar]
- Su ML, He Y, Li QS, and Zhu BH (2016). Efficacy of Acetylshikonin in Preventing Obesity and Hepatic Steatosis in db/db Mice. Molecules 21. [DOI] [PMC free article] [PubMed] [Google Scholar]
- Subramanian A, Tamayo P, Mootha VK, Mukherjee S, Ebert BL, Gillette MA, Paulovich A, Pomeroy SL, Golub TR, Lander ES, et al. (2005). Gene set enrichment analysis: a knowledge-based approach for interpreting genome-wide expression profiles. Proceedings of the National Academy of Sciences of the United States of America 102, 15545–15550. [DOI] [PMC free article] [PubMed] [Google Scholar]
- Sumarac-Dumanovic M, Stevanovic D, Ljubic A, Jorga J, Simic M, Stamenkovic-Pejkovic D, Starcevic V, Trajkovic V, and Micic D (2009). Increased activity of interleukin- 23/interleukin-17 proinflammatory axis in obese women. International journal of obesity 33, 151–156. [DOI] [PubMed] [Google Scholar]
- Sun GY, Jin H, Zhang CP, Meng H, Zhao XY, Wei D, Ou XJ, Wang QY, Li SX, Wang TQ, et al. (2018). OX40 Regulates Both Innate and Adaptive Immunity and Promotes Nonalcoholic Steatohepatitis. Cell Reports 25, 3786–+. [DOI] [PubMed] [Google Scholar]
- Tang Y, Bian Z, Zhao L, Liu Y, Liang S, Wang Q, Han X, Peng Y, Chen X, Shen L, et al. (2011). Interleukin-17 exacerbates hepatic steatosis and inflammation in non-alcoholic fatty liver disease. Clinical and experimental immunology 166, 281–290. [DOI] [PMC free article] [PubMed] [Google Scholar]
- Tilg H, and Moschen AR (2010). Evolution of inflammation in nonalcoholic fatty liver disease: the multiple parallel hits hypothesis. Hepatology 52, 1836–1846. [DOI] [PubMed] [Google Scholar]
- Tiniakos DG, Vos MB, and Brunt EM (2010). Nonalcoholic fatty liver disease: pathology and pathogenesis. Annual review of pathology 5, 145–171. [DOI] [PubMed] [Google Scholar]
- Tomita K, Freeman BL, Bronk SF, LeBrasseur NK, White TA, Hirsova P, and Ibrahim SH (2016). CXCL10-Mediates Macrophage, but not Other Innate Immune Cells-Associated Inflammation in Murine Nonalcoholic Steatohepatitis. Sci Rep 6, 28786. [DOI] [PMC free article] [PubMed] [Google Scholar]
- Trapnell C, Roberts A, Goff L, Pertea G, Kim D, Kelley DR, Pimentel H, Salzberg SL, Rinn JL, and Pachter L (2012). Differential gene and transcript expression analysis of RNA- seq experiments with TopHat and Cufflinks. Nature protocols 7, 562–578. [DOI] [PMC free article] [PubMed] [Google Scholar]
- Tsuchida T, Lee YA, Fujiwara N, Ybanez M, Allen B, Martins S, Fiel MI, Goossens N, Chou HI, Hoshida Y, et al. (2018). A simple diet- and chemical-induced murine NASH model with rapid progression of steatohepatitis, fibrosis and liver cancer. Journal of hepatology 69, 385–395. [DOI] [PMC free article] [PubMed] [Google Scholar]
- Turnbaugh PJ, Backhed F, Fulton L, and Gordon JI (2008). Diet-induced obesity is linked to marked but reversible alterations in the mouse distal gut microbiome. Cell Host Microbe 3, 213–223. [DOI] [PMC free article] [PubMed] [Google Scholar]
- van der Windt GJ, O’Sullivan D, Everts B, Huang SC, Buck MD, Curtis JD, Chang H, Smith AM, Ai T, Faubert B, et al. (2013). CD8 memory T cells have a bioenergetic advantage that underlies their rapid recall ability. Proceedings of the National Academy of Sciences of the United States of America 110, 14336–14341. [DOI] [PMC free article] [PubMed] [Google Scholar]
- Wang Z, Lee J, Zhang Y, Wang H, Liu X, Shang F, and Zheng Q (2011). Increased Th17 cells in coronary artery disease are associated with neutrophilic inflammation. Scand Cardiovasc J 45, 54–61. [DOI] [PubMed] [Google Scholar]
- Weisberg SP, McCann D, Desai M, Rosenbaum M, Leibel RL, and Ferrante AW Jr. (2003). Obesity is associated with macrophage accumulation in adipose tissue. The Journal of clinical investigation 112, 1796–1808. [DOI] [PMC free article] [PubMed] [Google Scholar]
- Weiskirchen R, and Tacke F (2014). Cellular and molecular functions of hepatic stellate cells in inflammatory responses and liver immunology. Hepatobiliary surgery and nutrition 3, 344–363. [DOI] [PMC free article] [PubMed] [Google Scholar]
- Wenfeng Z, Yakun W, Di M, Jianping G, Chuanxin W, and Chun H (2014). Kupffer cells: increasingly significant role in nonalcoholic fatty liver disease. Annals of hepatology 13, 489495. [PubMed] [Google Scholar]
- Winer S, Paltser G, Chan Y, Tsui H, Engleman E, Winer D, and Dosch HM (2009). Obesity predisposes to Th17 bias. European journal of immunology 39, 2629–2635. [DOI] [PubMed] [Google Scholar]
- Wishart DS, Tzur D, Knox C, Eisner R, Guo AC, Young N, Cheng D, Jewell K, Arndt D, Sawhney S, et al. (2007). HMDB: the Human Metabolome Database. Nucleic Acids Res 35, D521–526. [DOI] [PMC free article] [PubMed] [Google Scholar]
- Wu HJ, Ivanov II, Darce J, Hattori K, Shima T, Umesaki Y, Littman DR, Benoist C, and Mathis D (2010). Gut-residing segmented filamentous bacteria drive autoimmune arthritis via T helper 17 cells. Immunity 32, 815–827. [DOI] [PMC free article] [PubMed] [Google Scholar]
- Xia J, Sinelnikov IV, Han B, and Wishart DS (2015). MetaboAnalyst 3.0--making metabolomics more meaningful. Nucleic Acids Res 43, W251–257. [DOI] [PMC free article] [PubMed] [Google Scholar]
- Yang Y, Weiner J, Liu Y, Smith AJ, Huss DJ, Winger R, Peng H, Cravens PD, Racke MK, and Lovett-Racke AE (2009). T-bet is essential for encephalitogenicity of both Th1 and Th17 cells. J Exp Med 206, 1549–1564. [DOI] [PMC free article] [PubMed] [Google Scholar]
- Yi HS, and Jeong WI (2013). Interaction of hepatic stellate cells with diverse types of immune cells: foe or friend? Journal of gastroenterology and hepatology 28 Suppl 1, 99–104. [DOI] [PubMed] [Google Scholar]
- Zeng H, and Chi H (2017). mTOR signaling in the differentiation and function of regulatory and effector T cells. Curr Opin Immunol 46, 103–111. [DOI] [PMC free article] [PubMed] [Google Scholar]
- Zhang X, Shen J, Man K, Chu ES, Yau TO, Sung JC, Go MY, Deng J, Lu L, Wong VW, et al. (2014). CXCL10 plays a key role as an inflammatory mediator and a noninvasive biomarker of non-alcoholic steatohepatitis. Journal of hepatology 61, 1365–1375. [DOI] [PubMed] [Google Scholar]
- Zhang Y, Liu T, Meyer CA, Eeckhoute J, Johnson DS, Bernstein BE, Nusbaum C, Myers RM, Brown M, Li W, et al. (2008). Model-based analysis of ChIP-Seq (MACS). Genome Biol 9, R137. [DOI] [PMC free article] [PubMed] [Google Scholar]
- Zhao P, Han SN, Arumugam S, Yousaf MN, Qin Y, Jiang JX, Torok NJ, Chen Y, Mankash MS, Liu J, et al. (2019). Digoxin improves steatohepatitis with differential involvement of liver cell subsets in mice through inhibition of PKM2 transactivation. American journal of physiology Gastrointestinal and liver physiology. [DOI] [PMC free article] [PubMed] [Google Scholar]
- Zuniga LA, Shen WJ, Joyce-Shaikh B, Pyatnova EA, Richards AG, Thom C, Andrade SM, Cua DJ, Kraemer FB, and Butcher EC (2010). IL-17 regulates adipogenesis, glucose homeostasis, and obesity. Journal of immunology 185, 6947–6959. [DOI] [PMC free article] [PubMed] [Google Scholar]
Associated Data
This section collects any data citations, data availability statements, or supplementary materials included in this article.
Supplementary Materials
Data Availability Statement
The raw data of RNA-seq used in this study were deposited in GEO under GSE138763, the raw ATAC-seq data in this study were deposited in the NCBI BioProject repository under accession number PRJNA573520 (http://www.ncbi.nlm.nih.gov/bioproject/573520). The accession number for the bulk RNA-seq from the study used in this paper is GSE80976. All other data supporting the findings of this study are available from the lead contact author upon request.