Significance
Our findings identify a type of oncogene addiction process driven by a lipid that controls prosurvival effector protein secretion. The crosstalk between functionally redundant phosphatidylinositol (PI) 4-kinases maintains addiction and can be targeted with small molecule kinase inhibitors that might be applicable to a genetically defined subset of cancers for which there are no effective targeted therapies.
Keywords: cancer, oncogene addiction, Golgi, lipids
Abstract
A chromosome 1q21.3 region that is frequently amplified in diverse cancer types encodes phosphatidylinositol (PI)-4 kinase IIIβ (PI4KIIIβ), a key regulator of secretory vesicle biogenesis and trafficking. Chromosome 1q21.3–amplified lung adenocarcinoma (1q-LUAD) cells rely on PI4KIIIβ for Golgi-resident PI-4-phosphate (PI4P) synthesis, prosurvival effector protein secretion, and cell viability. Here, we show that 1q-LUAD cells subjected to prolonged PI4KIIIβ antagonist treatment acquire tolerance by activating an miR-218-5p–dependent competing endogenous RNA network that up-regulates PI4KIIα, which provides an alternative source of Golgi-resident PI4P that maintains prosurvival effector protein secretion and cell viability. These findings demonstrate an addiction to Golgi-resident PI4P synthesis in a genetically defined subset of cancers.
The term “oncogene addiction” was coined to describe cancer cells’ exquisite dependence on individual oncogenes to sustain the malignant phenotype (1, 2). Examples include the BCR-ABL oncogene produced by a chromosome 9:22 translocation in chronic myelogenous leukemia and the somatically mutated EGFR oncogene in lung adenocarcinoma (LUAD) (3–5). In both cancer types, the mutant kinases are bona fide oncogenes in vitro and in vivo (6, 7). Although patients treated with selective kinase inhibitors attain profound clinical responses (8), chronic exposure of patients to targeted therapeutics is followed by disease relapse owing to an almost universal reactivation of mutant kinase activity, demonstrating that most cancers retain an underlying addiction to oncogene-induced signaling pathways (2, 9). Elucidating the molecular underpinnings of oncogene reactivation may lead to improved therapeutic strategies.
Heightened secretion of protumorigenic effector proteins promotes metastasis and acquired resistance to targeted therapeutics (10, 11). The conventional secretory pathway directs the transport of secretory vesicles from the endoplasmic reticulum to the plasma membrane via the Golgi apparatus (12). Tensile forces exerted on Golgi membranes activate secretory vesicle biogenesis and are mediated by a Golgi phosphoprotein-3 (GOLPH3)/F-actin protein complex (13). GOLPH3 binds to phosphatidylinositol (PI)-4-phosphate (PI4P), which tethers GOLPH3 to Golgi membranes and is generated by the Golgi-resident PI-4 kinases PI4KIIα and PI4KIIIβ (10, 13, 14).
A chromosome 1q21.3 region that is frequently amplified in diverse cancer types encodes PI4KIIIβ (11, 15). Chromosome 1q21.3–amplified LUAD (1q-LUAD) cells undergo apoptosis following treatment with small-molecule PI4KIIIβ antagonists or depletion of PI4KIIIβ–dependent secreted proteins (11), establishing that PI4KIIIβ–dependent secreted proteins are prosurvival effectors in 1q-LUAD cells. On the basis of this conceptual framework, here, we postulated that chromosome 1q21.3 amplifications confer an addiction to Golgi-resident PI-4 kinase activity.
Results
1q-LUAD Cells Are Addicted to Golgi-Resident PI-4 Kinase Activity.
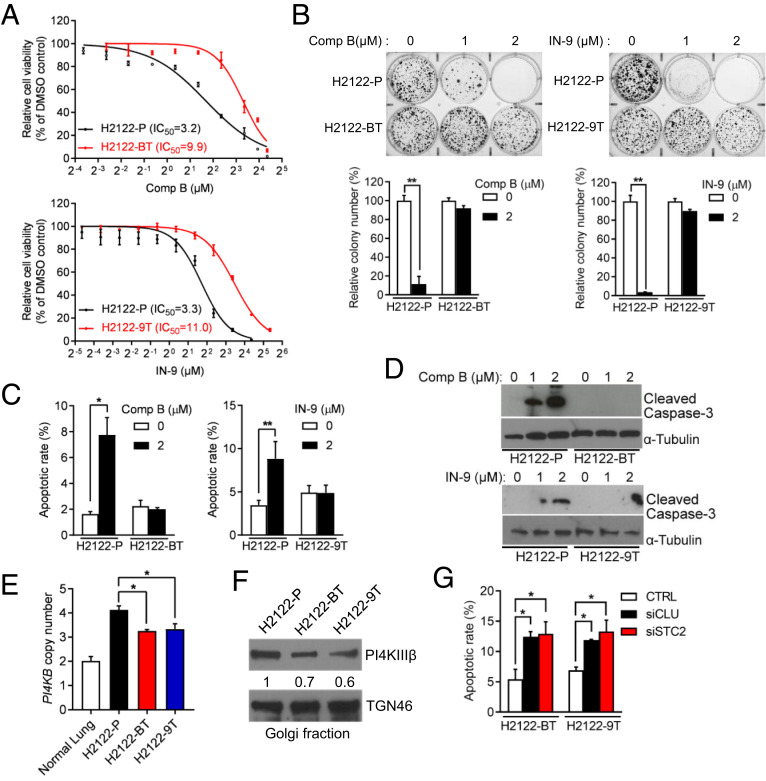
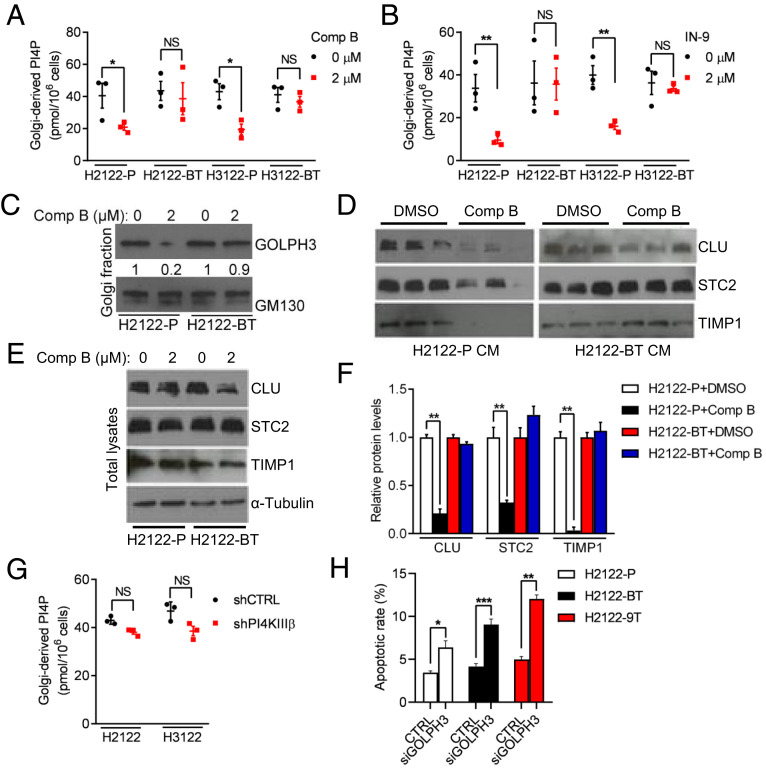
Using small molecules IN-9 or compound B, which inhibit PI4KIIIβ with >1,000-fold selectivity over related PI-3 kinase family members (11), we exposed 1q-LUAD cell lines H2122 and H3122 to escalating doses and found that, after 12 wk in culture, the cells demonstrated three- to fivefold reduced sensitivity to these compounds in proliferation, colony formation, and apoptosis assays (Fig. 1 A–D and SI Appendix, Fig. S1). PI4KB gene copy numbers and PI4KIIIβ protein levels were lower in drug-tolerant than parental 1q-LUAD cells (Fig. 1 E and F), suggesting reduced selection pressure on the 1q21.3 amplicon. However, small-interfering RNA (siRNA)-mediated depletion of the PI4KIIIβ–dependent secreted proteins clusterin (CLU) and stanniocalcin-2 (STC2) induced apoptosis of drug-tolerant cells (Fig. 1G), suggesting that drug-tolerant cells remained dependent on PI4P-driven effector protein secretion for survival. Golgi-resident PI4P levels, Golgi localization of the PI4P-binding protein GOLPH3, and the levels of PI4KIIIβ–dependent secreted proteins in conditioned medium (CM) samples decreased in parental but not drug-tolerant 1q-LUAD cells (Fig. 2 A–F and SI Appendix, Figs. S2 and S3), and Golgi-resident PI4P levels remained stable following short hairpin RNA (shRNA)-mediated PI4KIIIβ depletion in parental 1q-LUAD cells (Fig. 2G), supporting a reactivation of PI-4 kinase activity in PI4KIIIβ–deficient cells. Moreover, siRNA-mediated GOLPH3 depletion induced apoptosis to a similar extent in parental and drug-tolerant cells (Fig. 2H), suggesting that drug-tolerant cells remain dependent on GOLPH3-driven secreted proteins for survival.
Fig. 1.
Characterization of PI4KIIIβ antagonist-tolerant 1q-LUAD cells. (A) Proliferation assays on parental (P), compound B-tolerant (BT), and IN-9–tolerant (9T) H2122 cells. Cells were treated for 4 d with the indicated concentrations of compound B or IN-9. Half-maximal inhibitory (IC50) concentrations were determined. (B) Anchorage-independent colony formation assays on cell lines described in A. Values were normalized to DMSO controls. (C) Apoptosis quantified by Annexin V/Propidium iodide (PI) flow cytometry analysis on cells after treatment with compound B (Left) or IN-9 (Right). (D) WB analysis of cleaved caspase-3 in cells treated with indicated concentrations of compound B (Upper) or IN-9 (Lower). (E) Quantitative real-time PCR analysis of PI4KB gene copy numbers. (F) WB analysis of PI4KIIIβ in Golgi-enriched cellular fractions. TGN46 served as loading control. (G) Apoptosis quantified by Annexin V/PI flow cytometry analysis on H2122-BT cells and H2122-9T cells transfected with control (CTRL) or targeted siRNAs (siCLU or siSTC2). Data are shown as mean ± SEM of triplicate biological replicates. P values: two-sided t test in B and C and one-way ANOVA in E and G. *P < 0.05 and **P < 0.01.
Fig. 2.
Reactivation of Golgi-resident PI-4 kinase activity in drug-tolerant cells. (A and B) ELISA on PI4P levels in Golgi-enriched cellular fractions (dots) following treatment with vehicle (0 µM), compound B (A), or IN-9 (B). (C) WB analysis of GOLPH3 in Golgi-enriched cellular fractions. GM130 served as loading control. (D and E) WB analysis of secreted proteins (CLU, STC2, and TIMP1) in CM samples (D) and cell lysates (E), which was included as a control to show that reduced protein secretion did not result from decreased cytosolic levels. α-Tubulin served as loading control. (F) Protein levels were densitometrically quantified (graph) and normalized to DMSO controls. (G) PI4P levels determined by ELISA on Golgi-enriched cellular fractions from H2122 cells and H3122 cells stably transfected with indicated shRNAs. (H) Apoptosis quantified by Annexin V/PI flow cytometry analysis on H2122-BT cells and H2122-9T cells transfected with control (CTRL) or GOLPH3 siRNAs. Unless otherwise noted, data are shown as mean ± SEM of triplicate biological replicates. P values: one-way ANOVA in F and two-sided t test in all others. *P < 0.05, **P < 0.01, and ***P < 0.001. NS, not significant.
PI4KIIIβ Inhibition Activates an miR-218-5p–Dependent Competing Endogenous RNA Network to Up-Regulate PI4KIIα Expression.
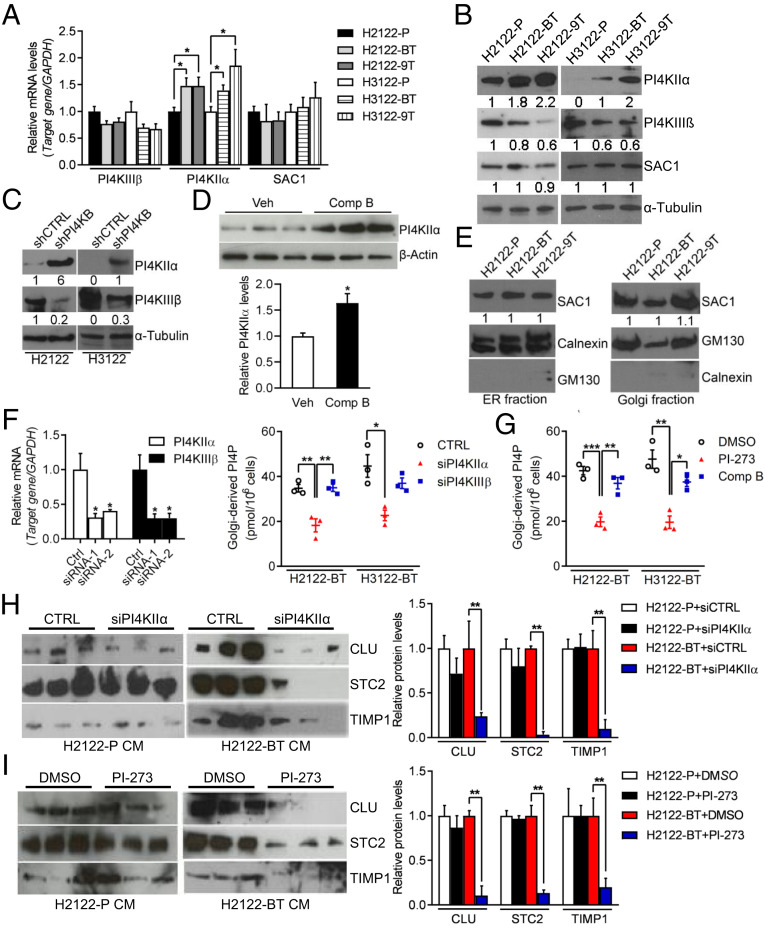
We sought to identify an alternative source of PI-4 kinase activity in drug-tolerant cells and reasoned that PI4KIIα, a Golgi-resident enzyme that is functionally redundant with PI4KIIIβ (16), might be a contributor. PI4KIIα mRNA and protein levels were higher in drug-tolerant than parental cells (Fig. 3 A and B), a pattern that was recapitulated in PI4KIIIβ shRNA-transfected parental cells (Fig. 3C) and compound B-treated H2122 orthotopic lung tumors (Fig. 3D), whereas the intracellular localization of PI4P phosphatase Sac1, which shuttles reversibly between endoplasmic reticulum (ER) and Golgi to create a PI4P gradient across the Golgi stack (17), did not differ in drug-tolerant and parental cells (Fig. 3E). PI4KIIα siRNA transfection or treatment with a selective PI4KIIα antagonist (PI-273) (18) reduced Golgi-resident PI4P levels and PI4KIIIβ–dependent secreted proteins in drug-tolerant but not parental cells (Fig. 3 F–I), whereas compound B did not inhibit Golgi-resident PI4P levels in drug-tolerant cells (Fig. 3G). Compound B treatment displaced GOLPH3 from the Golgi in control but not ectopic PI4KIIα–expressing H2122 cells (SI Appendix, Fig. S4), suggesting that the increase in PI4KIIα–derived PI4P synthesis in ectopic PI4KIIα–expressing cells uncoupled GOLPH3 function from PI4KIIIβ activity. Thus, PI4KIIα reactivated Golgi-resident PI4P synthesis in drug-tolerant cells.
Fig. 3.
PI4KIIIβ inhibition leads to heightened PI4KIIα levels. (A and B) qPCR (A) and WB (B) analysis of PI4KIIIβ, PI4KIIα, and SAC1 in parental and drug-tolerant H2122 cells and H3122 cells. α-Tubulin served as loading control. Values were normalized to parental cells. (C) WB analysis of PI4KIIIβ and PI4KIIα in H2122 cells and H3122 cells stably infected with lentiviruses expressing control (shCTRL) or PI4KIIIβ shRNAs. α-Tubulin served as loading control. Values were normalized to shCTRL. (D) WB analysis of PI4KIIα in orthotropic H2122 tumors from vehicle- and compound B–treated mice (n = 3 tumors per cohort). β-Actin served as loading control. Densitometric quantification of PI4KIIα protein levels (graphs). Values were normalized to vehicle controls. (E) WB analysis of SAC1 in Golgi or ER-enriched cellular fractions. GM130 and Calnexin served as loading control. (F) qPCR analysis of PI4KIIα and PI4KIIIβ mRNA levels in cells transfected with indicated siRNAs (bar graph). PI4P ELISA on Golgi-enriched fractions from siRNA-transfected cells (dot plot). (G) PI4P ELISA on Golgi-enriched fractions from cells treated for 48 h with 5 μM PI4KIIα antagonist (PI-273) or 2 μM compound B. (H and I) WB analysis of CM samples from H2122-P cells and H2122-BT cells transfected with PI4KIIα siRNAs (H) or treated with 5 μM PI-273 (I). Densitometric quantification of protein levels (graphs). Values were normalized to siRNA (H) or DMSO (I) controls (Right). Data are shown as mean ± SEM of triplicate biological replicates. P values: two-sided t test in D and one-way ANOVA in all others. *P < 0.05, **P < 0.01, and ***P < 0.001.
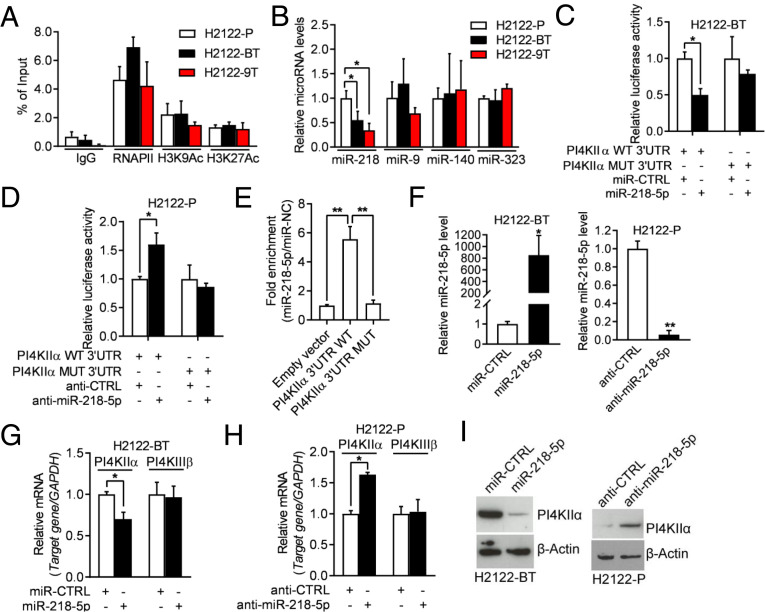
To assess the molecular basis for PI4KIIα up-regulation in drug-tolerant cells, we performed chromatin immunoprecipitation (ChIP) assays on the PI4K2A gene promoter and found no evidence for enhanced recruitment of RNA polymerase II or active histone marks (H3 lysine 9 or 27 acetylation) (Fig. 4A), arguing against transcriptional mechanisms. Examination of the PI4KIIα 3′-untranslated region (3′-UTR) identified predicted binding sites for multiple microRNAs, including miR-218-5p, miR-9-5p, miR-140-3p, and miR-323a-3p (SI Appendix, Table S1). Of these, only miR-218-5p was lower in drug-tolerant than parental H2122 cells (Fig. 4B), and RNA sequencing analysis of PI4KIIIβ–deficient and –replete H2122 cells showed that genes up-regulated by PI4KIIIβ depletion were significantly enriched in predicted miR-218-5p targets (http://www.mirbase.org/) (P = 0.00067), which led us to postulate that PI4KIIIβ inhibition activates a competing endogenous RNA (ceRNA) network that relieves PI4KIIα from miR-218-5p–dependent silencing.
Fig. 4.
miR-218-5p negatively regulates PI4KIIα expression. (A) ChIP was conducted to evaluate the enrichment of RNA polymerase II and active histone marks (H3K9Ac and H3K27Ac) on the PI4K2A gene promoter. (B) qPCR analysis of miRNAs. Values were normalized to H2122-P. (C) Luciferase activity in H2122-BT cells cotransfected with PI4KIIα 3′-UTR reporters and miRNA mimics. Values were normalized to control miRNA mimics (miR-CTRL). (D) Luciferase activity in H2122-P cells cotransfected with PI4KIIα 3′-UTR reporters and antagomirs. Values were normalized to control antagomir (anti-CTRL). (E) Quantification of miR-218-5p levels by AGO-CLIP assays on wild-type (WT) or mutant (MUT) PI4KIIα 3′UTRs in H2122 cells. Values were normalized to empty vector control. (F) qPCR analysis of miR-218-5p levels in H2122-BT cells transfected with miR-218-5p or miR-CTRL (left bar graph) and H2122-P cells transfected with miR-218-5p antagomir (anti–miR-218-5p) or anti-CTRL (right bar graph). (G and H) qPCR analysis of PI4KIIα mRNA levels in cells transfected with miR-218-5p mimics or antagomirs. A gene that lacks predicted miR-218-5p binding sites (PI4KIIIβ) was included as a negative control. Values were normalized to miR-CTRL or anti-CTRL. (I) WB analysis of PI4KIIα in cells described in G and H. β-Actin served as loading control. Data are shown as mean ± SEM of triplicate biological replicates. P values: one-way ANOVA in A, B, and E and two-sided t test in all others.*P < 0.05 and **P < 0.01.
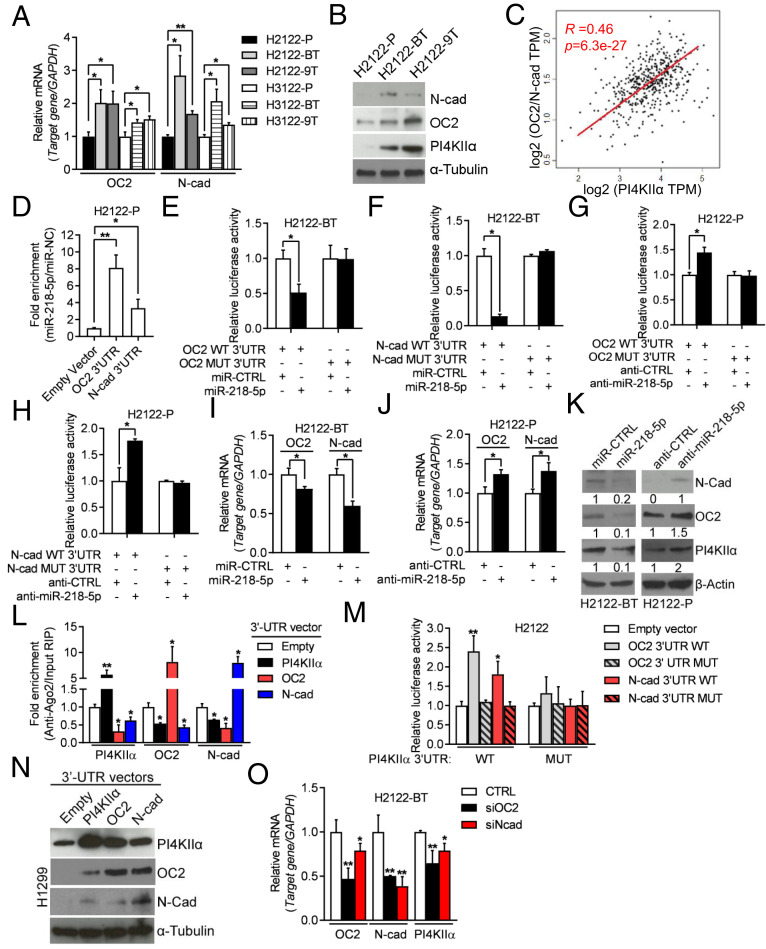
To test this hypothesis, we first assessed the functionality of the predicted miR-218-5p binding site in the PI4KIIα 3′-UTR. miR-218-5p mimics and antagomirs regulated the activities of wild-type, but not mutant, PI4KIIα 3′-UTR reporters (Fig. 4 C and D). miR-218-5p bound to wild-type, but not mutant, PI4KIIα 3′-UTRs in argonaute 2 (AGO2) cross-linking and immunoprecipitation (CLIP) assays (Fig. 4E). PI4KIIα levels were regulated in miR-218-5p gain- and loss-of-function assays (Fig. 4 F–I). Collectively, these findings confirmed a functional interaction between miR-218-5p and PI4KIIα. An evaluation of other predicted miR-218-5p targets showed that N-cadherin (N-cad) and Onecut-2 (OC2) were up-regulated in drug-tolerant 1q-LUAD cells (Fig. 5 A and B) and shPI4KIIIβ–transfected H2122 cells (SI Appendix, Fig. S5) and were correlated positively with PI4KIIα levels in The Cancer Genome Atlas (TCGA) LUAD cohort (Fig. 5C). N-cad and OC2 were validated to be miR-218-5p targets by AGO2/CLIP assays (Fig. 5D), 3′-UTR reporter assays (Fig. 5 E–H), and analysis of N-cad and OC2 levels in cells subjected to miR-218-5p gain- and loss-of-function studies (Fig. 5 I–K). OC2 and N-cad 3′-UTRs competed with PI4KIIα mRNAs for binding to AGO2 (Fig. 5L), and ectopic expression of OC2 or N-cad 3′-UTRs increased the activity of wild-type, but not mutant, PI4KIIα 3′-UTRs (Fig. 5M) and up-regulated PI4KIIα levels (Fig. 5N). Transfection of OC2 or N-cad siRNAs decreased PI4KIIα levels in drug-tolerant H2122 cells (Fig. 5O). Collectively, these findings suggest that N-cad and OC2 3′-UTRs function as miR-218-5p sponges and support the conclusion that PI4KIIα expression is up-regulated by a miR-218-5p–dependent ceRNA network.
Fig. 5.
PI4KIIIβ inhibition activates an miR-218-5p–dependent ceRNA network. (A) qPCR analysis of OC2 and N-cad mRNA levels. Values were normalized to parental cells. (B) WB analysis of OC2, N-cad, and PI4KIIα. α-Tubulin served as loading control. (C) Correlation between PI4KIIα (x-axis) and a two-gene signature (OC2 and N-cad) (y-axis) in TCGA LUAD cohort (dots). (R and P values, Pearson’s correlation). (D) AGO2-CLIP assays followed by qPCR analysis to assess miR-218-5p binding to OC2 and N-cad 3′-UTRs. Values were normalized to empty vector control. (E and F) Luciferase assays on H2122-BT cells cotransfected with OC2 (E) or N-cad (F) 3′-UTR reporters and miRNA mimics. Values were normalized to miR-CTRL. (G and H) Luciferase assays on H2122-P cells cotransfected with OC2 (G) or N-cad (H) 3′-UTR reporters and antagomirs. Values were normalized to anti-CTRL. (I and J) qPCR analysis of OC2 and N-cad mRNA levels in indicated cells transfected with indicated mimics or antagomirs. Values were normalized to miR-CTRL or anti-CTRL. (K) WB analysis of PI4KIIα, OC2, and N-cad in cells described in I and J. β-Actin served as loading control. (L) CLIP-qPCR analyses to quantify Ago2-bound PI4KIIα, OC2, and N-cad transcripts in H2122 cells transfected with indicated 3′-UTRs. (M) Luciferase assays on H2122 cells cotransfected with PI4KIIα WT or MUT 3′-UTR reporters and vectors that express OC2 and N-cad 3′-UTRs (WT or MUT) or empty vector. Values were normalized to empty vector control. (N) WB analysis of PI4KIIα, OC2, and N-cad in H1299 cells transfected with indicated 3′-UTRs. (O) qPCR analysis of PI4KIIα, OC2, and N-cad mRNA levels in siRNA-transfected H2122-BT cells. Values were normalized to siRNA control (CTRL). Data are shown as mean ± SEM of triplicate biological replicates. P values: one-way ANOVA in A, D, L, M, and O and two-sided t test in all others. *P < 0.05 and **P < 0.01.
TGF-β–Dependent Activation of the miR-218-5p ceRNA Network.
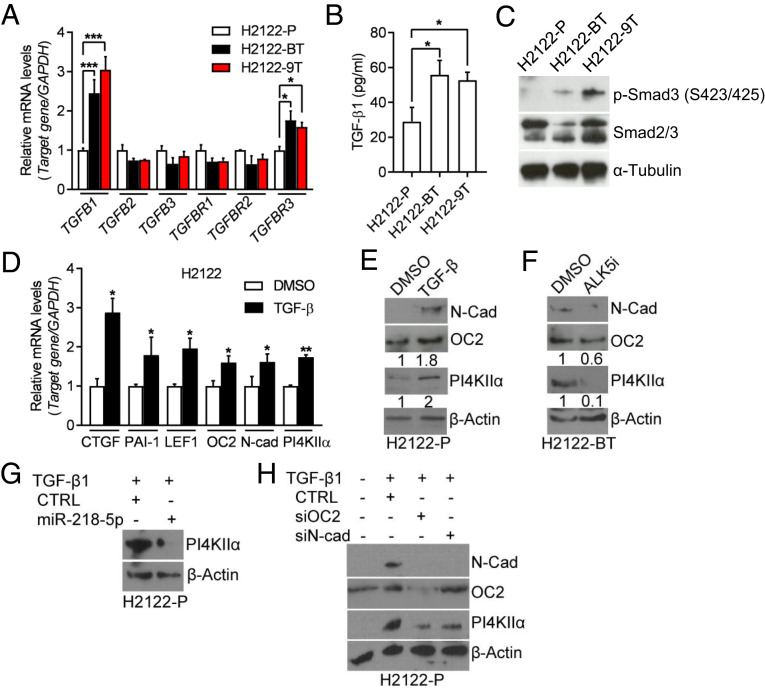
To elucidate how PI4KIIIβ inhibition activates the ceRNA network, we performed enrichment analysis using Gene Ontology (GO) terms on RNA sequencing profiles of PI4KIIIβ–deficient and –replete H2122 cells and found that the differentially expressed genes (fold-change > 1.5, P < 0.05) were enriched in GO terms related to TGF-β signaling (SI Appendix, Table S2). In support of this finding, TGF-β1, TGFBR3, and phosphorylated SMAD3 levels were higher in drug-tolerant than parental H2122 cells (Fig. 6 A–C), and shRNA-induced PI4KIIIβ depletion increased TGF-β1 and TGFBR3 mRNA levels (SI Appendix, Fig. S6A), which led us to assess TGF-β1 as a regulator of the ceRNA network. Treatment of parental H2122 cells with recombinant TGF-β1 increased the levels of OC2, N-cad, and PI4KIIα with fold changes similar to those of well-known SMAD transcriptional targets (Fig. 6 D and E), whereas a TGF-β receptor antagonist (ALK5i) decreased PI4KIIα levels in drug-tolerant H2122 cells (Fig. 6F). TGF-β1–induced PI4KIIα expression was abrogated by ectopic miR-218-5p expression (Fig. 6G) or siRNA depletion of OC2 or N-cad (Fig. 6H) and was not accompanied by changes in PI4K2A gene promoter activity (SI Appendix, Fig. S6B). In the TCGA LUAD cohort, a TGF-β pathway gene expression signature was correlated positively with PI4KIIα levels (SI Appendix, Fig. S6C). We conclude that PI4KIIIβ inhibition up-regulates PI4KIIα by activating a TGF-β–dependent ceRNA network.
Fig. 6.
TGF-β–dependent activation of the miR-218-5p ceRNA network. (A) qPCR analysis of TGF-β family members and TGF-β receptors. Values were normalized to H2122-P. (B) TGF-β1 ELISA assay on CM samples. (C) WB analysis of p-Smad3 (Ser423/425) and total Smad2/3 in cell lysates. α-Tubulin served as loading control. (D) qPCR analysis of TGF-β downstream targets (CTGF, PAI-1, and LEF1) and predicted miR-218-5p targets (LEF1, OC2, N-cad, and PI4KIIα) in H2122-P cells that had been treated for 5 d with DMSO or 10 ng/mL TGF-β1. Values were normalized to DMSO control. (E) WB analysis of cells in D. β-Actin served as loading control. (F) WB analysis of H2122-BT cells treated for 72 h with DMSO or 5 µM ALK5i. (G and H) WB analysis of H2122-P cells that were treated for 72 h with 10 ng/mL TGF-β1 and then transfected with miR-218-5p mimics (G) or siRNAs against OC2 or N-cad (H). Values are shown as mean ± SEM of triplicate biological replicates. P values: one-way ANOVA in A and B and two-sided t test in D. *P < 0.05, **P < 0.01, and ***P < 0.001.
PI4KIIα Inhibition Mitigates Tolerance to PI4KIIIβ Antagonism.
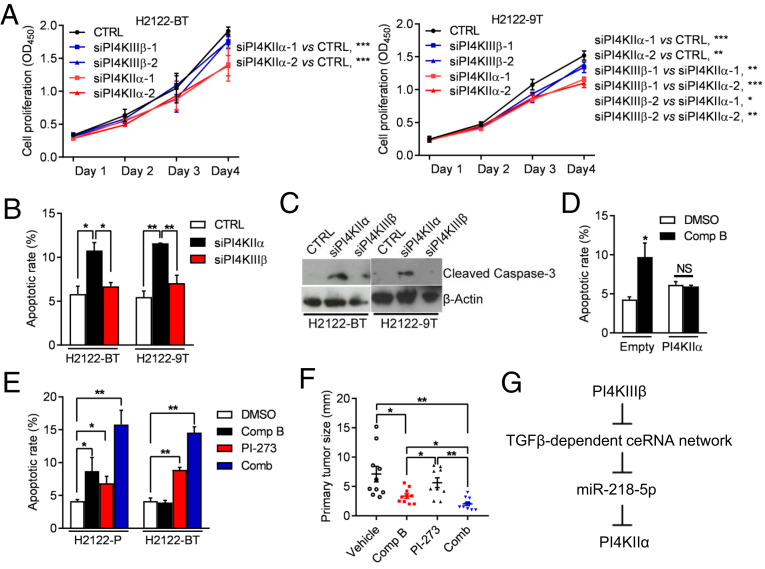
Lastly, we assessed the biological role of PI4KIIα in drug-tolerant H2122 cells. The proliferation and viability of drug-tolerant cells were inhibited to a greater extent by siRNA-mediated depletion of PI4KIIα than PI4KIIIβ (Fig. 7 A–C), whereas parental H2122 cells were more sensitive to depletion of PI4KIIIβ than PI4KIIα (SI Appendix, Fig. S7). Ectopic PI4KIIα expression rescued the viability of compound B-treated H2122 cells (Fig. 7D). Compared with either drug alone, combined treatment with compound B and PI-273 more sharply increased H2122 cell apoptosis in monolayer culture and reduced orthotopic lung tumor size in nude mice (Fig. 7 E and F), suggesting that PI4KIIα provides an alternative source of Golgi-resident PI4P that facilitates drug tolerance. Combined treatment increased apoptosis more prominently in 1q21.3-amplified LUAD cells than it did in 1q21.3-diploid LUAD cells or BEAS-2B immortalized human bronchial epithelial cells (SI Appendix, Fig. S8), which suggests that apoptosis resulted from on-target effects of the drugs. Importantly, PI4KIIIβ inhibition did not activate the feedforward pathway in BEAS-2B cells (SI Appendix, Fig. S9A), and Golgi-resident PI4P levels in BEAS-2B cells decreased to similar extents following siRNA-mediated depletion of PI4KIIIβ or PI4KIIα (SI Appendix, Fig. S9B). Collectively, these findings are in line with our hypothesis that addiction to PI4KIIIβ–derived PI4P synthesis is tightly coupled to 1q21.3 amplification.
Fig. 7.
Drug tolerance results from increased PI4KIIα–dependent PI4P synthesis. (A) Relative densities of siRNA-transfected H2122-BT cells and H2122-9T cells in monolayer culture. (B and C) Apoptosis quantified by flow cytometric analysis of Annexin V/PI staining (B) and WB analysis of cleaved caspase-3 (C) in siRNA-transfected H2122-BT and H2122-9T cells. (D) Apoptosis quantified by flow cytometric detection of Annexin V/PI staining of H2122 cells transfected with empty vector or PI4KIIα expression vector cells, then treated for 48 h with vehicle or 2 µM compound B. (E) Apoptosis quantified by flow cytometric detection of Annexin V/PI staining of H2122-P and H2122-BT cells treated for 48 h with 2 μM compound B or 5 μM PI-273 or both drugs. Vehicle (DMSO) control. (F) H2122 orthotropic tumor diameters after a 2-wk treatment with 40 mg/kg/day compound B and/or 25 mg/kg/day PI-273. (G) Graphical depiction of the proposed model. 1q-LUAD cells subjected to prolonged PI4KIIIβ antagonist treatment acquire tolerance by activating a miR-218-5p–dependent ceRNA network that up-regulates PI4KIIα, which rescues Golgi-resident PI4P, prosurvival effector protein secretion, and cell viability. Values are shown as mean ± SEM of triplicate biological replicates, unless otherwise indicated. P values: two-way ANOVA in A, two-sided t test in D, and one-way ANOVA in all others. *P < 0.05, **P < 0.01, and ***P < 0.001. NS, not significant.
Discussion
Here, we show that 1q-LUAD cells demonstrate hallmarks of addiction to Golgi-resident PI4P synthesis. Following PI4KIIIβ antagonism, PI4P levels decreased transiently and recovered owing to a ceRNA network that up-regulated PI4KIIα (Fig. 7G). PI4KIIIβ antagonist-tolerant cells relied on PI4KII-α for prosurvival effector protein secretion and cell viability, indicating that drug tolerance resulted from an alternative enzymatic source of Golgi-resident PI4P synthesis.
The findings presented here recapitulate evidence from EGFR-, BCR/ABL-, and BRAF-mutant malignancies that resistance to targeted therapies develops through genetic and epigenetic events that restore mutant oncoprotein activity and build on the finding that mutant oncoproteins maintain cancer cell viability by regulating lipid metabolism (18–22). In contrast to Golgi-resident PI4P, which drives the biogenesis of secretory vesicles carrying prosurvival cargos, PI-3,4,5-phosphate generated by PI3K activates prosurvival signaling pathways in PIK3CA-mutant cancer cells, whereas fatty acid uptake, retention, and beta-oxidation driven by acyl-CoA synthetase long chain 3 maintain the survival of KRAS-mutant cancer cells (19, 20). Importantly, because PI4KIIIβ antagonism inhibits oncogenic K-ras by inducing its redistribution from the plasma membrane to organelles (23), PI4KIIIβ inhibitors may be efficacious in KRAS-mutant malignancies. Thus, lipids are key effectors of mutant oncoproteins.
PI4KIIIβ antagonists were initially developed to treat RNA viruses that require PI4KIIIβ for replication (21, 22). The findings presented here warrant consideration of clinical trials to test the efficacy of PI4KIIIβ antagonists, alone and in combination with PI4KIIα antagonists, in chromosome 1q21.3–amplified cancers. While the toxicities from such therapies may be considerable given the essential roles of PI4K family members in cellular functions, the potential clinical impact is considerable given that there are currently no proven targeted therapeutic approaches for this genetically defined subset of cancers.
Materials and Methods
Reagents.
We purchased DMSO (D2260), Ritonavir (PHR1734), human TGF-β1 (T7039), 2-Hydroxypropyl-β-cyclodextrin (HPBCD, 332607), and TGF-β RI Kinase (ALK5) Inhibitor (616451-M) from Sigma-Aldrich; PI-273 (GLXC-10056) from Glixx Laboratories; Polysorbate 80 (Poly-80, PO138) and Polyethylene glycol300 (PEG300, PO108) from Spectrum Chemicals; shRNAs against human PI4KIIIβ (TRCN0000199916 and TRCN0000199262), siRNA universal negative control #1 (SIC01), siRNAs against human PI4KIIα (SASI_Hs01_00190417 and SASI_Hs01_00190418), PI4KIIIβ (SASI_Hs01_00149544 and SASI_Hs01_00149545), GOLPH3 (SASI_Hs01_00163826 and SASI_Hs01_00163830), OC2 (EHU007381), and N-cad (EHU136211); Mission miRNA negative control #1 (HMC0002), hsa-miR-218 microRNA mimic (HMI0384), synthetic microRNA inhibitor negative control #1 (NCSTUD001), and hsa-miR-218 inhibitor (HSTUD0384) from Millipore Sigma; primary antibodies against PI4KIIIβ (NBP2-128140) from Novus Biologicals; primary antibodies against normal rabbit IgG (sc-2027) from Santa Cruz Biotechnology; primary antibodies against PI4KIIα (15318-1-AP), SAC1 (13033-1-AP), Onecut2 (21916-1-AP), TIMP1 (16644-1-AP), STC2 (10314-1-AP), and CLU (12289-1-AP) from Proteintech; primary antibodies against α-Tubulin (#T9026) from Sigma-Aldrich; primary antibodies against β-Actin (#4967), HA-tag (#2367), cleaved-Caspase 3 (#9664), Calnexin (#2679), Rab7 (#9367), Rab11 (#5589), acetyl-Histone H3 (Lys9) (#9649), acetyl-Histone H3 (Lys27) (#8173), N-cad (#13116), phospho-Smad3 (Ser423/425) (#9520), and Smad2/3 (#8685) from Cell Signaling Technology; primary antibodies against AGO2 (ab32381), GOLPH3 (ab264406), GM130 (ab32337), LAMP-1 (ab25245), and RNA polymerase II (ab26721) from Abcam; and primary antibodies against TGN46 (AHP500G) from Bio-Rad.
Cell Lines.
Human lung cancer cell lines H2122 and H3122 and lung epithelial cell line BEAS-2B were cultured in RPMI Media 1640 (Life Technologies, 11875093) containing 10% fetal bovine serum (Thermo Fisher Scientific, SH30071.03). Cells were maintained at 37 °C in an incubator with a humidified atmosphere containing 5% CO2. To derive cells that are tolerant to PI4KIIIβ antagonists, H2122 cells and H3122 cells were treated with Compound B (11) or IN-9 (MedChemExpress, HY-19798) for 4 wk starting at 0.5 µM. Media containing vehicle or inhibitor were replaced every 2 d. Doses were increased every 6 d to a final dose of 10 µM. After 12 wk of treatment, including 2 wk at the highest dose level, the cells were considered drug tolerant. Cells were transfected with jetPRIME Versatile DNA/siRNA transfection reagent (Polyplus, 114-15).
Constructs.
3′-UTR sequences were amplified from genomic DNA isolated from H2122 cells using PrimeSTAR GXL DNA Polymerase (Takara, R050A) and cloned into pmirGLO Dual-Luciferase miRNA Target Expression Vector (Promega, E1330) or pCI-neo Mammalian Expression Vector (Promega, E1841). miR-218-5p binding site mutations were introduced by PCR method. Human PI4K2A gene promoter sequences (−1,487 to +35 base pairs) were cloned into pGL3-Basic vector (Promega, E1751). HA-tagged PI4K2A open reading frame was amplified from H2122 complementary DNA (cDNA) and inserted into plasmid pLVX-Puro (Clontech, 632164). All the cloning primers’ sequences are listed in SI Appendix, Table S3.
Cell Proliferation, Colony Formation, and Apoptosis Assays.
Cell proliferation assays were performed using Cell Proliferation Reagent WST-1 (Millipore Sigma, 11644807001) according to the manufacturer’s protocol. For colony formation at low density on plastic, 500 cells/well were plated into 6-well plates. Cultures were maintained for 14 d to allow the formation of cell colonies, and colonies were stained with 1% Crystal Violet and manually counted. For cell apoptosis assays, 105 cells were stained with Annexin V-FITC/PI solution using Dead Cell Apoptosis Kit (Thermo Fisher Scientific, V13242) according to manufacturer’s instructions and subjected to flow cytometry analysis (BD FACSAria II, BD Biocsience) to detect apoptotic cells.
DNA and RNA Quantification Assays.
Total RNA was extracted using RNeasy Mini Kit (Qiagen, 74106). cDNA synthesis was performed by using qScript cDNA SuperMix (Quanta Biosciences, 95048). qPCR reactions were performed using SYBR Green Real-Time PCR Master Mixes from Thermo Fisher Scientific on an ABI 7500 Fast System (Applied BioSystems). mRNA levels were normalized against GAPDH, and relative gene expression levels were normalized to control samples. Genomic DNA was isolated from cells using DNeasy Blood & Tissue Kits (Qiagen, 69504). Gene copy numbers were normalized against RPL32, and relative copy numbers in experimental samples were normalized to diploid controls. Gene-specific primer sequences are listed in SI Appendix, Table S3. microRNA levels were quantified using Taqman microRNA assays (Applied Biosystems) according to the manufacturer’s protocol and normalized to snoRNA-135.
Bulk RNA Sequencing.
RNA samples (triplicate) from H2122 cells stably transfected with PI4KIIIβ or control shRNAs were subjected to RNA sequencing. Raw reads were processed with LifeScope Genomic Analysis Software (version 2.5).
CM Sample Preparation.
Cells were seeded in 6-well plates, and DMSO or kinase inhibitors were added 20 h later. After 4 h, cells were incubated in serum-free medium containing drugs. CM samples were collected 16 h later, filtered through a 0.45-µm filter, and concentrated consecutively using Amicon Ultra-15 10k centrifugal filter units (Millipore Sigma, UFC901024).
Protein Extraction and Western Blot Analysis.
Lysates were prepared by suspending cells in cold radioimmunoprecipitation assay (RIPA) buffer and protease inhibitor mixture (Sigma-Aldrich, P8340). For Western blot (WB) analysis, protein lysates were separated on 4 to 20% Mini-PROTEAN TGX Stain-Free Protein Gels (BIO-RAD, 4568093) and transferred to polyvinylidene difluoride (PVDF) membranes. The membranes were blocked in 5% nonfat milk and probed with primary and secondary antibodies according to standard procedures. WB was detected using the SuperSignal West Pico PLUS Chemiluminescent Substrate (Thermo Fisher Scientific, 34577). Relative band intensity was quantified using ImageJ Software (NIH).
Purification of Endoplasmic Reticulum.
Microsomal/ER fraction was isolated following the endoplasmic reticulum isolation kit protocol (Sigma-Aldrich, ER0100). Purity of cell fractions was determined by immunoblotting against Calnexin.
PI4P Enzyme-Linked Immunosorbent Assay.
Golgi-enriched cell fractions were isolated using Minute Golgi Apparatus Enrichment Kit (Inventbiotech, GO-037). Acidic lipids were extracted from the Golgi-enriched fraction, and PI4P levels were measured using the PI4P Mass enzyme-linked immunosorbent assay (ELISA) Kit (Echelon Biosciences, K4000E) according to the manufacturer’s instructions. PI4P levels were normalized to cell numbers.
TGF-β1 ELISA.
CM samples were collected from 80% confluent cell cultures. TGF-β1 concentrations were determined using a Human TGF-β1 ELISA Kit (Millipore Sigma, RAB0460) according to manufacturer’s instructions.
ChIP-qPCR.
Cells were grown to 80% confluence and cross-linked with 1% formaldehyde. Cell lysates were sonicated with a Cole-Parmer GEX-130 μLtrasonic processor using 40% power (pulse on for 10 s, pulse off for 10 s; 20 cycles) and immunoprecipitation with anti-rabbit IgG, anti–RNA polymerase II, anti-H3K9Ac, or anti-H3K27Ac antibodies. The cross-linking, immunoprecipitation, washing, elution, reverse cross-linking, and proteinase K treatment were performed with SimpleChIP Enzymatic Chromatin IP Kit (Cell Singaling Technology, #9002). DNA was eluted and purified with the MinElute Reaction Cleanup Kit (Qiagen, 28206) and subjected to qPCR analysis.
CLIP.
RNA immunoprecipitation was performed with the Magna RIP RNA-Binding Protein Immunoprecipitation Kit (Millipore Sigma, 17-701). Following UV cross-linking (254 nm, 150 mJ/cm2), cells were lysed and digested with 1 U/μL RNase T1 (Thermo Fisher Scientific, AM2283) for 15 min at 22 °C. Magnetic beads coated with 2 μg Rabbit IgG or anti-AGO2 antibody were incubated with cell lysates for 8 h at 4 °C. Immunoprecipitated RNA–protein complexes were collected, washed six times, and subjected to proteinase K digestion and RNA extraction. RNA levels in the immunoprecipitates were determined by qPCR analysis and normalized to input.
Luciferase Reporter Assay.
H2122-P cells were seeded on 24-well plates (105 cells/well) and cotransfected with 0.2 µg pmirGLO reporter plasmid and 0.2 µg pCI-Neo plasmid or 100 nM miRNA inhibitors per well. H2122-BT cells were cotransfected with 0.2 µg pmirGLO reporter plasmid and 50 nM miRNA mimics. H1299 cells were transfected with PI4K2A gene promoter driven luciferase reporter (500 ng) and treated with DMSO or 10 ng/mL TGF-β1. After 48 h posttransfection, luciferase activity was measured using the Dual-Luciferase Reporter Assay System (Promega, E1960) according to the manufacturer’s protocol.
Mouse Experiments.
All animal experiments were reviewed and approved by the Institutional Animal Care and Use Committee at The University of Texas MD Anderson Cancer Center. The 8-wk-old male BALB/c nude mice were allowed to acclimate for 1 wk under specific pathogen-free conditions. To generate orthotopic lung tumors, nu/nu mice (n = 9 to 10 mice per cohort) were subjected to intrathoracic injection with 2 × 10⁶ tumor cells in 5% Matrigel. Four weeks after cell injection, mice were treated with vehicle (5% DMSO, 20% HPBCD, 2% Poly-80, and 10% PEG300), Compound B (subcutaneous administration, 40 mg/kg/day plus 20 mg/kg Ritonavir, twice daily), or PI-273 (intraperitoneal injection, 25 mg/kg/day, once daily), singly or in combination, for 2 wk. The day after the last treatment, mice were necropsied. The diameters of primary tumors were measured.
Statistical Analyses.
Data were analyzed using Prism 8.0 (GraphPad Software). Statistical comparisons between two groups were accessed by two-tailed Student’s t test. ANOVA followed by Holm-Sidak post hoc test was used for comparing multiple groups to the control group. The error bar represents the SEM. Statistical significance was defined as P < 0.05. The Kaplan–Meier method with log-rank test was used to evaluate overall survival curves for mouse cohorts and patients. RNA sequencing analysis and visualization platform GEPIA V2 (gepia2.cancer-pku.cn/#index) was used to conduct correlation analysis by using the Pearson’s correlation coefficient method. Enrichment analysis using GO terms was performed on genes differentially expressed in PI4KIIIβ–deficient and –replete H2122 cells using SigTerms software (24) and one-sided Fisher exact tests.
Supplementary Material
Acknowledgments
This work was supported by the NIH through Grants R01CA181184 (to J.M.K.), R01CA2111125 (to J.M.K.), R01AI099245 (to J.S.G.), CA125123 (to C.J.C.), and U19AI109662 (to J.S.G.); NIH Lung Cancer SPORE Grant P50CA70907 (to J.M.K.); Lung Cancer Research Foundation FP#00005299 (to X.T.); and NIH Core Grant P30CA016672 for Flow Cytometry Facility, Sequencing and Microarray Facility. J.M.K. holds the Elza A. and Ina S. Freeman Endowed Professorship in Lung Cancer. The work was also supported by the generous philanthropic contributions to The University of Texas MD Anderson Lung Cancer Moon Shots Program.
Footnotes
Competing interest statement: J.M.K. has received consulting fees from Halozyme. This activity is unrelated to the current study.
This article is a PNAS Direct Submission.
This article contains supporting information online at https://www.pnas.org/lookup/suppl/doi:10.1073/pnas.2023537118/-/DCSupplemental.
Data Availability
Bulk RNA sequencing data have been deposited in the Gene Expression Omnibus database (https://www.ncbi.nlm.nih.gov/geo/, GSE120619). All remaining data are included in the article and/or SI Appendix.
References
- 1.Weinstein I. B., Joe A. K., Mechanisms of disease: Oncogene addiction–A rationale for molecular targeting in cancer therapy. Nat. Clin. Pract. Oncol. 3, 448–457 (2006). [DOI] [PubMed] [Google Scholar]
- 2.Pagliarini R., Shao W., Sellers W. R., Oncogene addiction: Pathways of therapeutic response, resistance, and road maps toward a cure. EMBO Rep. 16, 280–296 (2015). [DOI] [PMC free article] [PubMed] [Google Scholar]
- 3.Groffen J., et al., Philadelphia chromosomal breakpoints are clustered within a limited region, bcr, on chromosome 22. Cell 36, 93–99 (1984). [DOI] [PubMed] [Google Scholar]
- 4.Bartram C. R., et al., Translocation of c-ab1 oncogene correlates with the presence of a Philadelphia chromosome in chronic myelocytic leukaemia. Nature 306, 277–280 (1983). [DOI] [PubMed] [Google Scholar]
- 5.Lynch T. J., et al., Activating mutations in the epidermal growth factor receptor underlying responsiveness of non-small-cell lung cancer to gefitinib. N. Engl. J. Med. 350, 2129–2139 (2004). [DOI] [PubMed] [Google Scholar]
- 6.Nieto P., et al., A Braf kinase-inactive mutant induces lung adenocarcinoma. Nature 548, 239–243 (2017). [DOI] [PMC free article] [PubMed] [Google Scholar]
- 7.Yao Z., et al., Tumours with class 3 BRAF mutants are sensitive to the inhibition of activated RAS. Nature 548, 234–238 (2017). [DOI] [PMC free article] [PubMed] [Google Scholar]
- 8.Gross S., Rahal R., Stransky N., Lengauer C., Hoeflich K. P., Targeting cancer with kinase inhibitors. J. Clin. Invest. 125, 1780–1789 (2015). [DOI] [PMC free article] [PubMed] [Google Scholar]
- 9.Robinson D. R., et al., Activating ESR1 mutations in hormone-resistant metastatic breast cancer. Nat. Genet. 45, 1446–1451 (2013). [DOI] [PMC free article] [PubMed] [Google Scholar]
- 10.Halberg N., et al., PITPNC1 recruits RAB1B to the Golgi network to drive malignant secretion. Cancer Cell 29, 339–353 (2016). [DOI] [PMC free article] [PubMed] [Google Scholar]
- 11.Tan X., et al., PI4KIIIβ is a therapeutic target in chromosome 1q-amplified lung adenocarcinoma. Sci. Transl. Med. 12, eaax3772 (2020). [DOI] [PMC free article] [PubMed] [Google Scholar]
- 12.Zappa F., Failli M., De Matteis M. A., The Golgi complex in disease and therapy. Curr. Opin. Cell Biol. 50, 102–116 (2018). [DOI] [PubMed] [Google Scholar]
- 13.Dippold H. C., et al., GOLPH3 bridges phosphatidylinositol-4- phosphate and actomyosin to stretch and shape the Golgi to promote budding. Cell 139, 337–351 (2009). [DOI] [PMC free article] [PubMed] [Google Scholar]
- 14.Wang Y. J., et al., Phosphatidylinositol 4 phosphate regulates targeting of clathrin adaptor AP-1 complexes to the Golgi. Cell 114, 299–310 (2003). [DOI] [PubMed] [Google Scholar]
- 15.Waugh M. G., Amplification of chromosome 1q genes encoding the phosphoinositide signalling enzymes PI4KB, AKT3, PIP5K1A and PI3KC2B in breast cancer. J. Cancer 5, 790–796 (2014). [DOI] [PMC free article] [PubMed] [Google Scholar]
- 16.Minogue S., The many roles of type II phosphatidylinositol 4-kinases in membrane trafficking: New tricks for old dogs. Bioessays 40, (2018). [DOI] [PubMed] [Google Scholar]
- 17.Waugh M. G., The great escape: How phosphatidylinositol 4-kinases and PI4P promote vesicle exit from the Golgi (and drive cancer). Biochem. J. 476, 2321–2346 (2019). [DOI] [PubMed] [Google Scholar]
- 18.Li J., et al., PI-273, a substrate-competitive, specific small-molecule inhibitor of PI4KIIα, inhibits the growth of breast cancer cells. Cancer Res. 77, 6253–6266 (2017). [DOI] [PubMed] [Google Scholar]
- 19.Padanad M. S., et al., Fatty acid oxidation mediated by acyl-CoA synthetase long chain 3 is required for mutant KRAS lung tumorigenesis. Cell Rep. 16, 1614–1628 (2016). [DOI] [PMC free article] [PubMed] [Google Scholar]
- 20.Zhao L., Vogt P. K., Class I PI3K in oncogenic cellular transformation. Oncogene 27, 5486–5496 (2008). [DOI] [PMC free article] [PubMed] [Google Scholar]
- 21.Arita M., Dobrikov G., Pürstinger G., Galabov A. S., Allosteric regulation of phosphatidylinositol 4-kinase III beta by an antipicornavirus compound MDL-860. ACS Infect. Dis. 3, 585–594 (2017). [DOI] [PubMed] [Google Scholar]
- 22.Klempner S. J., Myers A. P., Cantley L. C., What a tangled web we weave: Emerging resistance mechanisms to inhibition of the phosphoinositide 3-kinase pathway. Cancer Discov. 3, 1345–1354 (2013). [DOI] [PMC free article] [PubMed] [Google Scholar]
- 23.Miller T. E., et al., Depletion of phosphatidylinositol 4-phosphate at the Golgi translocates K-ras to mitochondria. J. Cell Sci. 132, jcs231886 (2019). [DOI] [PMC free article] [PubMed] [Google Scholar]
- 24.Creighton C. J., Nagaraja A. K., Hanash S. M., Matzuk M. M., Gunaratne P. H., A bioinformatics tool for linking gene expression profiling results with public databases of microRNA target predictions. RNA 14, 2290–2296 (2008). [DOI] [PMC free article] [PubMed] [Google Scholar]
Associated Data
This section collects any data citations, data availability statements, or supplementary materials included in this article.
Supplementary Materials
Data Availability Statement
Bulk RNA sequencing data have been deposited in the Gene Expression Omnibus database (https://www.ncbi.nlm.nih.gov/geo/, GSE120619). All remaining data are included in the article and/or SI Appendix.


