

Abstract
In recent years, it has become apparent that the gut microbiome can influence the functioning and pathological states of organs and systems throughout the body. In this study, we tested the hypothesis that the gut microbiome has a major role in the disruption of the blood-brain barrier (BBB) in the spontaneously hypertensive stroke prone rats (SHRSP), an animal model for hypertensive cerebral small vessel disease (CSVD). Loss of BBB is thought to be an early and initiating component to the full expression of CSVD in animal models and humans. To test this hypothesis, newly born SHRSP pups were placed with foster dams of the SHRSP strain or dams of the WKY strain, the control strain that does not demonstrate BBB dysfunction or develop hypertensive CSVD. Similarly, WKY pups were placed with foster dams of the same or opposite strain. The rationale for cross fostering is that the gut microbiomes are shaped by environmental bacteria of the foster dam and the nesting surroundings. Analysis of the bacterial genera in feces, using 16S rRNA analysis, demonstrated that the gut microbiome in the rat pups was influenced by the foster dam. SHRSP offspring fostered on WKY dams had systolic blood pressures (SBPs) that were significantly decreased by 26 mmHg (P < .001) from 16-20 weeks, compared to SHRSP offspring fostered on SHRSP dams. Similarly WKY offspring fostered on SHRSP dams had significantly increased SBP compared to WKY offspring fostered on WKY dams, although the magnitude of SBP change was not as robust. At ~20 weeks of age, rats fostered on SHRSP dams showed enhanced inflammation in distal ileum regardless of the strain of the offspring. Disruption of BBB integrity, an early marker of CSVD onset, was improved in SHRSPs that were fostered on WKY dams when compared to the SHRSP rats fostered on SHRSP dams. Although SHRSP is a genetic model for CSVD, environmental factors such as the gut microbiota of the foster dam have a major influence in the loss of BBB integrity.
Keywords: cerebral small vessel disease, gut microbiome, hypertension, microbiota-gut-brain axis, vascular cognitive impairment, vascular dementia, white matter disease
1 ∣. INTRODUCTION
Cerebral small vessel disease (CSVD) is a generic phrase describing the pathological remodeling and degeneration of small cerebral arteries, arterioles, and capillaries.While there are multiple forms of CSVD, this study will focus on a form that is closely associated with hypertension.1-3 In addition to remodeling of small parenchymal arteries and arterioles, CSVD interferes with the integrity of the blood-brain barrier (BBB) and promotes lacunar infarcts, white matter lesions, hemorrhage, and microbleeds in deeper brain structures.1,4-6
Although the pathophysiological mechanisms involving hypertensive CSVD are poorly understood, it appears that BBB disruption, hypoxia, and inflammation all have potential roles in its onset and development.4,7,8 Ihara and Yamamoto suggested that acute and chronic infectious pathogens from the oral cavity or from the gut could be an initiating source for inflammation associated with CSVD.7 Although this idea is intriguing, there has been no direct evidence linking the oral or gut microbiome to CSVD. Nevertheless, evidence has accumulated in the past decade that link the gut microbiome to cardiovascular diseases,9-11 and neurological and behavioral disorders.12-18
In this study, we tested the hypothesis that the gut microbiome has a major role in the disruption of the BBB in the spontaneously hypertensive stroke prone rat (SHRSP), an animal model for CSVD. We focus on the BBB since it appears to be an early and important event leading to the subsequent pathological sequela in CVSD.4,7, Of note, loss of BBB integrity appears to occur several months prior to white matter lesions, microbleeds, and stroke in SHRSP.19-22
To test our hypothesis we compared SHRSPs to Wistar Kyoto (WKY) normotensive controls, the parent strain for SHRSP. We altered the gut microbiome in WKY rats to resemble that in SHRSP and altered the gut microbiome in SHRSP to resemble that in WKY rats. If our hypothesis is valid then altering the microbiome in SHRSPs to resemble the microbiome in WKY rats should abolish or attenuate the loss of BBB integrity, which leads to full onset of CSVD-like symptoms in the SHRSPs.
2 ∣. METHODS
All animal protocols were approved by the Institutional Animal Care and Use Committee at Baylor College of Medicine, Houston, TX and conformed to the Guide for the Care and Use of Laboratory Animals, 8th edition, published by the National Institutes of Health (NIH). SHRSP and WKY rats were purchased from Charles River Laboratories and mated for at least four generations to produce in-house colonies for each strain. All rats had ad libitum access to normal rat chow and water, and were subjected to a 12 hours light (6 AM-6 PM): 12 hours dark (6 PM-6 AM) cycle.
2.1 ∣. Cross fostering protocol
The gut microbiome was altered using a cross fostering protocol where new born pups were placed with foster dams.23 Mating cages were set up using males and females of the same strain. Approximately 1 day after birth, rat pups were removed from the biological dam and placed with a foster dam of the same or opposite strain (Figure 1). The rationale for cross fostering is that the gut microbiomes are shaped by environmental bacteria of the foster dam and the nesting surroundings. For each foster pup that was placed with a nursing dam, a biological pup was removed from the cage. For any single nursing cage, a dam could have one to two foster pups and three to five biological pups. At weaning, male pups were identified and caged with the male pups nursed by the same dam.
FIGURE 1.
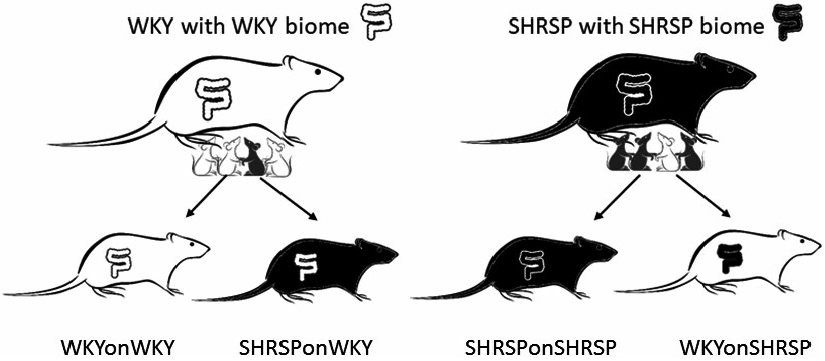
Cross fostering protocol to shift the gut microbiome of the fostered offspring to that of the nursing dam. WKYonWKY represents WKY pups fostered on WKY dams, WKYonSHRSP represents WKY pups fostered on SHRSP dams, SHRSPonWKY represents SHRSP pups fostered on WKY dams, and SHRSPonSHRSP represents SHRSP pups fostered on SHRSP dams
2.2 ∣. Blood pressure measurements
Systolic blood pressure (SBP) was measured in un-anesthetized rats using a six-channel CODA high-throughput tail-cuff blood pressure system (Kent Scientific, Torrington, CT). Prior to the initial SBP measurement, all rats were acclimatized to the system for two consecutive days. At least 10 readings, without movement artifact, were averaged to obtain an individual SBP measurement. In preliminary studies, we demonstrated that SBP values obtained using the tail-cuff method are comparable to direct arterial measurements made in the same rat.
2.3 ∣. Gut microbiome analysis
Fresh fecal pellets were collected at 1 to 2 week intervals and stored at −80°C. The samples were sent to the Center for Metagenomics and Microbiome Research at the Baylor College of Medicine where 16S rRNA gene sequence libraries were generated from the V4 primer region using the Illumina MiSeq platform24,25 after extracting DNA using MO BIO PowerMag Soil Isolation Kit (MO BIO Laboratories). Data were analyzed using ATIMA (Agile Toolkit for Incisive Microbial Analysis) developed by the Center for Metagenomics and Microbiome Research at the Baylor College of Medicine.
2.4 ∣. Perfusion and tissue collection
Rats were anesthetized with a combination anesthetic (1 μL/g ip) consisting of ketamine, xylazine, and acepromazine (37.5, 1.9, and 0.37 mg per mL, respectively), purchased from the Center for Comparative Medicine, Baylor College of Medicine. The chest cavity was opened and each rat was perfused with 100 mL heparinized saline (20 μ/mL, [diluted from Heparin (McKesson) 1000 U/ml using sterile saline (McKesson)] at a pressure of 100 mmHg to clear blood from the vascular compartment. The brain was removed and one hemisphere was immediately frozen at −80°C (to be used for qPCR and Western analysis). The other hemisphere was used for immunofluorescence (see below). Abdominal adipose, liver, and mucosal scrapings of the jejunum, proximal colon, and distal ileum were snap frozen in liquid nitrogen and stored at −80°C. An adjacent section of the distal ileum was fixed in Carnoy’s solution [60 mL ethanol (Decon Laboratories), 30 mL chloroform (Fisher), and 10 mL glacial acetic acid (Fisher)].
2.5 ∣. Histological and immunofluorescence analysis
The fixed section of distal ileum was embedded in paraffin and serially sectioned on a microtome at a thickness of 4 μm and mounted on slides. Sections were stained with Periodic Acid-Schiff-Alcian blue (PAS-AB, Sigma) for goblet cells enumeration. Sections were analyzed by bright field microscopy (Nikon Eclipse 90i).
For immunofluorescence imaging in ileum, sections were blocked using 4% normal goat serum (Sigma) in phosphate-buffered saline followed by incubation with a primary antibody directed against macrophages (F4/80, Cell Signaling, Cat. #70076S rabbit IgG 1:250), rinsed, and incubated with a secondary antibody, Alexa Fluor 488 goat anti-rabbit (Invitrogen, 1:500). After rinsing, the sections were stained with DAPI (0.5 μg/ml Invitrogen), for 5 minutes, rinsed again, and cover slipped. Fluorescent images were captured using a Cytation cell imaging reader (Biotek).
For immunofluorescence imaging in brain, one hemisphere of fresh brain was drop fixed in 4% formaldehyde (Sigma) overnight and placed in 30% sucrose (Sigma) for 2 days. The hemisphere was frozen and sectioned in a cryostat yielding 25 μm thick coronal sections. Tissue sections were washed and blocked with blocking buffer (10% goat serum, 0.5% BSA, 0.1% Tween-20 all from Sigma) for 2 hours and incubated overnight with rabbit anti-IBA-1 (0.5 μg/mL, Wako) and mouse anti-Actin (2 μg/mL of clone clone1A4, Sigma). The next day sections were incubated for 10 minutes with the secondary antibodies, Alexa Fluor 594 goat anti-mouse IgG and Alexa Fluor 488 goat anti-rabbit IgG (Invitrogen), and subsequently incubated in DAPI as above. Fluorescent images were captured on a GE Healthcare DeltaVision High-Resolution Deconvolution Microscope in the Integrated Microscopy Core at BCM.
2.6 ∣. Quantitative real-time PCR analysis
Gene expression was measured in the distal ileum, jejunum, proximal colon, visceral fat, liver, and brain with quantitative PCR using the Applied Biosystems Quant Studio and SYBR Green (ABI).
2.7 ∣. Western blots and ELISA
Tissues were homogenized in RIPA buffer (Sigma). Equal amounts of protein were loaded into a 4%-12% NUPAGE gel (Fisher). The proteins in the gel were transferred onto PVDF membranes (Invitrogen) using the Invitrogen iBlot system. The top half of the membranes (containing IgG) were blocked overnight at 4°C in 5% Blocking Grade Blocker (Bio-Rad) and 0.1% Tween-20 (Bio-Rad) in PBS (VWR). The membrane was then incubated with goat anti-Rat IgG-HRP (Bio-Rad, 5204-2504, 1:10,000) for 1 hour at room temperature. The lower half of the membrane (containing GAPDH) was blocked for 2 hours at room temperature and incubated overnight at 4°C with the primary antibody, mouse anti-GAPDH (6C5) (Calbiochem, 1:10 000). After washing, the membrane was incubated 30 minutes with the secondary antibody, goat anti-Mouse-HRP (Cell Signaling, 7076P2, 1:10 000). After the last antibody incubation, both membranes were washed and incubated with SuperSignal West Femto Maximum Sensitivity Substrate (Pierce, 34095) and imaged using an iBright FL1000 imager (Invitrogen).
Plasma zonulin, a marker for gut barrier integrity, was measured using a rat zonulin ELISA kit (MyBioSource, MBS753035) according to the manufacturer’s protocol.
2.8 ∣. Statistics
Data are expressed as means ± standard error of the mean or the standard error of least squares mean. Statistical tests used in the data analysis included t test, two-, or three-way ANOVA. When multiple measures were conducted for a single animal, two-way repeated measures ANOVA was used. For the two-way ANOVA, the four groups in this study were tested for significant main effects of the pup strain, the dam strain, and interactions between the pup strain and the dam strain. If the two-way ANOVA determined that there was a significant main effect of the pup strain, then the pup strain had a statistically significant effect independent of the strain of the fostering dam. Similarly, if the two-way ANOVA determined that there was a significant main effect of the dam strain, then the nursing dam showed statistical significance independent of the strain of the pup. The significant main effects, when present, are denoted on the graph and or in the figure legend. When appropriate, post hoc Holm-Sidak test was used to determine the statistical significance between individual groups. In the case of the three-way ANOVA, an additional main effect of age was also included with the main effects mentioned above for the two-way ANOVA along with the various interactions.
The operational taxonomic unit (OTU) was used for the analysis of 16S rRNA data using ATIMA version 2 (Agile Toolkit for Incisive Microbial Analyses) developed by Alkek Center for Metagenomics and Microbiome Research (CMMR) at the Baylor College of Medicine. Data in ATIMA were analyzed using the Mann-Whitney U test for taxa abundance with a false rate of discovery adjusted for multiple comparisons and the PERMANOVA test for beta diversity. The Mann-Whitney U test only distinguishes where there is statistical significance among the four groups in the study. The Pearson Product Moment Correlation was used to examine a potential relationship between SBP and BBB integrity. P < .05 was considered statistically significant.
3 ∣. RESULTS
3.1 ∣. Cross-fostering protocol shifted the gut microbiome toward that in the foster dam
Rat pups were nursed on foster dams of the same or opposite strain. The groups of rats consisted of (a) WKY pups fostered on WKY dams (WKYonWKY), (b) WKY pups fostered on SHRSP dams (WKYonSHRSP), (c) SHRSP pups fostered on WKY dams (SHRSPonWKY), and (d) SHRSP pups fostered on SHRSP dams (SHRSPonSHRSP) (Figure 1). In the initial series of studies, we determined if the cross fostering protocol could shift the gut microbiome, as determined by 16S analysis of bacteria in feces, in one rat strain to that of the opposite strain. Figure 2A shows beta diversity, a measure of community fecal microbiota composition among rats, as assessed by unweighted Bray-Curtis PCoA in feces collected at 10, 16, and 20 weeks (PERMANOVA test P = .001 for each, 5-7 per group). Note that the four groups in this study segregated in the PCoAs according to both the biological strain of the rat and strain of the foster dam. For example, biological strain of the fostered offspring at 20 weeks (bottom panel in Figure 2A) segregated along the PC1 axis with WKY offspring segregating to the left (circles and triangles) and SHRSP segregating to the right (squares and crosses). The strain of the foster dam segregated on the PC2 axis with the SHRSP foster dam (crosses and triangles) segregating below that of the WKY foster dam (circles and squares) on the PC2 axis. Firmicutes and Bacteroidetes made up more than 90% of the total bacterial abundance for each group and were consequently important determinants for shifting the groups in the PCoA plots. Firmicutes: Bacteroidetes abundance ratios (F: B) for the four groups in the cross-fostering protocol are shown in Figure 2B. A three-way ANOVA revealed that there was a significant main effect of the strain of the offspring (P < .001) on the F: B ratio indicating that rats retained microbiota characteristic to their inherent strain. In addition, there was a significant main effect of the foster dam (P = .044) confirming that the microbiomes could be shifted by the foster dam. The weighted Bray-Curtis PCoAs at 10, 16, and 20 weeks is shown in Supplemental Figures I (P=0.001 for each).
FIGURE 2.
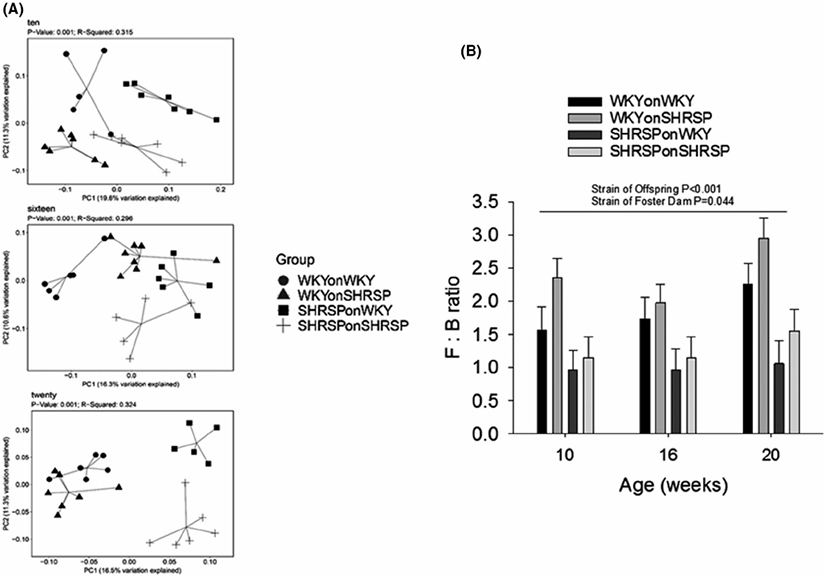
A, Unweighted Bray-Curtis PCoA plots for fecal microbiota composition from rats in the cross fostering study at ages of 10, 16, and 20 weeks (5-7 per group; P = .001 for each PCoA, PERMANOVA test). B, The abundance ratio of Firmicutes to Bacteroidetes (F : B) in the four groups in the cross fostering protocol. There was a significant main effect of offspring strain (P < .001) and a significant main effect of the strain of the foster dam (P = .044, N = 5-7 per group) using three-way ANOVA. Holm-Sidak post hoc analysis showed that in WKY offspring, there was a significant effect of the foster dam (P = .026) and a significant effect of WKY and SHRSP offspring fostered on SHRSP dam (P < .001)
Supplemental Figure II depicts genera of fecal bacteria showing significant differences at 10, 16, and 20 weeks of age. The cross fostering protocol introduced changes in the gut microbiomes of both SHRSP and WKY rats. Significance level of bacteria genera varied over the three age groups; however Allobaculum, Bifidobacterium, Oscillibacter, and Ruminococcus_2 were significant (P < .05 for each, Mann-Whitney U test) at all of the time points. Other genera showed significance at specific ages (10, 16, or20 weeks).
3.2 ∣. Inflammation-related markers in periphery and brain
Markers for inflammation and inflammatory-related transcripts are shown in Figures 3 and 4, and in Supplemental Figures III-VI. The distal ileum is the tissue most affected in the cross fostering studies (Figure 3) where IL-1α, TLR-2, TLR-4, E-CAD, Muc-2 (transcribes protein in mucus layer), INFɣ, Il-6, and IL-17 showed significant main effects of offspring strain (p), strain of foster dam (d), or both offspring strain and strain of foster dam. Main effects demonstrate that offspring strain and/or strain of the foster dam significantly altered the message levels independent of other variables. IL-1α (P < .001), TLR-4 (0.034), E-CAD (P = .002), and Muc-2 (P = .001) were decreased in SHRSP independent of the strain of the foster dam, whereas IL-6 (P < .001), INFɣ (P = .039), and IL-17 (P = .032) were increased in SHRSP independent of the strain of the foster dam. IL1a (P = 0.032), TLR2 (P = .034), E-CAD (P = .036), and IL-17 (P = .009) showed significant effects of the strain of the foster dam demonstrating that the foster dam was important in gene expression. In brain TNFα and TLR-4 were significantly decreased in SHRSP independent of the strain of the foster dam (P = .042 and P = .008 for strain of rat) and MMP-9 showed a significant effect of the strain of the foster dam (P = .035, Figure 4). The gene expression, as with the gut microbiome, is not only affected by the strain of the rat, but it can also be affected by the strain of the fostering dam. Expression of message for adipose tissue, liver, proximal colon, and proximal jejunum is show in Supplemental Figures III-VI. Surprisingly many inflammatory markers were decreased in SHRSP independent of the strain of the foster dam including NF-kB1 (adipose), IL-1α (proximal jejunum and distal ileum), IL-1β (adipose, liver, and colon), TNFα (liver, colon, and brain), and IL-6 (liver and colon) (Figures 3,4 and Supplemental Figure III-VI).
FIGURE 3.
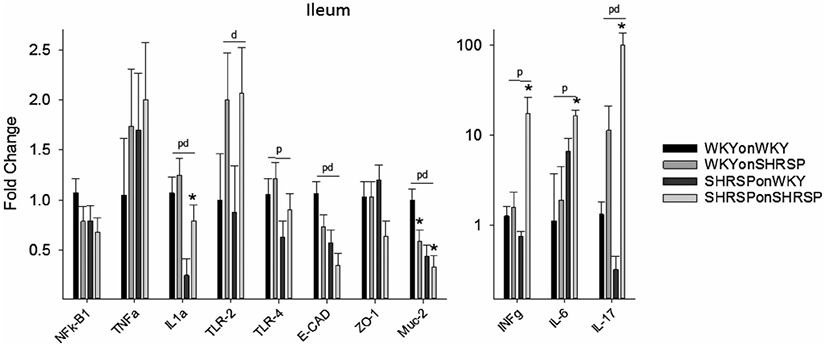
Fold change in message in distal ileum (compared to WKYonWKY) for the four groups of rats in the cross fostering study. Data were analyzed using two-way ANOVA with post hoc Holm-Sidak test where appropriate. Significant main effect (P < .05) for offspring (p), dam (d), and both offspring and dam (pd) (N = 6 per group) demonstrating that the offspring or the fostering dam significantly altered the message independent of other variables. *P < .05 compared to same strain fostered on WKY dam using Holm-Sidak post hoc analysis
FIGURE 4.
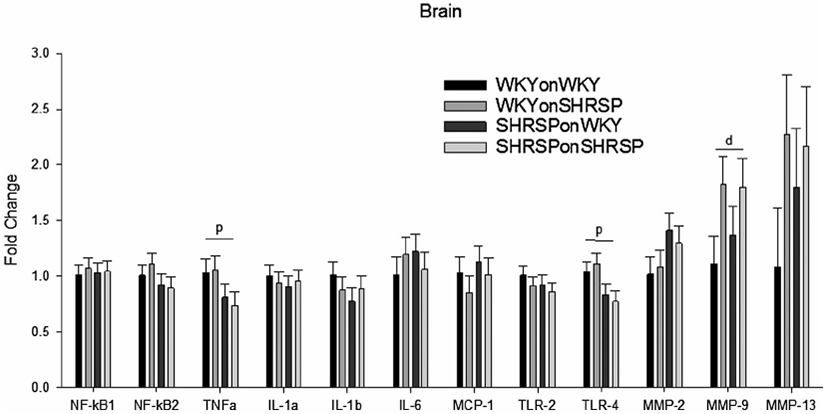
Fold change in message in brain (compared to WKYonWKY) for the four groups of rats in the cross fostering study. Data were analyzed using two-way ANOVA with post hoc Holm-Sidak test where appropriate. Significant main effect (P < .05) for offspring (p) or fostering dam (d) (N = 6 per group) demonstrating that the offspring alone or the fostering dam alone significantly altered the message independent of other variables.
Figure 5A shows immunofluorescence of macrophages (red) in the distal ileum using the F4/80 antibody. Note the increased red fluorescence in the lamina propria of villi from SHRSPonSHRSP compared to WKYonWKY, WKYonSHRSP, and SHRSPonWKY. The bar graph (Figure 5B) demonstrates that macrophages occupy approximately five-fold more area per villi in SHRSPonSHRSP compared to all other groups (P = .009). Moreover, fostering WKY rats on SHRSP dams did not enhance macrophages in the distal ileum. There were no differences in the number of T cells (CD3) between groups (two-way ANOVA, N = 4/group, data not shown).
FIGURE 5.

A, Macrophages (Red) as detected by the F4/80 antibody in villi of the distal ileum. Blue = DAPI stain for nuclei. B, Quantitative assessment of macrophages in WKY and SHRSP with different fostering strains. The fluorescence images were quantitated as the number of red pixels (macrophages) normalized to the total number of pixels in the villi. Data were analyzed using two-way ANOVA showing significant effect of the offspring strain P = .026 (two-way ANOVA, N = 4/group); *P = significant effect in SHRSP fostered by SHRSP dam (*P = .009 compared to all other groups, Holm-Sidak post hoc)
Supplemental Figure VIIA shows Alcian blue stain of goblet cells, the cells responsible for secreting the protective mucus layer, in the distal ileum from the four groups of rats in the cross fostering protocol. The number of goblet cells per villus in SHRSPonWKY was significantly greater than that in WKYonWKY (P = .017), but in SHRSPonSHRSP the number of goblet cells was significantly decreased compared to that in SHRSPonWKY (P = .027, Supplemental Figure VIIB). The data are somewhat confusing since the goblet cell count was never decreased in SHRSP compared to WKY rats, as would be expected. Nevertheless, the strain of the foster dam significantly altered the goblet cell count. Data were analyzed using two-way ANOVA. There was a main effect of offspring strain (p, P = .026) and the strain of the dam (d, P = .013, N = 4 per group). The cross fostering protocol had no significant effects on the villi length or the thickness of the smooth muscle layer (data not shown).
3.3 ∣. The effects of cross fostering on SBP
Mean SBP in the four groups of rats from 10 to 20 weeks of age is shown in Figure 6. A three-way analysis of variance revealed there were significant effects of the offspring strain (P < .001), the strain of the foster dam (P < .001), and the age of the rat (P = .033). WKYonSHRSP showed a significant overall increase in SBP over the ages of 10 to 20 weeks compared to WKYonWKY (P = .014, bracket “b” in Figure 6). Moreover, SHRSPonWKY showed a significant overall decrease in SBP compared to SHRSPonSHRSP (P < .001, bracket “a” in Figure 6). The asterisks represent significant decreases in SBP at individual time points in SHRSPonWKY at 16, 18, and 20 weeks compared to SHRSPonSHRSP (**P = .001 and *P < .05). Overall our data shows that SBP can be manipulated by the strain of the fostering dam; rats fostered on a WKY dam show decreased SBP, and rats fostered on an SHRSP dam show a slightly increased SBP.
FIGURE 6.
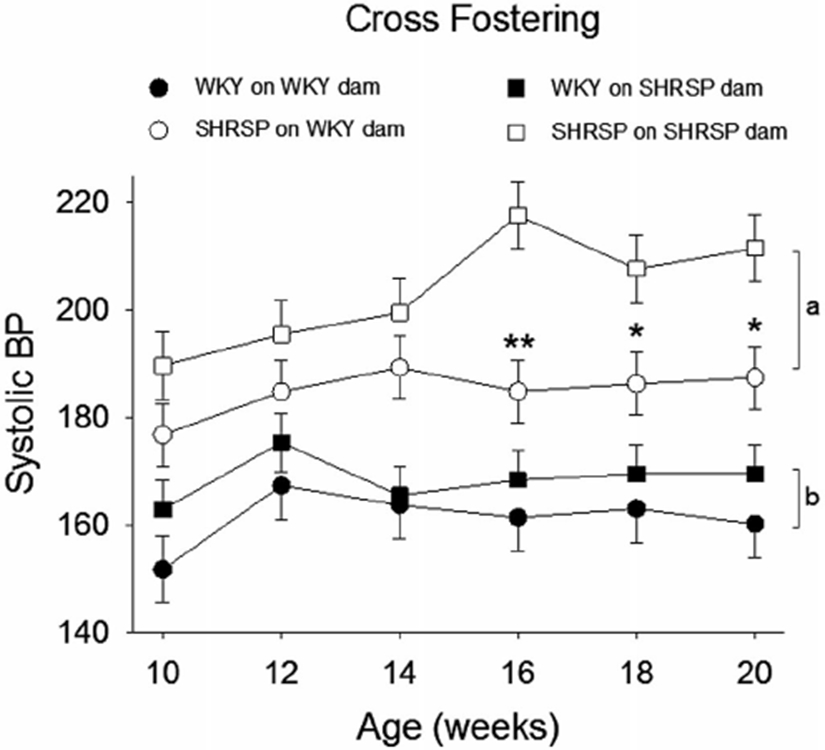
The effects of cross fostering on systolic blood pressure (SBP). Three-way ANOVA revealed significant differences for offspring strain (P < .001), strain of fostering dam (P < .001), age (P = .033), and a significant interaction between offspring strain and strain of foster dam (P = .021) (N = 6/group). Holm-Sidak post hoc Analysis showed a significant difference between WKYonWKY and WKYonSHRSP (bracket “b,” P = .014), SHRSPonWKY and SHRSPonSHRSP (bracket “a,” P < .001), and individual point differences between SHRSPonSHRSP and SHRSPonWKY (**P = .001 and *P < .05)
3.4 ∣. The effects of cross fostering on gut and BBB integrity
Zonulin, a marker for gut permeability, was significantly increased ~25% in plasma of SHRSP offspring (Figure 7, P = .008 significant main effect for strain of rat) indicating the loss of gut barrier integrity. In addition, plasma zonulin was significantly increased in SHRSPonWKY compared to WKYonWKY (*in Figure 7, P = .003, Holm-Sidak method). Plasma zonulin increased by 14% in WKYonSHRSP compared to WKYonWKY; however, this increase did not reach statistical significance. The only conclusion that we can draw is that SHRSP offspring had increased gut permeability compared to WKY offspring, regardless of the strain of the foster dam. Thus, we did not find a statistically significant effect of the strain of the foster dam.
FIGURE 7.
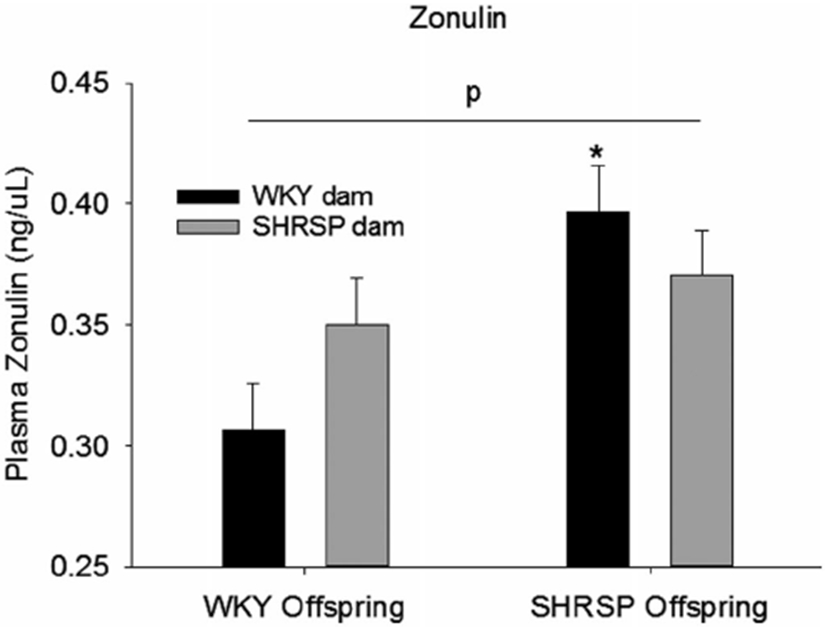
Plasma zonulin, a marker for the gut barrier integrity, in the four groups of rats in the cross fostering protocol. Data were analyzed using two-way ANOVA with post hoc Holm-Sidak test where appropriate; p = significant effect of pup strain independent of the strain of the fostering dam (P = .008, two-way ANOVA, N = 6 per group); *P < .003 compared to WKYonWKY (post hoc Holm-Sidak method)
The effects of the foster dam on BBB integrity is shown in Figure 8A and B. In preliminary studies using Immunohistochemistry, we determined that perfusion efficiently flushed blood, and thus IgG, from the luminal space. IgG, which should be primarily confined to the luminal space with an intact BBB (ie, WKYonWKY). SHRSPonSHRSP showed parenchymal IgG to be 4.5-fold greater than in WKYonWKY. Fostering WKY rats on SHRSP dam had no significant effect on the BBB integrity; however, fostering SHRSP on WKY dams significantly improved BBB integrity. A two-way analysis of variance revealed a significant effect of theoffspring strain (p, P < .001) and a significant effect of the foster dam (d, P=0.025). Fostering an SHRSP on a WKY dam improved BBB integrity in SHRSP by ~50%.
FIGURE 8.
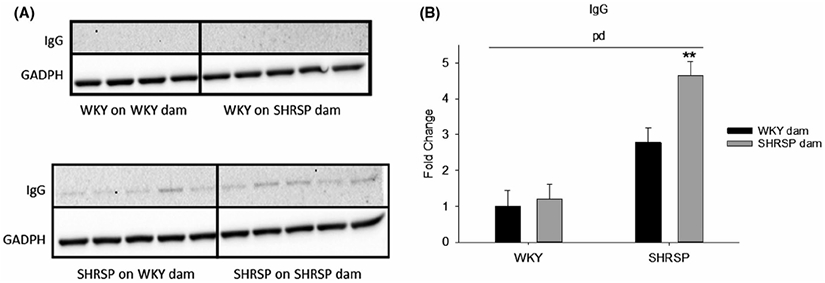
A, Western blot of IgG in brain parenchymal tissues, a measure of BBB integrity, in the four groups of rats in the cross fostering protocol. GADPH is the loading control. B, The quantitative assessment of Western blots shown in “A” using two-way ANOVA. Two-way ANOVA revealed a significant effect of both the offspring strain (p, P < .001) and the strain of the fostering dam (d, P = .025). **P = .005 and <.001 compared to SHRSPonWKY and WKYonSHRSP, respectively, using post hoc Holm-Sidak (n = 4-5)
It is possible that the enhanced integrity of the BBB in SHRSPonWKY was a result of decreasing the SBP. To determine if this could be the case, we plotted BBB permeability (ie, normalized IgG density) against SBP (Figure 9). Note the lack of correlation (P = .755 for SHRSPonWKY and 0.673 SHRSPonSHRSP, adjusted R2 = 0.000 for both groups), indicating no relationship between SBP and BBB integrity. Protection of the BBB produced when SHRSP were fostered on WKY dams cannot be explained by SBP alone and other factors are required to explain BBB protection in SHRSPonWKY.
FIGURE 9.
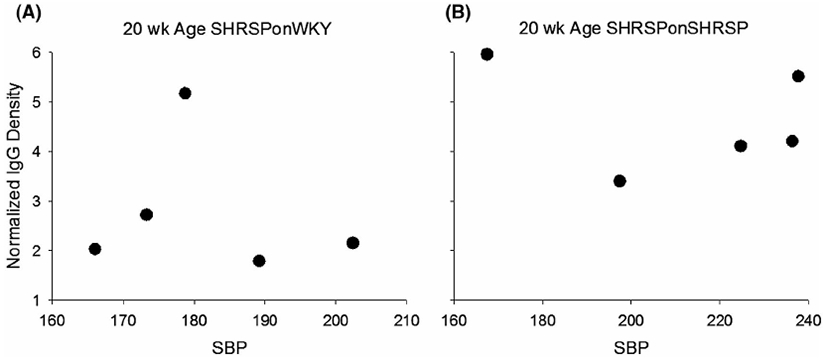
Lack of relationship between systolic blood pressure (SBP) and Normalized density of IgG in parenchymal tissues, a measures of BBB integrity for SHRSPonWKY A, and SHRSPonSHRSP B, at 20 weeks of age indicating that BBB integrity was not related to SBP. Adjusted R2 = 0.000 for both A (P = .755) and B (P = .673), Pearson Product Moment Correlation
Figure 10A shows immunofluorescent images of microglia/macrophage (IBA-1, green) in the corpus callosum, a white matter structure beneath the cortex, in the four groups of rats in the cross foster protocol. The corpus callosum is between the two dashed lines in each of the images. Note the reduced IBA-1 fluorescence in the corpus callosum of the WKYonWKY (top left panel) compared to the fluorescence in SHRSPonSHRSP (bottom right panel). Figure 10B shows a quantitation of the % area of the corpus callosum consisting of microglia/ macrophage (left panel) and the number of microglia/ macrophage cell bodies per unit area in the corpus callosum (right panel). Note the relative increase in microglia area in SHRSPonSHRSP compared to the other three groups in the cross fostering study. The increased proliferation of microglia and/or influx of macrophages is indicative of a heightened inflammatory response. Figure 10B right panels shows a significant main effect for the foster dam (two-way ANOVA, P = .022) on microglia/ mm2 indicating that the foster dam altered the number of microglia per unit area independent of the strain of the pup.
FIGURE 10.

A, shows immunofluorescent images of microglia/macrophage (IBA-1, green) in the corpus callosum, a white matter structure beneath the cortex. Blue is DAPI staining for the nucleus. The corpus callosum is between the two dashed lines in each of the images. (10B, left panel) The % area of the corpus callosum consisting of microglia in the four groups used in the cross fostering study. Two-way ANOVA revealed a significant main effect for the strain of the pup (P = .008), a significant interaction between the pup strain and the strain of the foster dam (P = .044). *P = .013 compared to SHRSPonWKY and P = .002 compared to WKYonSHRSP. (10B, right panel) The number of microglia/macrophage cell bodies per unit area in the corpus callosum for the four groups used in the cross fostering study. Two-way ANOVA revealed a significant main effect for the strain of the foster dam (P = .022)
4 ∣. DISCUSSION
In this study, we tested the hypothesis that the gut microbiome has a major role in the disruption of the BBB in the SHRSP, an animal model for hypertensive CSVD. For these studies, we utilized SHRSP, a genetic rat model that mimics the onset of CSVD-like symptoms similar to those in humans.4,21,22 Given that SHRSPs develop hypertension, beginning at 7-8 weeks of age, the model is considered one of hypertensive CSVD.1-3 Hypertension in SHRSP matures at ~15 weeks of age and overt signs of CSVD (microbleeds, white matter lesions, and circling) often begin at 40-50 weeks of age19,21,26; however, the age when brain lesions occur can vary with the sub-strain of the SHRSP or whether the SHRSP were on a high salt diet.19
The data support the validity of this hypothesis, at least as it applies to the SHRSP animal model for CSVD. We find that altering the gut microbiome to be more WKY-like in SHRSPs shortly after birth reduced inflammation in the gut (Figures 3 and 5), decreased MMP-9 gene expression in brain (Figure 4), decreased SBP (Figure 6), improved BBB integrity (Figure 8), and attenuated microglia activation (Figure 10). Loss of BBB integrity is a marker for impending CSVD symptoms since it typically precedes overt tissue damage by a month or more in the SHRSP.21 If this finding in SHRSPs is translatable, then dietary choices throughout life could delay the onset or reduce the severity of CSVD in humans as they age.
4.1 ∣. Cross-fostering model for altering gut microbiome
Our first goal was to evaluate the efficacy of the cross fostering. Ideally, when an SHRSP offspring is fostered on a WKY dam, its gut microbiota would be identical to the microbiota of a WKY fostered on a WKY dam. Similarly, when a WKY offspring is fostered on an SHRSP dam, its gut microbiota should ideally be identical to that of an SHRSP fostered on an SHRSP dam. Our studies revealed that we were partially successful in shifting the gut microbiome as desired. That is, some characteristics of the microbiota appear to be retained by the strain of the offspring into adult life (Figure 2A, horizontal shift on the PC1 axis). However, most importantly to our studies, some characteristics of the microbiota could be attributed to the strain of the foster dam: (A) vertical shift on the PC2 axis of rat groups fostered on WKY dams (Figure 2A) and (B) significant effect of the foster dam strain on the Firmicutes : Bacteroidetes abundance ratio (Figure 2B). While the cross fostering protocol did not completely shift the microbiome as desired, the shift was sufficient to affect the pathological changes occurring in SHRSP.
4.2 ∣. The SHRSP microbiome is toxic
The strain of the foster dam had significant effects on the expression of genes upregulated with inflammation in multiple tissues (Figures 3 and 4, supplemental Figures III & IV). For example, enhanced gene expression for IL-1α TLR-2, and IL-17 in ileum occurred as a result of fostering on an SHRSP dam. Enhanced expression for these genes is consistent with gut inflammation and IL-17 (most often considered pro-inflammatory although protective effects have been reported27) upregulation could be involved with endothelial dysfunction, cognitive impairment, and the onset of hypertension.28,29 Moreover, decreased expression of E-CAD and Muc-2, genes associated with gut integrity, resulted from fostering on an SHRSP dam. This decreased expression could act to impair the gut barrier. In brain, the enhanced expression of MMP-9, a gene also upregulated by the foster dam, represents the loss of BBB integrity and the onset of CSVD.30
Although this toxic effect of an SHRSP microbiome was more apparent in SHRSP, there was, nevertheless, a toxic effects in WKY rats. WKY rats showed small but significant effect of strain of the fostering dam on SBP (P = .014, Figure 6) and inflammatory markers especially in ileum (Figure 3). While the effects of the SHRSP microbiome in WKY rats is, therefore, toxic, it was not sufficient to affect the BBB integrity in WKYonSHRSP. Since the SHRSP microbiome was toxic in both strains but did not alter BBB integrity in the WKY, we conclude that an SHRSP microbiome alone is not sufficient to disrupt the BBB. Therefore, in order for the SHRSP microbiome to damage the BBB, there must be a genetic predisposition (ie, SHRSP strain) in addition to a toxic microbiome. However, this idea must be tempered by the fact that we only shifted the gut microbiome in WKY rats toward that of an SHRSP; we did not create a microbiome in WKYs that was identical to the microbiome in SHRSP.
4.3 ∣. The toxic nature of the SHRSP microbiota consists of complex changes to the community
We detected specific differences for each strain, but these differences varied with age of the rat. As with many other studies involving the gut microbiome,31 our data does not provide evidence for a single genera of bacteria or a group of identifiable bacteria in the SHRSP gut microbiome that is the basis for its toxic nature. This finding indicates that it is the complex changes of the entire community, and not just one or a few genera, that determines the toxicity. However, we cannot rule out the idea that toxicity of the microbiome involves specific differences in microbiota genera in the two strains at a critical developmental stage or at a critical age in the development of CSVD.
4.4 ∣. Role of hypertension in BBB disruption
In the SHRSP model, we did not attempt to separate the effects of hypertension from the BBB breakdown and thus, cannot dismiss the idea that hypertension had a role in the BBB disruption. However, the lack of correlation between SBP and BBB disruption (Figure 9) argues that loss of BBB integrity is more complex than simply a direct SBP effect. The lack of a cause and effect relationship between hypertension and BBB disruption is supported by other studies in the literature.21,26,32 While the microbiome may have an important role in BBB integrity by tempering hypertension, our results demonstrate that the effects derived from the microbiome in SHRSP is more complicated than a direct SBP effect.
4.5 ∣. Mechanism
Since the gut microbiota (WKY or SHRSP) in this study was the independent variable and the variable that is being controlled, any changes that occurred in either strain as a result of a SHRSP microbiome must involve the microbiota and the gut. Our data support that a source of inflammation for the onset of CSVD is the gut microbiome and the gut. An SHRSP microbiome would enhance inflammation in the gut and potentially enhanced translocation of bacterial toxins and bacteria themselves. The inflammation that was initially localized to the gut may become systemic, eventually reaching the brain. The exact mechanisms of how the gut microbiota influence the brain is not well understood, although communications could involve the blood and/or neural communications between the gut and brain (“microbiota-gut-brain axis”).33,34 Following stroke, pro-inflammatory T cells from a dysbiotic gut appear to migrate to the brain where they initiate or supplement neuroinflammation.35,36 We posit that a similar mechanism may play a role in the onset of CSVD.
In summary, we conclude that the gut microbiome has a major role in the onset and/or progression of CSVD in the SHRSP animal model. That is, the gut microbiome in SHRSPs is toxic compared to that of the WKY rat microbiome. In the WKY rats, an SHRSP-like microbiome enhanced inflammation in the gut and slightly, but significantly, increased SBP compared to a WKY-like microbiome. In the SHRSPs, an SHRSP-like microbiome not only enhanced inflammation in the gut and increased SBP, but it was also responsible for injury to the BBB compared to a WKY-like microbiome. As noted previously, the loss of BBB integrity is an early marker of the onset of CSVD-like symptoms.21 If our conclusions involving the onset of CVSD-like symptoms hold true for humans, then long-term dietary choices throughout life could delay the onset or reduce the severity of CSVD in humans as they age. If more short-term microbiome changes are protective, then dietary intervention could possibly slow the progression once CSVD has been initiated.
Supplementary Material
Funding information
Supported by R01 NS102594 (RMB), R01HL134838 (DJD), a grant from the American Heart Association (16SDG29970000, DJD), PHS grant DK56338 to the Texas Medical Center Digestive Disease Center (DJD), and the Integrative Molecular and Biomedical Sciences Graduate Program (T32 GM008231, JWN). Imaging was supported by the Integrated Microscopy Core at Baylor College of Medicine with funding from NIH (DK56338 and CA125123), CPRIT (RP150578 and RP170719), the Dan L. Duncan Comprehensive Cancer Center, and the John S. Dunn Gulf Coast Consortium for Chemical Genomics
Abbreviations:
- BBB
blood-brain barrier
- CSVD
cerebral small vessel disease
- F : B
Firmicutes : Bacteroidetes abundance ratio
- GAPDH
glyceraldehyde 3-phosphate dehydrogenase
- IgG
immunoglobulin G
- OTU
operational taxonomic unit
- SBP
systolic blood pressure
- SHRSP
spontaneously hypertensive stroke prone rat strain
- SHRSPonWKY
SHRSP pups fostered on WKY dams
- SHRSPonSHRSP
SHRSP pups fostered on SHRSP dams
- WKY
wistar Kyoto rat strain
- WKYonWKY
WKY pups fostered on WKY dams
- WKYonSHRSP
WKY pups fostered on SHRSP dams
Footnotes
CONFLICT OF INTEREST
There are no conflict of interest to report.
SUPPORTING INFORMATION
Additional supporting information may be found online in the Supporting Information section.
REFERENCES
- 1.Pantoni L Cerebral small vessel disease: from pathogenesis and clinical characteristics to therapeutic challenges. Lancet Neurol. 2010;9:689–701. [DOI] [PubMed] [Google Scholar]
- 2.Schmidtke K, Hull M. Cerebral small vessel disease: how does it progress? J Neurol Sci. 2005;229-230:13–20. [DOI] [PubMed] [Google Scholar]
- 3.Marini S, Anderson CD, Rosand J. Genetics of cerebral small vessel disease. Stroke. 2020;51:12–20. [DOI] [PMC free article] [PubMed] [Google Scholar]
- 4.Rosenberg GA, Wallin A, Wardlaw JM, et al. Consensus statement for diagnosis of subcortical small vessel disease. J Cereb Blood Flow Metab. 2016;36:6–25. [DOI] [PMC free article] [PubMed] [Google Scholar]
- 5.Wardlaw JM, Smith C, Dichgans M. Mechanisms of sporadic cerebral small vessel disease: insights from neuroimaging. Lancet Neurol. 2013;12:483–497. [DOI] [PMC free article] [PubMed] [Google Scholar]
- 6.Pasi M, Cordonnier C. Clinical relevance of cerebral small vessel diseases. Stroke. 2020;51:47–53. [DOI] [PubMed] [Google Scholar]
- 7.Ihara M, Yamamoto Y. Emerging evidence for pathogenesis of sporadic cerebral small vessel disease. Stroke. 2016;47:554–560. [DOI] [PubMed] [Google Scholar]
- 8.Bridges LR, Andoh J, Lawrence AJ, et al. Blood-brain barrier dysfunction and cerebral small vessel disease (arteriolosclerosis) in brains of older people. J Neuropathol Exp Neurol. 2014;73:1026–1033. [DOI] [PMC free article] [PubMed] [Google Scholar]
- 9.Sanchez-Rodriguez E, Egea-Zorrilla A, Plaza-Diaz J, et al. The gut microbiota and its implication in the development of atherosclerosis and related cardiovascular diseases. Nutrients. 2020;12:605. [DOI] [PMC free article] [PubMed] [Google Scholar]
- 10.Durgan DJ, Lee J, McCullough LD, Bryan RM Jr. Examining the role of the microbiota-gut-brain axis in stroke. Stroke. 2019;50:2270–2277. [DOI] [PMC free article] [PubMed] [Google Scholar]
- 11.Adnan S, Nelson JW, Ajami NJ, et al. Alterations in the gut microbiota can elicit hypertension in rats. Physiol Genomics. 2017;49:96–104. [DOI] [PMC free article] [PubMed] [Google Scholar]
- 12.Park AJ, Collins J, Blennerhassett PA, et al. Altered colonic function and microbiota profile in a mouse model of chronic depresssion. Neurogastroenterol Motil. 2013;25:733–e575. [DOI] [PMC free article] [PubMed] [Google Scholar]
- 13.Schrijver IA. Bacterial peptidoglycan and immune reactivity in the central nervous system in multiple sclerosis. Brain. 2001;124:1544–1554. [DOI] [PubMed] [Google Scholar]
- 14.Welling MM, Nabuurs RJ, van der Weerd L. Potential role of antimicrobial peptides in the early onset of Alzheimer's disease. Alzheimers Dement. 2015;11:51–57. [DOI] [PubMed] [Google Scholar]
- 15.Cryan JF, Dinan TG. Mind-altering microorganisms: the impact of the gut microbiota on brain and behaviour. Nat Rev Neurosci. 2012;13:701–712. [DOI] [PubMed] [Google Scholar]
- 16.Mayer EA, Knight R, Mazmanian SK, Cryan JF, Tillisch K. Gut microbes and the brain: paradigm shift in neuroscience. J Neurosci. 2014;34:15490–15496. [DOI] [PMC free article] [PubMed] [Google Scholar]
- 17.Sampson TR, Debelius JW, Thron T, et al. Gut Microbiota regulate motor deficits and neuroinflammation in a model of Parkinson's disease. Cell. 2016;167:1469–1480. [DOI] [PMC free article] [PubMed] [Google Scholar]
- 18.Tonomura S, Ihara M, Friedland RP. Microbiota in cerebrovascular disease: a key player and future therapeutic target. J Cereb Blood Flow Metab. 2020;40:1368–1380. [DOI] [PMC free article] [PubMed] [Google Scholar]
- 19.Brittain JF, McCabe C, Khatun H, et al. An MRI-histological study of white matter in stroke-free SHRSP. J Cereb Blood Flow Metab. 2013;33:760–763. [DOI] [PMC free article] [PubMed] [Google Scholar]
- 20.Yamori Y, Horie R. Developmental course of hypertension and regional cerebral blood flow in stroke-prone spontaneously hypertensive rats. Stroke. 1977;8:456–461. [DOI] [PubMed] [Google Scholar]
- 21.Bailey EL, Smith C, Sudlow CL, Wardlaw JM. Is the spontaneously hypertensive stroke prone rat a pertinent model of sub cortical ischemic stroke? A systematic review. Int J Stroke. 2011;6:434–444. [DOI] [PubMed] [Google Scholar]
- 22.Krafft PR, Bailey EL, Lekic T, et al. Etiology of stroke and choice of models. Int J Stroke. 2012;7:398–406. [DOI] [PMC free article] [PubMed] [Google Scholar]
- 23.Daft JG, Ptacek T, Kumar R, Morrow C, Lorenz RG. Cross-fostering immediately after birth induces a permanent microbiota shift that is shaped by the nursing mother. Microbiome. 2015;3:17. [DOI] [PMC free article] [PubMed] [Google Scholar]
- 24.Durgan DJ, Ganesh BP, Cope JL, et al. Role of the gut microbiome in obstructive sleep apnea-induced hypertension. Hypertension. 2016;67:469–474. [DOI] [PMC free article] [PubMed] [Google Scholar]
- 25.Ganesh BP, Nelson JW, Eskew JR, et al. Prebiotics, probiotics, and acetate supplementation prevent hypertension in a model of obstructive sleep apnea. Hypertension. 2018;72:1141–1150. [DOI] [PMC free article] [PubMed] [Google Scholar]
- 26.Bailey EL, Wardlaw JM, Graham D, Dominiczak AF, Sudlow CL, Smith C. Cerebral small vessel endothelial structural changes predate hypertension in stroke-prone spontaneously hypertensive rats: a blinded, controlled immunohistochemical study of 5- to 21-week-old rats. Neuropathol Appl Neurobiol. 2011;37:711–726. [DOI] [PubMed] [Google Scholar]
- 27.Weaver CT, Elson CO, Fouser LA, Kolls JK. The Th17 pathway and inflammatory diseases of the intestines, lungs, and skin. Annu Rev Pathol. 2013;8:477–512. [DOI] [PMC free article] [PubMed] [Google Scholar]
- 28.Faraco G, Brea D, Garcia-Bonilla L, et al. Dietary salt promotes neurovascular and cognitive dysfunction through a gut-initiated TH17 response. Nat Neurosci. 2018;21:240–249. [DOI] [PMC free article] [PubMed] [Google Scholar]
- 29.Toral M, Robles-Vera I, Visitación N, et al. Role of the immune system in vascular function and blood pressure control induced by faecal microbiota transplantation in rats. Acta Physiol (Oxf). 2019;e13285. [DOI] [PubMed] [Google Scholar]
- 30.Jalal FY, Yang Y, Thompson JF, Roitbak T, Rosenberg GA. Hypoxia-induced neuroinflammatory white-matter injury reduced by minocycline in SHR/SP. J Cereb Blood Flow Metab. 2015;35:1145–1153. [DOI] [PMC free article] [PubMed] [Google Scholar]
- 31.Kim MS, Kim Y, Choi H, et al. Transfer of a healthy microbiota reduces amyloid and tau pathology in an Alzheimer's disease animal model. Gut. 2020;69:283–294. [DOI] [PubMed] [Google Scholar]
- 32.Fredriksson K, Kalimo H, Westergren I, Kahrstrom J, Johansson BB. Blood-brain barrier leakage and brain edema in stroke-prone spontaneously hypertensive rats. Effect of chronic sympathectomy and low protein/high salt diet. Acta Neuropathol. 1987;74:259–268. [DOI] [PubMed] [Google Scholar]
- 33.Osadchiy V, Martin CR, Mayer EA. The gut-brain axis and the microbiome: mechanisms and clinical implications. Clin Gastroenterol Hepatol. 2019;17:322–332. [DOI] [PMC free article] [PubMed] [Google Scholar]
- 34.Fulling C, Dinan TG, Cryan JF. Gut microbe to brain signaling: what happens in vagus. Neuron. 2019;101:998–1002. [DOI] [PubMed] [Google Scholar]
- 35.Benakis C, Brea D, Caballero S, et al. Commensal microbiota affects ischemic stroke outcome by regulating intestinal gammadelta T cells. Nat Med. 2016;22:516–523. [DOI] [PMC free article] [PubMed] [Google Scholar]
- 36.Singh V, Roth S, Llovera G, et al. Microbiota dysbiosis controls the neuroinflammatory response after stroke. J Neurosci. 2016;36:7428–7440. [DOI] [PMC free article] [PubMed] [Google Scholar]
Associated Data
This section collects any data citations, data availability statements, or supplementary materials included in this article.