Abstract
Background:
Systemic lupus erythematosus (SLE) is an autoimmune disease characterized by multiple organ damage and the production of a variety of autoantibodies. The pathogenesis of SLE has not been fully defined, and it is difficult to treat. Our study aimed to identify candidate genes that may be used as biomarkers for the screening, diagnosis, and treatment of SLE.
Methods:
We used the GEO2R tool to identify the differentially expressed genes (DEGs) in SLE-related datasets retrieved from the Gene Expression Omnibus (GEO). In addition, we also identified the biological functions of the DEGs by gene ontology (GO) and Kyoto Encyclopedia of Genes and Genomes pathway enrichment analysis. Additionally, we constructed protein–protein interaction (PPI) networks to identify hub genes, as well as the regulatory network of transcription factors related to DEGs.
Results:
Two datasets were identified for use from the GEO (GSE50772, GSE4588), and 34 up-regulated genes and 4 down-regulated genes were identified by GEO2R. Pathway analysis of the DEGs revealed enrichment of the interferon alpha/beta signaling pathway; GO analysis was mainly enriched in response to interferon alpha, regulation of ribonuclease activity. PPIs were constructed through the STRING database and 14 hub genes were selected and 1 significant module (score = 12.923) was obtained from the PPI network. Additionally, 11 key transcription factors that interacted closely with the 14 hub DEGs were identified from the gene transcription factor network.
Conclusions:
Bioinformatic analysis is an effective tool for screening the original genomic data in the GEO database, and a large number of SLE-related DEGs were identified. The identified hub DEGs may be potential biomarkers of SLE.
Keywords: computational biology, genes, lupus erythematosus, systemic
1. Introduction
Systemic lupus erythematosus (SLE), a complex autoimmune disease that often involves multiple organ systems, is characterized by the production of a large number of autoantibodies, extensive deposition of immune complexes, and abnormalities of the innate and adaptive immune responses.[1] At present, the pathogenesis and detailed etiology of SLE remains unclear; as such, uncovering the potential molecular mechanisms and identifying reliable biomarkers is critical for early diagnosis and effective treatment, genetic deficiency in C1q is a strong susceptibility factor for SLE.[2] Current evidence suggests that mutations in single genes, such as TREX1, RNASEH2B, ADAR, IFIH1, and SAMHD1 contribute to the development of SLE, can induce chronic type I interferon responses, and are associated with SLE-like lesions. Nucleic acid degradation is associated with monogenic forms of lupus-like disease.[3,4] Additionally, thrombosis is often induced in the process of SLE. Targeted platelet therapy can help manage the disease group most affected by platelet dysfunction and improve the quality of life of these patients.[5] It has been reported that radiomonoclonal antibodies have been developed for tumor diagnosis and targeted radiotherapy.[6] Human studies provide evidence that SLE is a polygenic disease in both patients with SLE and SLE mouse models, and involves defects in many cellular signaling pathways that lead to increased survival of self-reactive cells.[7–10]
High-throughput sequencing and microarray technology have been widely used to screen genes critical to the initiation and progression of various diseases, including SLE. Despite the identification of hundreds of differentially expressed genes (DEGs) through various methods, no suitable biomarkers have been reported, which may be a result of varying experimental conditions and study populations. In addition, early studies on genetic factors in SLE focused mainly on the contribution of single genes. Transcription factors (TFs) also play an important role in the development of SLE; however, early studies on TFs were done by microarray have not been reported for SLE. Thus, the application of bioinformatics methods to re-analyze currently available transcriptome data to gain new insights is warranted to better understand the molecular mechanisms of SLE and to identify reliable biomarkers for disease diagnosis. At present, an increasing number of studies have reported that the interaction of multiple genes in the development of SLE is closely related to the incidence of disease and the involvement of multiple organ systems. Therefore, mining the available databases for potential biomolecular mechanism of SLE is of great value for disease screening and diagnosis, and may provide a new way to explore drug treatment targets. With the rapid development of gene chip and RNA sequencing technology, bioinformatic analysis can play an important role in the screening of candidate biomarkers in the research of many diseases.[11]
In this study, we aimed to identify the DEGs in SLE and the TF regulatory network associated with the DEGs from publicly available SLE-related datasets. Specifically, we downloaded 2 available databases, GSE50772 and GSE4588, and screened the DEGs by GEO2R. Gene ontology (GO) and Kyoto Encyclopedia of Genes and Genomes (KEGG) pathway enrichment analysis was also performed for the functional analysis of the DEGs. A protein–protein interaction (PPI) network of the DEGs was constructed by STRING and was visualized by Cytoscape software. Furthermore, a gene-TF regulatory network of hub DEGs was constructed to assess the interactions between the TFs and hub DEGs. The workflow used in the present study is presented in Figure 1. In our study, 38 SLE DEGs and TFs of key genes were identified. We found that TRIM28 and EED functioned as transcription factors of the IFI gene family and regulated interferon inducible 44 like (IFI44L). Additionally, IFITM3 was highly expressed in SLE. Our study provides a new methodology to study the molecular mechanisms of SLE from the genomic level and explore potential early diagnostic markers and drug treatment targets. Bioinformatic analysis can provide new clues and core data for the research of DEGs and microRNAs (miRNAs) of diseases.
Figure 1.
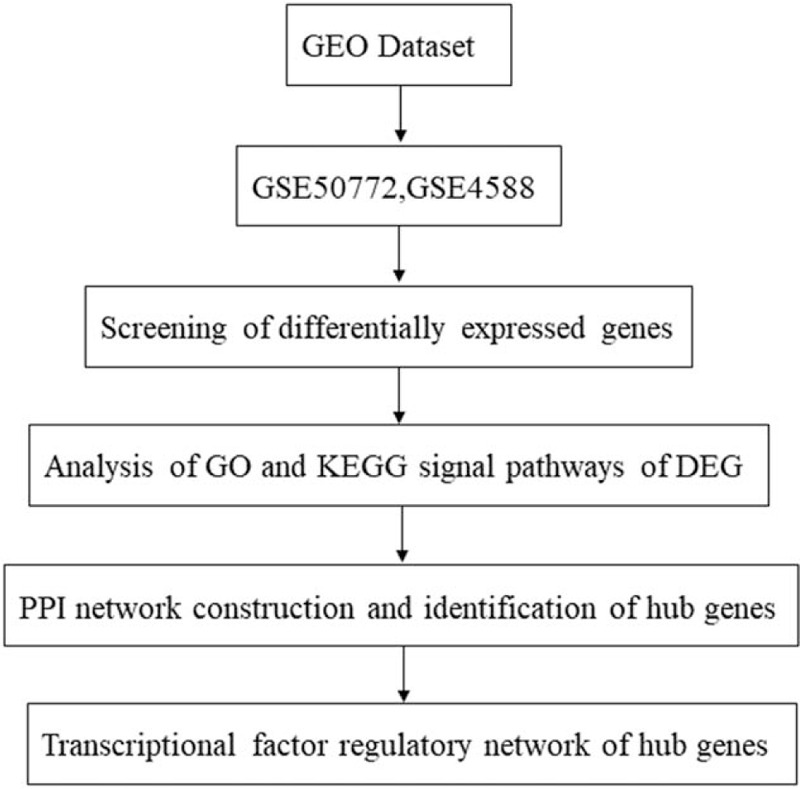
Flowchart of the bioinformatics methods used to analyze the SLE datasets.
2. Materials and methods
2.1. Microarray data information
A microarray search of GSE50772 and GSE4588 in SLE was conducted in the Gene Expression Omnibus (GEO) database (http://www.ncbi.nlm.nih.gov/geo/) with the keywords “SLE” or “Systemic lupus erythematosus.” The entry type was restricted to “series” and the organism was filtered by “Homo sapiens.” The criteria for inclusion were as follows:
-
(1)
patients diagnosed with SLE,
-
(2)
at least 20 healthy and SLE samples from peripheral blood mononuclear cells (PBMCs), and
-
(3)
the research subjects can only be humans, not animal models. The GSE50772 database contains 81 samples, including 20 control samples and 61 SLE patient samples.
The GSE4588 database contains 49 samples, including 23 control samples and 18 SLE patients. The remaining 8 rheumatoid arthritis samples were not selected in this study. No ethical approval was needed as this study is solely based on bioinformatic analysis.
2.2. Screening of differentially expressed genes
Using the GEO2R (http://www.ncbi.nlm.nih.gov/geo/geo2r) online data analysis tool to compare the gene expression of the healthy control and SLE group, the original data was downloaded, the DEGs were screened, and the screening standard was set to P < .05 and |log 2 FC| > 1.0. After screening, the DEGs were regarded as the genes with significant differences in expression, and Sanger Box software (version 1.0.9) was used to draw the volcano plot of the DEGs. Heat maps were drawn using the web-based Morpheus tool (https://software.broadinstitute.org/morpheus/).
2.3. Analysis of GO and KEGG signal pathways of DEG
GO analysis is a common method for large-scale functional enrichment research. GO database can describe the standardized gene products from biological process, molecular functions, and cellular components. KEGG analysis is a widely used database which stores a large number of data about the genome, biological pathways, diseases, chemicals, and drugs. We used Metascape (http://metascape.org/) as a database annotation and visualization tool.
2.4. PPI network construction and identification of hub genes
We constructed PPI networks to analyze protein interaction information and further identify hub genes. The results showed that the interaction between protein and protein was significant. Then, the PPI network retrieved from the STRING database was visualized using the Cytoscape software (version 3.7.2, http://www.cytoscape.org/). Then, according to the interaction pair information, the PPI network was constructed and visualized by Cytoscape software. The Cytoscape plug-in Network Analyzer was used for further analysis, and the topological properties of the PPI network and node degree were calculated to search for hub genes from the PPI network. Subsequently, Molecular Complex Detection (MCODE) analysis in Cytoscape was performed to screen the significant modules of PPI network. A degree cutoff = 2, node score cutoff = 0.2, and K-Core = 2 were set in the advanced options.
2.5. Transcription factor regulatory network of hub genes
Network Analyst, an online visual tool based on network gene expression profile analysis, can comprehensively analyze the functional pathway of hub genes and the effect of TFs on gene expression. In this study, we used the network analysis database to predict the TFs of hub genes, and constructed the TF regulatory network of genes, used Cytoscape software and Network Analyst to visualize the results (http://www.networkanalyst.ca/faces/home.xhtml).
3. Results
3.1. Identification of the DEGs of SLE
Using the GEO2R tool to analyze the sample data from GSE50772 and GSE4588 in the GEO public database, we constructed a volcanic plot (Fig. 2) of the expression of DEGs identified in GSE50772 and GSE4588 using the Sanger Box software (version 1.0.9). Each color point represents an up-regulated or down-regulated gene, wherein green represents the down-regulated genes, red represents the up-regulated genes, and black indicates the standard based on no differential gene expression. The selection criteria was set as a P value < .05 and |log 2 FC| > 1.0.
Figure 2.
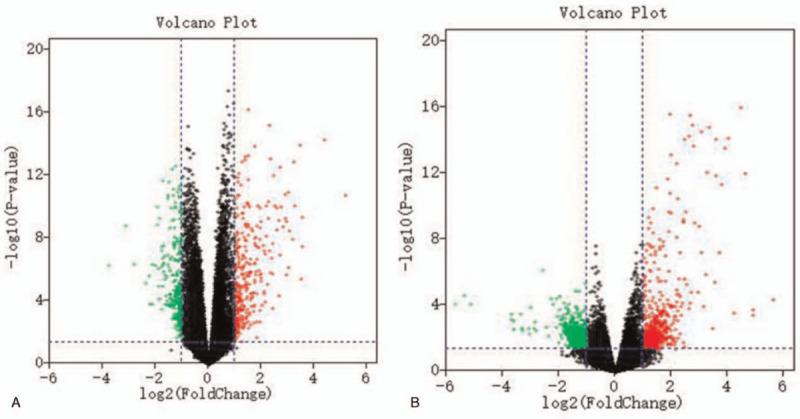
The volcanic plot of DEGs in the microarray of GSE50772 (a) and GSE4588 (b). Red indicates up-regulated genes, green indicates down-regulated genes, and black indicates genes with P value > .05 and |log 2FC| < 1.0. DEGs = differentially expressed genes.
In total, 307 up-regulated and 281 down-regulated genes were identified from GSE50772, and103 up-regulated and 24 down-regulated genes were identified from GSE4588. The top 100 important genes from the heat maps of GSE50772 and GSE3588 of DEGs are shown in Figure 3. Cluster analysis showed that there were differences in the DEGs between the control group and the SLE group. Venn diagram analysis showed that 34 up-regulated genes and 4 down-regulated genes overlapped in GSE50772 and GSE12452 (Fig. 4). These results are also listed by significance in the gene table (Table 1). The 38 overlapping genes were identified as candidate genes for further analysis.
Figure 3.
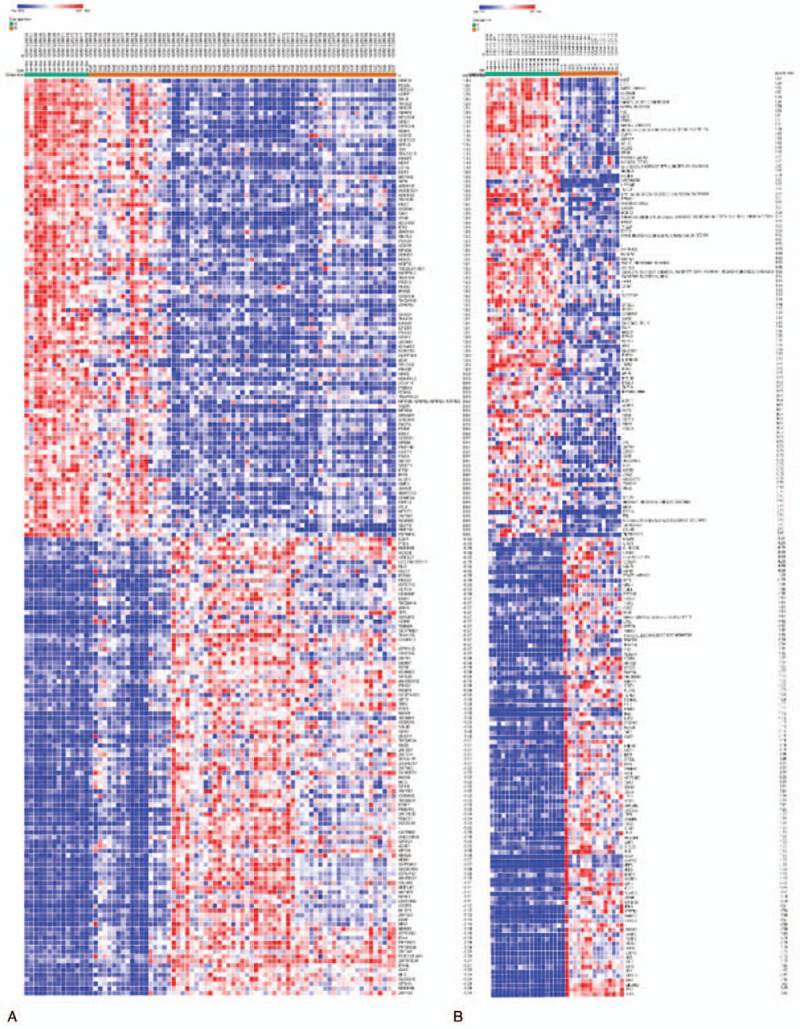
Heat map of the top 100 DEGs in the GSE50772 (a) and GSE4588 (b) datasets. Gene expression levels are indicated by colors as shown by the row, in which red represents high expression level and blue represents low expression level. DEGs = differentially expressed genes.
Figure 4.
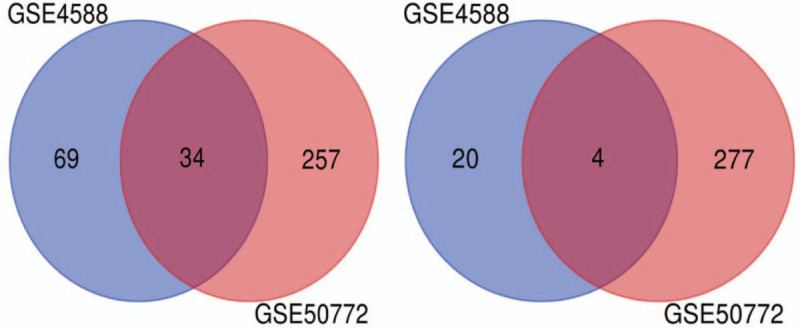
Venn diagram of the 34 up-regulated and 4 down-regulated DEGs in common between the 2 datasets. DEGs = differentially expressed genes.
Table 1.
Differential expression genes of 38 SLE patients were screened from GSE50772 and GSE 4588 microarrays.
| DEGs | Genes symbol |
| Down-regulated (4) | EIF1AY, TTTY15, DDX3Y, RPS4Y1 |
| Up-regulated (34) | HERC5, OAS3, DTL, OAS1, RSAD2, MX1, IFITM3, LY6E, LGALS3BP, CMPK2, IFI, SIGLEC1, USP18, IFI44L, TYMS, IFIT1, LAMP3, MELK, SPATS2L, EPSTI1, XIST, OTOF, RRM2, PARP9, TAP1, CDC45, OASL, C1QB, GINS2, IFI44, ISG15, IFIT3, IFIT2, IFI27 |
DEGs = differentially expressed genes; SLE = systemic lupus erythematosus.
3.2. Functional and pathway enrichment analysis of the DEGs
GO functional analysis and KEGG pathway enrichment analysis of the candidate DEGs were performed based on the Metascape database. Terms or pathways with a P-value < .01, min overlap genes = 3, and min enrichment factor > 1.5 were set as the cutoff criteria. There were 4 terms and 2 pathways involved in the enrichment analysis of the DEGs, indicating that these DEGs were mainly enriched in response to virus infection, regulation of ribonuclease activity, response to interferon alpha, and mitochondrion organization. A previous study by Monti and Montecucco found that response to virus and response to interferon alpha is strongly correlated with SLE progression.[12]
In addition, these enrichment terms are closely connected with each other and are integrated into a complete network (Fig. 5b). The results of the KEGG enrichment analysis are also shown in Fig. 5a. Two significantly enriched pathways, interferon alpha/beta signaling, and ISG15 antiviral mechanism were identified as being associated with the DEGs, suggesting that these signaling pathways have important significance for the pathogenesis of SLE.[24]
Figure 5.
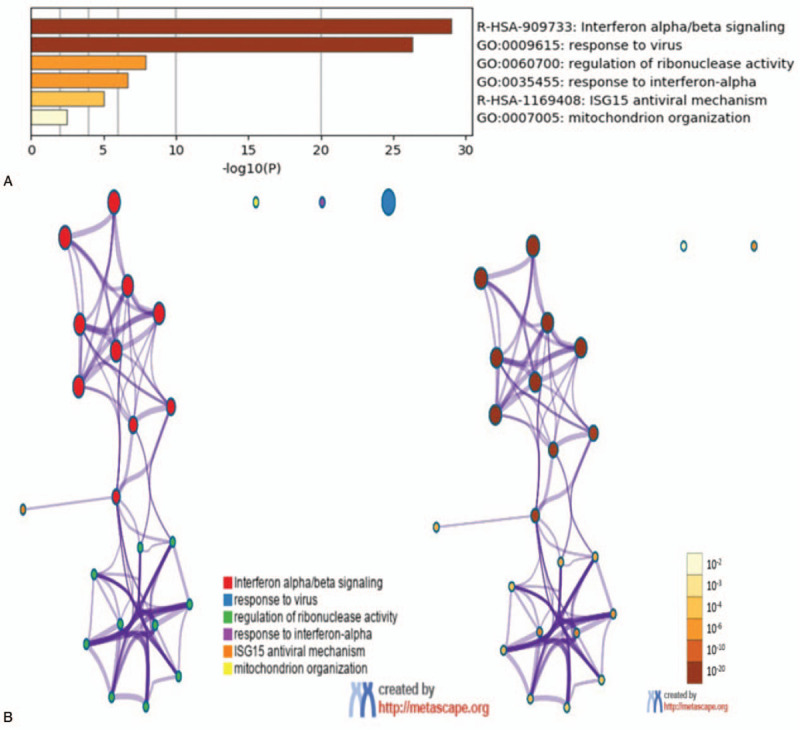
Two significantly enriched pathways, interferon alpha/beta signaling, and ISG15 antiviral mechanism were identified as being associated with DEGs. DEGs = differentially expressed genes.
3.3. PPI network construction and identification of hub genes
The candidate DEGs were uploaded to the STRING online tool to obtain PPI information, and the results of the PPI analysis were visualized (Fig. 6a) and analyzed with Cytoscape (Fig. 6b). A total of 33 of the 38 shared DEGs were filtered into the DEG PPI network complex, which contained 34 nodes and 97edges (criteria of filtering degree ≥10).
Figure 6.
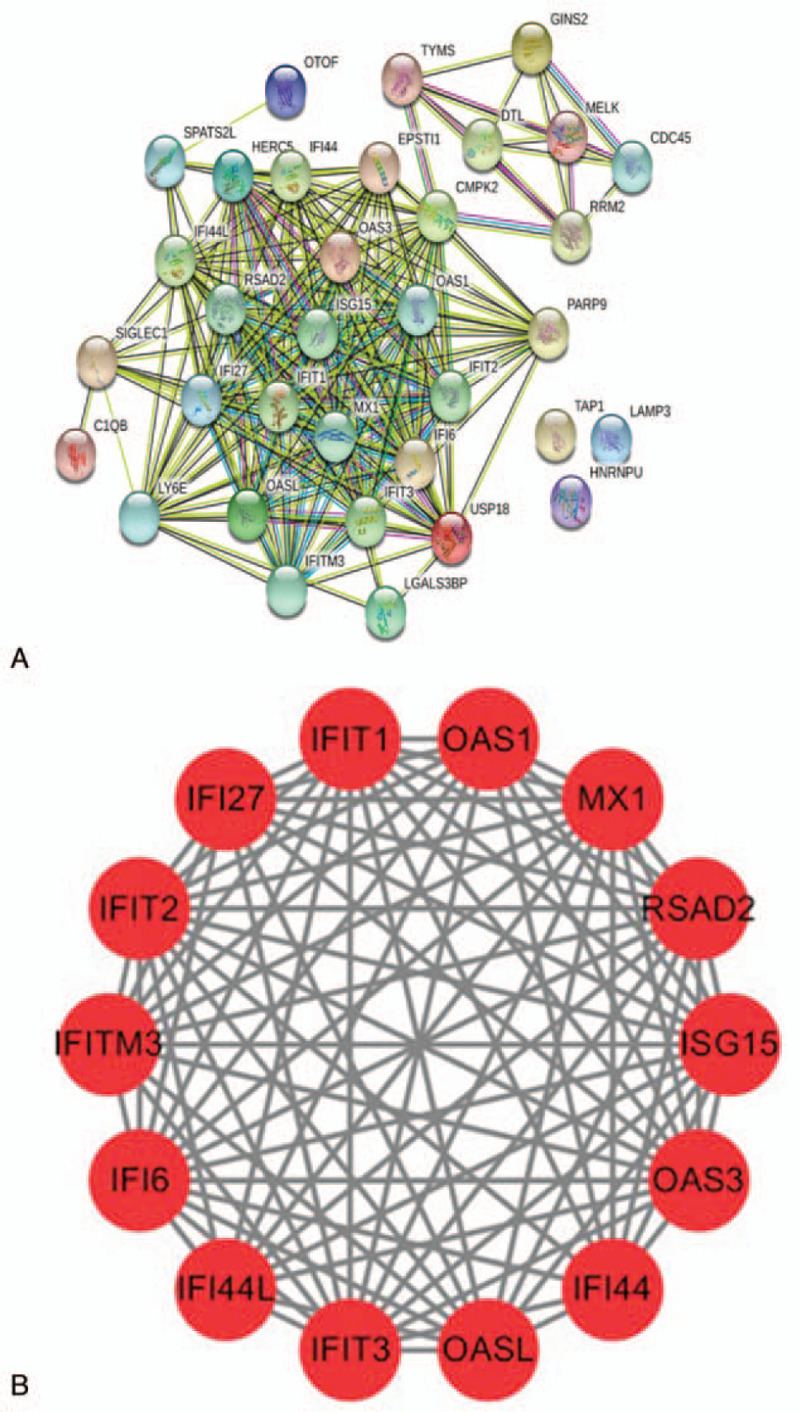
The protein–protein interaction (PPI) networks of the DEGs. (a) The PPI network with a total of 152 DEGs. The color represents the degree of the nodes. (b) The model PPI network was identified according to the Molecular Complex Detection scores (MCODE score = 12.923). DEGs = differentially expressed genes; MCODE = Molecular Complex Detection.
3.4. Module analysis
Based on the MCDODE analysis of cell morphology, 4 important modules were obtained from the PPI network. We selected the most important module (MCODE score = 12.923) for further analysis (Fig. 6b). This module includes 14 nodes (OAS1, IFI27, RSAD2, IFIT2, ISG15, OAS3, IFITM3, IFIT1, IFIT3, OASL, Myxovirus resistance protein 1, IFI44L, IFI6, and IFI44) and 84 edges, and these genes were the hub DEGs we identified. Functional enrichment analysis showed that this PPI module was significantly enriched in interferon alpha/beta signaling, response to virus, and mitochondrion organization.
3.5. Transcriptional factor regulatory network analysis of hub DEGs
For the 14 central genes identified, we constructed a TF regulatory network of 57 interacting pairs, 14 genes, and 9 TFs (Fig. 7). For example, IFIT1 was found to be regulated by 11 TFs, IFI6 was regulated by 6TFs, IFI44L was regulated by 2TFs, and RSAD2 was regulated by 3 TFs. In addition, we also found that a number of TFs can regulate more than 1 hub gene; 9 TFs were identified as having a regulatory gene connectivity of ≥1 network, suggesting that these TFs have close interactions with the hub DEGs (Table 2). For example, IRF1 was predicted to regulate IFIT2, IFI6, ISG15, IFIT3, IFIT1, OAS3, IFITM3, and RSAD2; hepatoma derived growth factor (HDGF) was predicted to regulate both IFI6, ISG15, OAS3, and IFITM3; and EED was predicted to regulate IFI44L, IFIT3, and IFIT2. Leung et al found that prolactin can activate IRF1, which is a TF involved in SLE and interferon response.[13]
Figure 7.
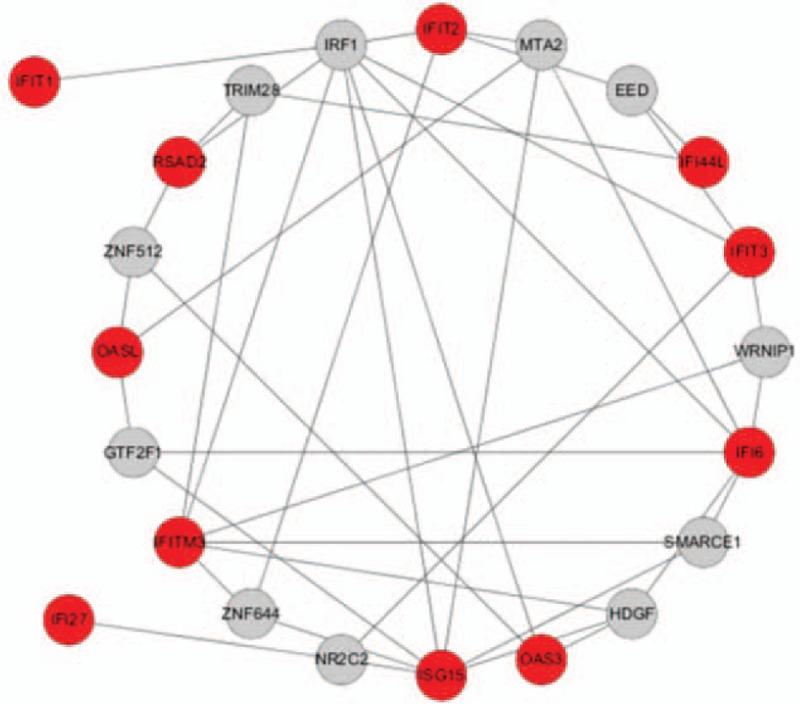
The transcription factors of hub genes. A red node indicates the hub gene and a gray node indicates the transcription factor.
Table 2.
Transcription factor analysis of key differentially expressed genes.
| TFs | Genes | Count |
| IRF1 | IFIT2, IFI6, ISG15, IFIT3, IFIT1, OAS3, IFITM3, RSAD2 | 8 |
| HDGF | IFI6, ISG15, OAS3, IFITM3 | 4 |
| MTA2 | OASL, IFIT2, IFI6 | 3 |
| NR2C2 | ISG15, IFIT3, IFI27 | 3 |
| ZNF644 | ISG15, IFITM3, IFIT2 | 3 |
| WRNIP1 | IFI6, FITM3, IFIT3 | 3 |
| SMARCE1 | IFI6, FITM3, ISG15 | 3 |
| GTF2F1 | IFI6, OASL, ISG15 | 3 |
| ZNF12 | OASL, OAS3, RSAD2 | 3 |
| TRIM28 | IFITM3, RSAD2, IFI44L | 3 |
| EED | IFI44L, IFIT3, IFIT2 | 3 |
HDGF = hepatoma derived growth factor; TFs = transcription factors.
4. Discussion
SLE is a common autoimmune disease, and common infections have become the leading cause of death in patients with SLE. Recently, an increasing number of studies have used microarray data profiling to elucidate the pathogenesis of SLE.[14,15] The GEO database is a large database established and maintained by the National Biotechnology Information Center of the United States. It contains high-throughput genomic data information uploaded by many research institutions around the world, but a large number of data has not been fully mined.[16] Such a situation also exists in the study of SLE-related genomic data. Due to the limitations of research purposes and sample inclusion independence, a large amount of genomics data has not been vertically or horizontally compared.[16,17] Effective biomarkers can provide accurate treatment options and prognosis for diseases. In the diagnosis of multiple sclerosis, surfaced-enhanced Raman spectroscopy characterizes tissues and cells by recognizing molecular chemical composition, which has significant differences or similarities in potential tumor markers or diagnosis.[18,19]
Based on this, using bioinformatics methods to analyze the gene chip and RNA sequencing data of clinical studies, we can screen the core markers of diseases and identify the potential biomarkers critical for the process of disease development. Gene therapy and molecular targeted therapy have become increasingly important in the clinical treatment of diseases. In this study, the gene chip expression profiles from 2 SLE studies (GSE50772, GSE4588) were analyzed using bioinformatic analysis, and a total of 38 DEGs were obtained, including 34 up-regulated genes and 4 down-regulated genes. According to the network topology parameters, 34 hub DEGs were obtained from the PPI network. Furthermore, 1 significant module with an MCODE score = 12.923 was screened from the PPI network, consisting of 14 hub DEGs. A number of early studies also applied bioinformatic analysis to SLE data to identify candidate genes as potential biomarkers for predicting the prognosis of patients with SLE. Yang et al analyzed the expression profiles of 3 SLE gene chips (GSE72509, GSE20864, and GSE39088) in the GEO database, and identified 4 hub genes, including RPL26L1, FBXW11, FOXO1, and SMAD7,[20] that play key roles in the pathogenesis and development of SLE. Additionally, the RIG-I-like receptor signaling pathway, antigen processing and presentation pathway, and p53 signaling pathway may be closely implicated in SLE pathogenesis.[20] In our study, we obtained 14 hub DEGs, all of which were all up-regulated in SLE. Functional and pathway enrichment analysis showed that the DEGs were mainly involved in functions related to responses to virus, regulation of ribonuclease activity, response to interferon alpha, and mitochondrion organization, and in the interferon alpha/beta signaling and ISG15 antiviral mechanism pathways. This has been proved to be the key to the treatment of SLE. In addition, through PPI analysis, these 14 hub DEGs were found to have a close relationship in SLE, and they are involved in key pathways in the biological process of SLE.
A large number of studies have shown that the expression level of interferon-induced genes is closely related to the pathogenesis of SLE. IFI6, IFI27, IFI44, IFI44L, IFIT1, IFIT2, IFIT3, and IFITM3 are interferon (IFN)-α-related genes. For example, IFI44L (interferon inducible 44-like) is an interferon-induced gene that is located on the same chromosome as the known antiviral gene.[23] The expression of the IFI44L gene can be up-regulated 33.33 times by IFN-α. Both IFI44L and IFIT3 are involved in the type I IFN signaling pathway, indicating that the type I IFN signaling pathway is closely related to the pathogenesis of SLE. Zhao et al showed that the level of DNA methylation of IFI44L in peripheral blood can be used to evaluate and diagnose SLE.[21] The specificity and sensitivity of IFI44L promoter methylation in differentiating SLE from healthy controls and other autoimmune diseases, such as rheumatoid arthritis and systemic sclerosis, are significantly better than the biomarkers currently in use. Additionally, many studies have shown that the cyclic GMP-AMP synthase (cGAS)-stimulator of interferon gene (STING) signaling pathway plays an important role in the pathogenesis of SLE.[21] Wang et al found that increased levels of IFIT3 in the monocytes of patients with SLE are correlated with the overactivation of the CGAs/sting signaling pathway. As a novel therapeutic target for SLE, reducing the level of IFIT3 may inhibit the activation of the CGAs/sting signaling pathway, thereby reducing the production of type I IFN and other proinflammatory cytokines.[22] Fan et al reported that IFI44L was significantly up-regulated in patients with SLE, and it was found that differences in the incidence of SLE based on sex were due to estrogen-induction on IFI44L.[24] RSAD2 is an important core gene in the type I interferon signaling pathway, and is involved in viral defense response and negative regulation of viral genome replication in the process of viral infection. However, the mechanism of RSAD2 in the pathogenesis of SLE remains unclear. Therefore, the study of RSAD2 expression in SLE is required to further elucidate the pathogenesis of SLE.[25,26]
OAS1, OAS2, and OASL are 3 subtypes of 2′5′—oligoadenylate synthetase (OAS). OAS is a type I IFN inducible enzyme with known antiviral functions.[30] The increase of OAS levels in peripheral blood lymphocytes of patients with SLE was observed in the early 1980s.[27] In previous array studies, we identified 3 subtypes of OAS, namely OAS1, OAS2, and OASL, that were up-regulated in the newly diagnosed active lupus cohort. In addition, there is sufficient evidence to suggest that when different types of interferons or different doses of the same type of interferon the stage of effector SLE.[28,29] The pattern of OAS subtype can provide useful information to distinguish the outbreak and infection of SLE and other studies have shown that OAS is associated with SLE, and several microarray studies of patients with SLE have been rediscovered to participate in the type I interferon pathway. Ye et al investigated the expression of OAS subtypes (OAS1, OAS2, and OASL) in patients with SLE to differentiate disease outbreak and infection.[30] It was found that the expression level of the OAS family, especially OAS2, was significantly higher in patients with SLE than that of healthy people and patients with non-SLE autoimmune disease.[31]
ISG15, a member of the Ub1 family, is a 17 kDa secreted protein that has significant sequence homology to ubiquitin.[32] ISG15 may induce the synthesis and secretion of IFN-γ from B-cell-depleted lymphocytes. It has been previously reported that ISG15 acts as a cytokine modulator in the immune response.[33,34] It has also been previously reported that IFN-α/IFN-γ may induce the activation of the JAK-STAT1 pathway, regulate proliferation and activation of immunocytes, and lead to the abnormal activation of the immune system, which may affect the occurrence and development of SLE.[35–37] Therefore, ISG15 may be involved in the abnormal immune response of SLE. ISG15 was also found to be highly expressed in patients with SLE and was related to the degree of disease activity before treatment. ROC curve analysis showed that ISG15 may be a new marker for the effective diagnosis of SLE.[38]
Myxovirus resistance protein 1 (Mx1) is one of the downstream targets of the type I IFN pathway and an important component of the early innate immune response.[39] Mx1 is a GTPase that inhibits the multiplication replication of several RNA viruses, including influenza virus, by association to viral nucleoprotein into ribonucleoprotein particles.[39,40] Overexpression of Mx1 promotes cell death triggered by endoplasmic reticulum stress in mouse-derived fibroblasts in the course of viral infection.[41] Mx1 was found in exosomes from bovine uterine glandular epithelial cells and regulates exosome secretion.[42] Moreover, Mx1 has been used as a marker of type I IFN signature in basic/translational studies.[43–45] However, there have been few studies that analyzed the protein levels of Mx1 in association with more critical and clinically important organ damage. Mx1 levels were up-regulated in the peripheral blood of patients with lupus even when their disease activities were stable. On the other hand, Mx1 was highly expressed in kidneys from patients with Lupus nephritis (LN) before treatment, which decreased after immunosuppressive treatment. These results suggest that Mx1 is a potential marker for the diagnosis of SLE in the peripheral blood and also for the activity of lupus nephritis in the kidney.
The interferon alpha/beta signaling pathway can produce interferon-induced IFI expression, whose expression can indirectly reflect the amount of interferon in serum. The gene expression products induced by IFN-α include OAS1, OAS2, OASL, IFIT1 (interferon-induced protein 1), IFIT4, LY6E, MX, and ISG15. Interferon was the first discovered cytokine and can be divided into 3 types, namely α, β, and γ, according to its source, physical and chemical properties, and biological activity. IFN-α is mainly produced by mononuclear phagocytes, IFN-β by fibroblasts, and IFN-γ by activated T cells and NK cells. IFN-α and IFN-β are also called type I IFNs, and IFN-γ is a type II IFN. Interferon I has antiviral, antitumor, and immunomodulatory effects, but its immunomodulatory effect is weaker than IFN-γ. The main function of type II interferons is to regulate the immune response and its antiviral and antitumor effects are weaker than that of type I interferons. Interferons mainly act on lymphocytes and monocytes, and play an increasingly prominent role in the pathogenesis of SLE. Some studies have shown that a large number of IFN-α cells are found in lymph node biopsy samples of patients with active SLE and it is believed that IFN-α cells play an important role in the pathogenesis of SLE.[46–48] Many authors believe that the imbalance of interferon, especially IFN-α, is a central cause of the immune abnormalities in SLE.[49–55] Microarray analysis of mononuclear cells in the peripheral blood of patients with SLE has revealed up-regulated expression of many IFN stimulating genes, which constituted a whole IFN signal.[56,57]
TFs are key gene expression regulators and are related to the development and progression of human diseases. In the current study, we also identified a number of TFs that have close interactions with the hub DEGs. Interferon regulatory factor 1 (IRF1) is a member of a family of transcription factors that regulates the expression of interferons. It is believed that the IFN system plays a key role in the pathogenesis of SLE. It is important to note that the overexpression of inflammatory bodies in lupus monocytes is significantly reduced after IRF1 knockout or inhibition.[58] In patients with SLE, long-term exposure to type I interferons causes monocytes to activate inflammation in an IRF-1-dependent manner. Inhibition of IRF-1 may be a new target for the treatment of SLE-related inflammation and organ damage.[59] HDGF is an acidic heparin-binding protein, which can promote the growth of the human hepatoma cell line, HuH7 Syntharin.[60] It is known that HDGF not only promotes the proliferation of endothelial cells, smooth muscle cells, and a variety of malignant tumor cells, but also promotes cell proliferation and migration, angiogenesis, antiapoptosis, and neurotrophic isobiological activity.[61–63]
5. Conclusion
In conclusion, 38 DEGs were identified from GSE50772 and GSE4588, including 34 up-regulated genes and 4 down-regulated genes. The analysis of the biological information in this study focuses on 2 data sets, comprising 43 healthy samples and 79 SLE samples. Therefore, the sample size is limited, and further investigation on a large sample size is needed to support the findings in this study. The 38s DEGs are mainly enriched in viral response, ribonuclease activity regulation, response to interferon alpha, and mitochondrion organization. KEGG enrichment analysis also showed that interferon alpha/beta signaling and ISG15 antiviral mechanism were 2 significantly enriched pathways, which are closely related to the occurrence of SLE. Key TFs, such as IRF1, are also closely related to the 14 hub DEGs in the TF gene network, suggesting that these hub DEGs may be potential biomarkers of SLE. However, further investigation on the biological functions and molecular mechanisms of these genes is required to understand their role in the development and progression of SLE.
Acknowledgments
We thank Prof. Jing Zhang (Medical College of Yan’an University, China) for the kind assistance. The authors thank AiMi Academic Services (www.aimieditor.com) for English language editing and review services.
Author contributions
Conceptualization: Yan Feng Wang.
Data curation: Yan Feng Wang, Qian Ma.
Formal analysis: Yan Feng Wang.
Funding acquisition: Zheng Hao Huo.
Investigation: Yan Feng Wang, Qian Ma.
Methodology: Yan Feng Wang, Qian Ma.
Project administration: Yan Feng Wang.
Resources: Yan Feng Wang, Qian Ma.
Software: Yan Feng Wang, Qian Ma.
Supervision: Qian Ma.
Validation: Yan Feng Wang.
Visualization: Yan Feng Wang, Zheng Hao Huo.
Writing – original draft: Yan Feng Wang.
Writing – review & editing: Yan Feng Wang.
Footnotes
Abbreviations: DEGs = differentially expressed genes, GEO = Gene Expression Omnibus, GO = gene ontology, HDGF = hepatoma derived growth factor, IFI44L = interferon inducible 44 like, IFN = interferon, KEGG = Kyoto Encyclopedia of Genes and Genomes, MCODE = Molecular Complex Detection, PPI = protein–protein interaction, SLE = systemic lupus erythematosus, TF = transcription factor.
How to cite this article: Wang Y, Ma Q, Huo Z. Identification of hub genes, pathways, and related transcription factors in systemic lupus erythematosus: A preliminary bioinformatics analysis. Medicine. 2021;100:25(e26499).
YW and QM contributed equally to this work.
This work was supported by the National Natural Science Foundation of China (31960195).
The authors have no conflicts of interest to disclose.
The datasets generated during and/or analyzed during the current study are available from the corresponding author on reasonable request. All data generated or analyzed during this study are included in this published article [and its supplementary information files]. The datasets generated during and/or analyzed during the current study are publicly available.
References
- [1].Ding X, Xiang W, He X. IFN-I mediates dysfunction of endothelial progenitor cells in atherosclerosis of systemic lupus erythematosus. Front Immunol 2020;11:11–581385. [DOI] [PMC free article] [PubMed] [Google Scholar]
- [2].Hosszu KK, Valentino A, Peerschke EI, Ghebrehiwet B. SLE: novel postulates for therapeutic options. Front Immunol 2020;11:583853.doi 10.3389/fimmu.2020.583853. [DOI] [PMC free article] [PubMed] [Google Scholar]
- [3].Lee-Kirsch MA, Gong M, Chowdhury D, et al. Mutations in the gene encoding the 3’-5’ DNA exonuclease TREX1 are associated with systemic lupus erythematosus. Nat Genet 2007;39:1065–7. [DOI] [PubMed] [Google Scholar]
- [4].Walter JE, Lo MS, Kis-Toth K, et al. Impaired receptor editing and heterozygous RAG2 mutation in a patient with systemic lupus erythematosus and erosive arthritis. J Allergy Clin Immunol 2015;135:272–3. [DOI] [PMC free article] [PubMed] [Google Scholar]
- [5].Nicoleau S, Wojciak-Stothard B. Beyond thrombosis: the role of platelets in pulmonary hypertension. SciMed J 2020;2:243–71. [Google Scholar]
- [6].Yavari K. Anti-angiogenesis therapy of cancer cells using 153Sm-bevasesomab. Emerg Sci J 2018;2:130–9. [Google Scholar]
- [7].Tsokos GC, Kammer GM. Molecular aberrations in human systemic lupus erythematosus. Mol Med Today 2000;6:418–24. [DOI] [PubMed] [Google Scholar]
- [8].Kotzin BL. Systemic lupus erythematosus. Cell 1996;85:303–6. [DOI] [PubMed] [Google Scholar]
- [9].Jørgensen TN, Gubbels MR, Kotzin BL. New insights into disease pathogenesis from mouse lupus genetics. Curr Opin Immunol 2004;16:787–93. [DOI] [PubMed] [Google Scholar]
- [10].Liu J, Karypis G, Hippen KL, et al. Genomic view of systemic autoimmunity in MRLlpr mice. Genes Immun 2006;7:156–68. [DOI] [PubMed] [Google Scholar]
- [11].Wang S, Cheng Q. Microarray analysis in drug discovery and clinical applications. Methods Mol Biol 2006;316:49–65. [DOI] [PubMed] [Google Scholar]
- [12].Monti S, Montecucco C. Can hydroxychloroquine protect patients with rheumatic diseases from COVID-19? Response to: ‘does hydroxychloroquine prevent the transmission of COVID-19?’ by Heldwein and Calado and ‘SLE, hydroxychloroquine and no SLE patients with COVID-19: a comment’ by Joob and Wiwanitkit. Ann Rheum Dis 2020;79:e62.doi 10.1136/annrheumdis-2020-217524. [DOI] [PubMed] [Google Scholar]
- [13].Leung YT, Maurer K, Song L, Convissar J, Sullivan KE. Prolactin activates IRF1 and leads to altered balance of histone acetylation: implications for systemic lupus erythematosus. Mod Rheumatol 2020;30:532–43. [DOI] [PubMed] [Google Scholar]
- [14].Wu C, Zhao Y, Lin Y, et al. Bioinformatics analysis of differentially expressed gene profiles associated with systemic lupus erythematosus. Mol Med Rep 2018;17:3591–8. [DOI] [PMC free article] [PubMed] [Google Scholar]
- [15].Labonte AC, Kegerreis B, Geraci NS, et al. Identification of alterations in macrophage activation associated with disease activity in systemic lupus erythematosus. PLoS One 2018;13:e0208132.doi: 10.1371/journal.pone.0208132. [DOI] [PMC free article] [PubMed] [Google Scholar]
- [16].Panahiazar M, Dumontier M, Gevaert O. Predicting biomedical metadata in CEDAR: a study of Gene Expression Omnibus (GEO). J Biomed Inform 2017;72:132–9. [DOI] [PMC free article] [PubMed] [Google Scholar]
- [17].Davis S, Meltzer PS. GEOquery: a bridge between the Gene Expression Omnibus (GEO) and BioConductor. Bioinformatics 2007;23:1846–7. [DOI] [PubMed] [Google Scholar]
- [18].Agsalda-Garcia M, Shieh T, Souza R, et al. Raman-enhanced spectroscopy (RESpect) probe for childhood non-Hodgkin lymphoma. SciMed J 2020;2:01–7. [DOI] [PMC free article] [PubMed] [Google Scholar]
- [19].Khorasgania MA, Nejad PM, Moghani MM, et al. Evaluation of mir-377-3p expression in patients with multiple sclerosis. SciMed J 2019;1:48–54. [Google Scholar]
- [20].Yang F, Zhai Z, Luo X, et al. Bioinformatics identification of key candidate genes and pathways associated with systemic lupus erythematosus. Clin Rheumatol 2020;39:425–34. [DOI] [PubMed] [Google Scholar]
- [21].Zhao M, Zhou Y, Zhu B, et al. IFI44L promoter methylation as a blood biomarker for systemic lupus erythematosus. Ann Rheum Dis 2016;75:1998–2006. [DOI] [PMC free article] [PubMed] [Google Scholar]
- [22].Wang J, Dai M, Cui Y, et al. Association of abnormal elevations in IFIT3 with overactive cyclic GMP-AMP synthase/stimulator of interferon genes signaling in human systemic lupus erythematosus monocytes. Arthritis Rheumatol 2018;70:2036–45. [DOI] [PubMed] [Google Scholar]
- [23].Nzeusseu Toukap A, Galant C, Theate I, et al. Identification of distinct gene expression profiles in the synovium of patients with systemic lupus erythematosus. Arthritis Rheum 2007;56:1579–88. [DOI] [PubMed] [Google Scholar]
- [24].Fan H, Zhao G, Ren D, Liu F, Dong G, Hou Y. Gender differences of B cell signature related to estrogen-induced IFI44L/BAFF in systemic lupus erythematosus. Immunol Lett 2017;181:71–8. [DOI] [PubMed] [Google Scholar]
- [25].Sezin T, Vorobyev A, Sadik CD, Zillikens D, Gupta Y, Ludwig RJ. Gene expression analysis reveals novel shared gene signatures and candidate molecular mechanisms between pemphigus and systemic lupus erythematosus in CD4+ T cells. Front Immunol 2018;8:1992.doi 10.3389/fimmu.2017.01992. [DOI] [PMC free article] [PubMed] [Google Scholar]
- [26].Kurokawa C, Iankov ID, Galanis E. A key anti-viral protein, RSAD2/VIPERIN, restricts the release of measles virus from infected cells. Virus Res 2019;263:145–50. [DOI] [PMC free article] [PubMed] [Google Scholar]
- [27].Preble OT, Rothko K, Klippel JH, et al. Interferon-induced 2′-5′ adenylate synthetase in vivo and interferon production in vitro by lymphocytes from systemic lupus erythematosus patients with and without circulating interferon. J Exp Med 1983;157:2140–6. [DOI] [PMC free article] [PubMed] [Google Scholar]
- [28].Yu F, Floyd-Smith G. Protein synthesis-dependent and -independent induction of p69 2′-5′-oligoadenylate synthetase by interferon-alpha. Cytokine 1999;11:744–50. [DOI] [PubMed] [Google Scholar]
- [29].Floyd-Smith G, Wang Q, Sen GC. Transcriptional induction of the p69 isoform of 2’,5’-oligoadenylate synthetase by interferon-beta and interferon-gamma involves three regulatory elements and interferon-stimulated gene factor 3. Exp Cell Res 1999;246:138–47. [DOI] [PubMed] [Google Scholar]
- [30].Ye S, Guo Q, Tang JP, Yang CD, Shen N, Chen SL. Could 2′5′-oligoadenylate synthetase isoforms be biomarkers to differentiate between disease flare and infection in lupus patients? A pilot study. Clin Rheumatol 2007;26:186–90. [DOI] [PubMed] [Google Scholar]
- [31].Grammatikos AP, Kyttaris VC, Kis-Toth K, et al. A T cell gene expression panel for the diagnosis and monitoring of disease activity in patients with systemic lupus erythematosus. Clin Immunol 2014;150:192–200. [DOI] [PMC free article] [PubMed] [Google Scholar]
- [32].Zuo C, Sheng X, Ma M, Xia M, Ouyang L. ISG15 in the tumorigenesis and treatment of cancer: an emerging role in malignancies of the digestive system. Oncotarget 2016;7:74393–409. [DOI] [PMC free article] [PubMed] [Google Scholar]
- [33].Recht M, Borden EC, Knight E, Jr. A human 15-kDa IFN-induced protein induces the secretion of IFN-gamma. J Immunol 1991;147:2617–23. PMID: 1717569. [PubMed] [Google Scholar]
- [34].Care MA, Stephenson SJ, Barnes NA, et al. Network analysis identifies proinflammatory plasma cell polarization for secretion of ISG15 in human autoimmunity. J Immunol 2016;197:1447–59. [DOI] [PMC free article] [PubMed] [Google Scholar]
- [35].Dong G, You M, Fan H, Ding L, Sun L, Hou Y. STS-1 promotes IFN-α induced autophagy by activating the JAK1-STAT1 signaling pathway in B cells. Eur J Immunol 2015;45:2377–88. [DOI] [PubMed] [Google Scholar]
- [36].Han C, Fu J, Liu Z, Huang H, Luo L, Yin Z. Dipyrithione inhibits IFN-gamma-induced JAK/STAT1 signaling pathway activation and IP-10/CXCL10 expression in RAW264.7 cells. Inflamm Res 2010;59:809–16. [DOI] [PMC free article] [PubMed] [Google Scholar]
- [37].Li J, Zhao S, Yi M, et al. Activation of JAK-STAT1 signal transduction pathway in lesional skin and monocytes from patients with systemic lupus erythematosus. Zhong Nan Da Xue Xue Bao Yi Xue Ban 2011;36:109–15. [DOI] [PubMed] [Google Scholar]
- [38].Yuan Y, Ma H, Ye Z, Jing W, Jiang Z. Interferon-stimulated gene 15 expression in systemic lupus erythematosus: diagnostic value and association with lymphocytopenia. Z Rheumatol 2018;77:256–62. [DOI] [PubMed] [Google Scholar]
- [39].Haller O, Kochs G. Human MxA protein: an interferon-induced dynamin-like GTPase with broad antiviral activity. J Interferon Cytokine Res 2011;31:79–87. [DOI] [PubMed] [Google Scholar]
- [40].Kochs G, Haller O. GTP-bound human MxA protein interacts with the nucleocapsids of Thogoto virus (Orthomyxoviridae). J Biol Chem 1999;274:4370–6. [DOI] [PubMed] [Google Scholar]
- [41].Numajiri Haruki A, Naito T, Nishie T, Saito S, Nagata K. Interferon-inducible antiviral protein MxA enhances cell death triggered by endoplasmic reticulum stress. J Interferon Cytokine Res 2011;31:847–56. [DOI] [PubMed] [Google Scholar]
- [42].Racicot K, Schmitt A, Ott T. The myxovirus-resistance protein, MX1, is a component of exosomes secreted by uterine epithelial cells. Am J Reprod Immunol 2012;67:498–505. [DOI] [PubMed] [Google Scholar]
- [43].Feng X, Wu H, Grossman JM, et al. Association of increased interferon-inducible gene expression with disease activity and lupus nephritis in patients with systemic lupus erythematosus. Arthritis Rheum 2006;54:2951–62. [DOI] [PubMed] [Google Scholar]
- [44].Kirou KA, Lee C, George S, Louca K, Peterson MG, Crow MK. Activation of the interferon-alpha pathway identifies a subgroup of systemic lupus erythematosus patients with distinct serologic features and active disease. Arthritis Rheum 2005;52:1491–503. [DOI] [PubMed] [Google Scholar]
- [45].Castellano G, Cafiero C, Divella C, et al. Local synthesis of interferon-alpha in lupus nephritis is associated with type I interferons signature and LMP7 induction in renal tubular epithelial cells. Arthritis Res Ther 2015;17:72.doi 10.1186/s13075-015-0588-3. [DOI] [PMC free article] [PubMed] [Google Scholar]
- [46].Rönnblom L, Alm GV. The natural interferon-alpha producing cells in systemic lupus erythematosus. Hum Immunol 2002;63:1181–93. [DOI] [PubMed] [Google Scholar]
- [47].Mohty M, Vialle-Castellano A, Nunes JA, Isnardon D, Olive D, Gaugler B. IFN-alpha skews monocyte differentiation into Toll-like receptor 7-expressing dendritic cells with potent functional activities. J Immunol 2003;171:3385–93. [DOI] [PubMed] [Google Scholar]
- [48].Hua J, Kirou K, Lee C, Crow MK. Functional assay of type I interferon in systemic lupus erythematosus plasma and association with anti-RNA binding protein autoantibodies. Arthritis Rheum 2006;54:1906–16. [DOI] [PubMed] [Google Scholar]
- [49].Theofilopoulos AN, Baccala R, Beutler B, Kono DH. Type I interferons (alpha/beta) in immunity and autoimmunity. Annu Rev Immunol 2005;23:307–36. [DOI] [PubMed] [Google Scholar]
- [50].Obermoser G, Pascual V. The interferon-alpha signature of systemic lupus erythematosus. Lupus 2010;19:1012–9. [DOI] [PMC free article] [PubMed] [Google Scholar]
- [51].Rönnblom L, Elkon KB. Cytokines as therapeutic targets in SLE. Nat Rev Rheumatol 2010;6:339–47. [DOI] [PubMed] [Google Scholar]
- [52].Niewold TB. Interferon alpha as a primary pathogenic factor in human lupus. J Interferon Cytokine Res 2011;31:887–92. [DOI] [PMC free article] [PubMed] [Google Scholar]
- [53].Rönnblom L, Alm GV, Eloranta ML. The type I interferon system in the development of lupus. Semin Immunol 2011;23:113–21. [DOI] [PubMed] [Google Scholar]
- [54].Lauwerys BR, Ducreux J, Houssiau FA. Type I interferon blockade in systemic lupus erythematosus: where do we stand? Rheumatology (Oxford) 2014;53:1369–76. [DOI] [PubMed] [Google Scholar]
- [55].Kirou KA, Gkrouzman E. Anti-interferon alpha treatment in SLE. Clin Immunol 2013;148:303–12. [DOI] [PubMed] [Google Scholar]
- [56].Bennett L, Palucka AK, Arce E, et al. Interferon and granulopoiesis signatures in systemic lupus erythematosus blood. J Exp Med 2003;197:711–23. [DOI] [PMC free article] [PubMed] [Google Scholar]
- [57].Baechler EC, Batliwalla FM, Karypis G, et al. Interferon-inducible gene expression signature in peripheral blood cells of patients with severe lupus. Proc Natl Acad Sci U S A 2003;100:2610–5. [DOI] [PMC free article] [PubMed] [Google Scholar]
- [58].Jianhua L, Celine C, Berthier J, et al. Enhanced inflammasome activity in systemic lupus erythematosus is mediated via type I interferon upregulation of interferon regulatory factor 1. Arthritis Rheumatol 2017;69:1840–9. [DOI] [PMC free article] [PubMed] [Google Scholar]
- [59].Reilly CM, Olgun S, Goodwin D, et al. Interferon regulatory factor-1 gene deletion decreases glomerulonephritis in MRL/lpr mice. Eur J Immunol 2006;36:1296–308. [DOI] [PubMed] [Google Scholar]
- [60].Nakamura H, Izumoto Y, Kambe H, et al. Molecular cloning of complementary DNA for a novel human hepatoma-derived growth factor. Its homology with high mobility group-1 protein. J Biol Chem 1994;269:25143–9. PMID: 7929202. [PubMed] [Google Scholar]
- [61].Chen Z, Qiu S, Lu X. The expression and clinical significance of HDGF in osteosarcoma. Onco Targets Ther 2015;8:2509–17. [DOI] [PMC free article] [PubMed] [Google Scholar]
- [62].Narron JV, Stoops TD, Barringhaus K, Matsumura M, Everett AD. Hepatoma-derived growth factor is expressed after vascular injury in the rat and stimulates smooth muscle cell migration. Pediatr Res 2006;59:778–83. [DOI] [PubMed] [Google Scholar]
- [63].Flores-Pérez A, Marchat LA, Sánchez LL, et al. Differential proteomic analysis reveals that EGCG inhibits HDGF and activates apoptosis to increase the sensitivity of non-small cells lung cancer to chemotherapy. Proteomics Clin Appl 2016;10:172–82. [DOI] [PubMed] [Google Scholar]


