. 2021 Jun 9;10:e63698. doi: 10.7554/eLife.63698

Figure 4. Distribution of Y51F10.2 mRNA in embryos expressing wild-type MEG-3 and variants.

(A) Representative photomicrographs of single confocal slices of fixed embryos expressing the indicated MEG-3 variants and hybridized to fluorescent probes complementary to the P granule-enriched mRNA Y51F10.2 (white signal). (B) Scatterplot showing the ratio of Y51F10.2 to T26A5.2 mRNA signal in P0 and P2 embryos expressing the indicated MEG-3 derivatives. Each dot represents an embryo. See Figure 4—figure supplement 1 for T26A5.2 mRNA localization and levels. (C) Scatterplot showing enrichment of Y51F10.2 mRNA in P2 relative to somatic blastomeres in embryos expressing the indicated MEG-3 derivatives. Each dot represents an embryo (Materials and methods). (D) Scatterplot showing enrichment of Y51F10.2 mRNA in P4 relative to somatic blastomeres in embryos expressing the indicated MEG-3 derivatives. Each dot represents an embryo (Materials and methods).
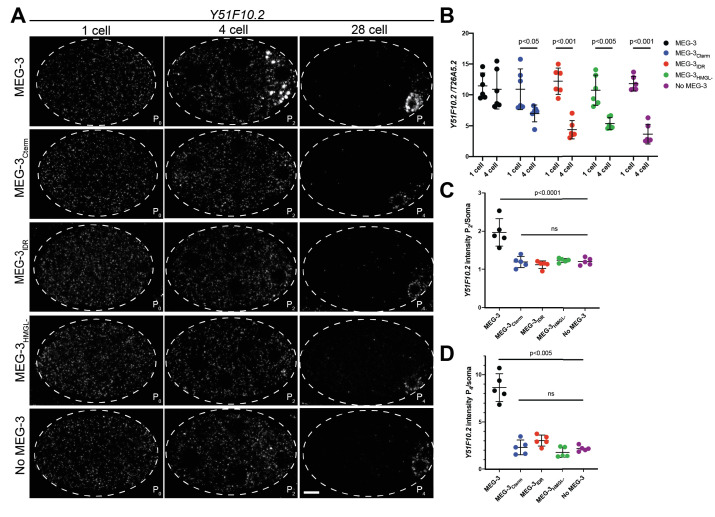
Figure 4—source data 1. Y51F10.2 mRNA levels in embryos expressing wild-type MEG-3 and variants.

Figure 4.

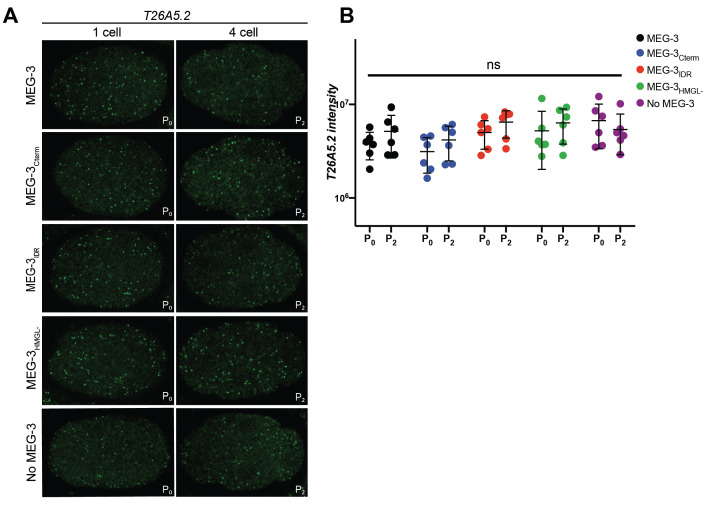
Figure 4—figure supplement 1. Distribution of T26A5.2 in embryos expressing wild-type MEG-3 and variants.

Figure 4—figure supplement 1.

(A) Representative photomicrographs of single confocal slices of fixed embryos expressing the indicated MEG-3 variants and hybridized to fluorescent probes complementary to the mRNA T26A5.2. Images are of the same embryo and confocal slice as Figure 4A. (B) Scatterplot of the intensity of the T26A5.2 mRNA signal in P0 and P2 embryos expressing the indicated MEG-3 derivatives. Each dot represents an embryo analyzed in Figure 4B.
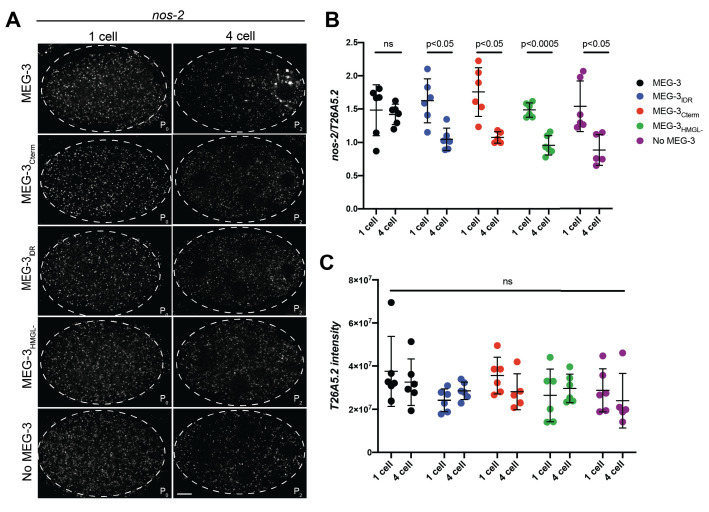
Figure 4—figure supplement 2. Distribution of nos-2 mRNA in embryos expressing wild-type MEG-3 and variants.

Figure 4—figure supplement 2.

(A) Representative photomicrographs of single confocal slices of fixed embryos expressing the indicated MEG-3 variants and hybridized to fluorescent probes complementary to the P granule-enriched mRNA nos-2 (white signal). (B) Scatterplot showing the ratio of nos-2 to T26A5.2 mRNA signal in P0 and P2 embryos expressing the indicated MEG-3 derivatives. Each dot represents an embryo. (C) Scatterplot of the intensity of the T26A5.2 mRNA signal in P0 and P2 embryos expressing the indicated MEG-3 derivatives. Each dot represents an embryo analyzed in (B).
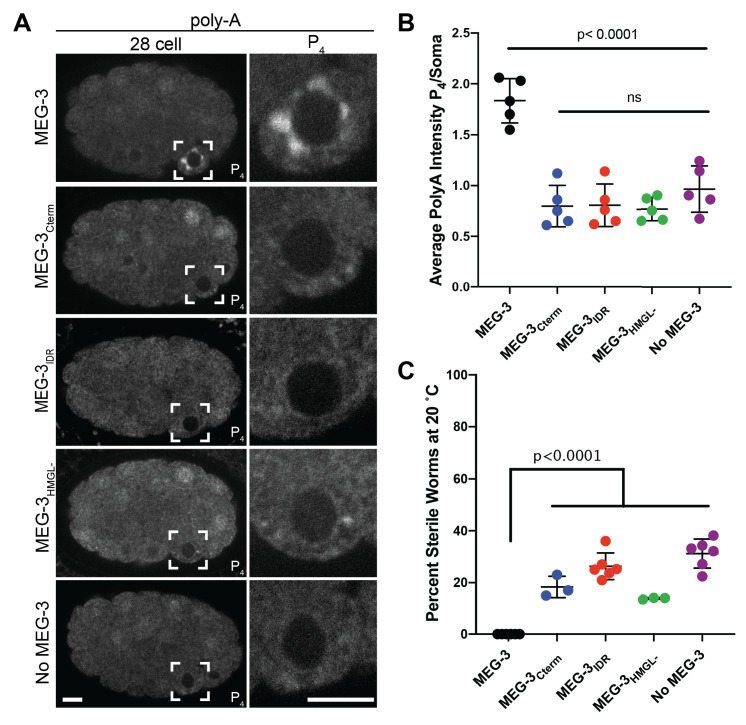
Figure 4—figure supplement 3. Distribution of polyadenylated mRNA in embryos expressing wild-type MEG-3 and variants.

Figure 4—figure supplement 3.

(A) Representative photomicrographs of single confocal slices of fixed embryos expressing the indicated MEG-3 variants and hybridized to oligo-dT fluorescent probes to detect polyadenylated mRNAs. (B) Scatterplot showing enrichment of polyadenylated mRNA in P4 relative to somatic blastomeres in embryos expressing the indicated MEG-3 derivatives. Each dot represents an embryo (Materials and methods). (C) Plot of the percentage of sterile worms from mothers expressing the indicated MEG-3 derivatives raised at 20°. Each dot represents the 2 hr brood of 10 mothers (Materials and methods). Total number of worms scored is shown above.