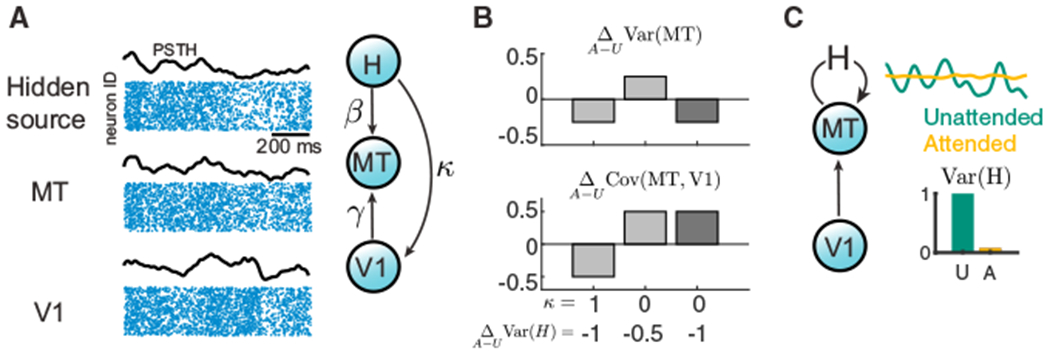
Figure 2. Model Constraints for Shared Variability within and between Areas.

(A) Left: hidden variable model for connected cortical areas, V1 and MT, where the response variability of MT comes from both its upstream area V1 and a hidden source H. Due to the low-dimensional structure of shared variability in population activity (Figure 1C), we use the mean population rate (black curves) to represent the population spiking activity from each area (blue dot rasters). Right: the hidden source H projects to MT and V1 with strengths β and κ, respectively. The feedforward projection strength from V1 to MT is γ.
(B) Examples of attentional changes in the variance of MT, , and the covariance between MT and V1, . We consider combinations of shared H (κ = 1) versus private H (κ = 0) and a moderate reduction in hidden variability versus a large reduction . Attention-mediated simultaneous decreases in Var(MT) and increase in Cov(MT, V1) occur for private variability with a large reduction in hidden variability (dark gray). The other combinations cause a shift in the same direction for within and between area variability (light gray). Other model parameters are γU = 0.5, γA = 1, VarU(H) = 1, β = 1, and Var(V1) = 1, independent of attentional state. U, unattended; A, attended. For general analysis, see Methods S1.
(C) The differential modulation of shared variability within and between areas (Figures 1A and 1B) suggests the hidden variable H is internally generated within area MT and that attention should quench the variance of H substantially.
