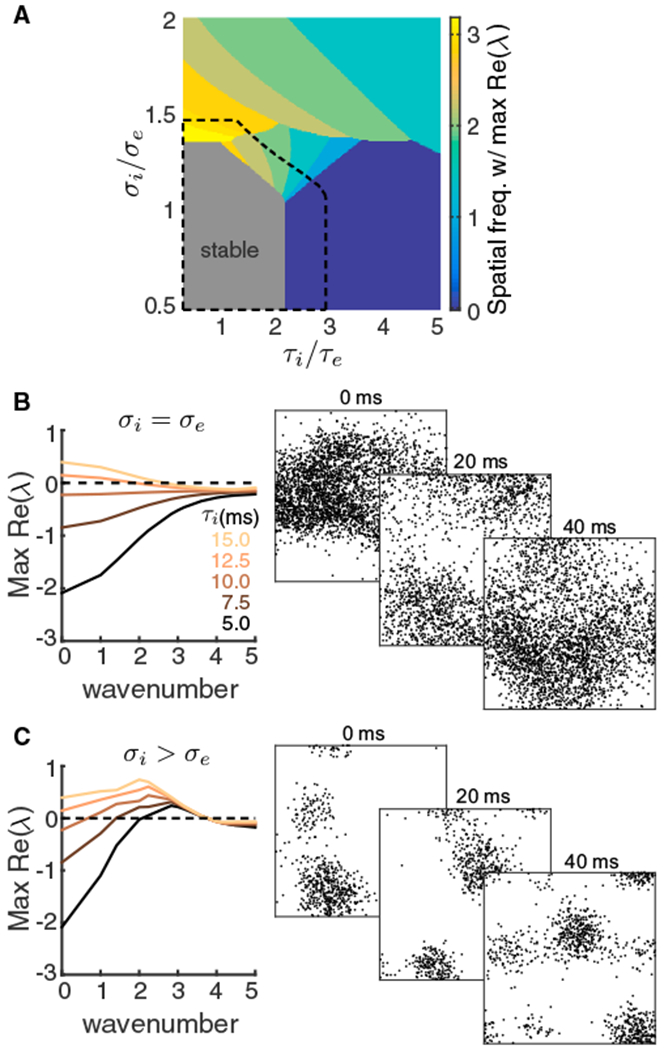
Figure 5. Stability Analysis of a Two-Dimensional Firing Rate Model.

(A) Bifurcation diagram of a firing rate model as a function of the inhibitory decay timescale τi and inhibitory projection width σi. The excitatory projection width and time constant are fixed at σe = 0.1 and τe = 5 ms respectively. Color represents the wavenumber with the largest real part of eigenvalue and the gray region is stable. Top-down modulation of inhibitory neurons modeling attention expands the stable region (black dashed).
(B) Left: the real part of eigenvalues as a function of wavenumber for increasing τi, when σi = σe. Right: three consecutive spike raster snapshots of a spiking neuron network with σi = σe and slow inhibition (same network as in Figure 4 in the unattended state).
(C) Same as (B) for σi larger than σe. Right: spike raster snapshots of a spiking neuron network with broad inhibitory projections, where the excitatory and the inhibitory projection widths of layer 3 were and , respectively. Other parameters were the same as in (B).
