Abstract
Mechanical interactions between cells have been shown to play critical roles in regulating cell signaling and communications. However, the precise measurement of intercellular forces is still quite challenging, especially considering the complex environment at cell–cell junctions. In this study, we report a fluorescence lifetime-based approach to image and quantify intercellular molecular tensions. Using this method, tensile forces among multiple ligand-receptor pairs can be measured simultaneously. We first validated our approach and developed lifetime measurement-based DNA tension probes to image E-cadherin-mediated tension on epithelial cells. These probes were then further applied to quantify the correlations between E-cadherin and N-cadherin tensions during an epithelial-mesenchymal transition process. The modular design of these probes can potentially be used to study the mechanical features of various physiological and pathological processes.
Keywords: cadherin, DNA probe, epithelial-mesenchymal transition, fluorescence lifetime imaging, intercellular tensile force
Graphical Abstract
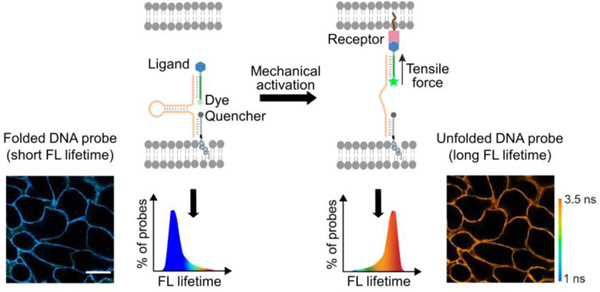
A fluorescence lifetime imaging-based cell membrane-anchored DNA hairpin probe is designed to measure tensile forces at cell-cell junctions. Tension among multiple ligand-receptor pairs can be quantified simultaneously during cellular processes such as epithelial-mesenchymal transition.
Introduction
In multicellular organisms, cells communicate with each other to regulate tissue development and homeostasis. Various chemical and biological stimuli are known to be capable of controlling these intercellular communications.[1] More recently, mechanical stimuli including forces at cell–matrix and cell–cell junctions have also been shown to play an important role during cellular proliferation, differentiation, and migration.[2,3] While extensive studies have now focused on the mechanical reactions between cells and extracellular matrices, biomechanical interactions between individual cells are still poorly understood.[4] These physical forces at cell–cell junctions can modulate a variety of mechanotransduction pathways through adhesion molecules such as cadherins.[5] Measuring intercellular forces mediated by these adhesion molecules is thus critical in our understanding of cellular communication events, especially in embryo development, epithelial viscoelasticity, and epithelial-mesenchymal transition.[6–8]
Several techniques have been developed to measure total forces within a monolayer of cells, including monolayer stress microscopy,[9] microfabricated cantilever,[10] and fluidic probe force microscopy.[11] However, these approaches provide limited molecular level force information, in other words, the mechanical contribution of specific adhesion molecules is still unknown. Meanwhile, complicated data analysis and microfabrication are often required in these techniques. On the other hand, powerful molecular tension probes have been recently engineered for imaging molecular level forces at cell–cell junctions. The first type of these probes is based on distance-dependent Förster resonance energy transfer (FRET) between genetically encoded fluorescent proteins.[12,13] Although holding great promise, the labor-intensive design and validation, influence of large molecular weight proteins on the target function, and limited signal-to-noise ratio of these probes have greatly limited their broad applications.[14]
Another type of DNA-based molecular tension probes has been used for studying several biomolecular forces.[15–17] However, the application of these probes has been limited to cell-substrate based interactions. Thus, we have recently developed a modular DNA-based probe to measure tensile forces at cell–cell junctions.[18] This so-called membrane DNA tension probe (MDTP) can spontaneously insert onto cell membranes through a lipid moiety. MDTP also contains a DNA hairpin that will unfold upon molecular tension between neighboring cells, which can further induce the separation of a fluorophore/quencher pair (Figure 1). The force tolerance of the MDTP can be modulated based on the stem length and sequence of the DNA hairpin. By simply changing the ligand moiety, this “plug-and-play” probe[19,20] allows the study of different mechanotransduction processes.
Figure 1.
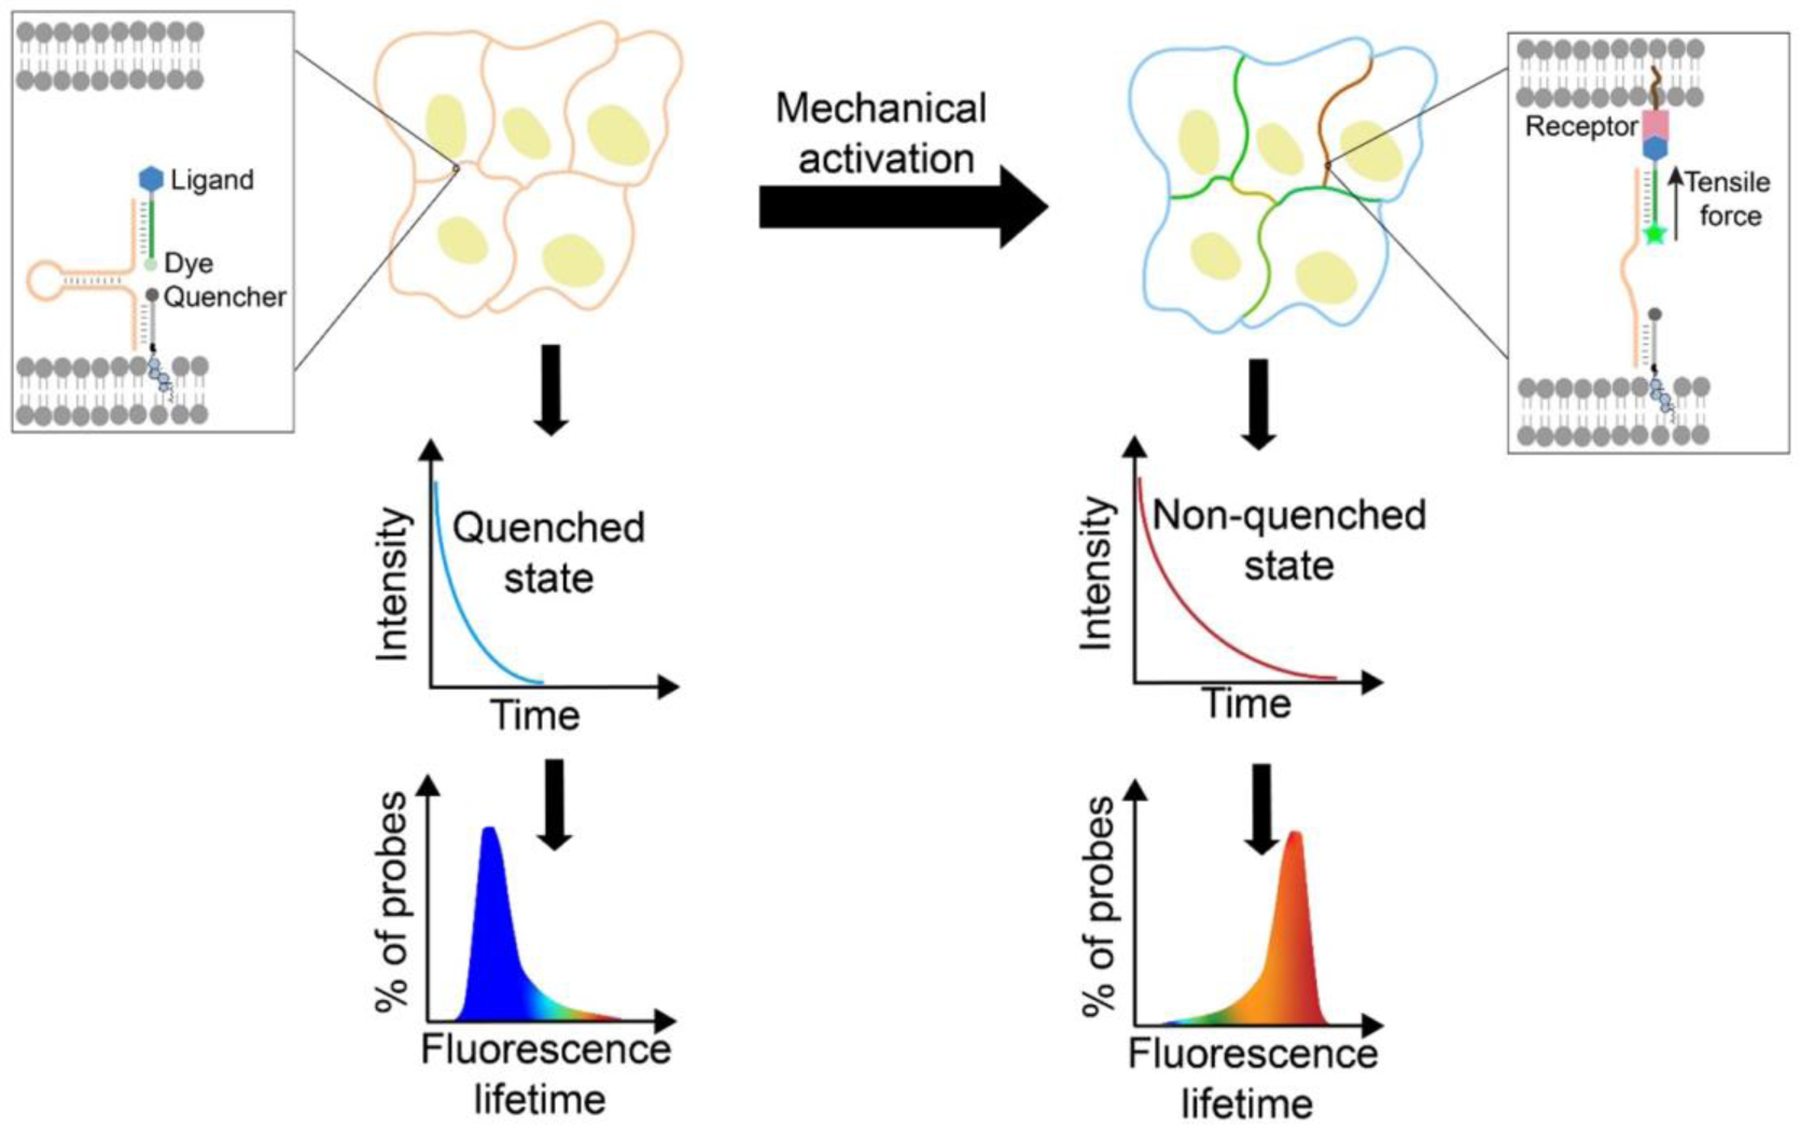
Design and mechanism of the FLIM-MDTP in measuring tensile forces at cell–cell junctions. The FLIM-MDTP can anchor onto cell membranes through a lipid moiety. Intercellular ligand-receptor binding induces the unfolding of a DNA hairpin and results in the separation of a fluorophore-quencher pair, which further leads to an increase in the number of probes in the unquenched state, exhibiting a higher fluorescence lifetime.
In this study, we further report a fluorescence lifetime imaging microscopy (FLIM)-based probe design, named as FLIM-MDTP, which will dramatically improve the capability of MDTP for the multiplexed imaging and quantitative measurement of intercellular forces. Fluorescence lifetime, i.e., the time a fluorophore remains in an excited state, is a concentration-independent intrinsic property of the fluorophore. FLIM has been previously used together with DNA-based probes for imaging in living cells.[21–23] Fluorescence lifetime is highly sensitive to the existence of a nearby quencher. Based on this phenomenon, we have designed FLIM-MDTP to quantify molecular tensions at cell–cell junctions (Figure 1). Using cadherin-mediated adhesions as an example, we demonstrate here the first molecular tension probe that can simultaneously measure multiple intercellular mechanotransduction events.
Results and Discussion
Design and Characterization of the FLIM-MDTP
We first wanted to identify the fluorophore/quencher pairs that can be incorporated with MDTP and used in the fluorescence lifetime measurement. A 6-carboxyfluorescein (FAM)/Eclipse™ pair and a Cy3/Black Hole Quencher 2 (BHQ-2) pair were chosen based on their reported large fluorescence lifetime changes upon quenching.[24] After incorporating these two fluorophore/quencher pairs into the MDTP, a moderate quenching efficiency (63%) was observed for the FAM/Eclipse pair, while BHQ-2 can efficiently quench (92%) the fluorescence signal of Cy3 (Figure S1). To further test if these two fluorophore/quencher pairs will exhibit large lifetime changes upon unfolding of the MDTP, we added these probes to the membranes of MCF7 epithelial cells after a brief 20 min incubation. A complementary DNA strand was then added to in situ unfold DNA hairpins on the cell membranes. Indeed, a dramatic increase in fluorescence lifetime of both FAM (from 1.2±0.1 ns to 3.2±0.1 ns) and Cy3 (from 1.1±0.1 ns to 1.6±0.1 ns) channels was observed within 30 min (Figure S2). These two fluorophore/quencher pairs can thus both be used to measure the activation of the MDTP. We named these FAM/Eclipse- and Cy3/BHQ-2-modified probes as FLIM-MDTP (FAM) and FLIM-MDTP (Cy3), respectively.
Next, we asked if the fluorescence lifetime values of the FLIM-MDTP (FAM) and FLIM-MDTP (Cy3) are independent on the membrane probe concentrations. We first added three different initial concentrations (0.2 µM, 0.5 µM, and 1.0 µM) of each probe onto the MCF7 cell membranes. As expected, constant lifetime signals were exhibited in both FAM (<9% variation) and Cy3 (<4% variation) channels at cell–cell junctions (Figure 2). To further study if the activated FAM and Cy3 signals are still insensitive to the membrane probe densities, we prepared a quencher-free version of the probe, termed as nqFLIM-MDTP, without adding Eclipse and BHQ-2 (Figure S1). Again, on the MCF7 cell membranes, minimal variations (<6%) in the lifetime signals were observed after adding 0.2–1.0 µM unquenched probes (Figure 2). As a control, under the same experimental condition, clear differences in the membrane probe densities can be visualized based on the largely altered fluorescence emission signals, i.e., over 230% variation in the FAM fluorescence and >300% variation in the Cy3 signal (Figure 2c, d). All these results indicated that the lifetime signals of the FLIM-MDTP (FAM) and FLIM-MDTP (Cy3) are indeed concentration-independent in this range, which will be critical for the potential quantification of intercellular forces.
Figure 2.
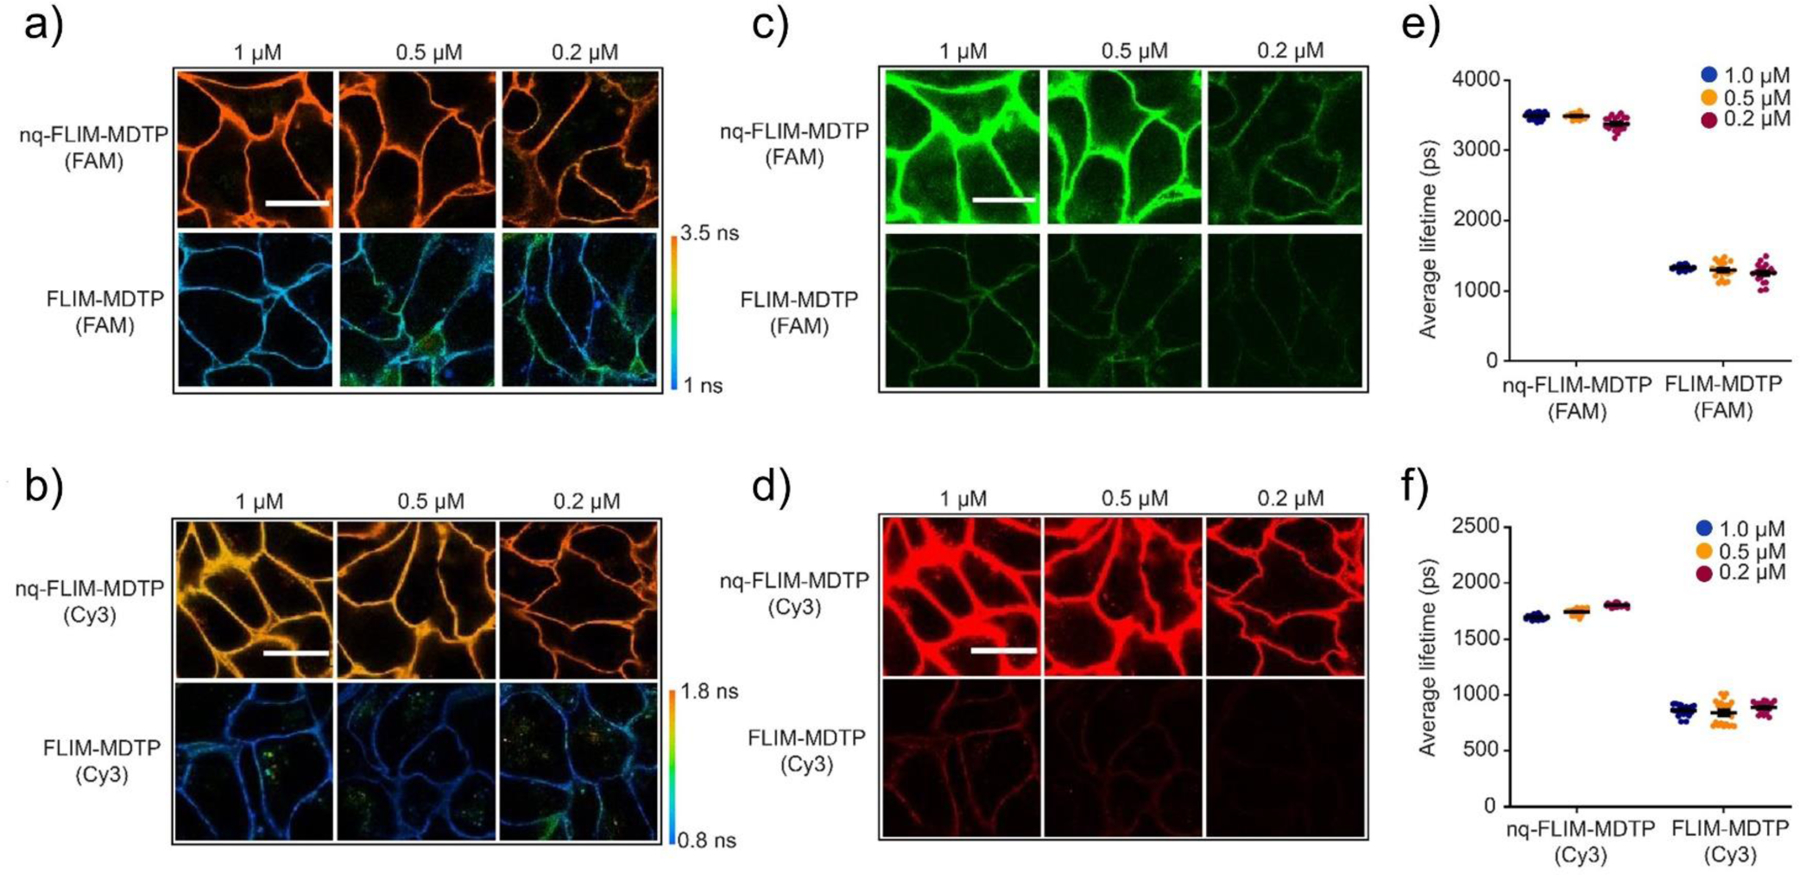
The effect of membrane probe concentrations on the fluorescence lifetime and emission signals of FLIM-MDTP. Three different concentrations of FLIM-MDTP (FAM), nqFLIM-MDTP (FAM), FLIM-MDTP (Cy3), and nqFLIM-MDTP (Cy3) were added to the MCF7 cells and imaged after a 30 min incubation. Shown are the representative (a, b) fluorescence lifetime images and (c, d) fluorescence intensity images of the same cell membrane region. Scale bar, 20 µm. Higher probe concentration resulted in obviously higher fluorescence emission intensity, while minimal variation in the lifetime signal was shown. Distributions of cell membrane fluorescence lifetime under each probe concentration were also quantified in the (e) FAM and (f) Cy3 channels. Shown are mean and standard error of the mean (SEM) values from 20 cell–cell junctions in each case.
We also wondered whether the FLIM-MDTP (FAM) and FLIM-MDTP (Cy3) can function simultaneously on cell membranes for potential multiplexed imaging. For this purpose, we mixed 50% activated FLIM-MDTP (FAM) with either FLIM-MDTP (Cy3) or nqFLIM-MDTP (Cy3) on the MCF7 cell membranes. Indeed, minimal influence (<3%) was observed in the FAM channel (Figure S3). Meanwhile, the presence of FLIM-MDTP (FAM) will also not affect the lifetime values of FLIM-MDTP (Cy3) or nqFLIM-MDTP (Cy3) (<9% variation) (Figure S3). The FLIM-MDTP (FAM) and FLIM-MDTP (Cy3) can be orthogonally detected and potentially used for the multiplex imaging of different membrane mechanotransduction events.
Quantification of Intercellular Tensions with the FLIM-MDTP
Our next goal was to apply the FLIM-MDTP to quantify molecular tensions at cell–cell junctions. We first tried to determine the correlation between the apparent lifetime of each probe and the percentage of unfolded DNA hairpins. In this regard, we prepared a 1,2-dioleoyl-sn-glycero-3-phosphocholine (DOPC) supported lipid bilayer and anchored with different ratios of FLIM-MDTP (0% unfolded) and nq-FLIM-MDTP (100% unfolded) to obtain membranes with standard 0%, 25%, 50%, 75%, and 100% unfolded DNA hairpins (Figure 3a). As expected, the membrane fluorescence lifetime values in both FAM and Cy3 channels gradually increased as the percentage of nqFLIM-MDTP increased (Figure 3b, c). These values were further fit to two first-order exponential growth curves for the FLIM-MDTP (FAM) and FLIM-MDTP (Cy3), respectively, which will be later used for the calibration and quantitative measurement of intercellular forces (Table S2).
Figure 3.
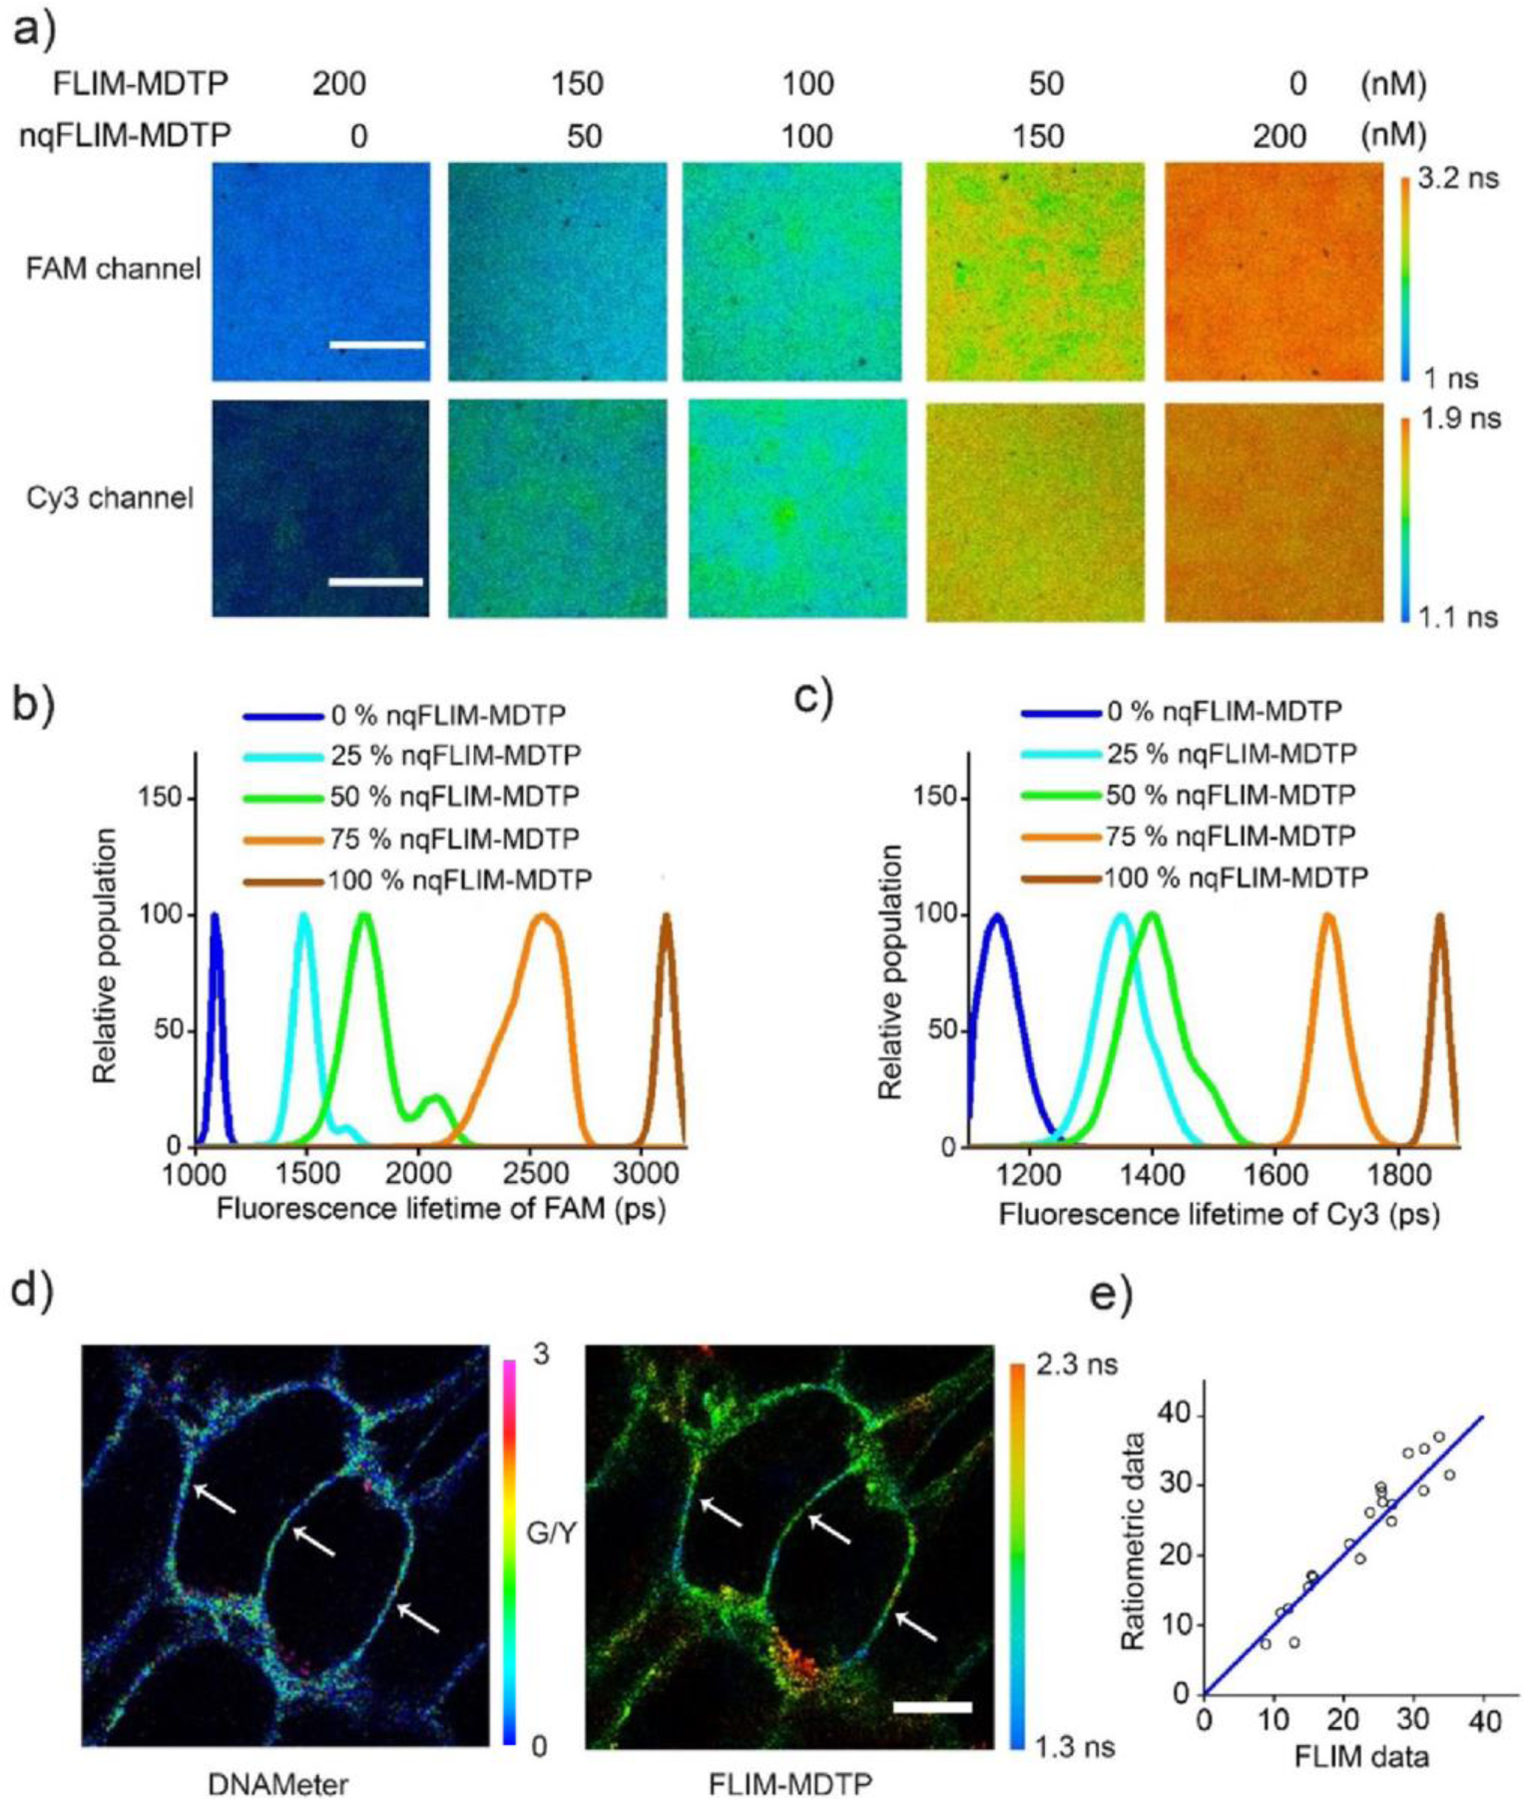
Calibration and validation of the FLIM-MDTP. (a) Five different ratios of the nqFLIM-MDTP and FLIM-MDTP were mixed at 200/0 nM, 150/50 nM, 100/100 nM, 50/150 nM, and 0/200 nM concentrations including equal amount of FAM- and Cy3-labeled probes. Shown are the representative fluorescence lifetime images in the FAM (top) and Cy3 (bottom) channels after adding each mixture onto a supported lipid bilayer (SLB) membrane. Scale bar, 20 µm. (b, c) SLB membrane distributions of fluorescence lifetime values were quantified in the (b) FAM and (c) Cy3 channels for each mixture. (d) Representative fluorescence ratiometric (left, FAM/Cy5 signal) and lifetime (right) images of MDCK cells after 30 min incubation with 200 nM of EC-DNAMeter (FAM/Cy5) and EC-FLIM-MDTP (FAM). Scale bar, 10 µm. (e) Correlation of the percentage of unfolded EC-MDTP at the same cell–cell junctions as calculated from the ratiometric or lifetime images. 20 cell–cell junctions were analyzed.
We next prepared an E-cadherin-modified FLIM-MDTP (FAM), named as EC-FLIM-MDTP (FAM), to quantify E-cadherin-mediated tensile forces at MDCK cell–cell adhesions. A DNA hairpin with the threshold force value of 4.4 pN was used to construct the probe. We chose this low threshold value probe because cadherin-mediated tension has been estimated to be in a similar range.[12,13] After confirming the probe assembly and E-cadherin modification in a gel electrophoresis assay (Figure S4), we tried to study calcium ion (Ca2+)-induced changes in E-cadherin tensions. Ca2+ can regulate the homodimerization of cadherins, which is critical for the adhesion formation in epithelia.[25] As shown in Figure S5, after adding 2 mM Ca2+ for 15 min, an obvious fluorescence lifetime increase from 1.4 ns to 1.8 ns was observed in the FAM channel. Based on the calibration curve (Table S2), this lifetime increase corresponds to 25% more unfolded FLIM-MDTP at cell–cell junctions (Figure S5). As a control, without conjugating E-cadherin, a Protein G-modified FLIM-MDTP did not exhibit any Ca2+-induced changes in the fluorescence lifetime (Figure S5). The vast majority of probes (>94%) remained folded even in the presence of Ca2+. The EC-FLIM-MDTP can indeed be used to measure intercellular E-cadherin tensions.
We have recently developed a ratiometric DNA probe, termed DNAMeter, to quantify intercellular tensile forces.[26] To validate the performance of FLIM-MDTP, we wondered how the lifetime measurement-based quantification results can be compared to those obtained from the ratiometric measurement using DNAMeter. We prepared an EC-DNAMeter by modifying an additional Cy5 reference fluorophore at the 3’-end of the hairpin strand in EC-FLIM-MDTP (FAM). As a result, a dual-mode probe was designed to use either the FAM fluorescence lifetime value or the fluorescence intensity ratio of FAM/Cy5 to measure E-cadherin tensions (Figure 3d). Our results indicated that upon Ca2+-induced force activation, very impressively, an almost identical percentage of unfolded DNA hairpins can be calculated at the same cell–cell junctions based on both ratiometric and lifetime images (Figure 3e). Indeed, the FLIM-MDTP can be used to accurately determine the fraction of tension-induced unfolded probes.
Multiplexed Imaging of Molecular Tensions with FLIM-MDTP
To further test if we can apply FLIM-MDTP for the multiplexed imaging of intercellular tensions, we first asked whether the EC-FLIM-MDTP (FAM) and EC-FLIM-MDTP (Cy3) can be used together to measure E-cadherin tensions. After incubating the MCF7 cells with a mixture of 200 nM EC-FLIM-MDTP (FAM) and EC-FLIM-MDTP (Cy3), we quantified the percentage of unfolded probes in both FAM and Cy3 lifetime imaging channels. As expected, a very similar unfolding percentage was identified at the same cell–cell junctions using either EC-FLIM-MDTP (FAM) or EC-FLIM-MDTP (Cy3) (Figure S6). This result demonstrated that both probes can be used simultaneously to quantify E-cadherin tensions.
Our next goal was to apply these dual EC-FLIM-MDTPs to study different force ranges of E-cadherin-mediated tension. The EC-FLIM-MDTP (FAM) or EC-FLIM-MDTP (Cy3) used above contains a 25 nt DNA hairpin with 22% G/C base pairs to detect forces around 4.4 pN.[26] To enable the detection of stronger E-cadherin tension, we have replaced the EC-FLIM-MDTP (Cy3) with a DNA hairpin of the same length but contains 66% G/C base pairs. A threshold force value of 8.1 pN has been determined for this probe construct.[26] To clarify this difference in the DNA hairpin, we just named these two probes as EC-22-FLIM-MDTP (FAM) and EC-66-FLIM-MDTP (Cy3). We incubated a mixture of these two probes with the MDCK cells, and a Ca2+-induced increase in the fluorescence lifetime can be observed in both FAM and Cy3 channels. After quantification, 24% and 48% of the EC-22-FLIM-MDTP (FAM) was unfolded before and after the addition of calcium ions (Figure S7). Very similarly, 24% more EC-66-FLIM-MDTP (Cy3) was also activated (from 14% to 38%) upon adding Ca2+. Multiple force ranges can thus be simultaneously detected using this dual FLIM-MDTP probe design.
We next wanted to demonstrate the potential of applying the FLIM-MDTP to simultaneously image the molecular tensions among different ligand-receptor pairs. We chose to study an epithelial-mesenchymal transition (EMT) process because multiple signaling events occur during this transition, which also plays a key role in development, wound healing and cancer progression, where cells lose their adhesion and become more invasive.[7,27] EMT exhibits a characteristic repression of E-cadherin together with the upregulation of N-cadherin.[28] To understand the mechanical features of the EMT, we wondered if the FLIM-MDTP can be used to measure the correlations between E-cadherin- and N-cadherin-mediated tensions during this process.
We thus designed an N-cadherin-modified DNA tension probe, NC-FLIM-MDTP (FAM), and used it together with the EC-FLIM-MDTP (Cy3) to simultaneously image N-cadherin and E-cadherin tensions. Transforming growth factor TGF-β1, a widely used protein inducer of EMT, was used to induce the EMT of MCF7 cells.[29] After a 72 h induction, the successful transition was validated in an immunostaining assay based on the downregulation of two epithelial biomarkers, E-cadherin and ZO-1, and the upregulation of a mesenchymal biomarker, N-cadherin (Figure S8). We then added a mixture of NC-FLIM-MDTP (FAM) and EC-FLIM-MDTP (Cy3) to these TGF-β1-induced MCF7 cells. After a brief 20 min incubation, a dramatic fluorescence lifetime increase in the FAM channel and a decrease in the Cy3 channel were observed, as compared to the control cells without adding TGF-β1 (Figure S9). 32% N-cadherin probes and 19% E-cadherin probes were experiencing more than 4.4 pN forces at the junctions of those induced cells. Without the TGF-β1 induction, the same batch of cells can instead unfold 16% N-cadherin and 50% E-cadherin probes (Figure 4a, b). Since N-cadherin (or E-cadherin) prefers to interact with another same type of cadherins on the neighboring cells,[30] this result can be indeed expected based on the upregulation of N-cadherin and the repression of E-cadherin during the EMT.
Figure 4.
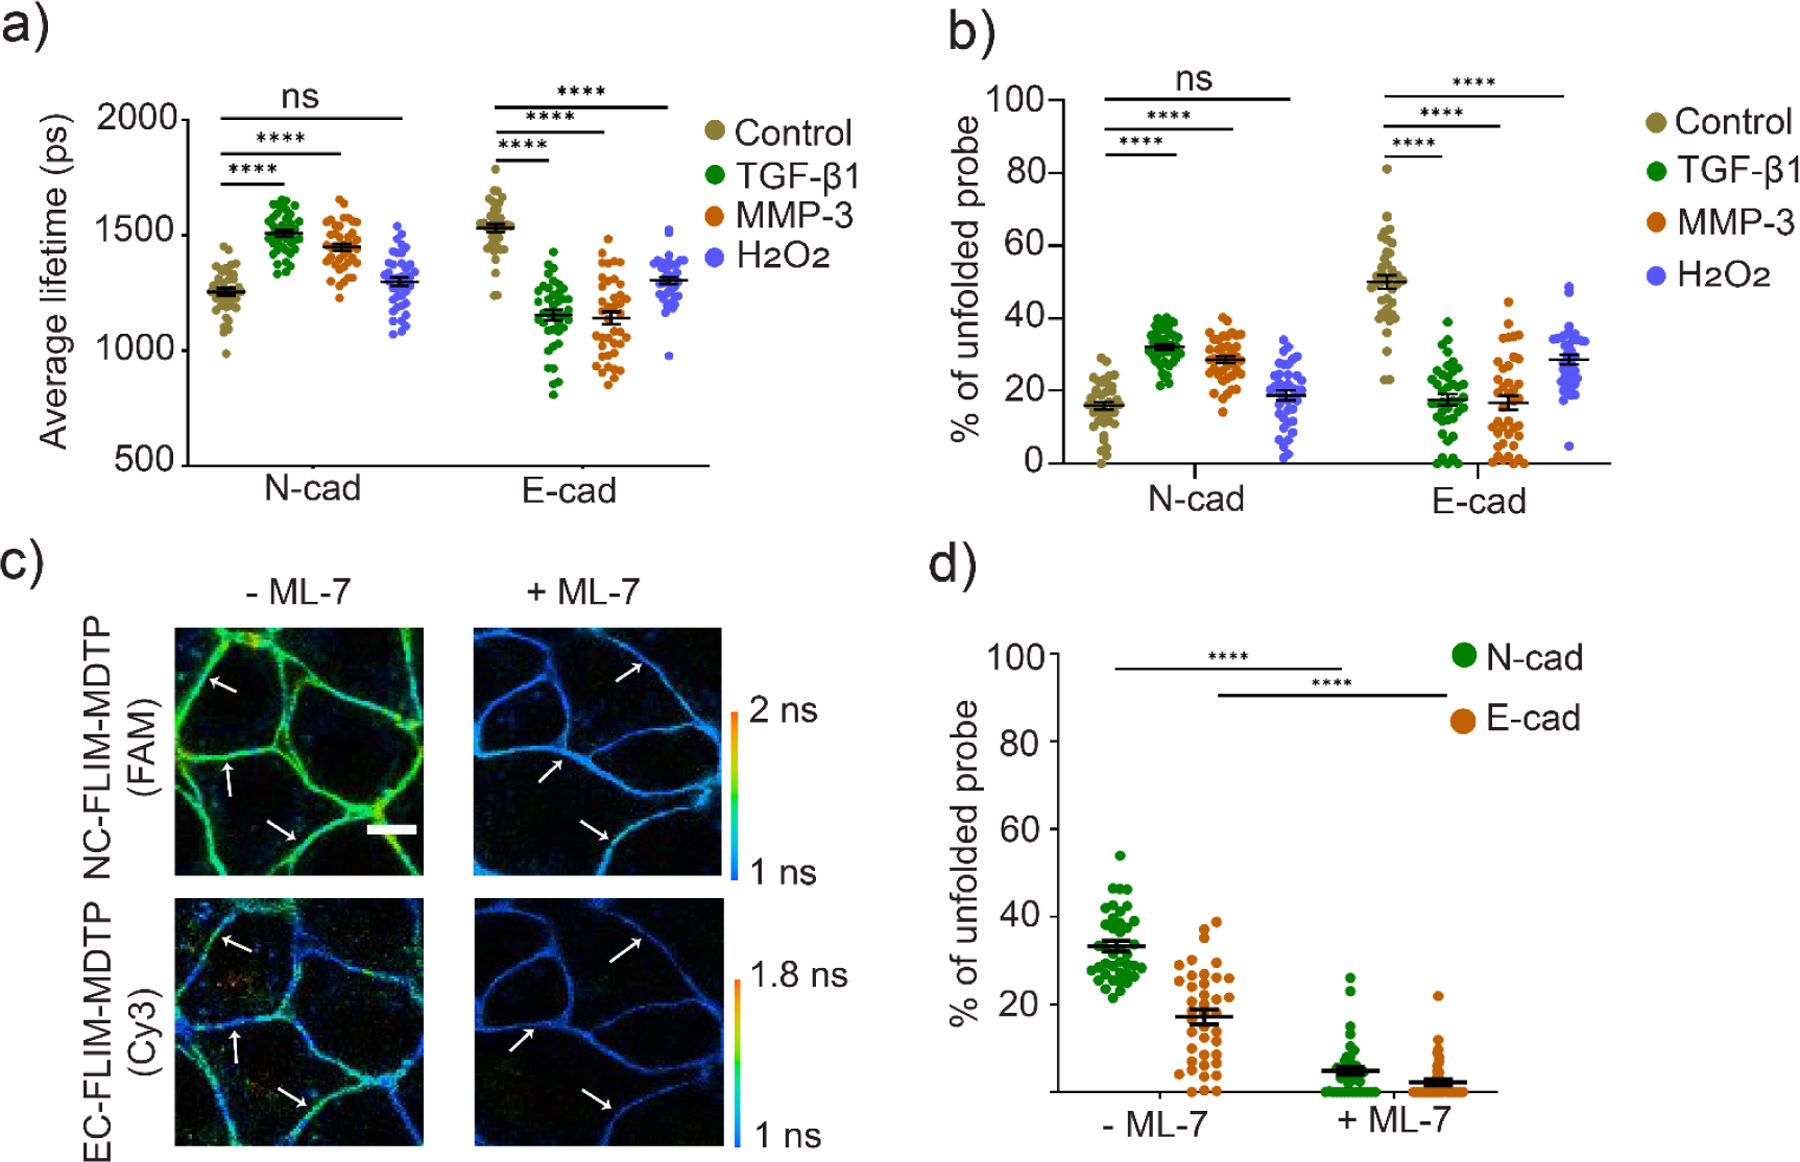
Multiplexed imaging of E-cadherin- and N-cadherin-mediated tension after the EMT induction. (a) MCF7 cells were first treated with 1% DMSO (control), 30 ng/mL of TGF-β1, 2 µM MMP-3, or 50 µM H2O2 for 48–72 h. Distributions of cell–cell junction fluorescence lifetime after adding different types of EMT inducers. (b) Percentages of the unfolded NC-FLIM-MDTP (FAM) and EC-FLIM-MDTP (Cy3) at each cell–cell junction after the treatment with each EMT inducer. (c) MCF7 cells were first treated with 30 ng/mL of TGF-β1 for 72 h to induce EMT. A mixture of 200 nM NC-FLIM-MDTP (FAM) and EC-FLIM-MDTP (Cy3) was then added and incubated for 30 min before imaging. Representative images are shown in the presence or absence of 2 mM ML-7. Scale bar, 10 µm. (d) Percentages of the unfolded NC-FLIM-MDTP (N-cad) and EC-FLIM-MDTP (E-cad) at each cell–cell junction in the presence or absence of 2 mM ML-7. Shown are mean and standard error of the mean (SEM) values from at least 40 cell–cell junctions in each case. ****p< 0.0001 in two-tailed Student’s t-test; ns, not significant.
To further confirm if the observed fluorescence lifetime changes are indeed due to variations in the E-cadherin and N-cadherin tensions, we first added EGTA to selectively chelate Ca2+ and measured its effect on both NC-FLIM-MDTP (FAM) and EC-FLIM-MDTP (Cy3) signals. As expected, a dramatic decrease in the fluorescence lifetime was observed in both FAM and Cy3 channels, regardless of whether the TGF-β1 was added, (Figure S10). As another validation, a myosin light chain kinase inhibitor, ML-7, was used to reduce the local accumulation of cadherins at cell–cell junctions.[31] Indeed, after adding 2 mM ML-7, both NC-FLIM-MDTP (FAM) and EC-FLIM-MDTP (Cy3) signals disappeared (Figure 4c, d), which indicated that the cadherin tensions are required for the unfolding of both probes. As a control, without modification of N-cadherin and E-cadherin, no change in the FLIM-MDTP lifetime signal was observed in both FAM and Cy3 channels (Figure S11). All these data demonstrated that the FLIM-MDTP can be used to simultaneously measure different molecular tension events at cell–cell junctions.
Mechanical Features of Epithelial-Mesenchymal Transition
We wanted to further apply the FLIM-MDTP to provide some mechanical signatures of the EMT. We first asked if cells induced by different types of EMT inducers will exhibit similar mechanical features. In addition to TGF-β1, we have also tested two other commonly used EMT inducers, matrix metalloproteinase-3 (MMP-3) and H2O2.[32,33] After confirming a similar change in the MCF7 cell membrane expression of N-cadherin and E-cadherin using these three inducers (Figure S8), we used NC-FLIM-MDTP (FAM) and EC-FLIM-MDTP (Cy3) to measure the effect of different inducers on the cadherin tensions. MMP-3-induced cells exhibited quite similar tensions as that induced by TGF-β1, with 29% of N-cadherin and 17% of E-cadherin-modified probes being unfolded (Figure 4a, 4b, and S9). The small differences (~10%) between MMP-3 and TGF-β1-induced cadherin tensions are well correlated with their variations in the N/E-cadherin expression levels (Figure S8). On the other hand, very interestingly, on H2O2-induced MCF7 cells, the percentage of unfolded N-cadherin probes (19%) was very similar as that on the control non-induced cells (16%). In this case, the higher membrane expression of N-cadherin (Figure S8) did not result in the unfolding of more NC-FLIM-MDTP. Meanwhile, even though less E-cadherin probes were unfolded (29%) compared to the control cells (50%), this value is still much larger than that induced by TGF-β1 (19%) or MMP-3 (17%). These results indicated that while the membrane expression of N/E-cadherins are related with cadherin-mediated tensile forces, it is not the only factor that regulates tensions during EMT at the cell junctions.
We also wondered if there are any strong correlations between the N-cadherin and E-cadherin-mediated tensions. For the purpose, we compared the unfolding percentage of the NC-FLIM-MDTP (FAM) and EC-FLIM-MDTP (Cy3) at each individual MCF7 cell–cell junctions. While a moderate positive correlation was observed in both TGF-β1-induced cells and control cells, after the induction with MMP-3 or H2O2, most MCF7 cells exhibited only a weak correlation of the N/E-cadherin tensions (Figure 5).[34] These results indicated that the intercellular force distribution across N-cadherin and E-cadherin are independently controlled during the EMT, especially when MMP-3 or H2O2 is used as the inducer.
Figure 5.
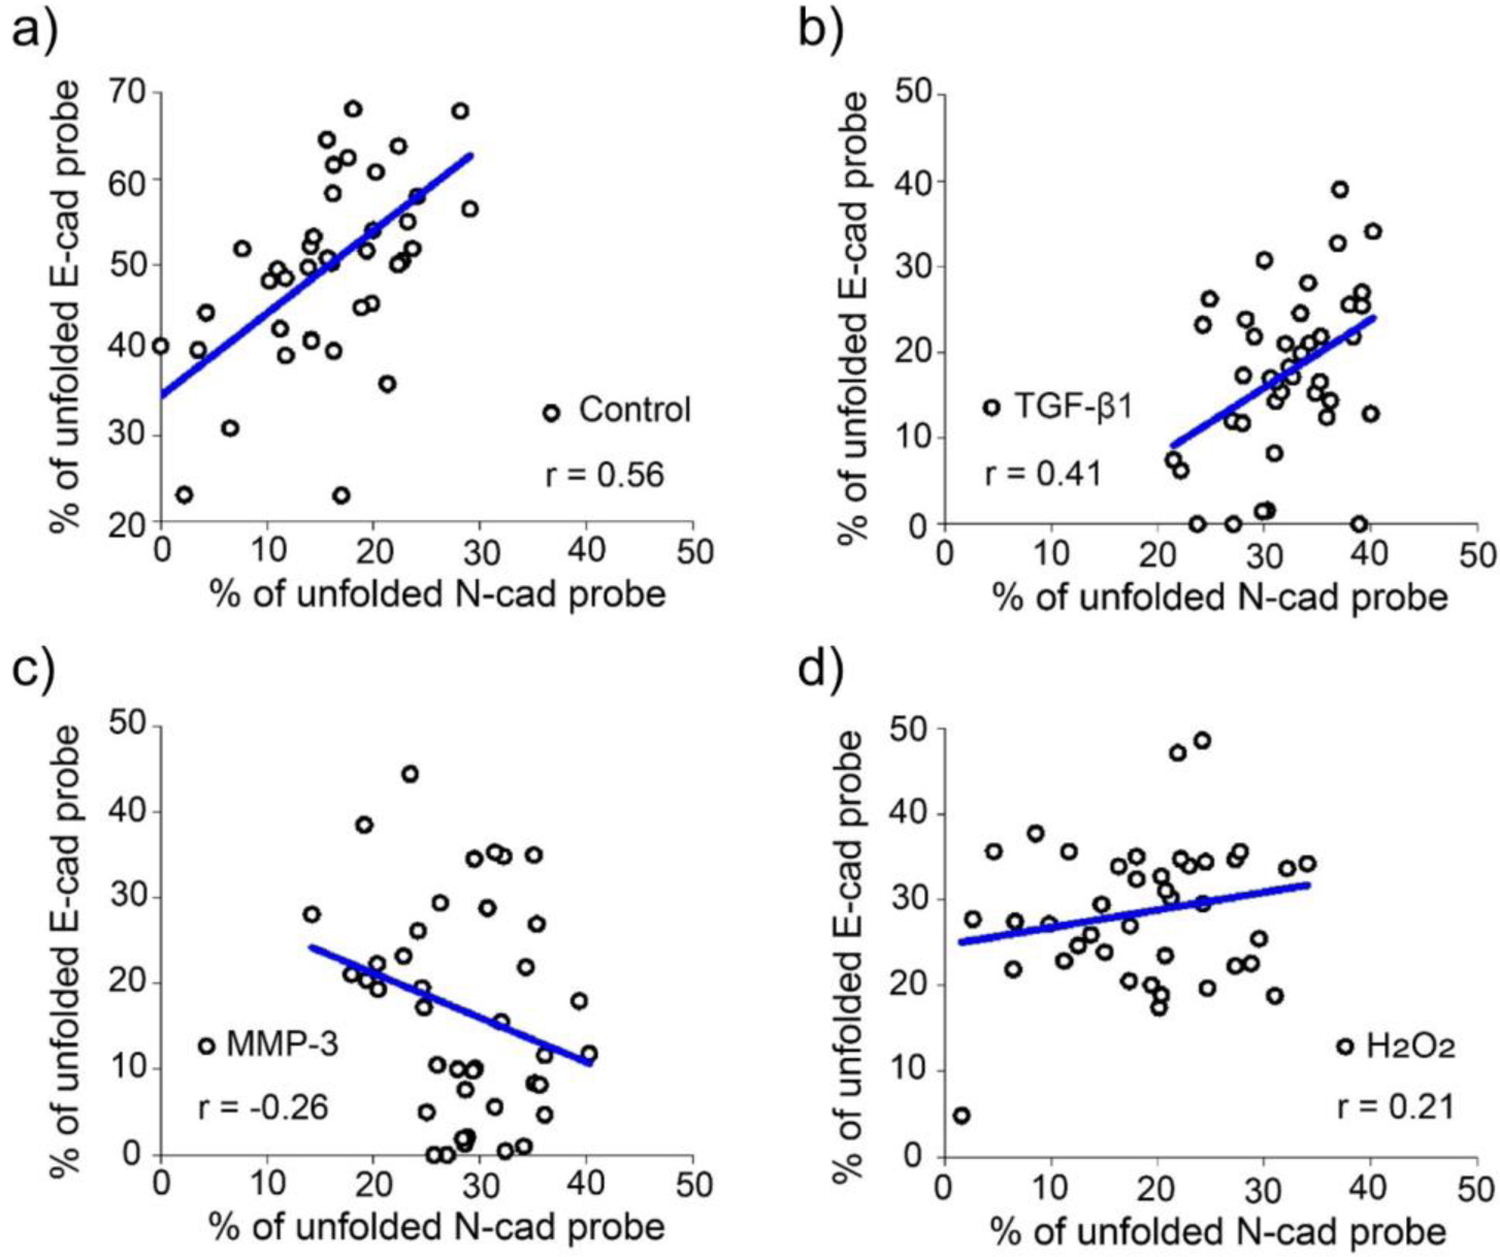
Correlation of the percentage of unfolded NC-FLIM-MDTP (FAM) and EC-FLIM-MDTP (Cy3) at the same cell–cell junctions. MCF7 cells were treated with (a) 1% DMSO (control), (b) 30 ng/mL of TGF-β1, (c) 2 µM MMP-3, or (d) 50 µM H2O2 for 48–72 h. Pearson’s coefficient was determined in each case where a positive (or negative) coefficient value indicates a positive (or negative) correlation between E-cadherin- and N-cadherin-mediated tensile forces. Pearson’s coefficient value between ±0.70 and ±1.00 indicates a strong correlation, value between ±0.30 and ±0.70 indicates a moderate correlation, value between ±0.00 and ±0.30 indicates a weak correlation. At least 40 cell–cell junctions were analyzed in each case.
To study whether the mechanical interaction patterns of cadherins are varied in different stages of the EMT, we added the NC-FLIM-MDTP (FAM) and EC-FLIM-MDTP (Cy3) onto MCF7 cell membranes after 24 h, 48 h, or 72 h of the TGF-β1 induction. At 24 h, both E-cadherin and N-cadherin tensions were quite similar as that of the control cells (Figure 6). A significant increase in the unfolding percentage of the N-cadherin probes was observed at 48 h (50% vs. 29% on the control cells). Correspondingly, the percentage of E-cadherin tension that is larger than 4.4 pN greatly decreased to 25%. Appealingly at 72 h, the percentage of unfolded N-cadherin probes was actually decreased compared to that at 48 h, while that of E-cadherin was increased. Since the membrane expression levels of both N-cadherin and E-cadherin were quite similar at these two time points (Figure S12), the variations in the cadherin tensions could be likely due to the lower cell confluence at 48 h.[35] Future studies will be needed to understand the real mechanism of these mechanotransduction process during the EMT, which is beyond the scope of this study.
Figure 6.
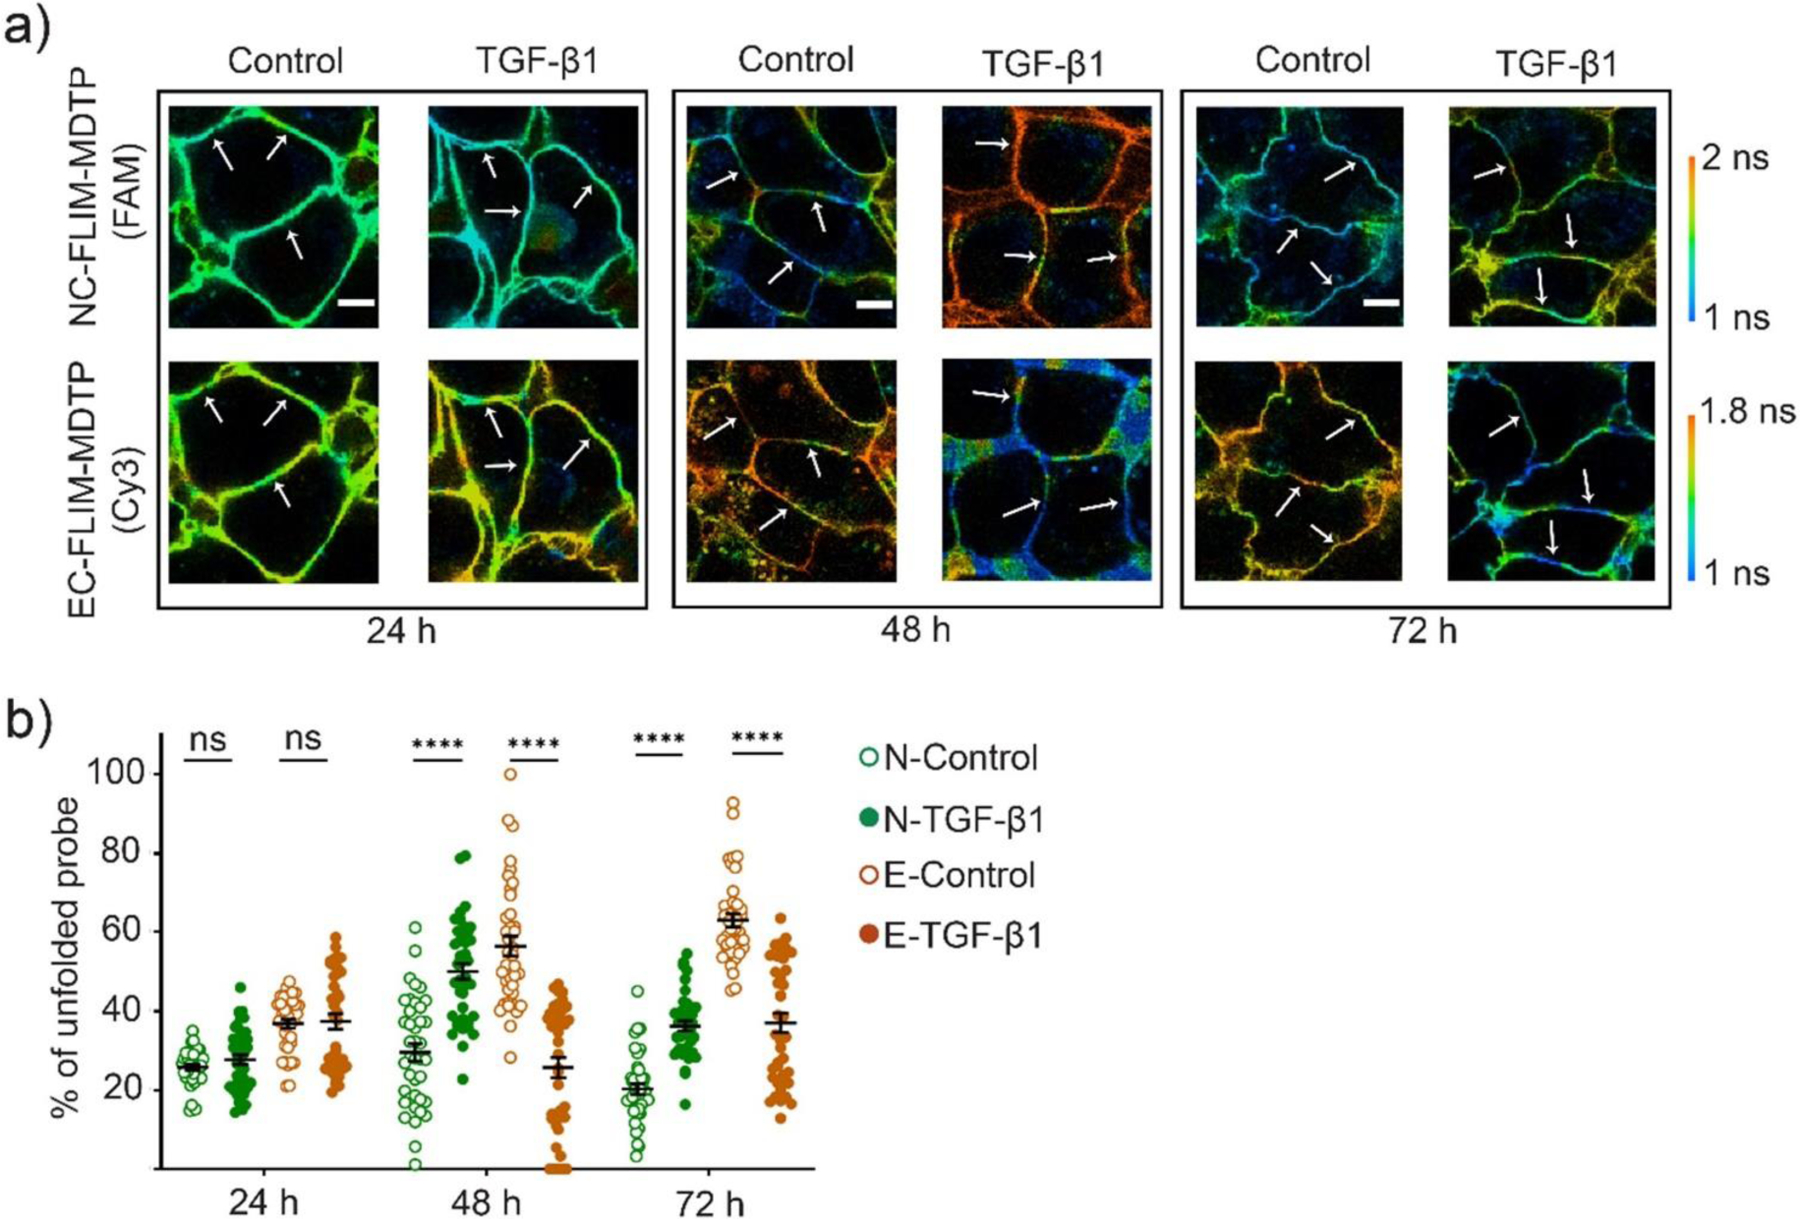
Imaging E-cadherin- and N-cadherin-mediated tension after different time treatment with 30 ng/mL of TGF-β1. (a) MCF7 cells were first treated with 1% DMSO (control) or 30 ng/mL of TGF-β1 for 24–72 h. Representative images were taken after incubating with 200 nM of NC-FLIM-MDTP (FAM) and EC-FLIM-MDTP (Cy3) for 30 min. Scale bar, 10 µm. (b) Percentages of the unfolded NC-FLIM-MDTP (FAM) and EC-FLIM-MDTP (Cy3) at each cell–cell junction after 24–72 h treatment with TGF-β1. Shown are mean and standard error of the mean (SEM) values from at least 40 junctions in each case. ****p< 0.0001 in two-tailed Student’s t-test; ns, not significant.
Conclusion
In this project, we developed a fluorescence lifetime imaging-based approach to measure molecular tensions at cell–cell junctions. Compared to the conventional fluorescence intensity-based DNA tension probes,[18,26] one major advantage of lifetime-based measurement is that its signal is concentration-independent. As a result, the so-called FLIM-MDTP can act as a self-referential system that provides quantitative imaging data without requiring any additional reference fluorophore for the calibration. This unique feature of lifetime measurement is very critical for membrane-anchored DNA probes, since these probes are normally heterogeneously distributed on the cell surfaces. Lifetime-based measurement is also less vulnerable to the light absorption or scattering events that will modulate fluorescence intensities. In addition, the FLIM-MDTP is quite suitable for the multiplexed imaging of forces. Because no reference fluorophore is needed, much less spectral overlap on the membranes can be expected. Meanwhile, fluorophores with similar excitation/emission wavelength can also be potentially distinguished based on their different lifetime values.
Using cadherin-mediated epithelial-mesenchymal transition as an example, we demonstrated, for the first time, that tension applied on different adhesion molecules can be simultaneously studied at the same cell–cell junctions. Our study indicated some intriguing correlations between N-cadherin and E-cadherin tensions during different stages of the EMT process. Simply by changing the conjugated ligand, the FLIM-MDTP can be applied to study various other intercellular mechanotransduction events. A wide choice of fluorophores and quenchers can be potentially incorporated within the FLIM-MDTP to allow even more sensitive and multiplexed imaging of molecular forces. We expect these powerful probes can be broadly used for studying mechanobiology.
Supplementary Material
Acknowledgements
The authors gratefully acknowledge NIH R35GM133507, Alfred P. Sloan research fellowship, a start-up grant from UMass Amherst and IALS M2M seed grant to M. You and NSF CMMI 1846866 to Y. Sun. The microscopy data was gathered in the Light Microscopy Facility and Nikon Center of Excellence at the Institute for Applied Life Sciences at UMass Amherst. We also thank every other member of the You Lab for useful discussion.
Footnotes
Supporting information for this article is given via a link at the end of the document.
Conflict of interest
The authors declare no conflict of interest.
Institute and/or researcher Twitter usernames: @UMassAmherst, @Keshri_Puspam, @Ybagherizarr, @UMassIALS
References
- [1].Artemenko Y, Axiotakis L, Borleis J, Iglesias PA, Devreotes PN, Proc. Natl. Acad. Sci 2016, 113, E7500–E7509. [DOI] [PMC free article] [PubMed] [Google Scholar]
- [2].Springer TA, Nature 1990, 346, 425–34. [DOI] [PubMed] [Google Scholar]
- [3].Chen CS, Tan J, Tien J, Annu. Rev. Biomed. Eng 2004, 6, 275–302. [DOI] [PubMed] [Google Scholar]
- [4].Polacheck WJ, Chen CS, Nat. Methods 2016, 13, 415–423. [DOI] [PMC free article] [PubMed] [Google Scholar]
- [5].Hoffman BD, Yap AS, Trends Cell Biol 2015, 25, 803–814. [DOI] [PubMed] [Google Scholar]
- [6].Vining KH, Mooney DJ, Nat. Rev. Mol. Cell Biol 2017, 18, 728–742. [DOI] [PMC free article] [PubMed] [Google Scholar]
- [7].Kalluri R, Weinberg RA, J. Clin. Invest 2009, 119, 1420–1428. [DOI] [PMC free article] [PubMed] [Google Scholar]
- [8].Iyer KV, Piscitello-Gómez R, Paijmans J, Jülicher F, Eaton S, Curr. Biol 2019, 29, 578–591.e5. [DOI] [PubMed] [Google Scholar]
- [9].Fredberg JJ, Weitz DA, Corey Hardin C, Trepat X, Rajendran K, Butler JP, Zhou EH, Zaman MH, Angelini TE, Serra-Picamal X, Tambe DT, Park CY, Nat. Mater 2011, 10, 469–475. [DOI] [PMC free article] [PubMed] [Google Scholar]
- [10].Liu Z, Ruiz SA, Cohen DM, Tan JL, Nelson CM, Chen CS, Yang MT, Sniadecki NJ, Proc. Natl. Acad. Sci 2010, 107, 9944–9949. [DOI] [PMC free article] [PubMed] [Google Scholar]
- [11].Meister A, Gabi M, Behr P, Studer P, Vörös J, Niedermann P, Bitterli J, Polesel-Maris J, Liley M, Heinzelmann H, Zambelli T, Nano Lett 2009, 9, 2501–2507. [DOI] [PubMed] [Google Scholar]
- [12].Dunn AR, Nelson WJ, Shcherbakova OG, Sorokina M, Borghi N, Weis WI, Pruitt BL, Proc. Natl. Acad. Sci 2012, 109, 12568–12573. [DOI] [PMC free article] [PubMed] [Google Scholar]
- [13].Conway DE, Breckenridge MT, Hinde E, Gratton E, Chen CS, Schwartz MA, Curr. Biol 2013, 23, 1024–1030. [DOI] [PMC free article] [PubMed] [Google Scholar]
- [14].Jurchenko C, Salaita KS, Mol. Cell. Biol 2015, 35, 2570–2582. [DOI] [PMC free article] [PubMed] [Google Scholar]
- [15].Zhang Y, Ge C, Zhu C, Salaita K, Nat. Commun 2014, 5, 5167. [DOI] [PMC free article] [PubMed] [Google Scholar]
- [16].Blakely BL, Dumelin CE, Trappmann B, McGregor LM, Choi CK, Anthony PC, Duesterberg VK, Baker BM, Block SM, Liu DR, Chen CS, Nat. Methods 2014, 11, 1229–1232. [DOI] [PMC free article] [PubMed] [Google Scholar]
- [17].Glazier R, Brockman JM, Bartle E, Mattheyses AL, Destaing O, Salaita K, Nat. Commun 2019, 10, 4507. [DOI] [PMC free article] [PubMed] [Google Scholar]
- [18].Zhao B, O’Brien C, Mudiyanselage APKKK, Li N, Bagheri Y, Wu R, Sun Y, You M, J. Am. Chem. Soc 2017, 139, 18182–18185. [DOI] [PubMed] [Google Scholar]
- [19].Chakraborty K, Veetil AT, Jaffrey SR, Krishnan Y, Annu. Rev. Biochem 2016, 85, 349–373. [DOI] [PMC free article] [PubMed] [Google Scholar]
- [20].Dan K, Veetil AT, Chakraborty K, Krishnan Y, Nat. Nanotechnol 2019, 14, 252–259. [DOI] [PMC free article] [PubMed] [Google Scholar]
- [21].Modi S, S. M. G., Goswami D, Gupta GD, Mayor S, Krishnan Y, Nat. Nanotechnol 2009, 4, 325–330. [DOI] [PubMed] [Google Scholar]
- [22].Saha S, Prakash V, Halder S, Chakraborty K, Krishnan Y, Nat. Nanotechnol 2015, 10, 645–651. [DOI] [PubMed] [Google Scholar]
- [23].Krishnan Y, Zou J, Jani MS, ACS Cent. Sci 2020, 6, 1938–1954. [DOI] [PMC free article] [PubMed] [Google Scholar]
- [24].Katherine Johansson M, Methods Mol. Biol 2006, 335, 17–29. [DOI] [PubMed] [Google Scholar]
- [25].Rothen-Rutishauser B, Riesen FK, Braun A, Günthert M, Wunderli-Allenspach H, J. Membr. Biol 2002, 188, 151–162. [DOI] [PubMed] [Google Scholar]
- [26].Zhao B, Li N, Xie T, Bagheri Y, Liang C, Keshri P, Sun Y, You M, Chem. Sci 2020, 11, 8558–8566. [DOI] [PMC free article] [PubMed] [Google Scholar]
- [27].Dongre A, Rashidian M, Reinhardt F, Bagnato A, Keckesova Z, Ploegh HL, Weinberg RA, Cancer Res 2017, 77, 3982–3989. [DOI] [PMC free article] [PubMed] [Google Scholar]
- [28].Loh C-Y, Chai JY, Tang TT, Wong WF, Sethi G, Shanmugam MK, Chong PP, Looi CY, Cells 2019, 8, 1118. [DOI] [PMC free article] [PubMed] [Google Scholar]
- [29].Xu J, Lamouille S, Derynck R, Cell Res 2009, 19, 156–172. [DOI] [PMC free article] [PubMed] [Google Scholar]
- [30].Leckband DE, de Rooij J, Annu. Rev. Cell Dev. Biol 2014, 30, 291–315. [DOI] [PubMed] [Google Scholar]
- [31].Shewan AM, Maddugoda M, Kraemer A, Stehbens SJ, Verma S, Kovacs EM, Yap AS, Mol. Biol. Cell 2005, 16, 4531–4542. [DOI] [PMC free article] [PubMed] [Google Scholar]
- [32].Radisky ES, Radisky DC, Mammary Gland Biol J. Neoplasia 2010, 15, 201–212. [DOI] [PMC free article] [PubMed] [Google Scholar]
- [33].Kim M-C, Cui F-J, Kim Y, Asian Pacific J. Cancer Prev. 2013, 14, 3625–3630. [DOI] [PubMed] [Google Scholar]
- [34].Ratner B, Targeting J, Meas. Anal. Mark 2009, 17, 139–142. [Google Scholar]
- [35].Maeda M, Johnson KR, Wheelock MJ, J. Cell Sci 2005, 118, 873–887. [DOI] [PubMed] [Google Scholar]
Associated Data
This section collects any data citations, data availability statements, or supplementary materials included in this article.


