
Fig. 7.
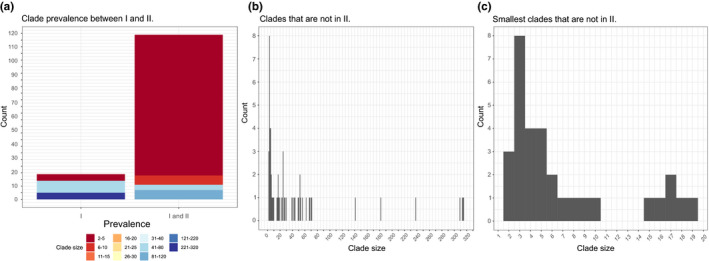
Clade prevalence on the strict consensus trees from the analyses of the 505 terminal dataset (I) and the subset of 315 terminals from which we removed putative recombinants (II). (a) Clade prevalence between I and II. (b) All clades that are not in II. (c) The smallest clades (<20 terminals) that are not in II. [Colour figure can be viewed at wileyonlinelibrary.com]