

Abstract
Obesity is a major risk factor for the development of severe coronavirus disease 2019 (COVID‐19) infection and mortality. However, it is not known whether patients with obesity are at a greater risk of developing postacute sequelae of COVID‐19 (PASC). In a median follow‐up time of 8 months and counting from 30 days following a positive viral test of 2839 patients who did not require intensive care unit admission and survived the acute phase of COVID‐19, 1230 (43%) patients required medical diagnostic tests, 1255 (44%) patients underwent hospital admission, and 29 (1%) patients died. Compared with patients with a normal body mass index (BMI), the risk of hospital admission was 28% and 30% higher in patients with moderate and severe obesity, respectively. The need for diagnostic tests to assess different medical problems, compared with patients with normal BMI, was 25% and 39% higher in patients with moderate and severe obesity, respectively. The findings of this study suggest that moderate and severe obesity (BMI ≥ 35 kg/m2) are associated with a greater risk of PASC.
Keywords: cohort study, observational study, weight control
1. INTRODUCTION
Emerging data indicate that some coronavirus disease 2019 (COVID‐19) survivors experience symptoms beyond the usual recovery time of severe acute respiratory syndrome coronavirus 2 (SARS‐CoV‐2) infection. These symptoms and problems, collectively called the postacute sequelae of COVID‐19 (PASC), can range from mild to disabling severity and can affect different body organs and systems. 1 , 2 , 3 , 4
Obesity is a major risk factor for development of severe COVID‐19 infection and mortality. Obesity, as a pro‐inflammatory and pro‐thrombotic disease, can impair the immune system, and is associated with cardiovascular, pulmonary and metabolic disorders that can worsen the outcomes of COVID‐19 infection during the acute phase. 5 , 6 , 7 , 8 , 9 , 10 , 11 However, it is not known whether patients with obesity are at a greater risk of developing PASC.
2. METHODS
This is a retrospective analysis of a prospective, observational, institutional review board‐approved clinical registry of all patients tested positive by RT‐PCR for SARS‐CoV‐2 infection within the Cleveland Clinic Health System (CCHS) in a 5‐month period from 11 March to 30 July 2020, with follow‐up until 27 January 2021.
Patients who did not have their routine care at CCHS, patients with missing baseline body mass index (BMI) data, a history of organ transplant, active cancer, and current pregnancy at the time of positive testing, and patients who died or required admission to the intensive care unit (ICU) within the first 30 days after the positive viral test, were excluded.
Three prespecified outcomes of interest that occurred 30 days or later after the first positive viral test included hospital admission, all‐cause mortality, and a composite variable of any diagnostic tests. These outcomes, which collectively could indicate the presence of PASC, were compared among patients with a BMI of 18.5 to 24.9 (normal), 25 to 29.9 (overweight), 30 to 34.9 (mild obesity), 35 to 39.9 (moderate obesity) and 40 kg/m2 or higher (severe obesity).
Diagnostic tests were chosen to serve as a proxy for symptoms and disorders related to different body organ systems and included nervous system, cardiac, pulmonary, vascular, renal, hepatic, gastrointestinal, endocrine, haematological and mental health. The study assumption was that patients probably had symptoms and problems to a severe extent, which led to the ordering of diagnostic tests by their medical team.
The five BMI groups were compared over time with first occurrence for the three outcomes of interest and individual groups of diagnostic tests for each body organ system using Kaplan‐Meier estimation and Cox proportional hazards models adjusted for age, sex, race, ethnicity and smoking status. Stratified log‐rank tests were used to compare Kaplan‐Meier curves. In the Cox model, the overall P values comparing all five BMI groups were calculated and presented. Additionally, normal BMI (18‐24.9 kg/m2) was considered as a reference and adjusted hazard ratios (HRs) with 95% confidence intervals (CIs) for comparison of other BMI groups with the reference group were estimated. The proportionality assumption over time was evaluated using weighted Schoenfeld residuals. A significance level of .05 for two‐sided comparisons was considered statistically significant. Given the observational nature of the study and the potential for type 1 error because of multiple comparisons, the findings should be interpreted as exploratory.
3. RESULTS
In total, 2839 patients (52% female, 58% white, with a mean age 52.7 ± 20.1 years) who did not require ICU admission and survived the acute phase of COVID‐19 were included. In a median follow‐up time of 8 months and counting from 30 days following a positive viral test, 1230 (43%) patients required diagnostic tests, 1255 (44%) patients underwent hospital admission, and 29 (1%) patients died. Assessments of pulmonary (23%) and cardiac (22%) problems were the most common investigations in the follow‐up of COVID‐19 survivors (Table 1).
TABLE 1.
Baseline characteristics and outcomes by body mass index (BMI) group at 30 or more days
| Factor | Total (N = 2839) | <25 (N = 613) | 25‐29.9 (N = 869) | 30‐34.9 (N = 641) | 35‐39.9 (N = 378) | ≥40 (N = 338) | P value |
|---|---|---|---|---|---|---|---|
| Demographics | |||||||
| Age (y) | 52.7 ± 20.1 | 54.0 ± 24.2 4 , 5 | 54.5 ± 20.1 4 , 5 | 54.3 ± 18.8 4 , 5 | 49.8 ± 16.5 1 , 2 , 3 | 46.3 ± 16.0 1 , 2 , 3 | <.001 a |
| Gender | <.001 c | ||||||
| Male | 1316 (46.4) | 273 (44.5) 5 | 451 (51.9) 5 | 314 (49.0) 5 | 168 (44.4) 5 | 110 (32.5) 1 , 2 , 3 , 4 | |
| Female | 1486 (52.3) | 331 (54.0) | 410 (47.2) | 318 (49.6) | 207 (54.8) | 220 (65.1) | |
| Other | 37 (1.3) | 9 (1.5) | 8 (0.92) | 9 (1.4) | 3 (0.79) | 8 (2.4) | |
| Race | <.001 c | ||||||
| White | 1653 (58.2) | 394 (64.3) | 569 (65.5) | 357 (55.7) | 184 (48.7) | 149 (44.1) | |
| Black/African American | 1026 (36.1) | 173 (28.2) | 249 (28.7) | 252 (39.3) | 176 (46.6) | 176 (52.1) | |
| Other | 160 (5.6) | 46 (7.5) 3 , 4 , 5 | 51 (5.9) 3 , 4 , 5 | 32 (5.0) 1 , 2 , 5 | 18 (4.8) 1 , 2 | 13 (3.8) 1 , 2 , 3 | |
| Ethnicity | .075c | ||||||
| Non‐Hispanic | 2592 (91.3) | 566 (92.3) | 780 (89.8) | 579 (90.3) | 348 (92.1) | 319 (94.4) | |
| Hispanic | 247 (8.7) | 47 (7.7) | 89 (10.2) | 62 (9.7) | 30 (7.9) | 19 (5.6) | |
| Smoking status | .39c | ||||||
| Never | 1740 (61.3) | 369 (60.2) | 554 (63.8) | 382 (59.6) | 225 (59.5) | 210 (62.1) | |
| Former smoker | 806 (28.4) | 170 (27.7) | 229 (26.4) | 193 (30.1) | 112 (29.6) | 102 (30.2) | |
| Current smoker | 293 (10.3) | 74 (12.1) | 86 (9.9) | 66 (10.3) | 41 (10.8) | 26 (7.7) | |
| Follow‐up | |||||||
| Follow‐up (mo) | 8.0 (1.02, 10.5) | 8.0 (1.02, 10.5) | 8.1 (1.05, 10.5) | 8.0 (1.02, 10.4) | 7.9 (1.02, 10.4) | 8.2 (1.1, 10.4) | .37b |
| Outcomes (≥30 d) | |||||||
| Hospital admission | 1255 (44.2) | 258 (42.1) 4 , 5 | 365 (42.0) 4 , 5 | 260 (40.6) 4 , 5 | 194 (51.3) 1 , 2 , 3 | 178 (52.7) 1 , 2 , 3 | <.001 c |
| Mortality | 29 (1.02) | 11 (1.8) | 6 (0.69) | 6 (0.94) | 3 (0.79) | 3 (0.89) | .36d |
| Any diagnostic test ‡ | 1230 (43.3) | 253 (41.3) 5 | 355 (40.9) 5 | 272 (42.4) | 177 (46.8) | 173 (51.2) 1 , 2 | .008 c |
| Diagnostic tests of different systems | |||||||
| Nervous system | 255 (9.0) | 64 (10.4) | 78 (9.0) | 47 (7.3) | 35 (9.3) | 31 (9.2) | .44c |
| Cardiac | 624 (22.0) | 116 (18.9) 5 | 181 (20.8) 5 | 137 (21.4) 5 | 88 (23.3) | 102 (30.2) 1 , 2 , 3 | .001 c |
| Pulmonary | 649 (22.9) | 132 (21.5) | 186 (21.4) 5 | 135 (21.1) 5 | 97 (25.7) | 99 (29.3) 2 , 3 | .014 c |
| Vascular | 160 (5.6) | 28 (4.6) 5 | 50 (5.8) | 26 (4.1) 5 | 25 (6.6) | 31 (9.2) 1 , 3 | .011 c |
| Renal | 180 (6.3) | 25 (4.1) 5 | 52 (6.0) | 46 (7.2) | 25 (6.6) | 32 (9.5) 1 | .019 c |
| Hepatic | 78 (2.7) | 19 (3.1) | 22 (2.5) | 11 (1.7) | 13 (3.4) | 13 (3.8) | .27c |
| Gastrointestinal | 368 (13.0) | 63 (10.3) 5 | 116 (13.3) | 77 (12.0) | 55 (14.6) | 57 (16.9) 1 | .041 c |
| Endocrine | 12 (0.42) | 1 (0.16) | 2 (0.23) | 4 (0.62) | 3 (0.79) | 2 (0.59) | .35d |
| Haematological | 490 (17.3) | 120 (19.6) | 134 (15.4) | 114 (17.8) | 61 (16.1) | 61 (18.0) | .29c |
| Mental health | 37 (1.3) | 3 (0.49) 5 | 6 (0.69) 5 | 7 (1.09) | 10 (2.6) | 11 (3.3) 1 , 2 | <.001 d |
Note: Statistics presented as mean ± SD, median (min, max), N (column %). Statistically significant differences are highlighted in bold.
P value column represents the global comparisons: a = ANOVA, b = Kruskal‐Wallis test, c = Pearson's chi‐square test, d = Fisher's Exact test.
Post hoc pairwise comparisons were performed using Bonferroni adjustment (P < .005).
Diagnostic tests were chosen to serve as proxy for symptoms and disorders related to different body organ systems and included nervous system (computed tomography [CT] and magnetic resonance imaging [MRI] of brain or spine, electroencephalogram, electromyography and lumbar puncture), cardiac (electrocardiogram, echocardiogram, cardiac stress test, nuclear scan, and catheterization, serum troponin and creatine kinase myocardial band (CKMB)), pulmonary (chest x‐ray, CT, pulmonary function test, spirometry and diffusing capacity of the lungs for carbon monoxide (DLCO)), vascular (serum D‐dimer, lower extremity duplex scan, lung ventilation‐perfusion scan), renal (urine albumin, kidney ultrasound and biopsy), hepatic (antinuclear, antismooth muscle and antimitochondrial antibodies, viral hepatitis panel, liver vascular ultrasound and liver biopsy), gastrointestinal (upper or lower endoscopy, CT of abdomen or pelvis, serum amylase, lipase), endocrine (serum C‐peptide, ketons, hydroxybutyric acid, glutamic acid decarboxylase and anti‐islet antibody), haematologic (erythrocyte sedimentation rate (ESR), C‐reactive protein, blood culture, and bone marrow aspiration and biopsy), and mental health (consult order to psychology or psychiatry). Commonly ordered tests in daily clinical practice including complete blood counts, renal function tests, liver function tests, HbA1c, urinalysis and lipid panel were not considered.
Pairwise comparisons if overall comparisons are significant:
Significantly different from <25.
Significantly different from 25 to 29.9.
Significantly different from 30 to 34.9.
Significantly different from 35 to 39.9.
Significantly different from ≥40.
Any diagnostic test includes any test ordered across the 10 specific systems.
Hospital admission rates in patients with normal BMI, overweight, mild, moderate and severe obesity were 42%, 42%, 41%, 51% and 53%, respectively (Table 1 and Figure 1), with an HR of 1.30 (95% CI 1.06 to 1.59) for severe obesity versus normal BMI, and an HR of 1.28 (95% CI 1.05 to 1.56) for moderate obesity versus normal BMI (P = .006) (Table 2 and Figure 2).
FIGURE 1.
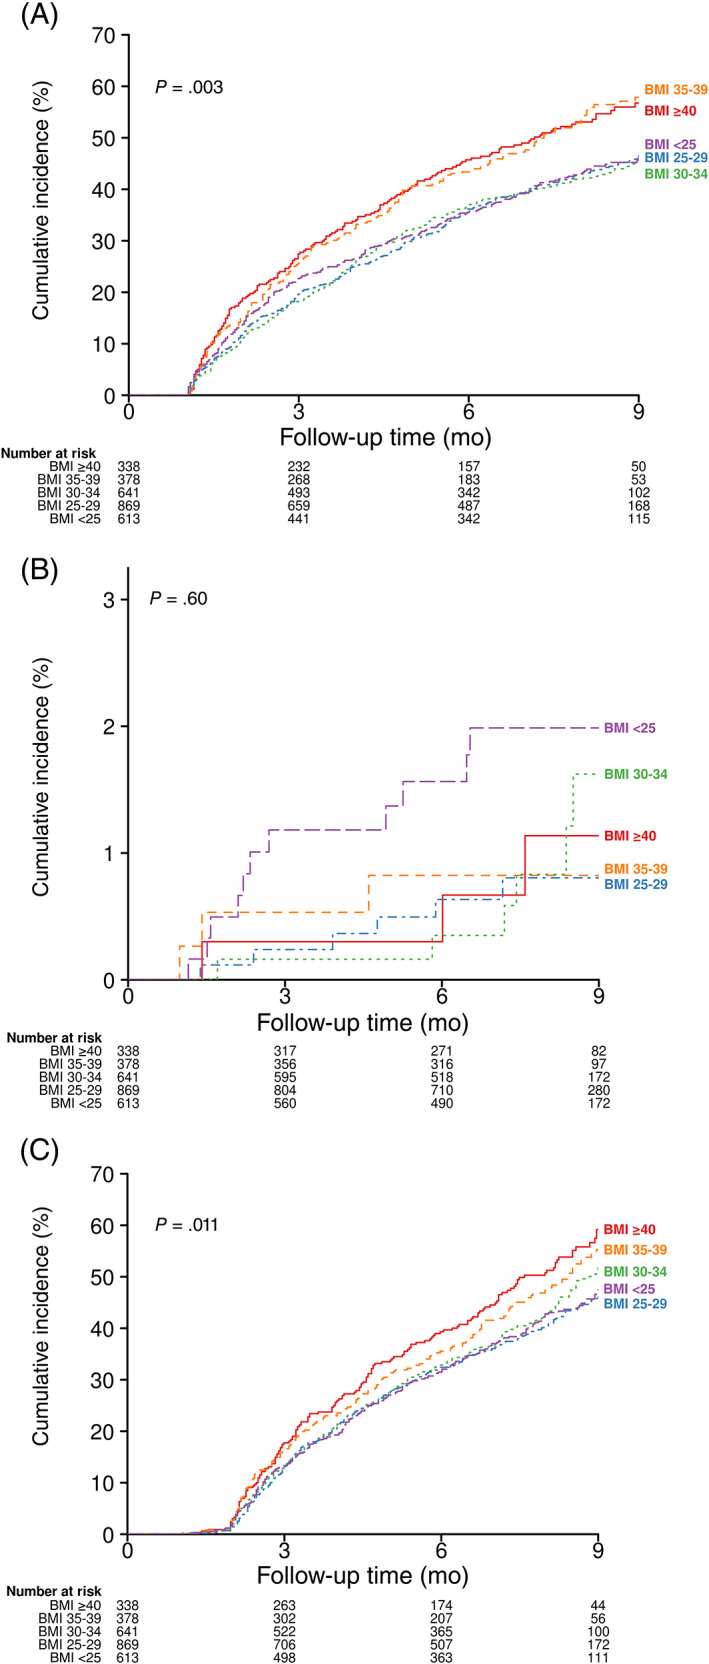
Kaplan‐Meier curves of COVID‐19 survivors over time to A, hospital admission, B, mortality, and C, the ordering of any diagnostic test in five body mass index (BMI, kg/m2) groups. P values are from the stratified log‐rank tests for comparison of Kaplan‐Meier curves
TABLE 2.
Adjusted hazard ratios with 95% confidence intervals for study outcome comparisons of body mass index (BMI) groups at 30 or more days
| Factor | BMI 25‐29 vs. BMI 18‐24.9 | BMI 30‐34 vs. BMI 18‐24.9 | BMI 35‐39 vs. BMI 18‐24.9 | BMI ≥40 vs. BMI 18‐24.9 | P value |
|---|---|---|---|---|---|
| Hospital admission | 1.02 (0.86, 1.21) | 0.99 (0.83, 1.19) | 1.28 (1.05, 1.56) | 1.30 (1.06, 1.59) | .006 |
| Mortality | 0.57 (0.20, 1.61) | 0.83 (0.29, 2.37) | 1.13 (0.29, 4.50) | 0.96 (0.19, 4.89) | .83 |
| Any diagnostic test a | 1.00 (0.84, 1.19) | 1.11 (0.92, 1.33) | 1.25 (1.02, 1.53) | 1.39 (1.13, 1.71) | .004 |
| Nervous system | 0.89 (0.63, 1.27) | 0.72 (0.48, 1.07) | 0.90 (0.58, 1.39) | 0.86 (0.54, 1.37) | .60 |
| Cardiac | 1.13 (0.88, 1.44) | 1.19 (0.92, 1.55) | 1.36 (1.01, 1.81) | 1.87 (1.41, 2.48) | <.001 |
| Pulmonary | 1.03 (0.81, 1.30) | 1.04 (0.81, 1.34) | 1.29 (0.98, 1.70) | 1.46 (1.10, 1.93) | .026 |
| Vascular | 1.41 (0.84, 2.36) | 1.14 (0.64, 2.02) | 1.76 (0.99, 3.14) | 2.43 (1.38, 4.27) | .013 |
| Renal | 1.53 (0.91, 2.56) | 2.00 (1.19, 3.38) | 2.03 (1.12, 3.69) | 3.22 (1.81, 5.74) | .001 |
| Hepatic | 0.75 (0.38, 1.47) | 0.63 (0.29, 1.37) | 1.26 (0.60, 2.65) | 1.44 (0.68, 3.05) | .21 |
| Gastrointestinal | 1.24 (0.90, 1.73) | 1.26 (0.89, 1.79) | 1.52 (1.04, 2.22) | 1.78 (1.21, 2.61) | .039 |
| Endocrine | 1.39 (0.12, 15.55) | 3.86 (0.43, 35.00) | 4.29 (0.44, 42.17) | 4.24 (0.37, 49.24) | .53 |
| Haematologic | 0.78 (0.60, 1.01) | 0.97 (0.74, 1.27) | 0.83 (0.60, 1.15) | 0.94 (0.67, 1.30) | .33 |
| Mental health | 1.59 (0.40, 6.40) | 2.42 (0.62, 9.45) | 5.23 (1.43, 19.20) | 5.55 (1.53, 20.14) | .013 |
Note: Adjusted for age, sex, race, ethnicity and smoking status. Statistically significant differences are highlighted in bold.
In the Cox models, the overall P value comparing all five BMI groups was calculated and presented. Additionally, normal BMI (18‐24.9 kg/m2) was considered as a reference and adjusted hazard ratios with 95% confidence intervals for comparison of other BMI groups with the reference group were estimated.
Any diagnostic test includes any test ordered across the 10 specific systems.
FIGURE 2.
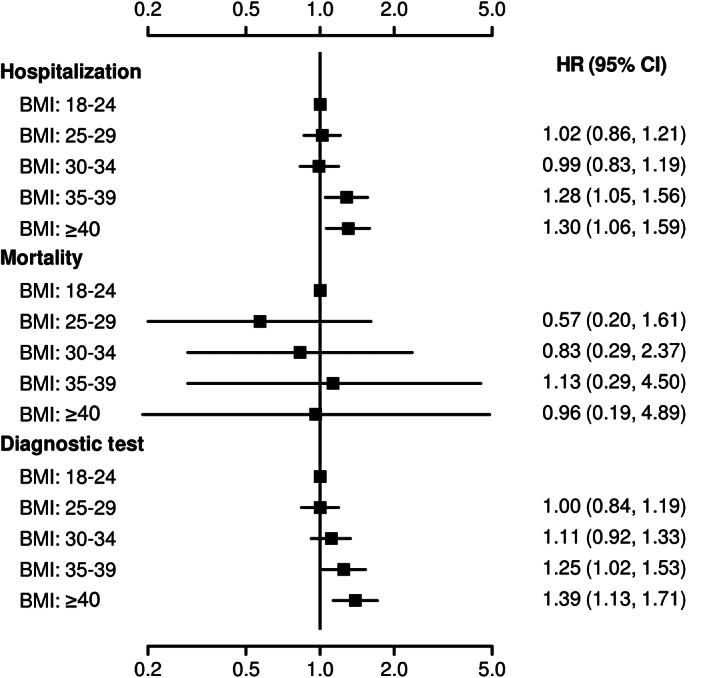
Outcomes stratified by five body mass index (BMI) groups: forest plot displaying adjusted hazard ratio (HR) and 95% confidence interval (CI) for each of the BMI subgroups compared with BMI 18 to 24.9 kg/m2 as a reference
The rates of ordering diagnostic tests in patients with normal BMI, overweight, mild, moderate and severe obesity were 41%, 41%, 42%, 47% and 51%, respectively (Table 1 and Figure 1), with an HR of 1.39 (95% CI 1.13 to 1.71) for severe obesity versus normal BMI, and an HR of 1.25 (95% CI 1.02 to 1.53) for moderate obesity versus normal BMI (P = .004) (Table 2 and Figure 2).
Likewise, the need for diagnostic tests to assess cardiac (P < .001), pulmonary (P = .026), vascular (P = .013), renal (P = .001), gastrointestinal (P = .039) and mental health problems (P = .013) was significantly higher in patients with a BMI of 35 kg/m2 or higher compared with normal BMI patients in adjusted analysis (Table 2).
Mortality rates were not significantly different among patients in different BMI groups (P = .83) (Table 2, Figures 1 and 2).
4. DISCUSSION
During the 10‐month follow‐up after the acute phase of COVID‐19, an additional 44% of patients required hospital admission and 1% died. These findings suggest a profound magnitude of the public health impact of PASC in the setting of worldwide infection.
Compared with patients with normal BMI, the risk of hospital admission was 28% and 30% higher in patients with moderate and severe obesity, respectively. The need for diagnostic tests, compared with patients with normal BMI, was 25% and 39% higher in patients with moderate and severe obesity, respectively. A similar pattern was observed in ordering diagnostic tests to assess cardiac, pulmonary, vascular, renal and gastrointestinal systems, as well as mental health. These findings indirectly indicate that the signs and symptoms related to these body organ systems were significantly more frequent in patients with moderate and severe obesity compared with patients with normal BMI. Collectively, the findings of this study suggest that patients with obesity are at a greater risk of developing PASC. This observation can be explained by all underlying mechanisms that deteriorate clinical outcomes during the acute phase of COVID‐19 in patients with obesity, including obesity‐related hyperinflammation, immune dysfunction and co‐morbidities. 5 , 6 , 7 , 8 , 9 , 10 , 11
Reports are emerging in the literature on different aspects of PASC, including its epidemiology, risk factors, pathophysiology, clinical pictures and consequences. 1 , 2 , 3 , 4 Four months after hospitalization, in an uncontrolled cohort study of 478 survivors of COVID‐19, at least one new‐onset symptom was reported by telephone interview in 51%, including fatigue (31%), cognitive symptoms (21%) and dyspnoea (16%). 1 Similarly, in a nationwide cohort study from the Veterans Affairs healthcare system in the United States on 1775 survivors of COVID‐19 during the acute phase, 20% were readmitted, 9% died, and 27% were readmitted or died by 60 days after their initial hospital discharge. Survivors with 60‐day readmission or death were older but otherwise were similar to survivors without readmission or death. 2 In a large study of 1733 adult patients discharged from hospital after recovering from COVID‐19 in Wuhan, China, 76% of patients reported at least one symptom at 6 months after COVID‐19 onset. In multivariable analysis, women and patients with more severe COVID‐19 during the acute phase had a greater risk of PASC and persistent psychological symptoms. 4 Consistent with these reports, the current study shows that PASC is an extremely common problem in COVID‐19 survivors. Additionally, this study, to our knowledge, for the first time suggests the greater risk of PASC in patients with moderate to severe obesity.
This study has several limitations, including a retrospective design from a single healthcare system, and the use of electronic medical records to capture data. In addition, the underlying reasons for hospitalization, mortality, and the ordering of diagnostic tests during the follow‐up phase are not known, and could be related to conditions unrelated to COVID‐19. Furthermore, mild forms of PASC, such as fatigue, muscle weakness, anxiety or sleep difficulties, which probably did not warrant the ordering of diagnostic tests or hospitalizations, were not captured. Moreover, the true prevalence of PASC among COVID‐19 patients remains unknown as many asymptomatic patients have never been tested. Lastly, additional factors such as other pre‐existing medical conditions (e.g. hypertension, hyperlipidaemia, diabetes, heart disease and chronic kidney disease), laboratory data (e.g. HbA1c and serum creatinine) and pharmacological agents would be important to include in our models as they are likely to increase with BMI and potentially impact the outcomes of interest. The lack of this information is a recognized limitation of our report. Future studies are planned to evaluate the impact of these co‐morbidities, laboratory values and pharmacological agents on the outcomes of interest in patients stratified by BMI category.
In conclusion, the findings of this study suggest that moderate and severe obesity (BMI ≥ 35 kg/m2) is associated with a greater risk of PASC. If it is confirmed by future studies that obesity is a major risk factor for the development of PASC, then a long‐term and rigorous follow‐up of patients with obesity after SARS‐CoV‐2 infection is warranted.
CONFLICT OF INTEREST
The authors have no conflicts of interest to declare.
AUTHOR CONTRIBUTIONS
All authors contributed in the concept and design of study, interpretation of data, and critical revision of manuscript. AA and JB contributed in acquisition of data. JP performed statistical analysis and AA prepared the first draft of manuscript. AA had full access to all of the data in the study and takes responsibility for the integrity of the data and the accuracy of the data analysis.
PEER REVIEW
The peer review history for this article is available at https://publons.com/publon/10.1111/dom.14454.
ACKNOWLEDGEMENTS
We acknowledge Greg Strnad and Robert Burton from Cleveland Clinic for creation of the database. They did not receive compensation for their role in the study.
Aminian A, Bena J, Pantalone KM, Burguera B. Association of obesity with postacute sequelae of COVID‐19. Diabetes Obes Metab. 2021;23(9):2183–2188. 10.1111/dom.14454
DATA AVAILABILITY STATEMENT
The data that support the findings of this study can be available on a reasonable request from the corresponding author after obtaining the permissions from Cleveland Clinic. The data are not publicly available due to privacy or ethical restrictions.
REFERENCES
- 1. Writing Committee for the COMEBAC Study Group , Morin L, Savale L, et al. Four‐month clinical status of a cohort of patients after hospitalization for COVID‐19. JAMA. 2021;325(15):1525‐1534. [DOI] [PMC free article] [PubMed] [Google Scholar]
- 2. Donnelly JP, Wang XQ, Iwashyna TJ, Prescott HC. Readmission and death after initial hospital discharge among patients with COVID‐19 in a large multihospital system. JAMA. 2021;325(3):304‐306. [DOI] [PMC free article] [PubMed] [Google Scholar]
- 3. Logue JK, Franko NM, McCulloch DJ, et al. Sequelae in adults at 6 months after COVID‐19 infection. JAMA Netw Open. 2021;4(2):e210830. [DOI] [PMC free article] [PubMed] [Google Scholar]
- 4. Huang C, Huang L, Wang Y, et al. 6‐month consequences of COVID‐19 in patients discharged from hospital: a cohort study. Lancet. 2021;397(10270):220‐232. [DOI] [PMC free article] [PubMed] [Google Scholar]
- 5. Popkin BM, Du S, Green WD, et al. Individuals with obesity and COVID‐19: a global perspective on the epidemiology and biological relationships. Obes Rev. 2020;21(11):e13128. [DOI] [PMC free article] [PubMed] [Google Scholar]
- 6. Stefan N, Birkenfeld AL, Schulze MB. Global pandemics interconnected ‐ obesity, impaired metabolic health and COVID‐19. Nat Rev Endocrinol. 2021;17(3):135‐149. [DOI] [PubMed] [Google Scholar]
- 7. Huang HK, Bukhari K, Peng CC, et al. The J‐shaped relationship between body mass index and mortality in patients with COVID‐19: a dose‐response meta‐analysis [published online ahead of print March 25, 2021]. Diabetes Obes Metab. 2021. 10.1111/dom.14382. [DOI] [PMC free article] [PubMed] [Google Scholar]
- 8. Gardiner J, Oben J, Sutcliffe A. Obesity as a driver of international differences in COVID‐19 death rates [published online ahead of print February 23, 2021]. Diabetes Obes Metab. 2021. 10.1111/dom.14357. [DOI] [PMC free article] [PubMed] [Google Scholar]
- 9. Smati S, Tramunt B, Wargny M, et al. Relationship between obesity and severe COVID‐19 outcomes in patients with type 2 diabetes: results from the CORONADO study. Diabetes Obes Metab. 2021;23(2):391‐403. [DOI] [PMC free article] [PubMed] [Google Scholar]
- 10. Peters SAE, MacMahon S, Woodward M. Obesity as a risk factor for COVID‐19 mortality in women and men in the UKbiobank: comparisons with influenza/pneumonia and coronary heart disease. Diabetes Obes Metab. 2021;23(1):258‐262. [DOI] [PMC free article] [PubMed] [Google Scholar]
- 11. Luo X, Jiaerken Y, Shen Z, et al. Obese COVID‐19 patients show more severe pneumonia lesions on CT chest imaging. Diabetes Obes Metab. 2021;23(1):290‐293. [DOI] [PMC free article] [PubMed] [Google Scholar]
Associated Data
This section collects any data citations, data availability statements, or supplementary materials included in this article.
Data Availability Statement
The data that support the findings of this study can be available on a reasonable request from the corresponding author after obtaining the permissions from Cleveland Clinic. The data are not publicly available due to privacy or ethical restrictions.