

Abstract
A method is developed for membrane labeling of erythrocytes with porphyrin-phospholipid (PoP). To generate a concentrated PoP solution for labeling human red blood cells (RBCs), various surfactants and solvents are screened to identify conditions that avoid hemolysis, while minimizing non-specific PoP co-precipitation with RBCs in the pellet during centrifugation washes. Cholate, Tween 80 and Tween 40 are identified as useful surfactants for this purpose. When labeled RBCs are mixed with unlabeled ones, substantial non-specific PoP exchange is observed. Egg-yolk lecithin is included in a washing buffer to remove loosely bound PoP and reduce PoP exchange with unlabeled erythrocytes, based on flow cytometry and photodynamic hemolysis assays. Murine RBCs that are labeled with 64Cu-chelated PoP displayed altered biodistribution with longer blood circulation relative to directly administered 64Cu-chelated PoP.
Keywords: porphyrin, membrane, erythrocyte, labeling, lipids
Graphical Abstract
Introduction
Fluorescent dyes have been used for labeling and tracking cells for various applications such as analysis of blood flow dynamics and observation of tissue microvasculature [1, 2]. Labeled red blood cells (RBCs) are used for this purpose for a variety of preclincial imaging applicaitons, often using fluorescence microscopy [3, 4]. Age dependent changes and survival tracking measurements of the red blood cells have been studied [5]. Modified RBCs have been propsed for use as drug delivery vehicles [6–8]. Due to their potentially lengthy circulation time and compatibility with biologic systems, re-introduced RBCs represent an interesting approach for imaging and therapeutic approahces. Besides fluorescent labeling of the bilayer, RBCs can be coated with numerous polymer materials [9–11].
Lipophilic indocarbocyanine dyes such as DiI (1,1′-dioctadecyl-3,3,3′,3′-tetramethylindocarbocyanine perchlorate) and DiO (3,3′-dioctadecyloxacarbocyanine perchlorate) are frequently used for labeling of cell membranes. Structurally, DiI and DiO have a hydrophilic head present above the cell membrane and two long chain aliphatic hydrocarbon tails, which insert in the cell lipid bilayer (Figure 1A). The lipophilic nature of the dyes and the cationic charge on the hydrophilic head indole rings allows for the stable incorporation into the negatively-charged RBC bilayer [12]. RBCs labeled with long chain hydrophobic carbocyanine dyes have a longer period of dye retention compared to the fluorescein and rhodamine derivative approaches which require more preparation time and have lower fluorescence intensities [13]. A recent study showed the use of these lipophilic dyes in combinations for individual labeling of multiple populations of the RBCs [14].
Figure 1. PoP labels human RBCs, but suffers from non-specific exchange.
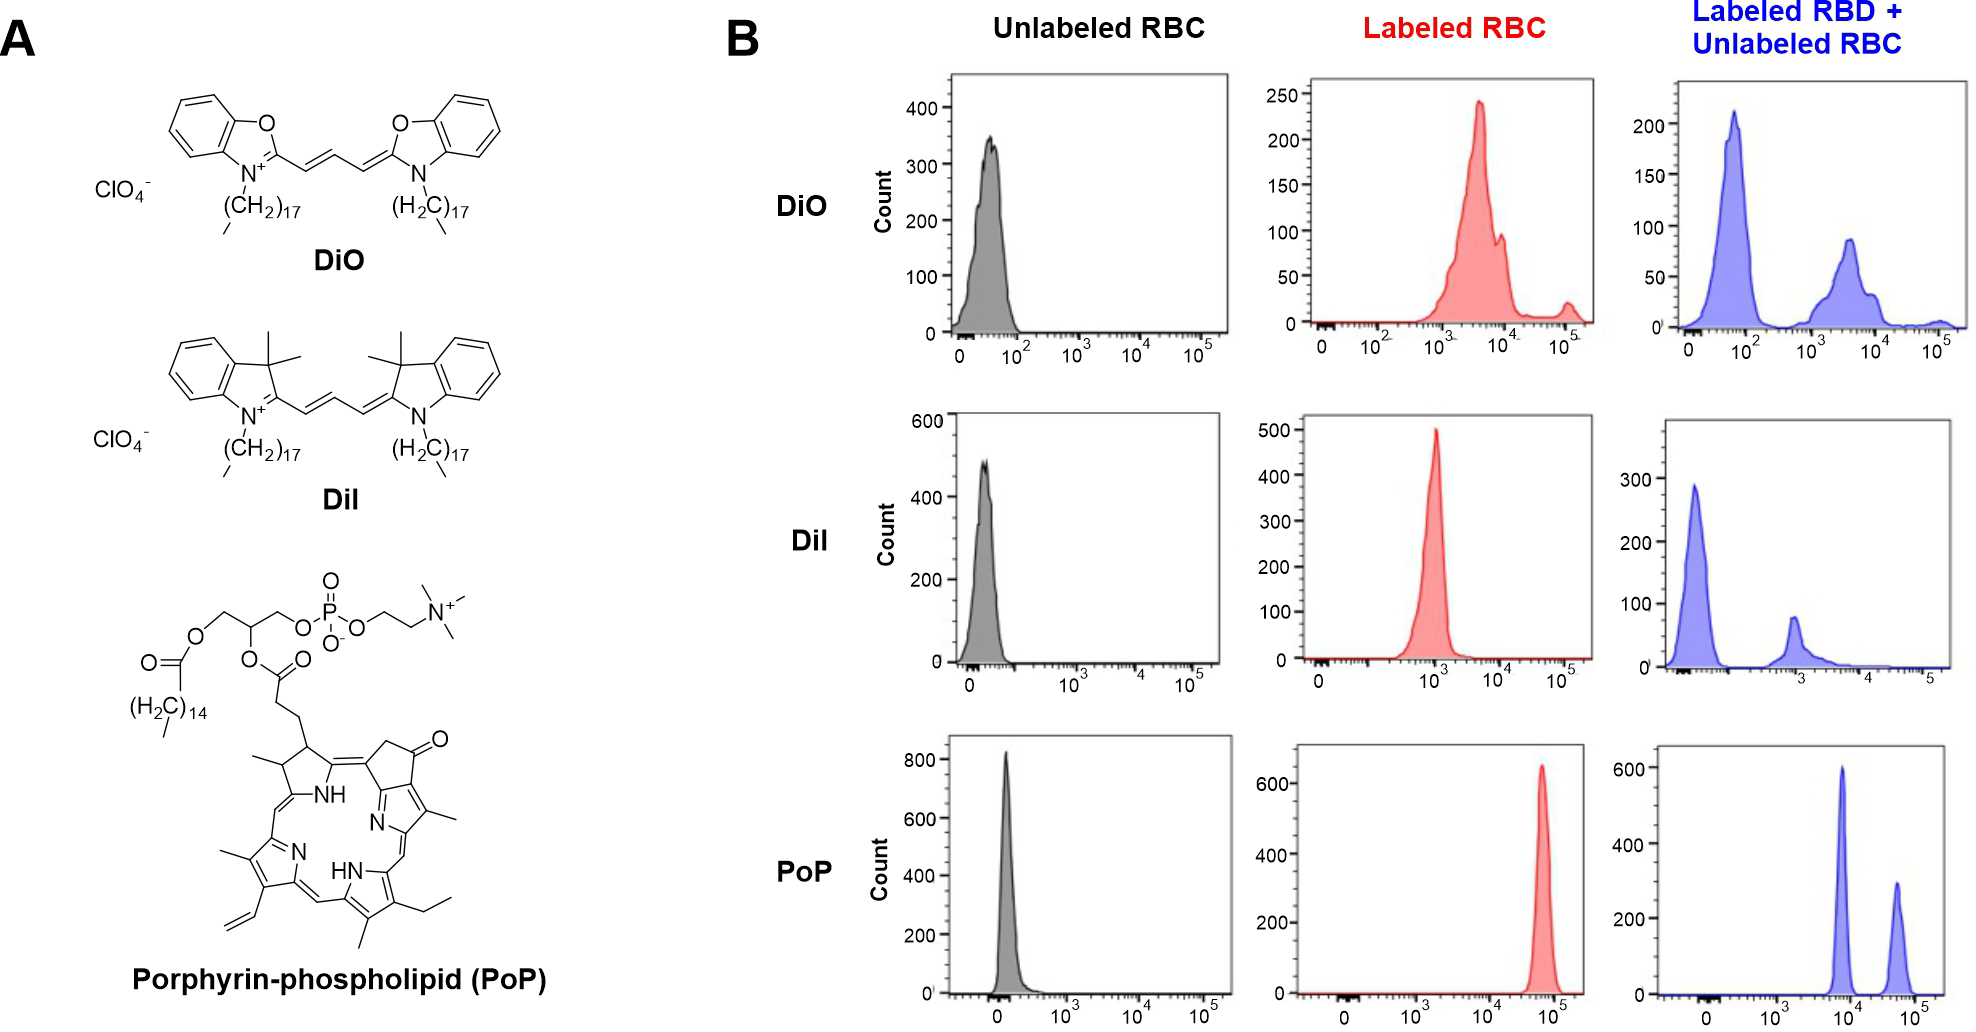
A) Structures of dyes used in this study. B) Fresh human blood was obtained and labeled with DiI or DiO (2 mg/mL in ethanol), or PoP (10 mg/mL in cholate surfactant). Samples were characterized using flow cytometry to assess brightness of indicated red blood cells and exchange when mixed with unlabeled cells.
The broader porphyrin family of molecules includes heme and chlorophyll, and exogenous porphyrins are a natural class of theranostic agents [15, 16]. Porphyrins can chelate metals, which confer additional functionality incuding biomedical contrast imaging [17]. When covalently conjugated to the lipid side chain of a phospholipid tail, the resulting porphyrin-phospholipid (PoP) conjugates (Figure 1A) assembles into phospholipid-like bilayers [18]. 64Cu, Mn and 99Tc labeled PoP has been demonstrated for preclinical imaging applications [19–22]. PoP constructs have been used in numerous phototherapy and drug delivery applications [23–25]. Notably, long-circulating liposomes with PoP incorporated have been shown to have minimal exchange of PoP while circulating in rodent blood [26].
The use of PoP to label pre-existing cell membranes has not been explored to the best of our knowledge. The purpose of this study is to develop a simple and stable RBC labeling methodology using PoP to generate labeled RBCs. Unlike generation of liposomes from lipids, RBCs have an exisitng bilayer, so avoiding hemolysis and minimizing the subsequent non-specific exchange of PoP to other cell membranes is considered.
Results
Freshly obtained human RBCs were labeled with PoP (sn-1-palmitoyl sn-2-pyropheophorbide-a phosphtatidylcholine), as well as DiI and DiO as comparators (Figure 1B). DiO and DiI solutions were prepared in ethanol at 2 mg/mL, a range recommended by the manufacturer, while PoP was prepared in a cholate surfactant at 10 mg/mL, which was found to be an optimal condition for labeling, as discussed further below. Based on flow cytometry, the unlabeled RBCs showed no fluorescence, whereas all labeled RBCs exhibited strong signal. The PoP-labeled RBCs, which were labeled at a higher fluorophore concentration, had the strongest fluorescence magnitude, followed by DiO and then DiI. To assess whether the RBCs were stably labeled, the labeled cells were mixed with unlabeled ones and incubated for 1 hr at 37 °C. Flow cytometry showed that after mixing, the fluorescence cell population of the DiI and DiO-labeled RBCs did not shift in intensity, while an unlabeled cell population appeared, as expected. This shows that these commonly-used membrane-localized tracers had minimal exchange, reflecting dye stability in the labeled membrane without transfer to unlabeled cells. On the other hand, PoP-labeled RBCs showed re-distribution of PoP to other RBCs in the sample, as indicated by the appearance of a new population of PoP-labeled cells with intermediate fluorescence intensity. This is an undesirable result for using PoP-labeled RBCs, since the dye would redistribute to other cells, making tracking difficult. Keeping this in mind, we set out to design an approach to overcome PoP exchange.
The first step in developing an improved RBC labeling method was to form the PoP labeling mixture, since PoP has partial hydrophobic character and therefore limited solubility in water. Various surfactants and solvents were considered for dissolving PoP. Since the intent is to combine PoP dissolved in the surfactant with the RBCs, the surfactant working range in which erythrocyte hemolysis could be avoided was assessed. The surfactants considered included Triton X100, Tween 80, Cholate, Cremphor EL, Brij35, Tween 40 and Pluronic F127. Hemolysis induced following incubation with human RBCs was assessed at varying surfactant concentrations (Figure 2A). Triton X100 and Brij 35, followed by cholate induced the highest amount of hemolysis. Tween 40, Tween 80, Cremphor EL and Pluronic F127 were milder and induced substantially lower hemolysis.
Figure 2. Assessing detergents for hemolysis and PoP solubilization.
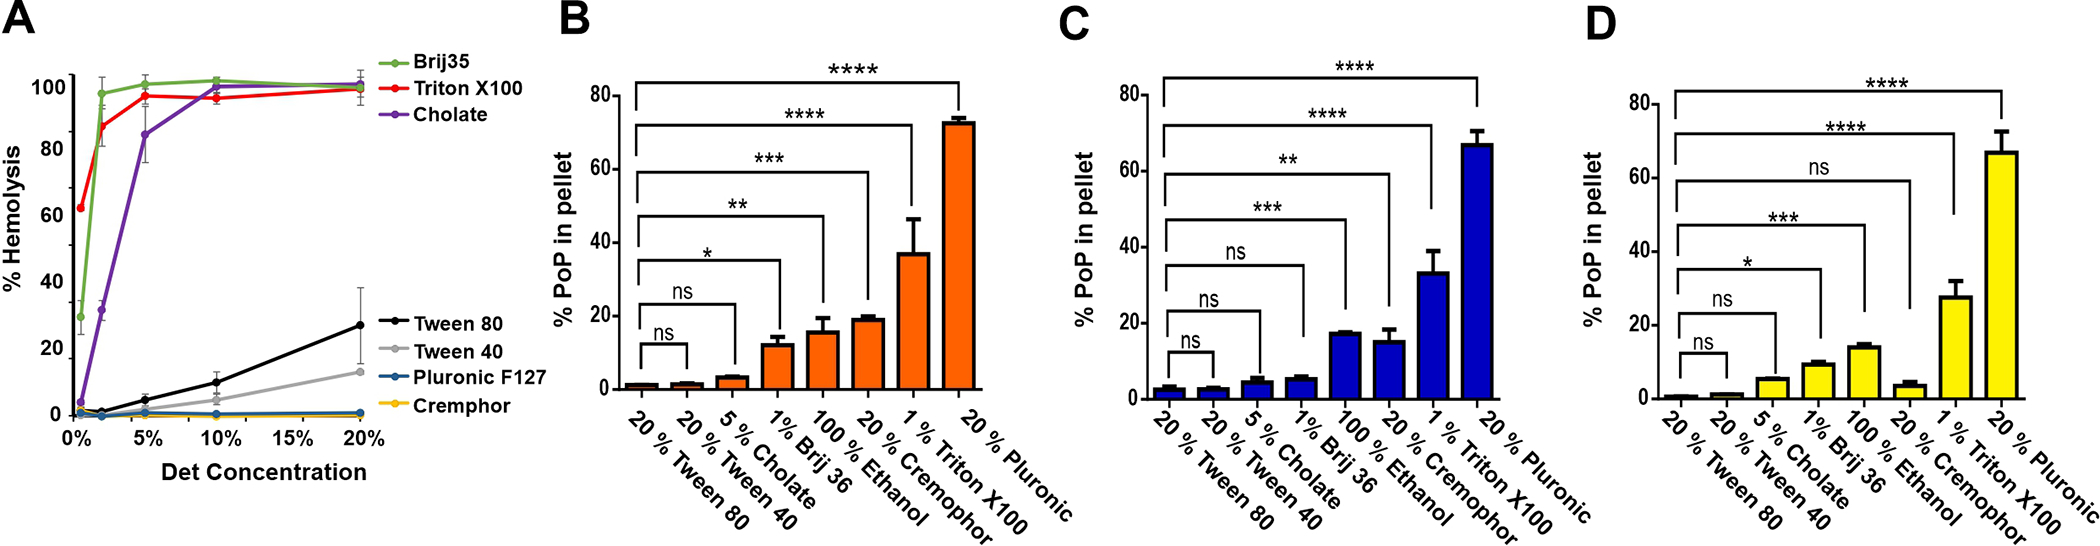
A) Surfactant-induced RBC hemolysis. Human RBCs were incubated with indicated surfactants and hemolysis was assessed. The capacity of the surfactants at the indicated concentration were assessed to dissolve PoP and prevent precipitation during centrifugation for PoP solutions at 10 (B), 5 (C), and 2 (D) mg/mL PoP. One way Anova statistical significance test shows p<0.0001, Siegel-Tukey multiple comparison tests performed between different surfactant groups. Data shows mean +/− SD for n=3.
Having established hemolysis conditions for each surfactant, the next step was to test PoP solubility in each surfactant solution. A surfactant concentration was selected so that when a labeling mixture containing the PoP (dissolved in surfactant) is diluted into a second tube solution containing RBCs, the surfactant concentration would be well below the hemolysis threshold. To that end, PoP solubility was assessed in 1% Brij-35, 5% cholate, 20% Cremphor EL, 20% Pluronic F127, 1% Triton X100, 20% Tween 40, 20% Tween 80, along with 100% ethanol, which was also considered as a potential labeling solution. The concentrations of PoP in solutions were 10 mg/mL (Figure 2B), 5 mg/mL (Figure 2C) and 2 mg/mL (Figure 2D). Following dissolution, the samples were centrifuged and the amount of insoluble PoP in the pellet was assessed. 5% Cholate, 20% Tween-40 and 20% Tween-80 showed the least amount of insoluble PoP, whereas 20 % Pluronic and 1 % Triton X100 were not effective at solubilizing PoP. Cremophor EL appeared ineffective at higher PoP concentrations, but at 2 mg/mL could effectively solubilize the PoP. Ethanol and Brij 35 had intermediate efficacy, however, at all PoP concentrations there was substantial undissolved PoP present. For most surfactants, there was not a clear trend between the PoP concentration in the surfactant and the amount of insoluble PoP. On the basis of minimizing insoluble PoP, 20% Tween 80, 20 % Tween 40 and 5 % cholate were considered for additional labeling studies.
PoP labeling solutions were then used to label human RBCs, by incubation and then repeated washing and centrifugation to remove unbound PoP. To determine labeling efficacy, flow cytometry was used to measure the fluorescence of PoP within RBCs. As shown in Figure 3A, when 10–90 μg of PoP was used to label RBCs using PoP labeling solutions containing cholate, Tween 40 or Tween 80, RBCs were labeled successfully, with orders of magnitude greater PoP fluorescence compared to the unlabeled RBCs. The cholate labeling solution produced RBCs with brighter fluorescence intensity compared to the Tween surfactants.
Figure 3. Efficacy of RBC labeling using cholate and Tween:
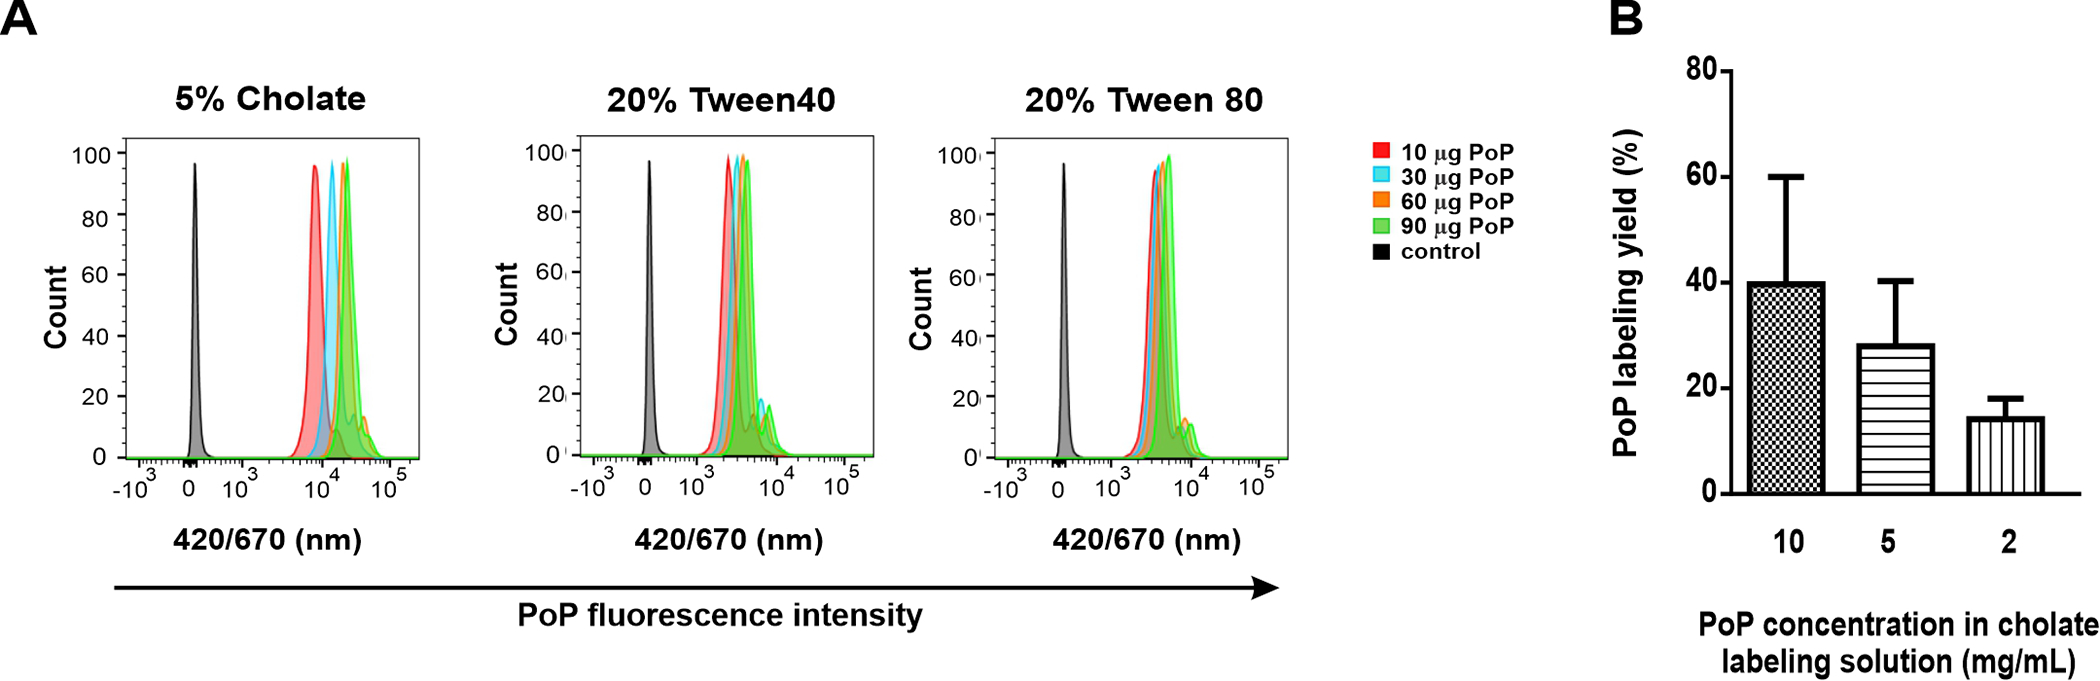
A) RBCs were incubated with PoP dissolved in the indicated surfactants and then were assessed by flow cytometry following labeling. B) PoP labeling yield as a function of PoP concentration. Data show mean +/− SD for n=3
The labeling efficacy of the RBCs in the PoP was also assessed with microplate reader examining the cell lysate fluorescence of isolated RBCs following detergent disruption of the membranes. Interestingly, the labeling yield appeared to increase as the PoP concentration increased (Figure 3B). This may be due to the increased cholate concentration with higher PoP concentrations. For most subsequent studies, 10 mg/mL PoP in 5% cholate was selected as the labeling solution. However, as shown in Figure 1 and as discussed below, the apparent labeling of RBCs with PoP in large part is non-stable, corresponding to loosely membrane-bound or associated PoP.
Figure 4A shows the concept of lecithin washing to remove loosely bound PoP from RBCs. Following labeling with the PoP solution, much of the PoP is loosely associated with the RBC membrane. By using lecithin in the wash buffer, loosely bound PoP adsorbed to RBCs can exchange with lecithin liposomes or micelles and be removed in the supernatant following centrifugation. Figure 4B shows flow cytometry data from an exchange study in which labeled RBCs (prepared with or without lecithin washing) were incubated with unlabeled RBCs. Unlabeled RBC (negative control) show no PoP fluorescence. After labeling in the conventional manner, the RBCs display increased PoP brightness. However, when unlabeled RBCs are incubated with these labeled RBCs, the fluorescence of the unlabeled RBCs subsequently increases substantially. The population of unlabeled RBCs thus became labeled from the PoP that exchanged from the labeled RBCs. However, if the labeled RBCs are subjected to lecithin washing, the unlabeled RBC population remains unlabeled. The lecithin washing process also decreased the PoP fluorescence of the labeled RBC population, as would be expected if the lecithin is removing loosely bound PoP.
Figure 4. (A.
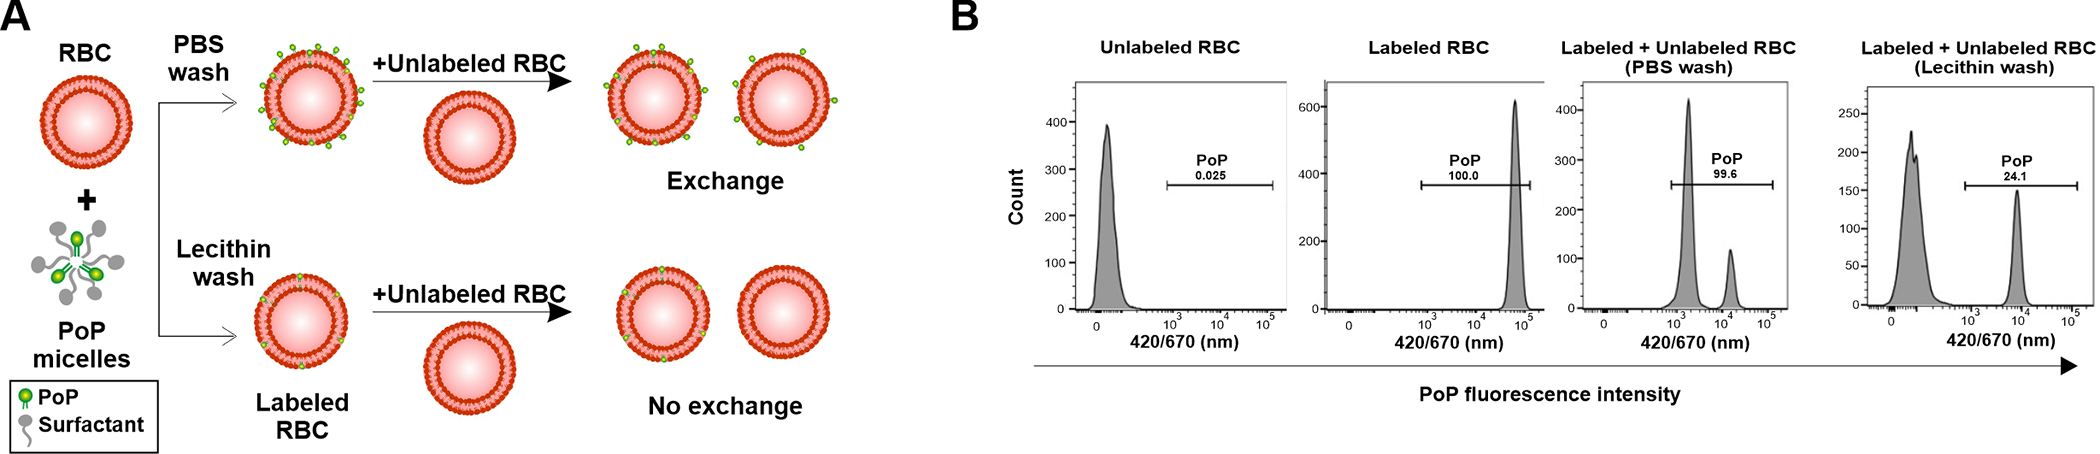
(A) Representation and (B) Flow cytometry characterization of PoP labeling of human RBCs using PBS wash and lecithin wash buffer.
The exchange of PoP-labeled RBCs, prepared with various washing conditions, with unlabeled RBCs was assessed with flow cytometry. Labeled and unlabeled RBC were incubated together at 37 °C for 1 hr and then assessed for their mean fluorescence intensity (MFI). As shown in Figure 5, when PoP-labeled RBCs were prepared washing them only in phosphate buffered saline (PBS), and then are mixed with unlabeled RBCs, a single population of intermediate MFI results. This reflects the exchange and equilibration of the PoP between labeled and unlabeled RBCs. However, when PoP-labeled RBCs are prepared with the lecithin washing and mixed with unlabeled RBC, the MFI did not significantly change. This indicates that lecithin-washed, PoP-labeled RBC do not exchange PoP as rapidly. As an alternative washing condition, we assessed whether BSA could also remove loosely associated PoP from RBCs. With BSA washing, labeled RBC still significantly exchanged PoP with unlabeled RBCs when mixed. The absolute MFI values also show that the lecithin washed RBC have approximately 5 fold lower PoP intensity. This would be expected as the lecithin removes PoP during the washing. These data also confirm the selection of cholate as an effective surfactant for the labeling solution, as the RBCs labeled with PoP dissolved in cholate generally had higher MFI following labeling regardless of the washing conditions.
Figure 5. Exchange of PoP in labeled RBCs with different washing conditions.
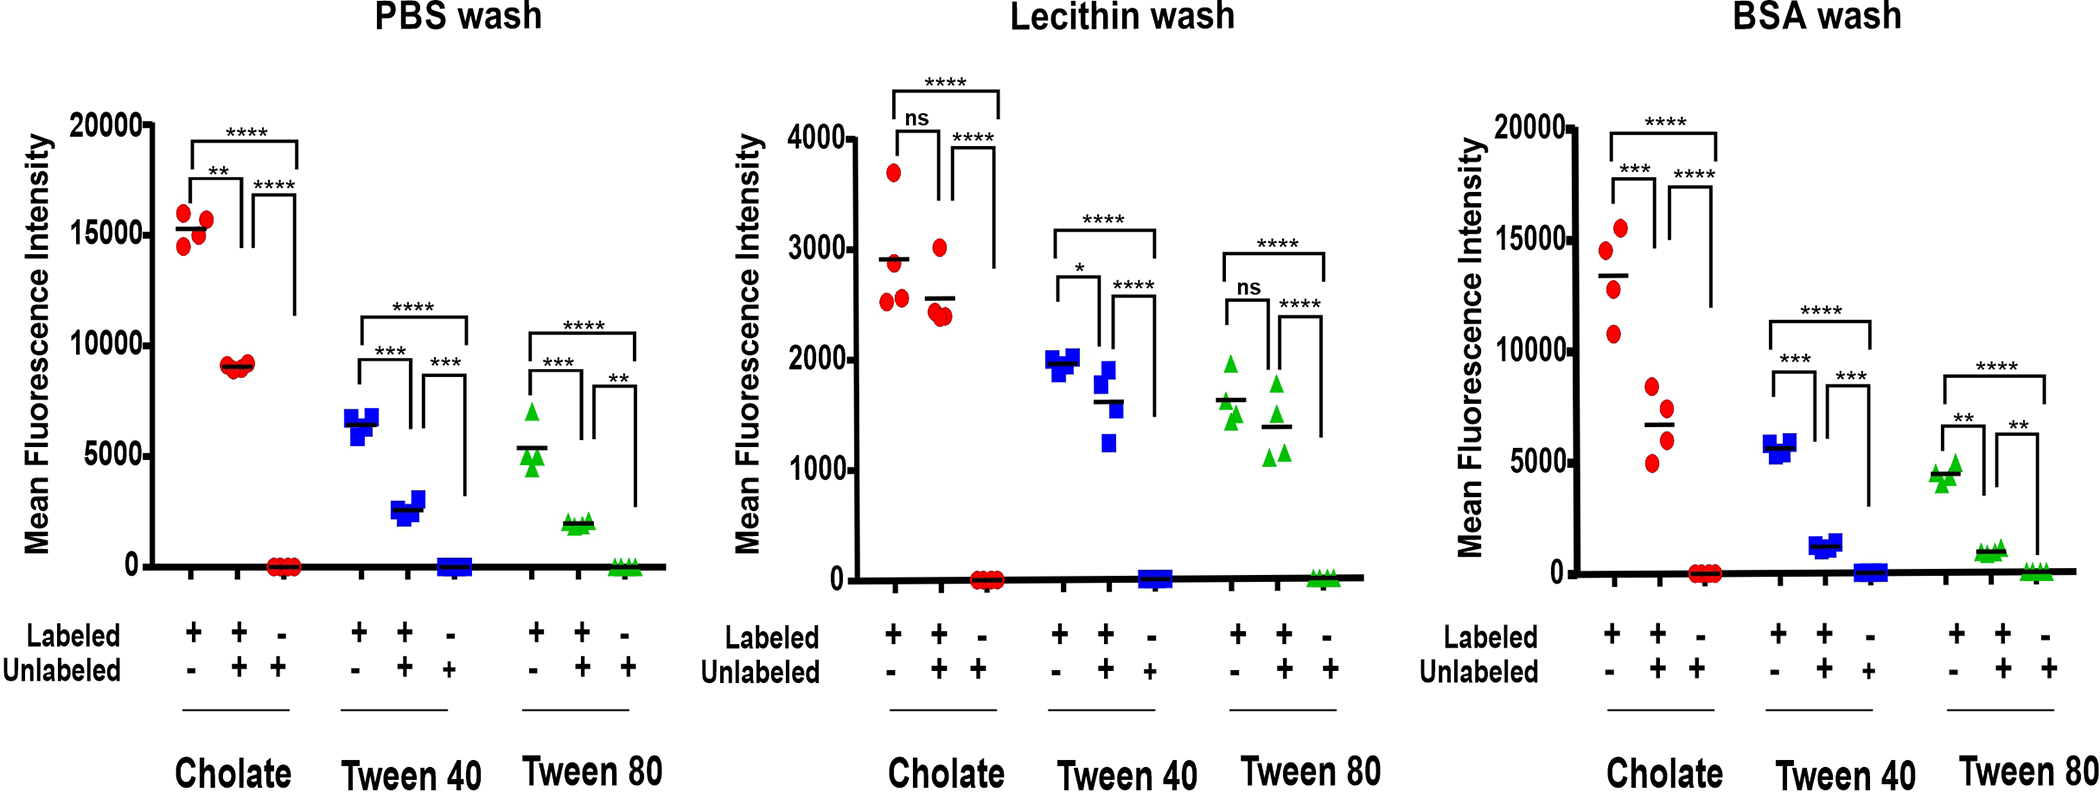
Mean fluorescence intensity values of labeled, unlabeled and mixed RBCs, which were prepared with the indicated labeling conditions and wash buffers. PBS, Lecithin and Bovine Serum Albumin were used as different wash buffers at 2 mg/mL concentrations. One way Anova Tukey statistical significance test for Cholate (p<0.0001), Tween 40 (p<0.0001) and Tween 80 (p<0.0001). Data shows mean +/− std. dev. for n=4
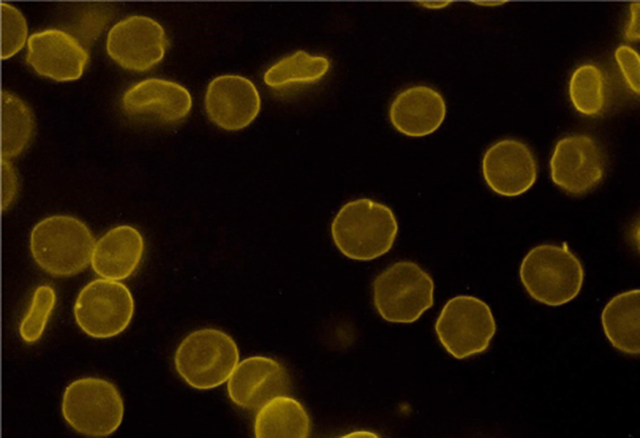
PoP-labeled erythrocytes were observed by fluorescence microscopy (Figure 6). The unlabeled RBCs do not show autofluorescence. PoP-labeled RBCs prepared without washing steps washing steps show a bright and signal. There appeared to be small amounts of aggregates of PoP in the samples, which may be due to the lack of washing. The final image shows PoP-labeled RBCs that were washed with lecithin and then mixed with an equal volume of unlabeled RBCs. In these conditions, only some of the cells in the sample were fluorescent, as would be expected in the absence of PoP exchange. Although not observed in Fig 6, in some cases, a spiky RBC echinocyte appearance was noted in labeled and unlabeled cells but was not further investigated.
Figure 6. Microscopic images of labeled human red blood cells in phase, fluorescence and merged channels.
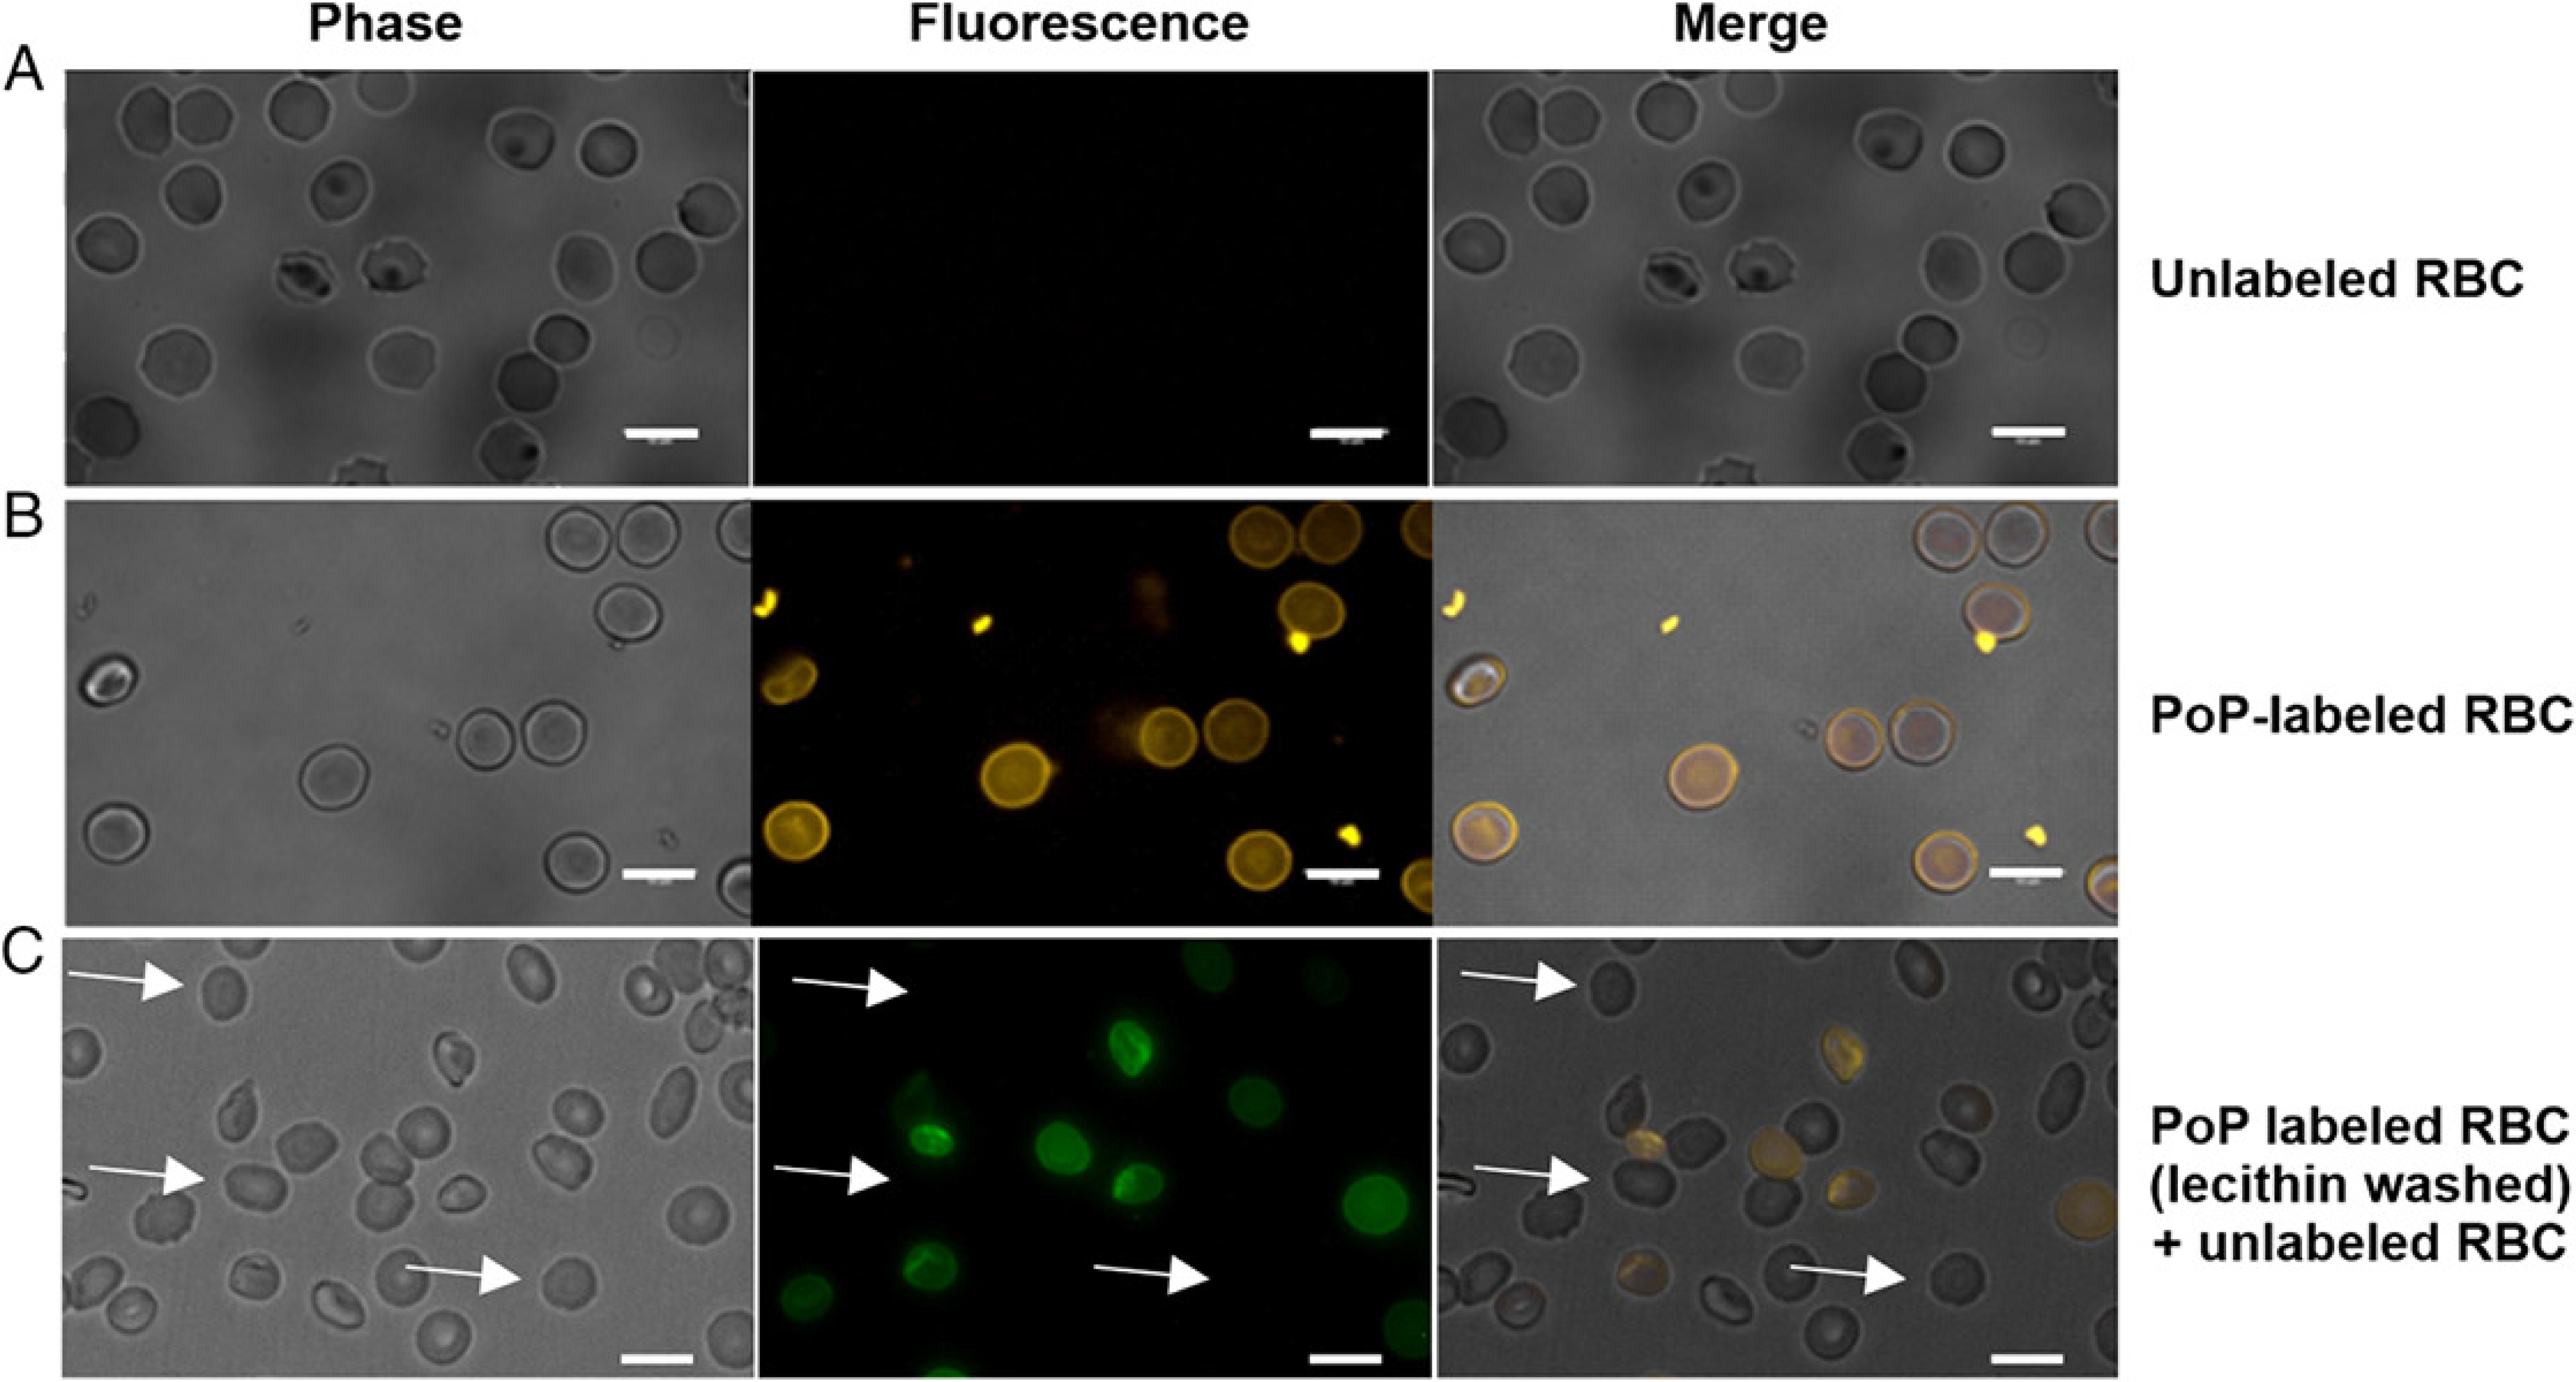
A) Unlabeled RBCs. B) PoP-labeled RBCs without washing. C) PoP labeled (lecithin-washed) mixed with unlabeled RBC. Arrows show the unlabeled RBCs.
PoP is not only a fluorophore, but also a photosensitizer capable of inducing singlet oxygen generation upon irradiation, which is the general premise of photodynamic therapy (PDT). PoP has been shown to destabilize bilayers via photo-oxidization of unsaturated lipids [27]. As such, PDT using labeled and unlabeled cells could provide another means to assess the exchange of PoP from labeled to unlabeled RBC.
RBCs, with or without PoP-labeling, were irradiated with red laser excitation at a fixed intensity and irradiation time, but at different fluence rates from 0 to 200 mW cm/2 (Figure 7A). PoP-labeled RBCs exhibited hemolysis that was dependent on the light dose, with nearly full hemolysis observed with 200 mW/cm2 irradiation for 300 seconds. Under these same irradiation conditions, normal, unlabeled RBC exhibited minimal release of hemoglobin. Similarly, the kinetics of hemolysis showed that during 300 seconds of irradiation, a steady increase in hemolysis occurred for PoP labeled RBCs (Figure 7B). Unlabeled RBCs did not lyse. Laser-induced hemolysis from PoP-labeled RBCs was readily observed by eye (Figure 7C). These data show that PoP labeled RBCs, when subjected to PoP excitation become hemolyzed. Based on this observation we next used this PDT treatment to determine if exchange was occurring.
Figure 7. PDT-induced hemolysis and PoP exchange.
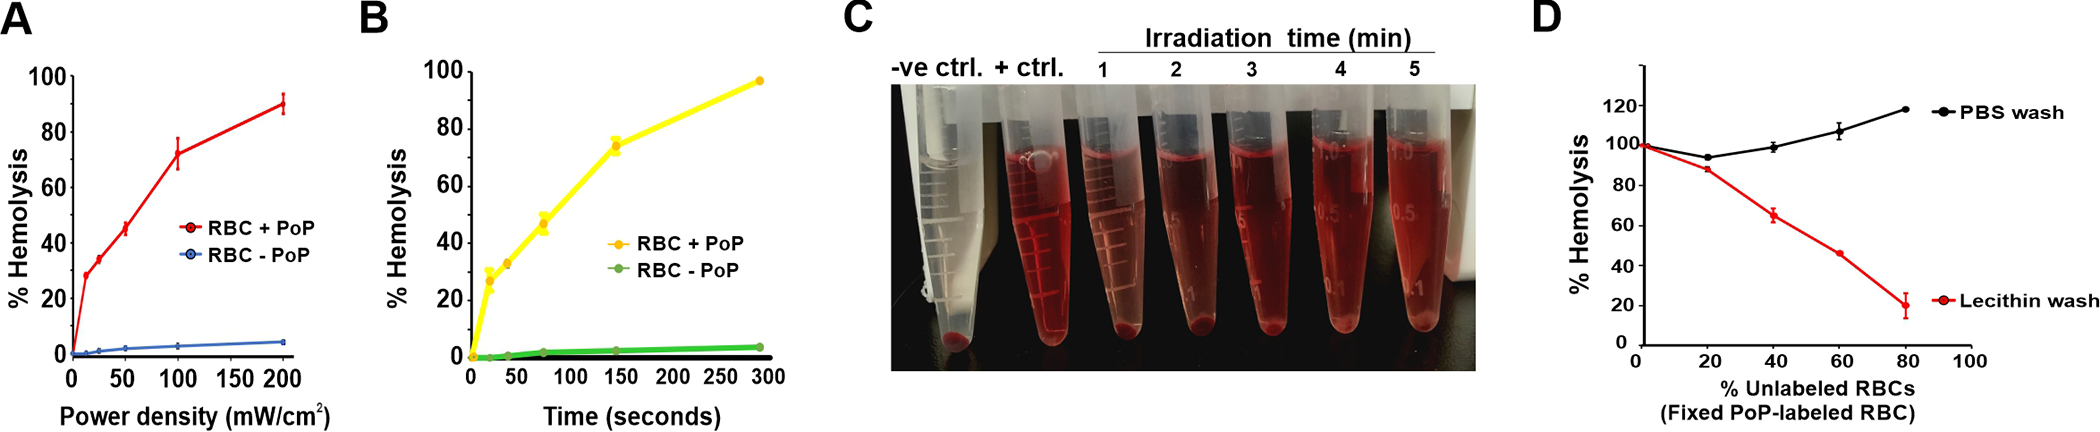
A) Hemolysis of PoP-labeled RBCs irradiated with indicated fluence rates with a 665 nm laser. B) Hemolysis dose response PoP-labeled RBCs irradiated for indicated irradiation times at 200 mW/cm2. C) Visual observation of hemolysis in PoP-labeled RBCs treated with laser (200 mW/cm2) for indicated time in minutes, showing increased hemolysis in a dose dependent manner D) Hemolysis of RBCs, following mixing of unlabeled and labeled RBCs in the indicated ratio. The PoP-labeled RBCs were prepared with or without lecithin washing. Hemolysis is shown for the mixture of labeled and unlabeled RBCs. Data show mean +/− std. dev. for n=3.
Various proportion of unlabeled RBCs (0%, 20%, 40% and 80%) when incubated with a constant PoP-labeled RBCs that were prepared with or without lecithin washing. As shown in Figure 7D, with the non-lecithin washed PoP-labeled RBDs, when incubated with unlabeled RBDs for 1 hr at 37°C and irradiated, nearly all the RBDs, both labeled and unlabeled hemolyzed. This is due to transfer of PoP from labeled to unlabeled RBCs. In contrast, for the lecithin washed, PoP-labeled RBCs, full laser-induced hemolysis was only observed when unlabeled RBDs were excluded. As unlabeled RBCs were added, the total proportion of laser-induced hemolysis decreased proportionally with the amount of unlabeled RBDs. Along with the flow cytometry results, this PDT hemolysis assay shows that lecithin-washed, PoP-labeled RBDs do not substantially exchange PoP with unlabeled RBDs.
One of the unique aspects of PoP is that its chlorin macrocycle can readily be chelated with metals including with the PET tracer 64Cu.[28, 29]. PoP was labeled in the cholate labeling solution by simple incubation with 64Cu, which generated a copper-chelated PoP. Mice were then injected directly with the 64Cu-PoP micelles or RBCs that were labeled with Cu-PoP with lecithin washing. As shown in Figure 8A when 64Cu-PoP cholate micelles were administered to mice, the PoP quickly migrated to the liver with little remaining in the blood. On the other hand, when RBCs where stably labeled with 64Cu-PoP, the PoP remained in circulation for a much longer duration, with substantial signal in the blood pool even at 48 hr (Figure 8B). A biodistribution study confirmed the PET images, with substantially more isotope signal remaining in the blood at 48 hr for the 64Cu PoP RBCs compared to the PoP micelles (Figure 8C). This data shows that PoP-labeling of RBCs can be used to modulate the biodistribution and pharmacokinetics of the PoP molecule. However, the observed circulating half-life of the labeled RBCs is still much less than what would be expected of RBCs themselves. Therefore, it is possible that the PoP in the RBCs does still exchange with serum components. The in vitro studies would suggest the rate of exchange would be slower with lecithin washing, however more research is required to address that. Likewise, the mechanism for why some PoP is better embedded in the RBC membrane, along with the nature of PoP insertion requires further study.
Figure 8: 64Cu PoP -labeled murine RBCs extend circulation of PoP.
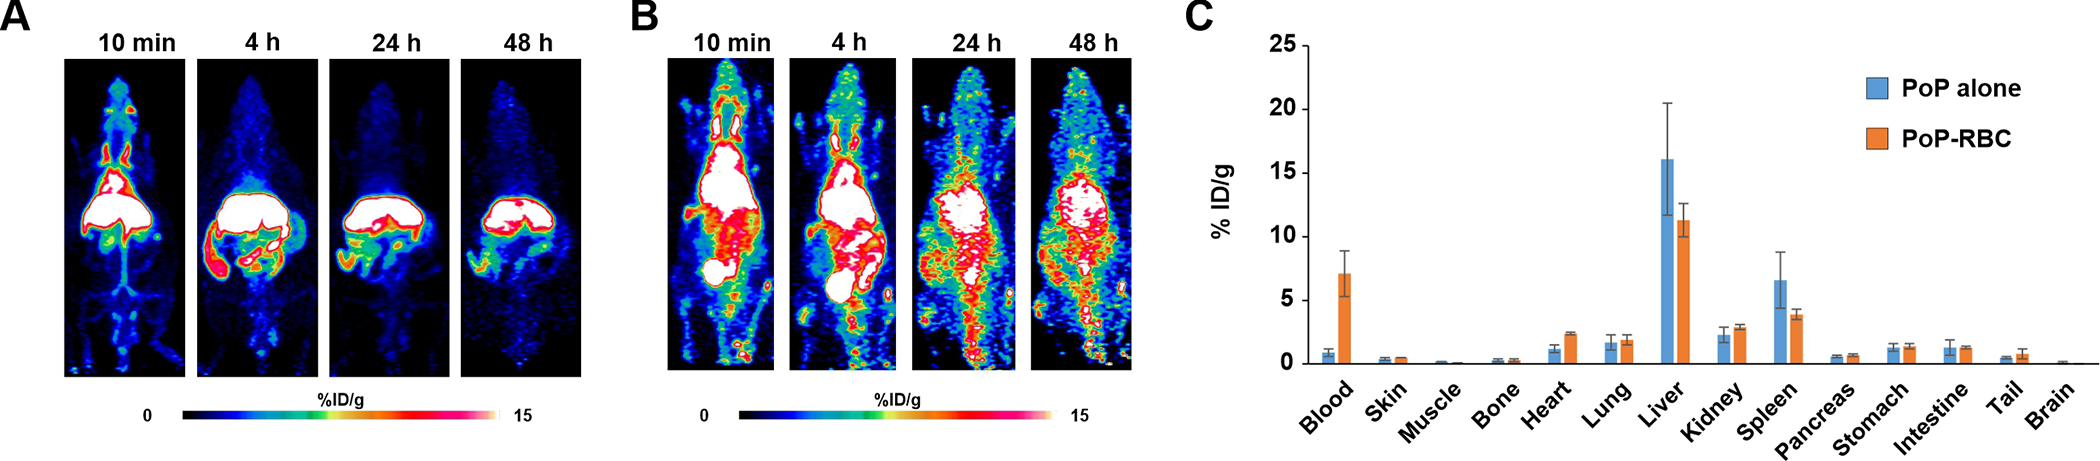
PET image of mice injected with 64Cu-labeled PoP (A) or 64Cu-labeled PoP-RBCs with lecithin washing (B). RBCs were obtained from mice prior to labeling and intravenous injection. C) Biodistribution of 64Cu PoP micelles or 64Cu PoP-labeled RBC in indicated organs 48 hours after administration. Data show error bars +/− std. dev. for n=3 mice per group.
In summary, a protocol was designed specifically to label RBCs with porphyrin-phospholipid. After selecting for a surfactant that could dissolve the PoP effectively in conditions that avoid hemolysis, egg yolk lecithin was shown to reduce the amount of loosely-bound PoP. The resulting PoP-labeled RBCs are sufficient to enable in vitro fluorescence microscopy and PET imaging. Future studies should aim to further assess the stability of PoP-labeling at longer time points and could demonstrate applications for PoP-labeled RBCs such as tracing their biodistribution and using them for PDT.
Experimental
Materials
The following surfactants were obtained from Sigma: Pluronic F127 (Catalog: P2443), Cremphor EL (Catalog: C5135), sodium cholate hydrate (Catalog: C1254), Tween 80 (Catalog: 9490), and Tween 40 (Catalog: P1504). TritonX-100 (Catalog: A16046) was obtained from Alfa Aesar. Brij 35 (also referred to as Brij L23) was obtained from Spectrum (Catalog: BR105). L-α-Lecithin, Egg Yolk, (Catalog: 524617) (stock concentration 100 mg/mL) was ordered from EMD Millipore Corp. USA. 150 mM Gibco Dulbecco Phosphate buffer saline DPBS (1X) was obtained from Thermofisher Scientific. 1,1′-Dioctadecyl-3,3,3′,3′-tetramethylindocarbocyanine perchlorate [14], 100 mg (Catalog: 50–596-227), 3,3-Dioctadecyloxacarbocyanine perchlorate, 25 mg (Catalog: 50–996-218) was obtained from Fisher Scientific Company. PoP was synthesized in our lab as previously described.[30]
Human peripheral whole blood collection
10 mL of fresh human whole blood was drawn from healthy volunteers with the help of a trained phlebotomist using venipuncture method and also abiding by the IRB guidelines and standard protocols. The anticoagulant used for blood collection was 20U of heparin per ml of blood in order to avoid clotting. Blood was processed within 24 hr and stored at 4 °C for further downstream isolation procedures
Isolation and labeling of RBCs
The erythrocyte suspension was obtained by density gradient centrifugation at 240g for 13 minutes with ‘no brake’ at 4 °C. The serum supernatant and buffy coat were decanted and discarded. The erythrocyte pellet sample was diluted 2-fold in DPBS gently vortexing and pelleted. at 1200g for 6 minutes with ‘brake 2’ at 4°C. The procedure was repeated 2 more times to obtain pure red blood cells. Hemolysis was not detectable in the supernatant. The erythrocytes were then resuspended in 200 μL of PBS (~47% hematocrit) and were processed for further experiments.
DiO and DiI were solubilized in the range of the manufacturer recommendations in ethanol at concentrations of 2 mg/mL to form stock solutions by vortexing and sonication. 9 μL of the DiO/DiI stock solution was mixed with 5 μL of freshly isolated RBCs (2.5% hematocrit) that were diluted and incubated at room temperature for 30 minutes. The sample was then centrifuged at 1000 g for 3 min and wash was done with PBS buffer for 3 times. A DiO/DiI labeled RBCs population is obtained as a result which could be used for further processing. The excitation and emission of DiI used was 549 nm (ex) 565 nm (em) and for DiO was 484 nm (ex) 501 nm (em).
For PoP labeling, in a 1.5 mL microcentrifuge tube, 200 μL of PBS buffer solution was added with 9 μL of 10 mg/mL PoP/cholate solution and sonicated well. 5 μL of RBCs (2.5% hematocrit) were added to the sample and vortexed. The sample was incubated at room temperature in dark for 10 minutes. The sample were then centrifuged at 500g for 3 min to obtain the PoP labeled RBC pellet and the supernatant was discarded. The samples were washed three times with 2 mg/mL lecithin buffer solution. To measure the PoP fluorescence intensity, the dye excitation and emission wavelength of 420 nm and 670 nm was used [31]. For exchange studies, samples were incubated in a shaker for 1 hr at 37 °C.
As described below, unless otherwise stated, a standard labeling procedure with lecithin washing involved first preparing the PoP labeling solution by adding 9 μL of 10 mg/mL PoP in 5 % cholate to 200 μL of PBS (pH 7.4). 5 μL of the purified RBC suspension was added followed by gentle vortexing. After 10 minutes of incubation in the dark at room temperature, samples were centrifuged at 500 g for 3 min to obtain the PoP-labeled RBC pellet and the supernatant was discarded. The sample was washed with PBS containing 2 mg/mL lecithin 3 times, using the original volume of PBS to remove the unbound PoP.
Surfactant-induced hemolysis
Seven standard surfactants were considered for this study namely, Triton X 100, Tween 80, Cholate Hydrate salt, Cremphor EL, Brij35, Tween 40 and Pluronic F127. 15 μL of the erythrocyte suspension (50% hematocrit) was added with 5 μL of the surfactant formulation at different concentrations and incubated at 37 °C for 1 hour. Following this, 1 mL PBS was added to each of the samples and centrifuged at 3000g for 5 minutes. PBS buffer and Triton X-100 were used as negative (0% lysis) and positive (100% lysis) controls, respectively.
The hemolysis ratio was calculated using the following equation:
| (1) |
The absorbance of the supernatant was measured using the PerkinElmer Lambda XLS UV/Vis spectrophotometer, with the absorbance peak being measured at 540 nm Standard deviation was analyzed for (n = 3) trials for each sample data
PoP solubility in different surfactants
The concentration of the surfactants considered were Triton X-100 (1% weight/volume), Cremphor EL (20% weight/volume), Sodium cholate hydrate salt (5% weight/volume), Tween 40 (20% weight/volume), Tween 80 (20% weight/volume), Brij35 (1% weight/volume), Pluronic F127 (20% weight/volume) and ethanol (100% volume/volume). PoP at concentrations of 10 mg/ml, 5 mg/mL and 2 mg/mL with corresponding 9.8 mM, 4.9 mM and 1.9 mM molar concentrations were prepared in serial dilution with the surfactants and sonicated. Then the samples were incubated for 30 minutes in dark at room temperature and centrifuged at 500g for 3 minutes. The samples were washed three times using its original volume with PBS buffer and diluted in 1:10 ratio.10 μL of 10% Triton X 100 was used as a lysis reagent to the samples and the fluorescence intensity of the PoP in pellet and that of the supernatant was measured using a Tecan microplate reader.
The % PoP in pellet was calculated as follows:
| (2) |
The PoP excitation/emission signal wavelength used was 420/670 nm and the bandwidth was set to 5nm with gain as 75. Standard deviation was analyzed for (n=3) trials for each sample data.
Flow cytometry
Erythrocytes were labeled with PoP and characterization was done using a BD LSR-Fortessa X-20 flow cytometer. Based on the Excitation/Emission wavelengths of PoP (420/670 nm), the standard QDot 655 filter set was used to measure fluorescence (Ex:405 nm; Em: 670/30 nm). 1, 3, 6, or 9 μL of 10 mg/mL of PoP in cholate, Tween 40 or Tween 80 was added to 200 μL PBS buffer (pH 7.4) in 1.5 mL microcentrifuge tubes and sonicated briefly. 5 μL of purified RBCs were then added to each of sample and gently vortexed. Following 10 minutes incubation in the dark at room temperature, samples were centrifuged at 500 g for 3 min to obtain the PoP labeled RBC pellet and the supernatant was discarded. The sample was washed with PBS 3 times to its original volume to remove the unbound PoP and the samples were incubated for 1 hr at 37 °C. The fluorescence intensity of the samples was measured using flow cytometry, and the histogram data was plotted using FlowJo software
Exchange with different wash buffers
Exchange experiments were performed using 3 different types of wash buffers PBS, lecithin and Bovine Serum Albumin (BSA). 2 mg/mL concentrations were used for lecithin and BSA. The 3 detergent solutions 5% Cholate, 20% Tween 40 and 20% Tween 80 were used to dissolved PoP at 10 mg/mL at 9.8 mM concentrations. The PoP solutions were then used to label on 5 μL of RBC suspension (2.5% hematocrit) for 10 minutes at RT in dark. Following this, samples were centrifuged at 500 g for 3 minutes and were extensively washed 3 times with PBS, 2 mg/mL lecithin and 2 mg/mL BSA. 15 μL of the unlabeled RBCs were added to each of the 5 μL of labeled RBC samples and incubated in a shaker at 37 °C for 1 hr. The samples were then diluted by 10 fold and analyzed using flow cytometry for (n=4) trials per sample. The geometric mean fluorescence intensity (GM) was calculated from the histogram data using markers for the peak. The plots were generated using GraphPad Prism software.
Fluorescence microscopy
RBCs were examined under a fluorescence microscope with 10X magnification for observing the PoP fluorescence. RBC samples were treated under various conditions including labeled, unlabeled, labeled + unlabeled, and with or without lecithin wash. For the unlabeled RBC group, 5 μL of the RBCs were freshly isolated from the human whole blood. For the labeled RBCs group, 5 μL of the RBCs were labeled with 9 μL of 10 mg/mL PoP solution. Both the groups were incubated at room temperature in dark for 10 minutes. For the labeled + unlabeled group with PBS wash, 5 μL of the RBCs labeled with 9 μL of 10 mg/mL PoP was washed 3 times with PBS buffer and incubated at room temperature for 10 minutes. The pure labeled RBCs were mixed with an equal volume of the unlabeled RBCs and incubated at 37 °C for 1 hr. For the labeled and unlabeled group with lecithin wash, 5 μL of PoP labeled RBCs were washed 3 times with 2 mg/mL lecithin buffer and incubated with an equal volume of unlabeled RBCs and incubated for 37 °C for 1 hour. A 1:10 dilution of all the final samples were performed prior to examination under the fluorescence microscope.
Photodynamic therapy induced hemolysis
This study was performed by irradiation with a 665 nm laser diode onto the PoP labeled RBCs and the hemolysis dose response was assessed at varying laser power ranges and irradiation durations. The RBCs were labeled using 10 mg/mL PoP/cholate solution by the same method as described above and washed 3 times using the lecithin wash buffer. Samples were treated with laser by keeping the spot size 10 mm (diameter). One set of samples were treated with laser by keeping the time duration constant (t=5 minutes), by varying the power density (mW/cm2) as 12.5, 25, 50, 100, 200 and 400 mW/cm2 and the other set of samples were treated with laser by keeping the power density constant at 200 mW/cm2 and varying the time duration for 18.75, 37.5, 75, 150 and 300 seconds. The positive control (100% hemolysis) and negative control (0% hemolysis) were prepared by adding 5ul of TritonX-100 to 15 μL of unlabeled RBC and 5 μL of PBS to 15 μL of unlabeled RBC respectively and incubated for 37 °C for 1 hour. Then, 1 mL of PBS was added to each of the samples and centrifuged for 3000g for 5 minutes. The absorbance of the supernatant was measured using the PerkinElmer Lambda XLS UV/Vis spectrophotometer, with the absorbance peak being measured at 540 nm.
To determine the PDT-induced hemolysis in the presence of unlabeled cells, the RBCs prepared in the previous experiments and mixed with different ratios of the unlabeled RBCs, which were incubated for 37 °C for 1 hr. The ratios of labeled and unlabeled RBCs considered for this study included 5:0, 5:1.25, 5:3.33, 5:7.5 and 5:20. The samples were then subjected to laser irradiation with 200 mW/cm2 665 nm laser diode for 7 min for complete 100% hemolysis. For each labeled to unlabeled ratio, both positive control (100 % lysis) and negative control (0 % lysis) were considered. The positive control and negative control used were Triton X-100 and PBS which were taken for each of the sample ratios. The supernatant absorbance was measured at 540 nm using a UV/Vis spectrophotometer and % hemolysis was calculated and plotted using Excel.
64Cu radiolabeling of PoP
Cu-64 was produced by the cyclotron group at the University of Wisconsin – Madison using a PETtrace cyclotron (GE Healthcare) via the classic 64Ni(p,n)64Cu reaction. For the labeling of PoP, Cu-64 (37–74 MBq) was diluted with 100 μL of NaAc (0.05 M, pH 5.5) and mix with PoP (5 mg/mL). The radiolabeling reaction was kept at 37°C for 1 h with constant shaking. The mixture was purified using a PD-10 desalting column (GE Healthcare) and 1 x PBS was used as the mobile phase. Radiolabeling yield was measured by radio-thin layer chromatography and results analyzed by ImageJ and was over 60 %. The fraction with the highest radioactivity was further used for mouse RBC labeling. Mouse blood was collected retro-orbitally (50 μL of blood from each mouse) into an anticoagulated tube and centrifuged (1500 rcf, 3 min, 4°C) for RBC collection. RBCs were washed twice with 1 x PBS. For radiolabeling, 50 μL of RBCs in PBS was mixed with 50 μL of 64Cu-PoP in 100 μL of PBS. The reaction was allowed at 37 °C for 30 min in dark and cells were spun down at 500 g (3 min). After two rounds of lecithin washing (0.5 mL), 64Cu-PoP@RBCs were used for PET imaging.
PET imaging and biodistribution study
All animal handling was performed following a protocol approved by the University of Wisconsin Institutional Animal Care and Use Committee. PET imaging was performed on an Inveon μPET rodent model scanner (Siemens Medical Solutions, Germany). Mice were intravenously injected with 64Cu-labeled PoP (5–10 MBq) or PoP@RBCs (1–2 MBq) and PET scans were performed at 10 min, 3 h, 24 h and 48 h after injection. Region-of-interest studies were performed using the in house Inveon Research Workplace (IRW) system for tracer distribution analysis. Following the last PET scan, mice were sacrificed and tissue of interest were collected for gamma counter (PerkinElmer, USA) measurement. The results were used to quantify tracer distribution in vivo and were denoted by percentage of injected dose per gram of tissue (%ID/g, n=3 per group).
Acknowledgements
This work was supported by the National Institutes of Health (R01EB017270) and the National Science Foundation (1555220).
Contributor Information
Sunanda Kumar, Department of Biomedical Engineering, State University of New York at Buffalo, NY 14260, USA.
Dawei Jiang, Department of Materials Science and Engineering, Department of Radiology, Department of Medical Physics, and University of Wisconsin Carbone Cancer Center, University of Wisconsin, Madison, Madison, Wisconsin 53705, United States.
Boyang Sun, Department of Biomedical Engineering, State University of New York at Buffalo, NY 14260, USA.
Kaelyn V. Seeley, Department of Materials Science and Engineering, Department of Radiology, Department of Medical Physics, and University of Wisconsin Carbone Cancer Center, University of Wisconsin, Madison, Madison, Wisconsin 53705, United States
Jonathan W. Engle, Department of Materials Science and Engineering, Department of Radiology, Department of Medical Physics, and University of Wisconsin Carbone Cancer Center, University of Wisconsin, Madison, Madison, Wisconsin 53705, United States
Zachary Sia, Department of Biomedical Engineering, State University of New York at Buffalo, NY 14260, USA.
Xuedan He, Department of Biomedical Engineering, State University of New York at Buffalo, NY 14260, USA.
Sriram Neelamegham, Department of Chemical Engineering, State University of New York at Buffalo, NY 14260, USA.
Weibo Cai, Department of Materials Science and Engineering, Department of Radiology, Department of Medical Physics, and University of Wisconsin Carbone Cancer Center, University of Wisconsin, Madison, Madison, Wisconsin 53705, United States.
Jonathan F. Lovell, Department of Biomedical Engineering, State University of New York at Buffalo, NY 14260, USA.
References
- 1.Unthank JL, et al. , Evaluation of carbocyanine-labeled erythrocytes for microvascular measurements. Microvasc Res, 1993. 45(2): p. 193–210. [DOI] [PubMed] [Google Scholar]
- 2.Smith WJ, et al. , Lipophilic indocarbocyanine conjugates for efficient incorporation of enzymes, antibodies and small molecules into biological membranes. Biomaterials, 2018. 161: p. 57–68. [DOI] [PMC free article] [PubMed] [Google Scholar]
- 3.Kornfield TE and Newman EA, Measurement of Retinal Blood Flow Using Fluorescently Labeled Red Blood Cells. Eneuro, 2015. 2(2). [DOI] [PMC free article] [PubMed] [Google Scholar]
- 4.Agrawal R, et al. , Fluorescent Dye Labeling of Erythrocytes and Leukocytes for Studying the Flow Dynamics in Mouse Retinal Circulation. J Vis Exp, 2017(125). [DOI] [PMC free article] [PubMed] [Google Scholar]
- 5.Franco RS, The measurement and importance of red cell survival. Am J Hematol, 2009. 84(2): p. 109–14. [DOI] [PubMed] [Google Scholar]
- 6.Muzykantov VR, Drug delivery by red blood cells: vascular carriers designed by mother nature. Expert Opin Drug Deliv, 2010. 7(4): p. 403–27. [DOI] [PMC free article] [PubMed] [Google Scholar]
- 7.Yan J, et al. , Red Blood Cells for Drug Delivery. Small Methods, 2017. 1(12): p. 1700270. [Google Scholar]
- 8.Han X, Wang C, and Liu Z, Red Blood Cells as Smart Delivery Systems. Bioconj Chem, 2018. 29(4): p. 852–860. [DOI] [PubMed] [Google Scholar]
- 9.Park T, et al. , Artificial Spores: Immunoprotective Nanocoating of Red Blood Cells with Supramolecular Ferric Ion-Tannic Acid Complex. Polymers, 2017. 9(4): p. 140. [DOI] [PMC free article] [PubMed] [Google Scholar]
- 10.Park JH, et al. , Nanocoating of Single Cells: From Maintenance of Cell Viability to Manipulation of Cellular Activities. Adv Mater, 2014. 26(13): p. 2001–2010. [DOI] [PubMed] [Google Scholar]
- 11.Hashemi-Najafabadi S, et al. , A Method To Optimize PEG-Coating of Red Blood Cells. Bioconj Chem, 2006. 17(5): p. 1288–1293. [DOI] [PubMed] [Google Scholar]
- 12.Gullapalli RR, Demirel MC, and Butler PJ, Molecular dynamics simulations of DiI-C18(3) in a DPPC lipid bilayer. Phys Chem Chem Phys, 2008. 10(24): p. 3548–60. [DOI] [PMC free article] [PubMed] [Google Scholar]
- 13.Honig MG and Hume RI, Fluorescent carbocyanine dyes allow living neurons of identified origin to be studied in long-term cultures. J Cell Biol, 1986. 103(1): p. 171–87. [DOI] [PMC free article] [PubMed] [Google Scholar]
- 14.Armstrong JK, et al. , Vybrant™ DiO, DiI and DiD Dyes for Multiple Labeling of Red Blood Cell Populations for In Vivo Survival Studies. Blood, 2004. 104(11): p. 1586–1586.15317735 [Google Scholar]
- 15.Zhang Y and Lovell JF, Porphyrins as theranostic agents from prehistoric to modern times. Theranostics, 2012. 2(9): p. 905–15. [DOI] [PMC free article] [PubMed] [Google Scholar]
- 16.Huang H, et al. , Emerging applications of porphyrins in photomedicine. Frontiers Phys, 2015. 3(23). [DOI] [PMC free article] [PubMed] [Google Scholar]
- 17.Shao S, Rajendiran V, and Lovell JF, Metalloporphyrin Nanoparticles: Coordinating Diverse Theranostic Functions. Coord Chem Rev, 2019. 379: p. 99–120. [DOI] [PMC free article] [PubMed] [Google Scholar]
- 18.Lovell JF, et al. , Porphysome nanovesicles generated by porphyrin bilayers for use as multimodal biophotonic contrast agents. Nat Mater, 2011. 10(4): p. 324–32. [DOI] [PubMed] [Google Scholar]
- 19.Liu TW, et al. , Intrinsically copper-64-labeled organic nanoparticles as radiotracers. Angew Chem Int Ed Engl, 2012. 51(52): p. 13128–31. [DOI] [PubMed] [Google Scholar]
- 20.Lee J-H, et al. , (99m)Tc-labeled porphyrin-lipid nanovesicles. J Liposome Res, 2015. 25(2): p. 101–106. [DOI] [PMC free article] [PubMed] [Google Scholar]
- 21.MacDonald TD, Liu TW, and Zheng G, An MRI-Sensitive, Non-Photobleachable Porphysome Photothermal Agent. Angew Chem Int Ed, 2014. 53(27): p. 6956–6959. [DOI] [PubMed] [Google Scholar]
- 22.Shao S, et al. , Design of Hydrated Porphyrin-Phospholipid Bilayers with Enhanced Magnetic Resonance Contrast. Small, 2017. 13(1): p. 1602505. [DOI] [PMC free article] [PubMed] [Google Scholar]
- 23.Luo D, et al. , Rapid Light-Triggered Drug Release in Liposomes Containing Small Amounts of Unsaturated and Porphyrin-Phospholipids. Small, 2016. 12(22): p. 3039–47. [DOI] [PMC free article] [PubMed] [Google Scholar]
- 24.Luo D, et al. , Short Drug–Light Intervals Improve Liposomal Chemophototherapy in Mice Bearing MIA PaCa-2 Xenografts. Mol Pharm, 2018. 15(9): p. 3682–3689. [DOI] [PubMed] [Google Scholar]
- 25.Miranda D, et al. , Multifunctional Liposomes for Image-Guided Intratumoral Chemo-Phototherapy. Adv Healthc Mater, 2017. 6(16): p. 1700253. [DOI] [PMC free article] [PubMed] [Google Scholar]
- 26.Carter KA, et al. , Blood Interactions, Pharmacokinetics, and Depth-Dependent Ablation of Rat Mammary Tumors with Photoactivatable, Liposomal Doxorubicin. Mol Cancer Ther, 2019. 18(3): p. 592–601. [DOI] [PubMed] [Google Scholar]
- 27.Luo D, et al. , Rapid Light-Triggered Drug Release in Liposomes Containing Small Amounts of Unsaturated and Porphyrin–Phospholipids. Small, 2016. 12(22): p. 3039–3047. [DOI] [PMC free article] [PubMed] [Google Scholar]
- 28.Luo D, et al. , Intrabilayer 64Cu Labeling of Photoactivatable, Doxorubicin-Loaded Stealth Liposomes. ACS Nano, 2017. 11(12): p. 12482–12491. [DOI] [PMC free article] [PubMed] [Google Scholar]
- 29.Rieffel J, et al. , Hexamodal Imaging with Porphyrin-Phospholipid-Coated Upconversion Nanoparticles. Adv Mater, 2015. 27(10): p. 1785–1790. [DOI] [PMC free article] [PubMed] [Google Scholar]
- 30.Carter KA, et al. , Porphyrin–phospholipid liposomes permeabilized by near-infrared light. Nat Communi, 2014. 5(1): p. 3546. [DOI] [PMC free article] [PubMed] [Google Scholar]
- 31.Kress J, et al. , Quantitative imaging of light-triggered doxorubicin release. Biomed Opt Express, 2015. 6(9): p. 3546–55. [DOI] [PMC free article] [PubMed] [Google Scholar]