

Abstract
Background:
Vitamin D supplementation may prevent falls in older persons, but evidence is inconsistent, potentially related to differences in doses.
Objective:
Compare the effects of four doses of vitamin D3 supplements on falls.
Design:
Two-stage, Bayesian, response-adaptive randomized trial.
Setting:
Two community-based research units.
Participants:
688 participants, aged ≥70 years, with elevated fall risk and serum 25-hydroxyvitamin D level of 25–72.5nmol/L.
Interventions:
200 (control), 1000, 2000, or 4000IU/day of vitamin D3. During dose-finding, the best non-control dose for preventing falls was determined. After dose-finding ended, participants randomized to non-control doses were switched to best dose, and new enrollees were randomized to 200IU/day or best dose.
Measurements:
Time to first fall or death over two years (primary outcome).
Results:
During dose-finding, the primary outcome rates were higher in the 2000 and 4000IU/day doses than the 1000IU/day dose, which was selected as the best dose (posterior probability of being best=0.90). In the confirmatory stage, event rates were not significantly different between those with experience on best dose (events and observation time limited to time on 1000IU/day; N=308) and those randomized to 200IU/day (N=339) (HR=0.94, 95%CI:0.76–1.15; P=0.54). Analysis of falls with adverse outcomes suggested greater risk in those with experience on best dose versus the 200IU/day group (serious fall, HR=1.87, 95%CI:1.03–3.41; fall with hospitalization, HR=2.48, 95%CI:1.13–5.46).
Limitations:
The control group received 200IU/day, not a placebo. Dose-finding ended before the pre-specified thresholds for dose suspension and selection of the best dose were reached.
Conclusions:
In older persons with elevated fall risk and low serum 25-hydroxyvitamin D level, vitamin D3 supplementation ≥1000IU/day did not prevent falls compared with 200IU/day. Several analyses raise safety concerns about vitamin D3 doses ≥1000IU/day.
INTRODUCTION
The public health burden of falls among older adults is substantial (1). Randomized trials and other studies suggest vitamin D supplements might reduce the risk of falls in older adults, potentially through improvements in skeletal muscle function (2–4). However, evidence has been inconsistent, possibly related to differences in vitamin D doses, mode of administration, and other design features (5). In early trials and meta-analyses, vitamin D supplements appeared to reduce fall risk by ~20% (6–8). Other trials documented no effects (9, 10), and one found vitamin D administered in an annual bolus dose (500,000IU) might increase fall risk (11). Given this evidence, some organizations (12–14) and the 2012 US Preventive Services Task Force (15) recommended vitamin D supplements to prevent falls in older adults, while an Institute of Medicine panel concluded that evidence was insufficient to make a recommendation (16). In this context, the National Institute on Aging (NIA) issued in 2013 a request for applications for an adaptive trial to assess the dose-response and potential efficacy of vitamin D supplementation for fall prevention (RFA-AG-14-001).
The NIA funded STURDY (Study To Understand Fall Reduction and Vitamin D in You), a two-stage, Bayesian, response-adaptive randomized trial. The primary hypothesis was that high-dose vitamin D supplementation would reduce the risk of falls.
METHODS
The protocol was approved by a Johns Hopkins University institutional review board. A data and safety monitoring board (DSMB) appointed by the NIA approved the protocol and monitored the trial. Participants provided written informed consent.
Figure 1A illustrates the study design. In brief, the trial had two stages. During dose-finding, participants were randomized to 200 (control), 1000, 2000, or 4000IU/day of vitamin D3 to identify which of the three non-control doses was most effective (“best dose”) for preventing falls. After the best dose was identified, participants who had been randomized to any of the non-control doses received the best dose, control participants continued on 200IU/day, and new participants were randomized 1:1 to best dose or control.
Figure 1.
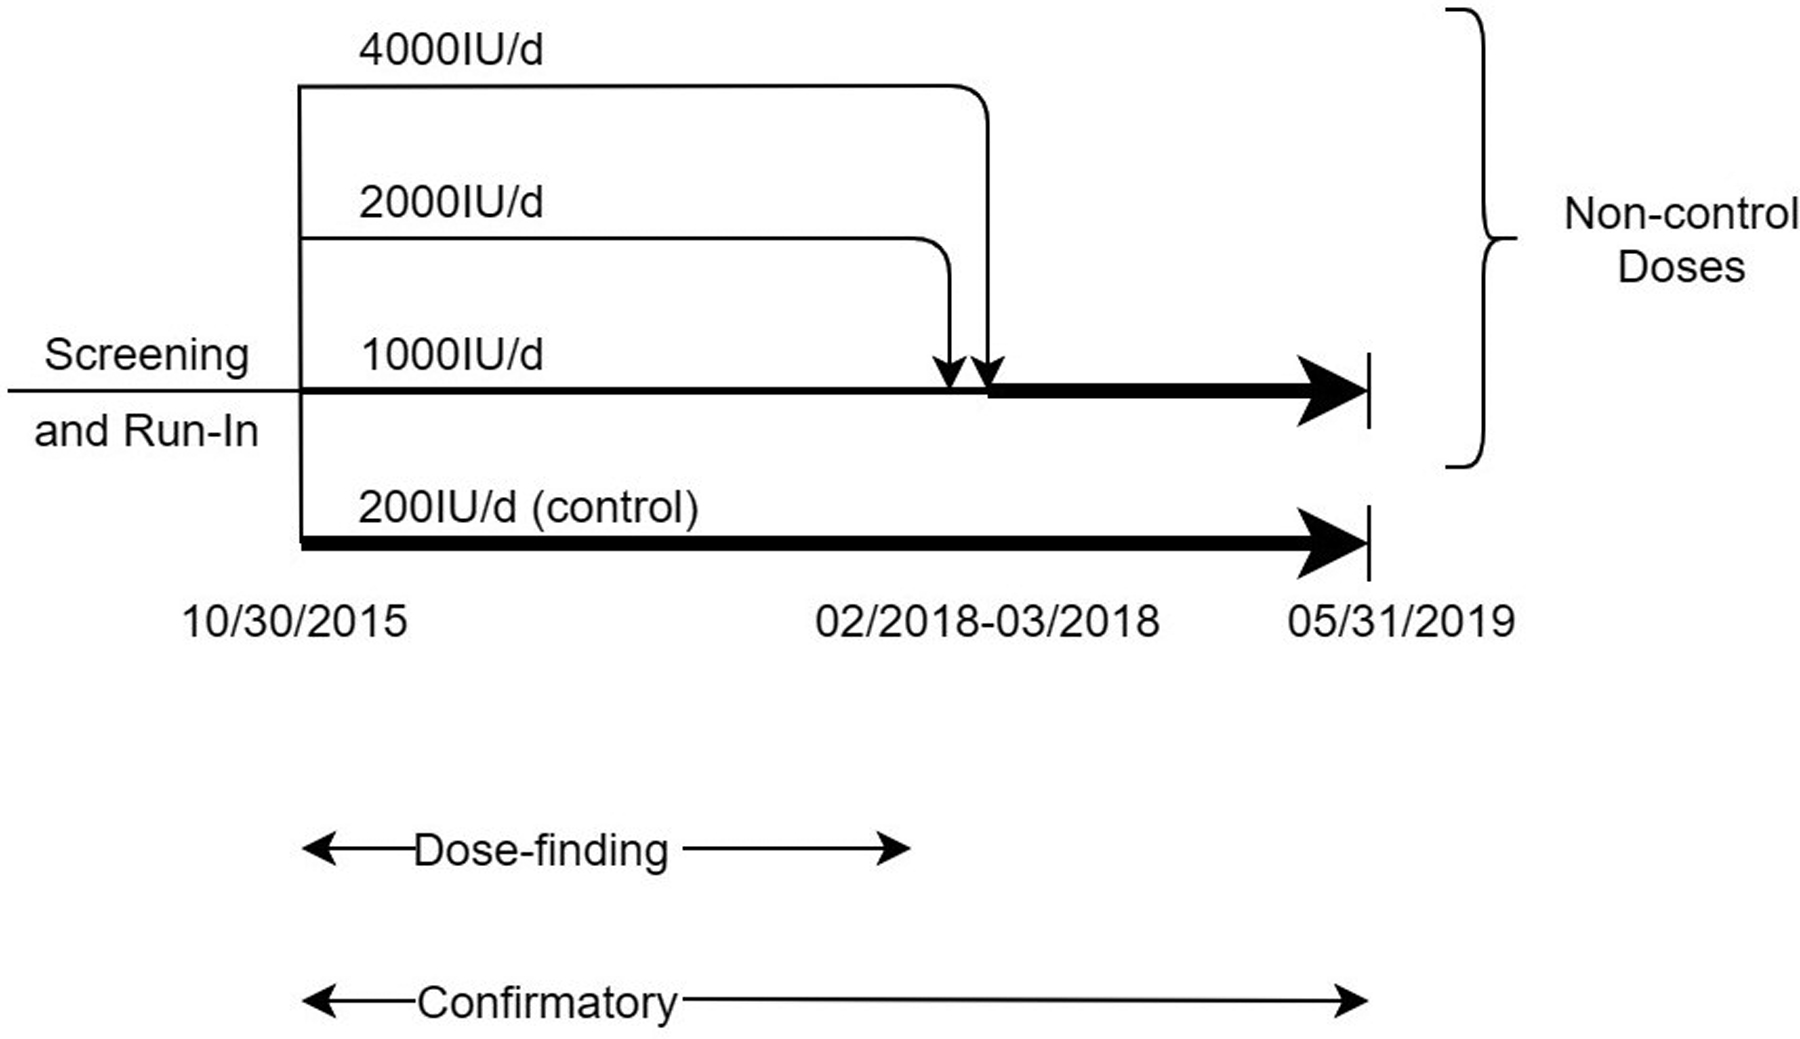
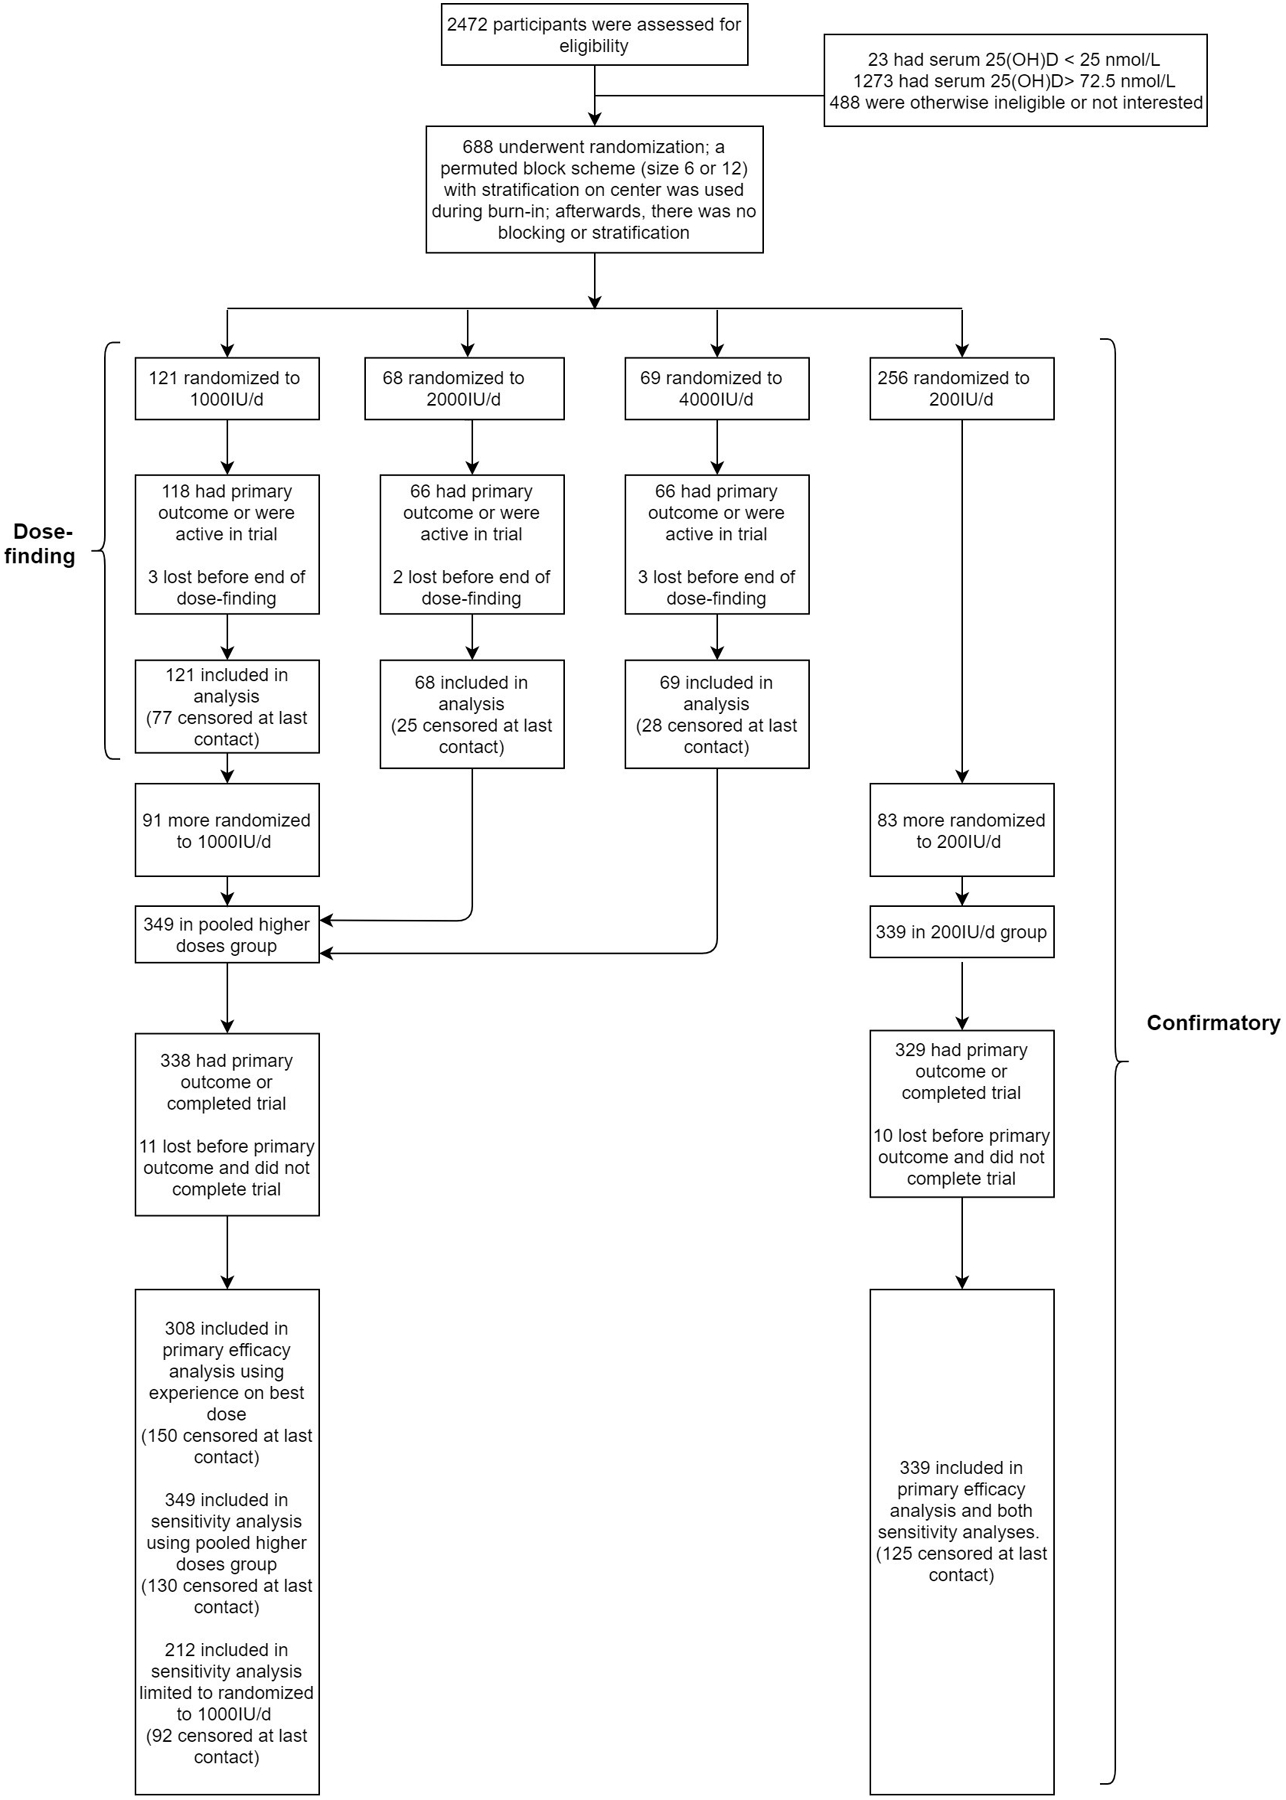
Overview of Dose-finding and Confirmatory STURDY Trial (Panel A) and Eligibility, Randomization, and Follow-up of Participants (Panel B). During dose-finding (October 2015-March 2018), eligible and consenting participants were randomized to supplemental vitamin D dose (200IU/day, 0.5 probability throughout; 1000, 2000, or 4000IU/day, varying probability per the posterior probability of the dose being best). After dose-finding ended, participants who had been randomized to 2000 or 4000IU/day were switched to 1000IU/day at the next study pill resupply time (resupply every 3 months) and new enrollees were randomized to 200 or 1000IU/day with equal probability. Abbreviation: IU/d = international units per day.
Participants
Eligible participants were community-dwelling adults, aged ≥70 years, with elevated fall risk and low serum 25-hydroxyvitamin D [25(OH)D] levels. Elevated fall risk was defined by self-report of one or more of the following: ≥2 falls or ≥1 injurious fall in the past year, fear of falling due to balance or walking problems, difficulty maintaining balance, or use of an assistive device when walking. Exclusion criteria included cognitive impairment; hypercalcemia; kidney, bladder or ureteral stone; and use of supplemental vitamin D >1000IU/day or calcium >1200mg/day. Persons taking ≤1000IU/day of supplemental vitamin D had to agree to maintain this dose.
Participants enrolled at two community-based research units (Hagerstown, MD; Woodlawn, MD), each at ~39° latitude. The principal recruitment strategy was mass mailing of brochures. After two in-person visits, eligible persons completed a 10-day run-in, during which they took placebo pills and completed a daily fall and study pill calendar.
Serum vitamin D and calcium measurements
Serum levels of 25(OH)D2 and 25(OH)D3 were measured using calibrated high-performance liquid chromatography and tandem mass spectrometry (17) and summed to determine total 25(OH)D. Serum calcium was quantified with the Vitros system (Ortho Clinical Diagnostics, Raritan, NJ).
Randomization
After run-in, eligible participants were randomized to one of four doses of the study pill; assignments were generated using a computer-generated random number and a web-based application written by the investigators. The probability of assignment to 200IU/day was 0.50 throughout the trial. At the start of the trial, each of the non-control doses had equal probability of assignment, 0.1667.
Assignment probabilities to the non-control doses were adjusted during dose-finding at pre-specified times, beginning after the 100th participant randomized to a non-control group reached 6 months of follow-up (i.e., end of “burn-in”). The posterior probability of each non-control dose being best was calculated using Bayes’ Theorem, given the prior distribution of mean time to fall and the cumulative primary outcome data observed in the non-control dose groups at the time of the probability update; these calculations did not use data from the control group. We followed recommendations of Berry et al. (18) in choice of the Bayesian posterior and conjugate prior distributions. The three posterior probabilities were used as weights for allocating the total 0.50 randomization probability available to non-control doses. Participants and study personnel were masked to randomized dose and occurrence of adaptations and end of the dose-finding stage.
Treatment
The control group dose, 200IU/day, was selected because it provided reasonable assurance that average total daily vitamin D intake (dietary intake plus the control dose) would be at least 800IU, the Recommended Daily Allowance for the age group studied (16). The 1000IU/day dose was selected because it appeared to prevent falls in prior studies (7, 19). The 2000IU/day dose was used in the VITAL trial (20). The 4000IU/day dose was the maximal tolerable daily allowance (16). All four doses were considered unlikely to cause vitamin D toxicity (21). The pills of all doses had identical appearance and were manufactured by Continental Vitamin Company (Vernon, CA) and purchased by the trial. After randomization, each participant received a bottle containing 100 pills. A replacement bottle was issued every 3 months. Pill-taking and follow-up continued for two years or to trial end.
Visit schedule
After randomization, participants attended clinic visits at 3, 12, and 24 months, and had telephone visits at 1, 6, 9, 15, 18, and 21 months. At each contact, staff administered questionnaires about medical events, supplement use, study pill adherence, occurrence of falls, and occurrence of serious adverse events (SAEs) and serious events potentially related to vitamin D.
Outcomes
Primary outcome
The primary outcome was time to first fall or death over two years, whichever occurred first. This outcome minimized the potential effect of informative censoring due to the competing risk of death. The trial used the World Health Organization definition of a fall (any fall, slip, or trip in which the participant lost his or her balance and landed on the floor or ground or at a lower level) (22) and had three fall surveillance methods: monthly calendars, scheduled clinic visits and telephone calls, and ad hoc telephone contacts (participants were instructed to call the clinic if they fell) (23). Participants were asked to document on their study calendar daily whether a fall occurred and mail their calendar each month. When a fall was reported, staff called the participant to obtain additional information. Death was primarily ascertained by reports from families or when staff telephoned to obtain a missing calendar. The components of the primary outcome (first fall, death) were additional pre-specified outcomes.
Secondary outcome
The only secondary outcome was gait speed, although study documents mentioned that other study outcomes were secondary. Gait speed was obtained from the timed 4-meter walk component of the Short Physical Performance Battery (24) and was measured at baseline and 3, 12, and 24 months.
Safety outcomes
Rates of SAEs, serious falls (fall resulting in a fracture or dislocation or a fall associated with a hospitalization or other SAE), falls with hospitalization, and serious events potentially related to vitamin D were examined for safety.
Statistical analysis
The study was designed using Compass 2.0® (Cytel, Cambridge, MA) and ARand Desktop (Version 4.1.1, Houston, TX; 2015) software to simulate trial scenarios with dose-response patterns of several types to choose the final Bayesian adaptive dose-finding design and associated thresholds. The trial was designed to continue dose-finding until a best non-control dose (with posterior probability of being best >0.95) was identified or until 1200 participants were randomized, whichever came first. Randomization to a dose was suspended if the posterior probability of being best was <0.025. Once a best dose was identified, new participants were randomized 1:1 to control or best dose, and participants on the other non-control doses were switched to the best dose. The trial was then to continue until 1200 participants were randomized. The DSMB approved randomization probability adaptations prior to implementation.
The calculated sample size of 1200 participants, expected to result in 400 first falls, was estimated to provide ≥80% probability for finding a best dose and >90% power to detect a hazard ratio (HR) of 0.75 for first fall or death in the pooled higher doses group (1000–4000IU/day) versus the 200IU/day group with a two-sided, type I error of 5%; power was determined by numerical simulations. The investigators selected a HR of 0.75 because it was a clinically relevant and plausible effect size based on a prior trial (7).
The protocol and statistical analysis plan were inconsistent about which group was to be compared to 200IU/day in the primary efficacy analysis. Following the specification on page 32 of the protocol, we report the comparison of experience on best dose versus 200IU/day as the primary efficacy analysis; the experience on best dose group includes events and observation time limited to time on 1000IU/day. This analysis is not an intention-to-treat analysis; it excludes participants in the other non-control doses who were never issued a bottle of best dose.
We report sensitivity analyses counting all events and observation time from randomization: comparison of the pooled higher doses group versus 200IU/day (an intention-to-treat analysis) and comparison of those randomized to 1000IU/day (best dose) versus 200IU/day. To rule out effects of drift over calendar time in the rate of the primary outcome, we repeated the primary efficacy and sensitivity analyses, stratifying on calendar time of randomization (strata corresponding to adaptations of the randomization probabilities).
In all time-to-event analyses, participants without the event were censored at their last documented observation date for the event. The proportional hazards assumption was tested using the Grambsch and Therneau test (25). In a post-hoc analysis, death was modeled as a competing risk for time to first fall, rather than a censoring criterion (26).
Gait speed was assessed in the pooled higher doses group versus the 200IU/day group; this comparison allowed use of all available measurements of gait speed regardless of dose used when the measure was obtained. The difference between the two groups in the change from baseline was assessed using a longitudinal, mixed effects linear regression model with gait speed as the outcome and fixed effects including a single treatment term, 3 time point terms, and 3 treatment-by-time interaction terms and a random intercept for participant. Missing gait speed measures were not imputed.
P-values are nominal and two-sided; P<0.05 was considered significant. All analyses were conducted in SAS 9.4 (Cary, NC), Stata 15.1 (College Station, TX), or R-v3.6.0 (https://www.r-project.org/).
Role of the funding source
The NIA encouraged several design features, including an adaptive trial to assess the efficacy and dose-response of vitamin D supplementation for fall prevention and a non-placebo control group. The NIA had no role in the collection, analysis, and interpretation of data; no role in the preparation, review, and approval of the manuscript; and no role in the decision to submit this manuscript for publication.
RESULTS
Figure 1B illustrates participant flow. Among all 688 participants, mean age at entry was 77.2 (SD=5.4) years, 56.4% were men, and 18.2% were black; mean total 25(OH)D was 55.3nmol/L (Table 1).
Table 1.
Characteristics of Randomized Participants at Enrollment.
| Dose-finding Population (N=514)* | Primary Efficacy Analysis Population (N=647)† | Sensitivity Analysis Dose Group: | All (N=688) |
|||||
|---|---|---|---|---|---|---|---|---|
| 1000IU/day (N=121) |
2000IU/day (N=68) |
4000IU/day (N=69) |
200IU/day (N=256) |
Exp. On Best Dose (N=308) | 200IU/day (N=339) |
Pooled Higher Doses (N=349)‡ | ||
| Age (years), mean (SD) | 76.4 (4.8) | 77.3 (4.6) | 79.1 (5.9) | 77.5 (5.6) | 77.0 (5.4) | 77.2 (5.4) | 77.2 (5.4) | 77.2 (5.4) |
| Sex, no. (%) | ||||||||
| Male | 64 (52.9%) | 39 (57.4%) | 41 (59.4%) | 146 (57.0%) | 170 (55.2%) | 198 (58.4%) | 190 (54.4%) | 388 (56.4%) |
| Female | 57 (47.1%) | 29 (42.6%) | 28 (40.6%) | 110 (43.0%) | 138 (44.8%) | 141 (41.6%) | 159 (45.6%) | 300 (43.6%) |
| Race, no. (%)§ | ||||||||
| White | 86 (71.7%) | 51 (76.1%) | 57 (82.6%) | 214 (83.6%) | 234 (76.7%) | 276 (82.4%) | 267 (77.2%) | 543 (79.7%) |
| Black | 30 (25.0%) | 15 (22.4%) | 10 (14.5%) | 40 (15.6%) | 61 (20.0%) | 55 (16.4%) | 69 (19.9%) | 124 (18.2%) |
| Other | 9 (7.5%) | 2 (3.0%) | 2 (2.9%) | 5 (2.0%) | 16 (5.2%) | 7 (2.1%) | 16 (4.6%) | 23 (3.4%) |
| No. missing | 1 | 1 | 0 | 0 | 3 | 4 | 3 | 7 |
| Hispanic, Latino or Spanish ethnicity, no. (%)‖ | 2 (1.7%) | 1 (1.5%) | 1 (1.5%) | 2 (0.8%) | 5 (1.6%) | 3 (0.9%) | 5 (1.4%) | 8 (1.2%) |
| No. missing | 1 | 0 | 0 | 2 | 1 | 3 | 1 | 4 |
| Serum vitamin D (nmol/L)¶ | ||||||||
| 25 to 49, no. (%) | 27 (22.3%) | 25 (36.8%) | 22 (31.9%) | 80 (31.2%) | 79 (25.6%) | 100 (29.5%) | 100 (28.7%) | 200 (29.1%) |
| 50 to 72.5, no. (%) | 94 (77.7%) | 43 (63.2%) | 47 (68.1%) | 176 (68.8%) | 229 (74.4%) | 239 (70.5%) | 249 (71.3%) | 488 (70.9%) |
| Mean (SD) | 56.3 (10.7) | 52.5 (13.1) | 53.6 (12.4) | 54.8 (13.2) | 56.2 (11.8) | 55.4 (13.2) | 55.2 (12.3) | 55.3 (12.7) |
| Taking a vitamin D supplement | ||||||||
| No. (%) | 48 (39.7%) | 27 (39.7%) | 23 (33.3%) | 96 (37.5%) | 121 (39.3%) | 124 (36.6%) | 132 (37.8%) | 256 (37.2%) |
| Median (IQR) daily IU/day (for those taking a supplement) | 600 (600) | 800 (500) | 571 (400) | 760 (600) | 700 (571) | 800 (586) | 700 (600) | 700 (600) |
| Total daily vitamin D intake (IU/day)** | ||||||||
| <200 | 46 (38.0%) | 21 (30.9%) | 30 (43.5%) | 89 (34.8%) | 110 (35.7%) | 125 (36.9%) | 128 (36.7%) | 253 (36.8%) |
| 200–399 | 22 (18.2%) | 16 (23.5%) | 14 (20.3%) | 56 (21.9%) | 61 (19.8%) | 68 (20.1%) | 70 (20.1%) | 138 (20.1%) |
| 401–799 | 19 (15.7%) | 10 (14.7%) | 13 (18.8%) | 48 (18.8%) | 56 (18.2%) | 63 (18.6%) | 62 (17.8%) | 125 (18.2%) |
| ≥ 800 | 34 (28.1%) | 21 (30.9%) | 12 (17.4%) | 63 (24.6%) | 81 (26.3%) | 83 (24.5%) | 89 (25.5%) | 172 (25.0%) |
| Median (IQR) | 293 (702) | 345 (779) | 237 (520) | 307 (647) | 303 (686) | 293 (649) | 288 (666) | 291 (659) |
| Fell ≥1 time in prior year, no. (%) | 75 (62.0%) | 43 (63.2%) | 47 (68.1%) | 162 (63.3%) | 205 (66.6%) | 221 (65.2%) | 229 (65.6%) | 450 (65.4%) |
| Qualifying fall risk attribute, no. (%)†† | ||||||||
| Fell and hurt self in past year | 44 (36.4%) | 21 (30.9%) | 30 (43.5%) | 96 (37.5%) | 118 (38.3%) | 130 (38.3%) | 132 (37.8%) | 262 (38.1%) |
| Fell ≥ 2 times in past year | 43 (35.5%) | 26 (38.2%) | 30 (43.5%) | 86 (33.6%) | 124 (40.3%) | 120 (35.4%) | 139 (39.8%) | 259 (37.6%) |
| Afraid of falling due to balance or walking problem | 106 (88.3%) | 65 (95.6%) | 56 (81.2%) | 222 (86.7%) | 279 (90.9%) | 290 (85.6%) | 311 (89.4%) | 601 (87.5%) |
| No. missing | 1 | 0 | 0 | 0 | 1 | 0 | 1 | 1 |
| Difficulty maintaining balance | 59 (48.8%) | 33 (49.3%) | 38 (55.1%) | 133 (52.0%) | 150 (48.7%) | 173 (51.0%) | 170 (48.9%) | 343 (49.9%) |
| No. missing | 0 | 1 | 0 | 0 | 0 | 0 | 1 | 1 |
| Cane, walker or other assistive device | 37 (30.6%) | 24 (35.3%) | 25 (36.2%) | 72 (28.1%) | 99 (32.2%) | 91 (26.8%) | 113 (32.5%) | 204 (29.7%) |
| No. missing | 0 | 0 | 0 | 0 | 1 | 0 | 1 | 1 |
| SPPB score‡‡ | ||||||||
| 0 to 3, no. (%) | 5 (4.1%) | 3 (4.3%) | 3 (4.4%) | 10 (3.9%) | 16 (5.2%) | 12 (3.5%) | 18 (5.2%) | 30 (4.4%) |
| 4 to 6, no. (%) | 10 (8.3%) | 12 (17.6%) | 11 (15.9%) | 26 (10.2%) | 37 (12.0%) | 34 (10.0%) | 41 (11.7%) | 75 (10.9%) |
| 7 to 9, no. (%) | 59 (48.8%) | 30 (44.1%) | 24 (34.8%) | 105 (41.0%) | 125 (40.6%) | 131 (38.6%) | 146 (41.8%) | 277 (40.3%) |
| 10 to 12, no. (%) | 47 (38.8%) | 23 (33.8%) | 31 (44.9%) | 115 (44.9%) | 130 (42.2%) | 162 (47.8%) | 144 (41.3%) | 306 (44.5%) |
| Median (IQR) | 9 (2) | 9 (3) | 9 (3) | 9 (2) | 9 (3) | 9 (2) | 9 (3) | 9 (2) |
| Gait speed (m/sec)§§ | ||||||||
| Mean (SD) | 0.85 (0.25) | 0.80 (0.23) | 0.85 (0.23) | 0.88 (0.23) | 0.84 (0.24) | 0.89 (0.23) | 0.84 (0.23) | 0.86 (0.24) |
| No. missing | 2 | 0 | 0 | 1 | 2 | 1 | 2 | 3 |
| Frailty status, no. (%) | ||||||||
| Robust | 31 (25.8%) | 25 (36.8%) | 18 (26.1%) | 80 (31.2%) | 83 (27.0%) | 104 (30.7%) | 94 (27.0%) | 198 (28.8%) |
| Pre-frail | 73 (60.8%) | 36 (52.9%) | 40 (58.0%) | 148 (57.8%) | 179 (58.3%) | 205 (60.5%) | 203 (58.3%) | 408 (59.4%) |
| Frail | 16 (13.3%) | 7 (10.3%) | 11 (15.9%) | 28 (10.9%) | 45 (14.7%) | 30 (8.8%) | 51 (14.7%) | 81 (11.8%) |
| No. missing | 1 | 0 | 0 | 0 | 1 | 0 | 1 | 1 |
| BMI (kg/m2), mean (SD) | 30.5 (5.3) | 30.7 (6.4) | 30.3 (6.2) | 30.3 (6.4) | 30.7 (5.5) | 30.4 (6.3) | 30.6 (5.6) | 30.5 (6.0) |
| No. missing | 1 | 0 | 0 | 0 | 1 | 0 | 1 | 1 |
| SF-12 quality of life component scores, mean (SD)‖‖ | ||||||||
| Physical | 43.2 (11.0) | 42.9 (10.2) | 44.0 (9.9) | 43.8 (10.4) | 43.2 (10.8) | 44.5 (10.3) | 43.1 (10.6) | 43.8 (10.5) |
| No. missing | 0 | 0 | 0 | 3 | 1 | 4 | 1 | 5 |
| Mental | 56.1 (7.2) | 54.5 (8.4) | 54.3 (9.4) | 55.2 (7.6) | 55.0 (8.1) | 55.1 (7.7) | 55.0 (8.2) | 55.0 (7.9) |
| No. missing | 0 | 0 | 0 | 3 | 1 | 4 | 1 | 5 |
Note: Abbreviations: IU/day = international units per day; SD = standard deviation; IQR = interquartile range; SPPB = Short Physical Performance Battery; BMI = body mass index; SF-12 = Short-Form 12 Item Health Survey (4 week recall) v2.
The decision to end dose-finding was based on the data as of February 02, 2018 (N=514) but was fully implemented on March 23, 2018 (N=529). Dose-finding data presented in this table reflect the population on which the decision was based.
The primary efficacy analysis compares the Experience on Best Dose group v. the 200IU/day group; this population includes 647 of the 688 randomized participants. The Experience on Best Dose group includes all participants assigned or switched to best dose (1000IU/day), and their data are limited to data while on best dose; the group excludes 41 participants randomized to 2000 or 4000IU/day who were never issued a bottle of 1000IU/day due to dying, completing the trial, dropping out of the trial, or stopping study pills without ever being switched to best dose. For those randomized to 2000 or 4000IU/day, at-risk time is measured and events are counted from the date of their switch to 1000IU/day.
The Pooled Higher Doses group (N=349) includes all participants randomized to 1000, 2000, or 4000IU/day; this group includes the 258 participants from the dose-finding population randomized to these doses, plus 91 participants randomized subsequently.
Race was self-reported by the participant from a list of 6 categories (American Indian or Alaska Native, Asian, Black or African American, Native Hawaiian or other Pacific Islander, White, Other); more than one race could be reported by a participant.
Ethnicity was self-reported by the participant from a list of 2 categories (Hispanic, Latino, or Spanish origin; Not Hispanic, not Latino, not Spanish origin).
The range of serum vitamin D level eligible for the trial (25–72.5nmol/L) includes levels termed deficient (<50nmol/L) or insufficient (50–72.5nmol/L) by the Endocrine Society and overlaps with levels termed deficient (<30nmol/L), inadequate (30-<50nmol/L), or adequate (≥50nmol/L) by the Institute of Medicine.
Total daily vitamin D intake at entry is the sum of the participant’s personal supplement dose and dietary intake as estimated from the self-reported modified Food Frequency Questionnaire.
More than one fall risk attribute could be reported by a participant.
The Short Physical Performance Battery (SPPB) is a 3-part assessment of physical functioning: balance testing, timed 4-meter walk, and demonstration of ability to complete 5 chair stands (stand up from a seated position in a chair); each part is scored 0 to 4 and the SPPB score (range 0 to 12) is the sum of the 3 subscores. Higher scores indicate better physical function.
Gait speed was obtained during the 4-meter walk component of the SPPB; the participant was asked to walk 4 meters at usual pace and gait speed was calculated as 4m divided by the time duration of the walk in seconds.
The Short-Form 12 Item Health Survey (4 week recall) v2 (SF-12) is an interviewer-administered 12-item scale measuring a person’s perceptions of their health and health-related quality of life; the physical and mental component scores each has a normative mean (SD) of 50 (10) (range 0 to 100). Higher scores indicate better health.
Key dates for the trial are shown in Supplement Table 1. Randomizations began on 10/30/2015. Follow-up ended on 05/31/2019. For the 667 participants who completed the trial, median time observed during the trial was 22.0 months; 433 had a primary outcome event (423 falls, 10 deaths), and 234 completed the trial without experiencing the primary outcome (Supplement Table 2A). Twenty-one (3.1%) participants left the trial early without experiencing the primary outcome (median time observed, 9.7 months). Median time observed for all 688 participants was 21.7 months.
Completeness of follow-up was also assessed by percentage of expected days (days from randomization to death, 24-months visit date if completed, expected 24-months visit date if not completed, or closeout contact, whichever came first) documented by any fall surveillance method. Time not documented is time lost due to participant dropout prior to the expected last date of follow-up. Participants were surveilled for 93.6% of expected days (Supplement Table 2B).
Other measures of data quality assessed include completeness of fall interviews and adherence to study pills. Of participants who reported a first fall, 98.3% completed a fall interview (Supplement Table 2C). The proportion of participants who reported taking their study pill ≥80% of expected days was 72.5% in the pooled higher doses group and 75.8% in the control group (Supplement Table 2D).
Dose-finding
Randomization probabilities were first adjusted in 08/2017. At that time, the posterior probabilities of being best were 0.918, 0.034, and 0.048 for 1000, 2000, and 4000IU/day, respectively. At the next pre-specified adjustment time, in 02/2018, when the posterior probabilities were 0.900, 0.028, and 0.072, for 1000, 2000, and 4000IU/day respectively, the DSMB recommended ending randomization to 2000IU/day based in part on the higher rate of hospitalization or death in the 2000IU/day versus the 200IU/day group (33.6/100person-years [PY] v. 12.1/100PY; HR=2.69, 95%CI:1.50–4.82; Supplement Table 3). The NIA concurred, despite the fact the posterior probability of 2000IU/day being best was above the pre-specified 0.025 suspension threshold. At that time, with 514 participants randomized, the primary outcome rate was lower in the 1000IU/day group (72.1/100PY) than in the 2000 and 4000IU/day groups (108.0 and 99.4/100PY, respectively) (Figure 2A, Supplement Table 4). Corresponding HRs for the 2000 and 4000IU/day groups versus the 1000IU/day group were 1.54 (95%CI:1.01–2.34) and 1.41 (95%CI:0.92–2.16). The event rate in the 200IU/day group was 90.5/100PY (Supplement Table 3).
Figure 2.
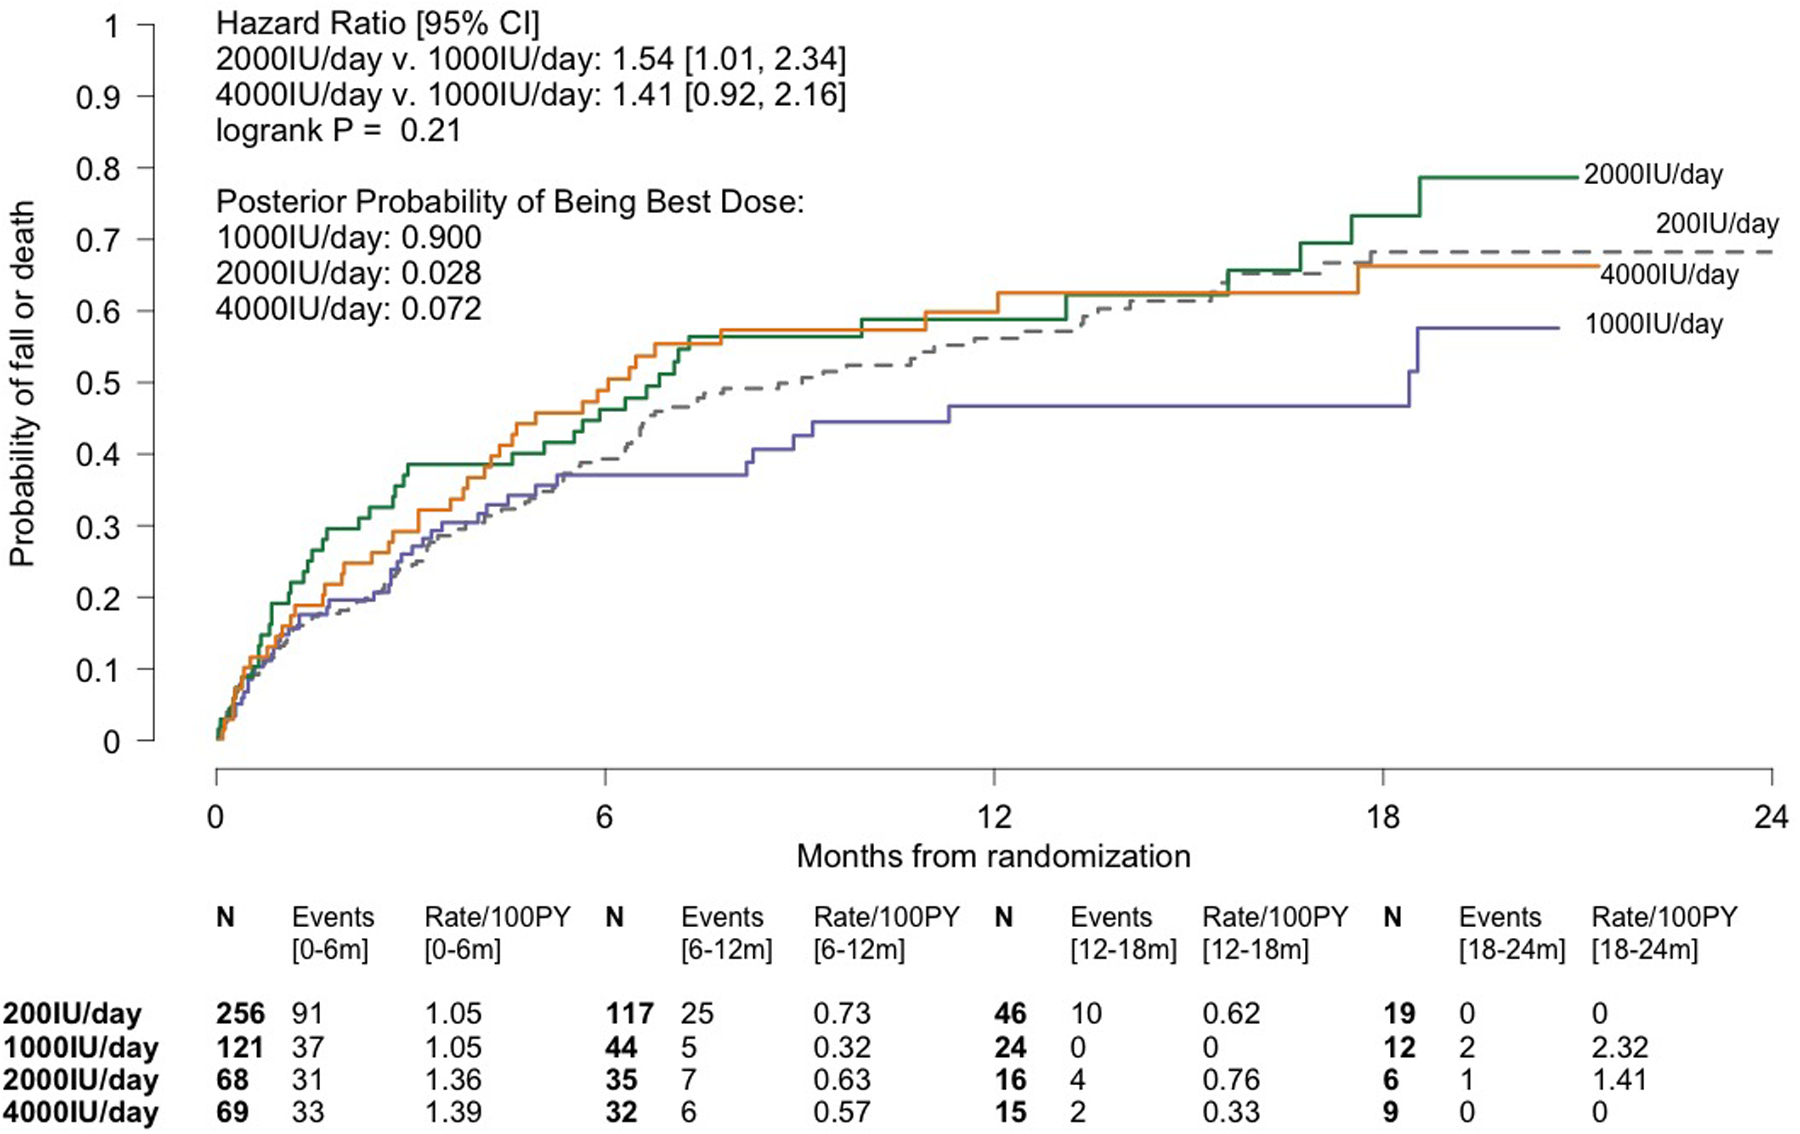
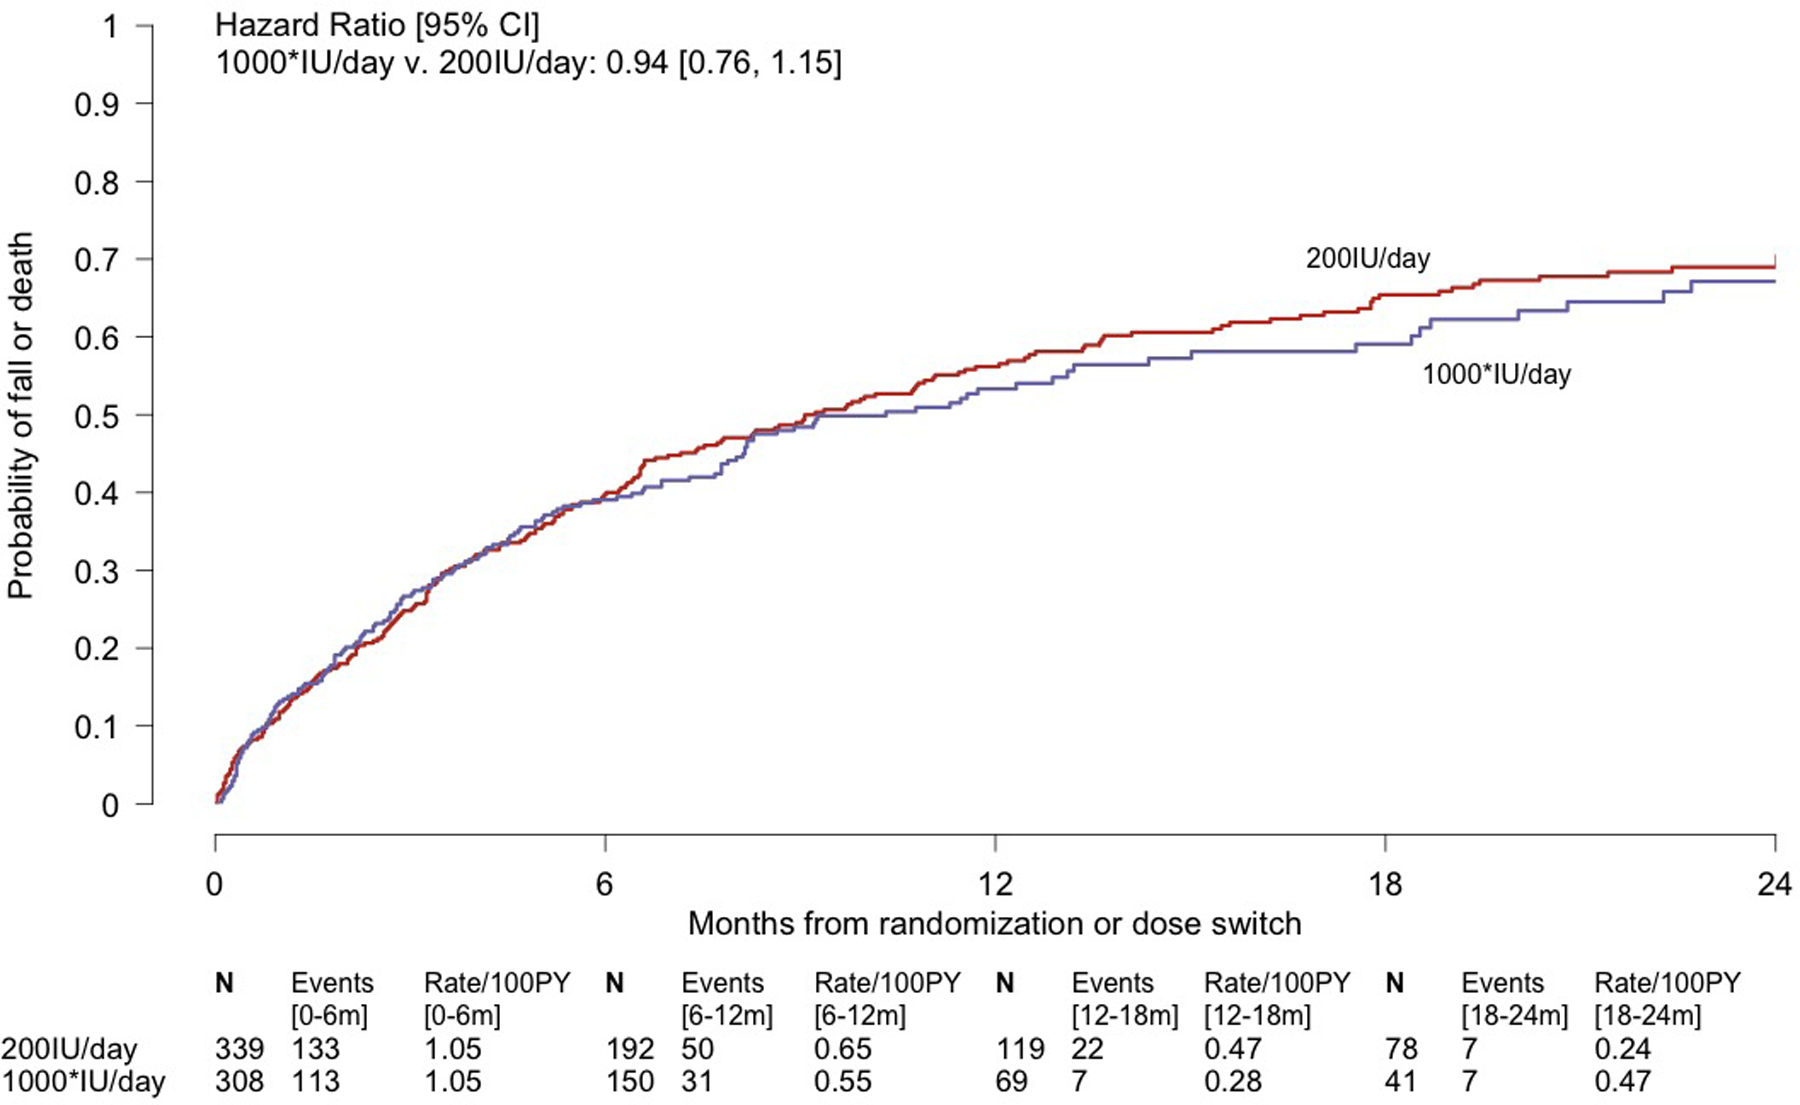
Kaplan-Meier Analyses of the Composite Primary Outcome of First Fall or Death During Dose-finding (Panel A) and Over all Follow-up (Panel B) in the STURDY Trial. Panel A displays a time-to-event analysis of the primary outcome during dose-finding, showing the data on which 1000IU/day was declared the best of the non-control doses for preventing falls; the median follow-up in the combined non-control groups was 4.5 months. Panel B displays the time-to-event primary efficacy analysis. 1000* denotes the combined 1000, 2000, and 4000IU/day groups with their observation time limited to time on best dose; the 1000* group excludes 41 participants randomized to 2000 or 4000IU/day who were never issued a bottle of 1000IU/day due to dying, completing the trial, dropping out of the trial, or stopping study pills without ever being switched to best dose. For those randomized to 2000 or 4000IU/day, at-risk time is measured and events are counted from the date of their switch to 1000IU/day. Median time to primary outcome or end of follow-up, whichever occurred first, among all 647 participants in the experience on best dose analysis was 6.5 months. 150 participants (median follow-up, 10.2 months) in the Experience on Best Dose group and 125 participants (median follow-up, 20.3 months) in the 200IU/day group who did not fall or die during follow-up were censored at their date of last contact. The hazard ratios and 95% confidence limits were derived from Cox regression models with dose group as the single model variable. In each panel, the number of participants remaining at risk of the event is shown below each time point. The events and event rates shown between pairs of time points are the number of events occurring in that time interval and the event rates over that interval. Abbreviations: CI = confidence interval; PY = person-years.
Stopping randomization to 2000IU/day, based in part on safety concerns, raised corresponding concern about continuing randomization to 4000IU/day. On 03/23/2018, with 529 participants randomized, the DSMB recommended ending randomization to 4000IU/day due to higher rates of the primary outcome and the composite of hospitalization or death in participants taking 4000IU/day versus 200IU/day (primary outcome: 99.4/100PY v. 90.5/100PY, respectively, HR=1.13, 95%CI:0.80–1.61; hospitalization or death: 20.6/100PY v. 12.1/100PY, respectively, HR=1.68, 95%CI:0.86–3.27; Supplement Table 3); the NIA concurred, despite the facts that the posterior probability of 4000IU/day being best was above the pre-specified 0.025 suspension threshold and had increased slightly compared with the posterior probability observed in August 2017. The 1000IU/day dose was declared the best dose, and dose-finding ended; the posterior probability of 1000IU/day being best was 0.90, below the pre-specified threshold of 0.95, and the primary outcome event rate was 72.1/100PY (95%CI:53.7–96.9). Supplement Table 5 displays the randomization adaptations. Note that because of the adaptive design, only 1 and 2 participants were randomized to 2000 and 4000IU/day, respectively, between the first adaptation on 08/02/2017 and the end of dose-finding, 3/23/2018.
Confirmatory stage
Beginning on 04/10/2018, participants previously randomized to 2000 and 4000IU/day were switched to 1000IU/day at their next scheduled study pill resupply date; median time on study pill before switching was 15.3 months (range 8.5 to 26.5 months). On 10/09/2018, the NIA requested conditional power analyses be provided at the next DSMB meeting, scheduled for 02/2019. Using the Lan and Wittes approach (27), conditional power was calculated using the data as of 12/2018 under three hazard ratio assumptions for comparing pooled higher doses to control, counting all events and observation time from randomization: (1) null hypothesis (HR=1.0), (2) protocol (HR=0.75), and (3) current data (HR=0.99). The resulting conditional power was <0.001 for all three assumptions, suggesting that with 386 (96.5%) of 400 expected events, there was extremely low probability that the trial, if continued, would demonstrate a benefit of 1000IU/day in preventing the primary outcome (Supplement Table 6). On 02/08/2019, the DSMB reviewed these post-hoc analyses and recommended trial termination; the NIA concurred.
Data collection ended on 05/31/2019; 433 (108% of expected) primary outcome events had occurred (Supplement Figure 1). The difference in the primary outcome between the group with experience on best dose and the 200IU/day group was not statistically significant (76.9 v. 76.0 events/100PY; HR=0.94, 95%CI:0.76–1.15; P=0.54; Table 2, Figure 2B, Supplement Figure 2). The proportional hazards assumption did not appear to be violated (P=0.45). Findings were similar in pre-specified subgroups (Supplement Figure 3) and in analyses stratified on calendar time of randomization (Supplement Table 7).
Table 2.
Composite Primary Outcome and Component Events.
| Primary Efficacy Analysis* | Sensitivity Analysis‡ | |||||
|---|---|---|---|---|---|---|
| Exp. on Best Dose (N=308) |
200IU/day (N=339) |
Hazard Ratio: Exp. on Best v. 200IU/day (95% CI)† |
Pooled Higher Doses (N=349) |
200IU/day (N=339) |
Hazard Ratio: Pooled Higher Doses v. 200IU/day (95% CI)† |
|
| Composite Primary Outcome: | ||||||
| First fall or death | ||||||
| No. of events | 158 | 214 | 0.94 (0.76, 1.15) |
219 | 214 | 1.04 (0.86, 1.25) |
| No. of PY | 205.4 | 281.6 | 280.8 | 281.6 | ||
| Rate per 100 PY | 76.9 | 76.0 | 78.0 | 76.0 | ||
| (95% CI) | (65.8, 89.9) | (66.5, 86.9) | (68.3, 89.0) | (66.5, 86.9) | ||
| P value§ | 0.54 | |||||
| First fall (primary outcome component) | ||||||
| No. of events | 157 | 208 | 0.96 (0.78, 1.18) |
215 | 208 | 1.05 (0.87, 1.27) |
| No. of PY | 202.4 | 278.0 | 277.6 | 278.0 | ||
| Rate per 100 PY | 77.6 | 74.8 | 77.4 | 74.8 | ||
| (95% CI) | (66.3, 90.7) | (65.3, 85.7) | (67.8, 88.5) | (65.3, 85.7) | ||
| Death (primary outcome component) | ||||||
| No. of events | 4 | 10 | 0.67 (0.21, 2.18) |
9 | 10 | 0.88 (0.36, 2.18) |
| No. of PY | 339.1 | 531.2 | 535.1 | 531.2 | ||
| Rate per 100 PY | 1.2 | 1.9 | 1.7 | 1.9 | ||
| (95% CI) | (0.4, 3.1) | (1.0, 3.5) | (0.9, 3.2) | (1.0, 3.5) | ||
Note: Abbreviations: CI = confidence interval; IU/day = international units per day; PY = person-years; SD = standard deviation. For each time-to-event analysis for the primary outcome, first fall, and death, data from participants who did not have the event were censored at their date of last contact for the event.
The primary efficacy analysis compares the Experience on Best Dose group v. the 200IU/day group; this population includes 647 of the 688 randomized participants. The Experience on Best Dose group includes all participants assigned or switched to best dose (1000IU/day), and their data are limited to data while on best dose; the group excludes 41 participants randomized to 2000 or 4000IU/day who were never issued a bottle of 1000IU/day due to dying, completing the trial, dropping out of the trial, or stopping study pills without ever being switched to best dose. For those randomized to 2000 or 4000IU/day, at-risk time is measured and events are counted from the date of their switch to 1000IU/day. In the primary outcome analysis, 150 participants in the Experience on Best Dose group (median follow-up, 10.2 months) and 125 participants in the 200IU/day group (median follow-up, 20.3 months) were censored.
Each hazard ratio and its 95% confidence interval were derived from a Cox regression model with dose group as the single model variable.
This sensitivity analysis compares the Pooled Higher Doses group v. 200IU/day; this population includes all 688 participants. The Pooled Higher Doses group consists of the combined 1000, 2000, and 4000IU/day groups; it includes the 258 participants from the dose-finding population randomized to these doses plus 91 participants randomized subsequently (total of 349 participants). In the primary outcome analysis, 130 participants in the Pooled Higher Doses group (median follow-up, 19.0 months) and 125 participants in the 200IU/day group (median follow-up, 20.3 months) were censored.
The P value was derived from the log-rank test and is nominal and 2-sided. P <0.05 was considered statistically different.
The sensitivity analysis comparing pooled higher doses versus 200IU/day with all events and observation time measured from randomization gave consistent results for the primary outcome (78.0 v. 76.0 events/100PY; HR=1.04, 95%CI:0.86–1.25; Table 2, Supplement Figure 4) and in the pre-specified subgroups (Supplement Figure 5). Results were similar in the sensitivity analysis restricting the non-control group to those randomized to 1000IU/day (Supplement Table 8, Supplement Figure 6).
In the post-hoc analysis treating death as a competing risk for falling, the HR for time to first fall for experience on best dose versus 200IU/day was 0.97 (95%CI:0.79–1.20; P=0.79; Supplement Table 9).
Secondary outcome
Over 85% of expected gait speed measures were collected at each assessment time (Table 3). The overall difference in change in gait speed between the pooled higher doses and 200IU/day groups was not statistically significant (time-by-treatment interaction P=0.15, Table 3).
Table 3.
Change in Gait Speed (m/sec) since Randomization.
| 3 months | 12 months | 24 months | ||||
|---|---|---|---|---|---|---|
| Pooled Higher Doses* | 200IU/day | Pooled Higher Doses* | 200IU/day | Pooled Higher Doses* | 200IU/day | |
| No. of participants expected | 348 | 336 | 283 | 283 | 177 | 184 |
| No. (%) of participants missed | 28 (8.0%) | 27 (8.0%) | 39 (13.8%) | 25 (8.8%) | 25 (14.1%) | 22 (12.0%) |
| No. of participants in analysis | 320 | 309 | 244 | 258 | 152 | 162 |
| Baseline, mean (SD)† | 0.85 (0.23) | 0.89 (0.23) | 0.86 (0.24) | 0.90 (0.24) | 0.85 (0.24) | 0.93 (0.23) |
| Change (FU-BL), mean (SD) | −0.01 (0.17) | −0.01 (0.18) | −0.04 (0.17) | −0.04 (0.20) | −0.03 (0.16) | −0.09 (0.21) |
| P, change within group‡ | 0.32 | 0.58 | <0.001 | 0.001 | 0.007 | <0.001 |
| P, difference between groups§ | 0.97 | 0.75 | 0.036 | |||
| P, overall¶ | 0.15 | |||||
Note: IU/day = international units per day; SD = standard deviation, FU = follow-up, BL = baseline, CI = confidence interval. All P values are nominal and 2-sided; P<0.05 was considered statistically significant.
Pooled Higher Doses denotes the combined 1000, 2000, and 4000IU/d groups; this group includes the 258 participants from the dose-finding population randomized to these doses plus 91 participants randomized subsequently.
Baseline values are shown for those with a follow-up measure at the given time point. The mean (SD) baseline gait speed (m/sec) was 0.84 (0.23) for the entire Pooled Higher Doses group and 0.89 (0.23) for the entire 200IU/day group.
P values for the time-specific change within group were derived from t-tests.
P values for time-specific difference between groups in change from baseline were derived from a longitudinal mixed effects linear regression model with gait speed as the outcome and fixed effects including a single treatment term, 3 time point terms, and 3 treatment-by-time interaction terms, and a random intercept for participant. Each time-specific P value for difference between groups at that time point is derived from the corresponding treatment-by-time interaction term. This model included all available measures of the outcome for all participants, including participants with only a baseline measure of gait speed.
The overall P tests for difference between groups in differential change from baseline over time and is from a 3-degree of freedom test of the combined 3 treatment-by-time interaction terms from the longitudinal model.
Achieved 25(OH)D level
During dose-finding, total 25(OH)D increased progressively across the four doses (Supplement Figure 7, Supplement Table 10); mean total 25(OH)D at 3 months was 67.1, 80.3, 87.3, and 119.2nmol/L across the four doses. In the confirmatory stage, mean total 25(OH)D at 3 months was 82.9 and 67.4nmol/L in the experience on best dose and 200IU/day groups, respectively; the separation persisted over 24 months (Supplement Figure 7, Supplement Table 10). Separation from 200IU/day was also seen in the measures obtained over time in the pooled higher doses and randomized to 1000IU/day groups.
Adverse events
During dose-finding, there was an increased rate of hospitalization in the 1000 and 2000IU/day groups compared to 200IU/day (Supplement Table 3). Over all follow-up, rates of hospitalizations and serious events potentially related to vitamin D supplementation were similar in the experience on best dose and 200IU/day groups (Table 4). However, first serious fall and first fall with hospitalization were more likely in the experience on best dose group versus 200IU/day (HR=1.87, 95%CI:1.03–3.41, and HR=2.48, 95%CI:1.13–5.46, respectively; Table 4). Comparison of the pooled higher doses group to 200IU/day gave similar results. No participant had extremely low (<25nmol/L) or high (≥375nmol/L) 25(OH)D during follow-up (Table 4).
Table 4.
Time-to-Event Analyses of Adverse Events.
| Primary Efficacy Analysis Population* | Sensitivity Analysis Population† | |||||
|---|---|---|---|---|---|---|
| Experience on Best Dose (N=308) |
200IU/day (N=339) |
Hazard Ratio: Experience on Best Dose v. 200IU/day (95% CI)‡ |
Pooled Higher Doses (N=349) |
200IU/day (N=339) |
Hazard Ratio: Pooled Higher Doses v. 200IU/day (95% CI)† |
|
| Death or first hospitalization | ||||||
| No. of events | 63 | 84 | 1.17 (0.84, 1.63) |
100 | 84 | 1.25 (0.93, 1.67) |
| No. of PY | 288.2 | 466.1 | 441.0 | 466.1 | ||
| Rate per 100 PY | 21.9 | 18.0 | 22.7 | 18.0 | ||
| (95% CI) | (17.1, 28.0) | (14.6, 22.3) | (18.6, 27.6) | (14.6, 22.3) | ||
| First hospitalization | ||||||
| No. of events | 61 | 77 | 1.23 (0.88, 1.74) |
96 | 77 | 1.31 (0.97, 1.77) |
| No. of PY | 288.2 | 466.1 | 441.0 | 466.1 | ||
| Rate per 100 PY | 21.2 | 16.5 | 21.8 | 16.5 | ||
| (95% CI) | (16.5, 27.2) | (13.2, 20.7) | (17.8, 26.6) | (13.2, 20.7) | ||
| First serious fall§ | ||||||
| No. of events | 24 | 20 | 1.87 (1.03, 3.41) |
37 | 20 | 1.85 (1.07, 3.19) |
| No. of PY | 314.2 | 491.3 | 493.4 | 491.3 | ||
| Rate per 100 PY | 7.6 | 4.1 | 7.5 | 4.1 | ||
| (95% CI) | (5.1, 11.4) | (2.6, 6.3) | (5.4, 10.4) | (2.6, 6.3) | ||
| First fall with hospitalization | ||||||
| No. of events | 17 | 10 | 2.48 (1.13, 5.46) |
24 | 10 | 2.39 (1.14, 5.00) |
| No. of PY | 317.7 | 501.1 | 503.9 | 501.1 | ||
| Rate per 100 PY | 5.4 | 2.0 | 4.8 | 2.0 | ||
| (95% CI) | (3.3, 8.6) | (1.1, 3.7) | (3.2, 7.1) | (1.1, 3.7) | ||
| First of kidney, bladder or ureteral stone, hypercalcemia, hypocalcemia, or extremely high or low serum vitamin D level‖ | ||||||
| No. of events | 8 | 8 | 2.02 (0.75, 5.45) |
10 | 8 | 1.22 (0.48, 3.09) |
| No. of PY | 336.5 | 527.1 | 529.4 | 527.1 | ||
| Rate per 100 PY | 2.4 | 1.5 | 1.9 | 1.5 | ||
| (95% CI) | (1.2, 4.8) | (0.8, 3.0) | (1.0, 3.5) | (0.8, 3.0) | ||
| Kidney, bladder or ureteral stone | ||||||
| No. of events | 4 | 4 | 2.11 (0.52, 8.55) |
5 | 4 | 1.26 (0.34, 4.68) |
| No. of PY | 337.0 | 528.6 | 531.3 | 528.6 | ||
| Rate per 100 PY | 1.2 | 0.8 | 0.9 | 0.8 | ||
| (95% CI) | (0.4, 3.2) | (0.3, 2.0) | (0.4, 2.3) | (0.3, 2.0) | ||
| Hypercalcemia‖ | ||||||
| No. of events | 0 | 0 | -- | 1 | 0 | -- |
| No. of PY | 339.1 | 531.2 | 533.7 | 531.2 | ||
| Hypocalcemia‖ | ||||||
| No. of events | 4 | 4 | 1.94 (0.48, 7.85) |
4 | 4 | 0.93 (0.23, 3.72) |
| No. of PY | 338.6 | 529.7 | 534.6 | 529.7 | ||
| Rate per 100 PY | 1.2 | 0.8 | 0.7 | 0.8 | ||
| (95% CI) | (0.4, 3.1) | (0.3, 2.0) | (0.3, 2.0) | (0.3, 2.0) | ||
| Extremely high serum vitamin D‖ | 0 | 0 | -- | 0 | 0 | -- |
| Extremely low serum vitamin D‖ | 0 | 0 | -- | 0 | 0 | -- |
Note: Abbreviations: IU/day = international units per day; CI = confidence interval; PY = person-years.
The primary efficacy analysis compares the Experience on Best Dose group v. the 200IU/day group; this population includes 647 of the 688 randomized participants. The Experience on Best Dose group includes all participants assigned or switched to best dose (1000IU/day), and their data are limited to data while on best dose; the group excludes 41 participants randomized to 2000 or 4000IU/day who were never issued a bottle of 1000IU/day due to dying, completing the trial, dropping out of the trial, or stopping study pills without ever being switched to best dose. For those randomized to 2000 or 4000IU/day, at-risk time is measured and events are counted from the date of their switch to 1000IU/day.
This sensitivity analysis compares the Pooled Higher Doses group v. 200IU/day; this population includes all 688 participants. The Pooled Higher Doses group consists of the combined 1000, 2000, and 4000IU/day groups; it includes the 258 participants from the dose-finding population randomized to these doses plus 91 participants randomized subsequently (total of 349 participants).
Each hazard ratio and 95% confidence interval were derived from a Cox proportional hazards regression model with dose group as the single model variable.
A serious fall was a fall resulting in a dislocated, broken, or fractured body part, or a fall associated with a serious adverse event.
Adverse events related to vitamin D that were tracked during the trial included: incidence of kidney, bladder or ureteral stones; hypercalcemia (confirmed serum calcium at least 11.9 mg/dL); hypocalcemia (serum calcium 8.4 mg/dL or less); extremely high serum vitamin D (at least 375nmol/L), or extremely low serum vitamin D (less than 25nmol/L).
DISCUSSION
This two-stage, response-adaptive trial compared three vitamin D supplement doses to 200IU/day in older adults with elevated fall risk and low serum vitamin D levels. During the dose-finding stage, 1000IU/day had a lower primary outcome rate than 2000 and 4000IU/day. During the confirmatory stage, primary outcome event rates did not differ significantly between the group with experience limited to best dose and 200IU/day; sensitivity and subgroup analyses gave consistent results. None of the confirmatory stage analyses found a benefit of ≥1000IU/day compared to 200IU/day. Rather, first serious fall and first fall with hospitalization occurred more often in ≥1000IU/day versus 200IU/day.
Findings that high-dose vitamin D might increase fall risk help to explain the heterogeneity in results of previous trials. At this trial’s inception, evidence was inconsistent. While the trial was ongoing, an updated meta-analysis concluded vitamin D supplements did not prevent falls (28). Two trials documented high-dose vitamin D supplements increased fall risk (29, 30) (and potentially fractures (31)) and one trial reported a U-shaped relationship of falls with vitamin D doses and 25(OH)D levels (32). Hence, data from our dose-finding stage and evidence from recent trials indicate that the inconsistent results of prior trials regarding the effects of vitamin D on falls may have resulted from differential effects of vitamin D by dose.
Strengths of this trial were its diverse population, high adherence and follow-up rates, rigorous fall ascertainment procedures, and enrollment of a high-risk population with low 25(OH)D levels, including black participants and overweight/obese individuals, who typically have low 25(OH)D levels (33).
This trial has limitations. First, the control group received 200IU/day of vitamin D, not a placebo pill. Whether 200IU/day has any effect on fall risk is uncertain. Only one trial (19) tested the effect of 200IU/day versus placebo, and only 26 and 25 participants were randomized to these two groups, respectively. Second, persons taking ≤1000IU/day of vitamin D supplements were enrolled, though they had low baseline 25(OH)D. Third, the primary outcome was self-reported; still, monthly calendars, quarterly contacts, and ad hoc telephone reports is an accepted, standard approach to ascertain falls (23). Fourth, participants were age ≥70 years and at high risk of falls. Results may not be generalizable to other populations. Fifth, a response-adaptive design presents tradeoffs as compared with a non-adaptive design. For example, as evidence of a higher event rate emerged in the 2000 and 4000IU/day groups, the response-adaptive design assigned fewer participants to these doses. While assignment of more participants to the better dose (and fewer to the less effective doses) is a strength of the response-adaptive design, a tradeoff is reduced precision for estimating effect sizes for the dropped doses in comparison to a design without adaptation. Sixth, the analysis plan was inconsistent in stating whether the primary efficacy analysis was based on pooled higher doses or experience on best dose; however, all variations on the primary efficacy analysis led to the same conclusion. Seventh, the conduct of the trial included departures from the trial’s analysis plan. Although pre-specified thresholds were not met, randomizations to 2000 and 4000IU/day were stopped, and 1000IU/day was declared the best dose, in part related to safety concerns. Although these decisions by the DSMB are departures from the protocol, these decisions were consistent with their charge to protect participant safety. Lastly, the trial was stopped early based on conditional power analyses that were not pre-specified. However, all conditional power analyses documented an extremely low probability of the trial demonstrating a benefit of ≥1000IU/day over 200IU/day.
This trial has implications for patients, clinicians, and policy makers. There was no beneficial effect of supplemental vitamin D at doses ≥1000IU/day on fall prevention compared to 200IU/day. This finding supports guidelines, including those of the 2018 US Preventive Services Task Force (34) which reversed their 2012 recommendation (15) and currently do not recommend vitamin D supplementation for fall prevention in older persons without osteoporosis or vitamin D deficiency. This trial further suggests lack of benefit in those with 25(OH)D levels of 25–72.5nmol/L. Whether supplemental doses of 2000 and 4000IU/day increase fall risk compared to 1000IU/day remains unclear. In the context of other reports of increased risk of falls from high-dose supplemental vitamin D, policy makers should re-evaluate the upper dose limit considered safe (35), especially given widespread use of vitamin D supplementation ≥1000IU/day (36).
In conclusion, in older persons with elevated fall risk and low serum 25-hydroxyvitamin D level, high-dose vitamin D supplementation ≥1000IU/day did not prevent falls compared with 200IU/day. Several analyses raise safety concerns about vitamin D3 doses ≥1000IU/day.
Supplementary Material
Acknowledgement:
The authors are thankful to the participants and the field center staff for their contributions to the STURDY trial.
Financial Support:
This trial was funded by the National Institute on Aging (U01AG047837) with support from the Office of Dietary Supplements, the Mid-Atlantic Nutrition Obesity Research Center (P30DK072488), and the Johns Hopkins Institute for Clinical and Translation Research (UL1TR003098). Dr. Juraschek was supported by a National Institute of Diabetes and Digestive and Kidney Diseases training grant (T32DK007732) and a National Heart, Lung, and Blood Institute career development award (K23HL135273). Dr. Plante was funded by a Health Research Services Administration Institutional National Research Service Award (T32HP10025B0) and a National Heart, Lung, and Blood Institute training grant (T32HL007180). Dr. Schrack was supported by a National Institute on Aging career development award (K01AG048765). Dr. Kalyani was supported by a National Institute of Diabetes and Digestive and Kidney Diseases career development award (K23DK093583). The content is solely the responsibility of the authors and does not necessarily represent the official views of the National Institutes of Health.
Primary Funding Source:
Grant from the National Institute on Aging.
Disclosures:
The authors report NIH/NIA grant funding supporting their work on this trial and additional relevant NIH support as described in the Funding section. Additionally, Dr. Christenson reports grants and personal fees from Roche Diagnostics, Siemens Healthineers, Quidel Corporation, Becton Dickinson and Company, Beckman Coulter, and Spingotec GHB.
Data Sharing Statement:
De-identified participant data and data dictionary will be available at https://archive.data.jhu.edu/ starting one year after publication of this paper, contingent upon IRB approval.
Footnotes
This paper is subject to the NIH Public Access Policy.
Registration: Registered at ClinicalTrials.gov (NCT02166333) on June 18, 2014.
References
- 1.https://www.cdc.gov/homeandrecreationalsafety/falls/adultfalls.html (Accessed November 27, 2017).
- 2.Ceglia L Vitamin D And Skeletal Muscle Tissue and Function. Mol Aspects Med. 2008;29(6):407–14. [DOI] [PubMed] [Google Scholar]
- 3.Cesari M, Incalzi RA, Zamboni V, Pahor M. Vitamin D Hormone: A Multitude of Actions Potentially Influencing The Physical Function Decline In Older Persons. Geriatr Gerontol Int. 2011;11(2):133–42. [DOI] [PMC free article] [PubMed] [Google Scholar]
- 4.Zhu K, Austin N, Devine A, Bruce D, Prince RL. A Randomized Controlled Trial Of The Effects Of Vitamin D On Muscle Strength And Mobility In Older Women With Vitamin D Insufficiency. J Am Geriatr Soc. 2010;58(11):2063–8. [DOI] [PubMed] [Google Scholar]
- 5.Tang O, Juraschek SP, Appel LJ. Design Features of Randomized Clinical Trials of Vitamin D and Falls: A Systematic Review. Nutrients. 2018;10(8):964. [DOI] [PMC free article] [PubMed] [Google Scholar]
- 6.Kalyani RR, Stein B, Valiyil R, Manno R, Maynard JW, Crews DC. Vitamin D treatment for the prevention of falls in older adults: systematic review and meta-analysis. J Am Geriatr Soc. 2010;58(7):1299–310. [DOI] [PMC free article] [PubMed] [Google Scholar]
- 7.Pfeifer M, Begerow B, Minne HW, Suppan K, Fahrleitner-Pammer A, Dobnig H. Effects of a long-term vitamin D and calcium supplementation on falls and parameters of muscle function in community-dwelling older individuals. Osteoporos Int. 2009;20(2):315–22. [DOI] [PubMed] [Google Scholar]
- 8.Bischoff-Ferrari HA, Orav EJ, Dawson-Hughes B. Effect of cholecalciferol plus calcium on falling in ambulatory older men and women: a 3-year randomized controlled trial. Arch Intern Med. 2006;166(4):424–30. [DOI] [PubMed] [Google Scholar]
- 9.Flicker L, MacInnis RJ, Stein MS, Scherer SC, Mead KE, Nowson CA, et al. Should older people in residential care receive vitamin D to prevent falls? Results of a randomized trial. J Am Geriatr Soc. 2005;53(11):1881–8. [DOI] [PubMed] [Google Scholar]
- 10.Graafmans WC, Ooms ME, Hofstee HM, Bezemer PD, Bouter LM, Lips P. Falls in the elderly: a prospective study of risk factors and risk profiles. Am J Epidemiol. 1996;143(11):1129–36. [DOI] [PubMed] [Google Scholar]
- 11.Sanders KM, Stuart AL, Williamson EJ, Simpson JA, Kotowicz MA, Young D, et al. Annual high-dose oral vitamin D and falls and fractures in older women: a randomized controlled trial. JAMA. 2010;303(18):1815–22. [DOI] [PubMed] [Google Scholar]
- 12.American Geriatrics Society Work Group on Vitamin D Supplmentation for Older Adults. Recommendations abstracted from the American Geriatrics Society consensus statement on vitamin D for prevention of falls and their consequences. J Am Geriatr Soc. 2014;62(1):147–52. [DOI] [PubMed] [Google Scholar]
- 13.Holick MF, Binkley NC, Bischoff-Ferrari HA, Gordon CM, Hanley DA, Heaney RP, et al. Evaluation, treatment, and prevention of vitamin D deficiency: an Endocrine Society clinical practice guideline. J Clin Endocrinol Metab. 2011;96(7):1911–30. [DOI] [PubMed] [Google Scholar]
- 14.Dawson-Hughes B, Mithal A, Bonjour JP, Boonen S, Burckhardt P, Fuleihan GE, et al. IOF position statement: vitamin D recommendations for older adults. Osteoporos Int. 2010;21(7):1151–4. [DOI] [PubMed] [Google Scholar]
- 15.Moyer VA, Force USPST. Prevention of falls in community-dwelling older adults: U.S. Preventive Services Task Force recommendation statement. Ann Intern Med. 2012;157(3):197–204. [DOI] [PubMed] [Google Scholar]
- 16.Dietary Reference Intakes for Calcium and Vitamin D. In: Ross AC, Taylor CL, Yaktine AL, Del Valle HB, eds. Washington (DC): Institute of Medicine (US) Committee to Review Dietary Reference Intakes for Vitamin D and Calcium; 2011. [PubMed] [Google Scholar]
- 17.Phinney KW, Bedner M, Tai SS, Vamathevan VV, Sander LC, Sharpless KE, et al. Development and certification of a standard reference material for vitamin D metabolites in human serum. Anal Chem. 2012;84(2):956–62. [DOI] [PMC free article] [PubMed] [Google Scholar]
- 18.Berry SM, Carlin BP, Lee JJ, Muller P. Bayesian Adaptive Methods for Clinical Trials. Boca Raton, FL: Taylor and Francis Group, LLC; 2011. [Google Scholar]
- 19.Broe KE, Chen TC, Weinberg J, Bischoff-Ferrari HA, Holick MF, Kiel DP. A higher dose of vitamin D reduces the risk of falls in nursing home residents: a randomized, multiple-dose study. J Am Geriatr Soc. 2007;55(2):234–9. [DOI] [PubMed] [Google Scholar]
- 20.Manson JE, Bassuk SS, Lee IM, Cook NR, Albert MA, Gordon D, et al. The VITamin D and OmegA-3 TriaL (VITAL): rationale and design of a large randomized controlled trial of vitamin D and marine omega-3 fatty acid supplements for the primary prevention of cancer and cardiovascular disease. Contemp Clin Trials. 2012;33(1):159–71. [DOI] [PMC free article] [PubMed] [Google Scholar]
- 21.Hathcock JN, Shao A, Vieth R, Heaney R. Risk assessment for vitamin D. Am J Clin Nutr. 2007;85(1):6–18. [DOI] [PubMed] [Google Scholar]
- 22.World Health Organization. Ageing and Life Course Unit. WHO global report on falls prevention in older age. Geneva, Switzerland: World Health Organization; 2008. [Google Scholar]
- 23.Teister CJ, Chocano-Bedoya PO, Orav EJ, Dawson-Hughes B, Meyer U, Meyer OW, et al. Which Method of Fall Ascertainment Captures the Most Falls in Prefrail and Frail Seniors? Am J Epidemiol. 2018;187(10):2243–51. [DOI] [PubMed] [Google Scholar]
- 24.Guralnik JM, Simonsick EM, Ferrucci L, Glynn RJ, Berkman LF, Blazer DG, et al. A short physical performance battery assessing lower extremity function: association with self-reported disability and prediction of mortality and nursing home admission. J Gerontol. 1994;49(2):M85–94. [DOI] [PubMed] [Google Scholar]
- 25.Grambsch PM, Therneau TM. Proportional hazards tests and diagnostics based on weighted residuals. Biometrika. 1994;81(3):515–26. [Google Scholar]
- 26.Fine JP, Gray RJ. A Proportional Hazards Model for the Subdistribution of a Competing Risk. J Am Stat Assoc. 1999;94(446):469–509. [Google Scholar]
- 27.Lan KK, Wittes J. The B-value: a tool for monitoring data. Biometrics. 1988;44(2):579–85. [PubMed] [Google Scholar]
- 28.Bolland MJ, Grey A, Avenell A. Effects of vitamin D supplementation on musculoskeletal health: a systematic review, meta-analysis, and trial sequential analysis. Lancet Diabetes Endocrinol. 2018;6(11):847–58. [DOI] [PubMed] [Google Scholar]
- 29.Ginde AA, Blatchford P, Breese K, Zarrabi L, Linnebur SA, Wallace JI, et al. High-Dose Monthly Vitamin D for Prevention of Acute Respiratory Infection in Older Long-Term Care Residents: A Randomized Clinical Trial. J Am Geriatr Soc. 2017;65(3):496–503. [DOI] [PMC free article] [PubMed] [Google Scholar]
- 30.Bischoff-Ferrari HA, Dawson-Hughes B, Orav EJ, Staehelin HB, Meyer OW, Theiler R, et al. Monthly High-Dose Vitamin D Treatment for the Prevention of Functional Decline: A Randomized Clinical Trial. JAMA Intern Med. 2016;176(2):175–83. [DOI] [PubMed] [Google Scholar]
- 31.Burt LA, Billington EO, Rose MS, Raymond DA, Hanley DA, Boyd SK. Effect of High-Dose Vitamin D Supplementation on Volumetric Bone Density and Bone Strength: A Randomized Clinical Trial. JAMA. 2019;322(8):736–45. [DOI] [PMC free article] [PubMed] [Google Scholar]
- 32.Smith LM, Gallagher JC, Suiter C. Medium doses of daily vitamin D decrease falls and higher doses of daily vitamin D3 increase falls: A randomized clinical trial. J Steroid Biochem Mol Biol. 2017;173:317–22. [DOI] [PMC free article] [PubMed] [Google Scholar]
- 33.Liu X, Baylin A, Levy PD. Vitamin D deficiency and insufficiency among US adults: prevalence, predictors and clinical implications. Br J Nutr. 2018;119(8):928–36. [DOI] [PubMed] [Google Scholar]
- 34.Force USPST, Grossman DC, Curry SJ, Owens DK, Barry MJ, Caughey AB, et al. Interventions to Prevent Falls in Community-Dwelling Older Adults: US Preventive Services Task Force Recommendation Statement. JAMA. 2018;319(16):1696–704. [DOI] [PubMed] [Google Scholar]
- 35.Gallagher JC. Vitamin D and falls - the dosage conundrum. Nat Rev Endocrinol. 2016;12(11):680–4. [DOI] [PubMed] [Google Scholar]
- 36.Rooney M, Harnack L, Michos E, Rachel P, Sempos C, Lutsey P. Trends in Use of High-Dose Vitamin D Supplements Exceeding 1000 or 4000 International Units Daily, 1999–2014. JAMA. 2017;317(23):2447–50. [DOI] [PMC free article] [PubMed] [Google Scholar]
- 37.Cook JD. Numerical evaluation of gamma inequalities, Technical report UTMDABTR-001–06, 2006.
- 38.Klein JP, Moeschberger ML. Survival analysis: techniques for censored and truncated data, Springer, New York, NY, 1997. [Google Scholar]
- 39.Bischoff-Ferrari HA, Dawson-Hughes B, Staehelin HB, et al. Fall prevention with supplemental and active forms of vitamin D: a meta-analysis of randomised controlled trials. BMJ. 2009;339:b3692. [DOI] [PMC free article] [PubMed] [Google Scholar]
- 40.Bischoff-Ferrari HA, Dawson-Hughes B, Willett WC, et al. Effect of Vitamin D on falls: a meta-analysis. JAMA. 2004;291(16):1999–2006. [DOI] [PubMed] [Google Scholar]
- 41.Dukas L, Bischoff HA, Lindpaintner LS, et al. Alfacalcidol reduces the number of fallers in a community-dwelling elderly population with a minimum calcium intake of more than 500 mg daily, Journal of the American Geriatrics Society. 2004;52(2):230–6. [DOI] [PubMed] [Google Scholar]
- 42.Bischoff HA, Stahelin HB, Dick W, et al. Effects of vitamin D and calcium supplementation on falls: a randomized controlled trial. J Bone Miner Res. 2003;18(2):343–51. [DOI] [PubMed] [Google Scholar]
Associated Data
This section collects any data citations, data availability statements, or supplementary materials included in this article.