Abstract
Aim:
Plasma and serum are widely used blood-derived biofluids for metabolomics and lipidomics assays, but analytes that are present in high concentrations in blood cells cannot be evaluated in those samples and isolating serum or plasma could introduce additional variability in the data.
Materials & methods:
In this study, we provide a comprehensive method for quantification of the whole blood (WB) sphingolipidome, combining a single-phase extraction method with LC–high-resolution mass spectrometry.
Results:
We were able to quantify more than 150 sphingolipids, and when compared with paired plasma, WB contained higher concentration of most sphingolipids and individual variations were lower. These findings suggest that WB could be a better alternative to plasma, and potentially guide the evaluation of the sphingolipidome for biomarker discovery.
Keywords: : ceramides, high-resolution mass spectrometry, plasma, sphingolipids, whole blood
Lay abstract
Whole blood (WB) is a mixture of different cellular and acellular components including red blood cells, white blood cells, platelets and plasma. Ceramides, one class of sphingolipids, have been reported as promising biomarkers of cardiac events and several other pathologies, but their plasma concentrations vary depending on diet, time of day and other factors. In this study, we established a comprehensive method for the quantification of the WB sphingolipidome. We were able to quantify more than 150 sphingolipids, and when compared with paired plasma, WB contained higher concentration of most sphingolipids and individual variations were lower. These findings suggest that WB could be a better alternative to plasma, and potentially guide the evaluation of new biomarker discovery.
Graphical abstract
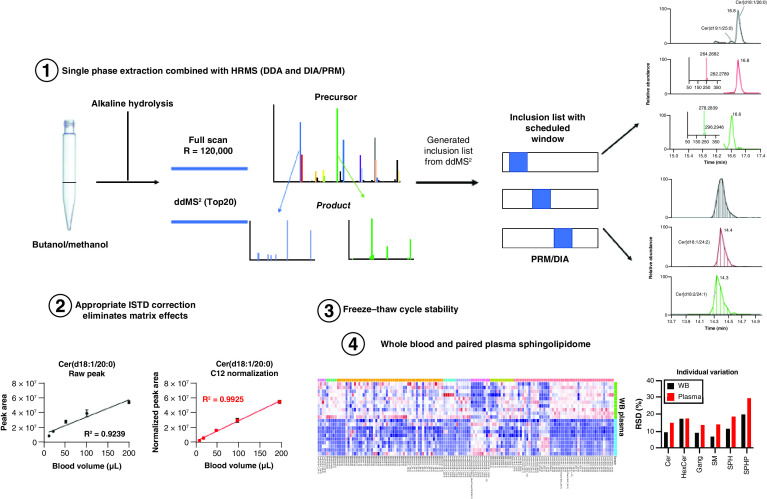
Whole blood (WB) is a mixture of different cellular and acellular components including red blood cells (RBC), white blood cells, platelets and plasma. In the majority of conventional metabolomics studies, plasma or serum derived from WB is used for the analysis. The preparative steps and processing to separate plasma or serum can result in pre-analytical variability and systematic changes in the metabolome which could underestimate certain metabolic pathways including glycolysis, coenzymes, antioxidants and purine metabolism. Those metabolic intermediates are known to be present at high concentrations in blood cells but are not detected (or are very low) in plasma [1,2]. Increasing evidence has demonstrated that WB metabolomics could provide more useful metabolite level information in delineating metabolic effects related to aging, disease, nutrition and environmental stressors than plasma metabolomics [3–5]. One notable example of the use of WB was to enable the quantification of acetyl-CoA, where in comparison its detection was not possible in serum or plasma [6]. Another example assayed human WB in a high-throughput method for quantitative detection of eicosanoids and fatty acids [3,7].
To our knowledge, only a limited number of studies used WB for lipidomics analysis using LC–high-resolution mass spectrometry (LC–HRMS) [8–12] but there are several reports using 1H-NMR, which is less sensitive when compared with LC–MS methods. In order to assess the advantage of using WB for lipidomics analysis, the lipid composition should be elucidated and compared with plasma. Marasca et al. selected 15 lipids species across lipids classes and compared their profiles from WB, dry blood spots or volumetric absorptive microsampling, paving the way for more detailed studies [8].
We focused our lipidomics study on sphingolipids. They are one of the major classes of eukaryotic lipids that are forming the outer leaflet of the plasma membrane lipid bilayer. Some are bioactive sphingolipids including ceramides, sphingosine-1-P and glycosphingolipids, that are involved in aspects of cellular functions, including cell proliferation, cell differentiation, apoptosis, cell cycle arrest, senescence, autophagy, cytoskeleton rearrangement, necrosis, inflammation, neurodegeneration, and cancer cell migration and invasion [13–16]. Their synthesis and degradation processes [17–19] occur in different intracellular compartmentalization including the endoplasmic reticulum, Golgi apparatus and lysosomes.
An extensive review of the effect of anticoagulants for plasma collection for metabolomics analysis determined that both heparin and EDTA coated tubes provided similar results [20]; however, EDTA was shown to be preferred for lipidomics analysis [21]. To potentially guide the evaluation of sphingolipidome in WB for biomarker discovery, we explored methods for quantification of the sphingolipids using different extraction methods combined with LC–HRMS. We provide robust annotations and quantification assisted by alkaline hydrolysis, parallel reaction monitoring (PRM)/data-independent acquisition (DIA) and appropriate internal standard (IS) normalization. One freeze–thaw cycle had no significant effect on sphingolipids concentrations, which will improve the option to use previously stored WB for sphingolipid analysis. More importantly, we compared the sphingolipidome of WB and plasma, showing that WB contained a higher concentration of most sphingolipids than the paired plasma. Reducing the processing steps for plasma or serum isolation by directly freezing the WB at -80°C may provide a simple and robust workflow for large lipidomics studies.
Materials & methods
Chemicals & reagents
Acetonitrile (Optima™, Catalog No. A996-4), methanol (Optima™, Catalog No. A454-4), water methyl tert-butyl ether (MTBE; Optima™, Catalog No. W7-4), 2-propanol (Optima™, Catalog No. A464-4), methyl tert-butyl ether (HPLC grade, Catalog No. E127-4), 1-butanol (Catalog No. A399-1) and formic acid (Optima™, Catalog No. A117-50) were obtained from Thermo Fisher Scientific (MA, USA). Ammonium formate solution (Catalog No. 0001447733) and potassium hydroxide (Catalog No. MKBM7088V) were from Sigma-Aldrich (MO, USA). C18:0 GM3-d5 (Catalog No. 860073), C15 glucosyl(β) ceramide-d7 (d18:1-d7/15:0; Catalog No. 330729), ceramides (Cer)/sphingosine (Sph) Mixture I (Catalog No. LM6002) containing sphingosine (C17 base), sphinganine (C17 base), sphingosine-1-P (C17 base), sphinganine-1-P (C17 base), lactosyl (β) C12 ceramide (hexosyl [Hex] 2Cer d18:1/12:0), 12:0 sphingomyelin (12:0 sphingomyelins [SM]), glucosyl (β) C12 ceramide (Hex1Cer d18:1/12:0), 12:0 ceramide (d18:1/12:0), 12:0 ceramide-1-P (ceramide-1-phosphate [Cer] P d18:1/12:0), and 25:0 Ceramide (d18:1/25:0), and SPLASH® LIPIDOMIX® Mass Spec Standard (Catalog No. 330707) consisting of 15:0–18:1(d7) PC, 15:0–18:1(d7) PE, 15:0–18:1(d7) PS, 15:0–18:1(d7) PG, 15:0–18:1(d7) PI, 15:0–18:1(d7) PA, 18:1(d7) LPC, 18:1(d7) LPE, 18:1(d7) Chol Ester, 18:1(d7) MG,15:0–18:1(d7) DG, 15:0–18:1(d7)-15:0 TG, 18:1(d9) SM and cholesterol (d7) were from Avanti Polar Lipids (AL, USA). Standards including Cer(d18:1/16:0), Cer(d18:0/16:0), Cer(d18:1/18:0), Cer(d18:0/18:0), Cer(d18:1/24:0), Cer(d18:0/24:0), Cer(d18:1/24:1), Cer(18:0/24:1), Cer(18:2/24:0), sphinganine, sphingosine, sphiganine-1-P, sphingosine-1-P, CerP(d18:1/24:0), SM(d18:1/16:0) and SM(d18:1/24:0) were from Avanti Polar Lipids.
Blood & plasma collection
WB samples were collected from healthy volunteer controls (six males, four females, average age 28.6) after overnight fasting into EDTA-coated tubes (Catalog No. 367861, 4-ml tubes with 7.2 mg EDTA). Each tube was gently inverted (without shaking or foaming contents) five-times prior to transfer of aliquots to separate LoBind tubes or plasma isolation. All controls are enrolled in an ongoing natural history study at the Children’s Hospital of Philadelphia (IRB #01-002609). Plasma was obtained from WB after centrifugation at 500 × g for 20 min at 4°C within 30 min after blood draw.
Sample preparation for sphingolipidomics
Butanol single-phase extraction
This method was modified from previous reports [22,23]. Briefly, 50-μl WB (or other volumes as indicated on graphs) or plasma, mixed with 20-μl IS solution (Cer/Sph Mixture I, was used as supplied by Avanti Polar Lipids for all the experiments described here, and the concentration of each of the components is indicated in Supplementary Table 1), were extracted with 1-ml butanol/methanol (1:1; v:v) with 10 mM ammonium formate. After centrifugation at 500 × g for 10 min, the supernatant was collected and dried under a stream of nitrogen to complete dryness.
MTBE two-phase extraction
A total of 50-μl WB or plasma, mixed with 20-μl IS solution, was extracted with 0.75-ml methanol and 2.5-ml MTBE, then 0.625-ml water was added to induce two-phase separation [24,25]. After centrifugation at 500 × g for 10 min, the upper organic phase was transferred into a new tube and dried under a stream of nitrogen.
MTBE single-phase extraction
This method was modified according to a published protocol ( replacing chloroform by MTBE) to achieve better result for polar lipids [26]. Briefly, 50-μl WB or plasma, mixed with 20-μl IS solution, were vortex mixed for 30 s with 0.5-ml water, 1.25-ml methanol and 1.25-ml MTBE. Different from the MTBE two-phase method, this mix will result in a final single phase for lipidomic analysis.
Each of the extraction steps was repeated, and the combined steps were dried under a stream of nitrogen to complete dryness. A total of 100-μl methanol/MTBE (1:3; v:v) was used for the resuspension of all samples.
Alkaline hydrolysis
For the butanol single-phase method, 100-μl 1M KOH was added to extraction solvent, and incubated at 37°C for 45 min, then neutralized with 6-μl glacial acetic acid (monitored with pH paper to pH 6–7).
Freeze–thaw cycle
The freeze–thaw cycle was performed with fresh collected WB samples that were processed within 30 min of the blood draw. Fresh blood samples were aliquoted into 100 μl. Three technical replicates were used directly for extraction with butanol single-phase method; the remaining aliquots were frozen at -80°C for 24 h. After 24 h, the frozen blood samples were taken out of the freezer, and three technical replicates were extracted with butanol/methanol without thawing, while other three were thawed on ice (∼2 h) and then processed with the same extraction method as for fresh blood.
LC–high-resolution mass spectrometry
An Ultimate 3000 UPLC system (Thermo Fisher Scientific) coupled to a Q Exactive-HF mass spectrometer (Thermo Fisher Scientific) were used for sphingolipid analysis. Chromatographic separation of sphingolipids was achieved on an Accucore™ C18 column (2.1 × 150 mm, 2.6 μm) with solvent A as 0.1% formic acid in 10 mM ammonium formate in acetonitrile/water 1/1 (v/v) and solvent B as 0.02% formic acid in 2 mM ammonium formate in acetonitrile/isopropanol/water 10/88/2 (v/v/v). The gradient was as follows: 0 min, 90% A; 1 min, 90% A; 4 min, 60% A; 12 min, 25% A; 21 min, 1% A; 24 min, 1% A; 24.1 min, 90% A; and 28 min, 90% A. The flow rate is 0.4 ml/min. Data acquisition was performed in Full Scan/ddMS2 mode @ 120,000 resolution in positive and negative mode, separately. The Full Scan settings were as follows: AGC target, 1e6; Maximum IT, 250 ms; and scan range, 250–1800 m/z. Top 20 MS/MS spectral (dd-MS2) @ 15,000 were generated in the same cycle with AGC target 1e5, Maximum IT 25 ms, isolation window 1.0 m/z and (N)CE/stepped NCE 25, 30, 35v (positive mode).
Full Scan/PRM or Full Scan/DIA were performed with scheduled inclusion list (Supplementary Table 2). Full Scan settings were as follows: m/z 200–1500; resolution 120,000; Maximum IT 200 ms; and AGC target 1e6. For PRM, spectra were acquired as follows: isolation window 1.0 m/z; resolution 15,000; AGC 1e5; and Maximum IT 100 ms. For DIA, spectra were acquired as follows: isolation window 1.0 m/z; resolution 15,000; AGC 1e5; Maximum IT 100 ms; and loop count 20.
Data analysis
Peak detection, identification, alignment and quantification were performed with LipidSearch 4.2 (Thermo Fisher Scientific). Peak detection was achieved by searching their target database (HCD), and identification was performed using comprehensive ID algorithms (search type, product) with precursor tolerance = 5 p.p.m., product tolerance = 10 p.p.m., m-Score threshold = 2.0. Identified peaks were filtered with m-Score threshold (>5.0) and ID quality filter (A and B and C). Adducts included +H, +NH4, +Na and +H-H2O in positive mode, and -H, +HCOO, -2H and -CH3 in negative mode. Lipid results from each sample were then aligned within a RT window of 0.1 min and quantified by detecting their precursor ions from full MS and integrating XICs.
Statistical analysis
All the data were presented with mean ± SD. Two-tailed unpaired t-test was used to compare the significant difference with p < 0.05. Graphpad Prism 9.0 was used to generate the illustrations and perform statistical analysis. Heatmap was conducted using R 3.6.3 with package pheatmap [27]. The approximate concentration for each sphingolipids was calculated by multiplying the area ratio of the sphingolipid/sphingolipids IS with the relevant IS amount added to each sample.
Results
Single-phase extraction combined with HRMS provides accurate quantification of WB sphingolipidome
Due to the lack of tested methods for WB lipidomics, we selected several extraction protocols (MTBE two phase, MTBE single phase and butanol single phase) that were previously reported for plasma or serum and compared the fortified extraction efficacies of different sphingolipid ISs. All three methods showed good recoveries for ceramides, ceramide-1-P, sphingomyelins and Hex-ceramides (Figure 1A). However, the two-phase MTBE methods showed bad recoveries for sphingosine, sphinganine and their phosphate forms. The modified MTBE method enhanced the recovery of sphingosine-1-P and sphinganine-1-P but showed little improvement for sphingosine and sphinganine. Compared with the MTBE method, the single-phase butanol method, which was recently developed for plasma and serum lipidomics, exhibited good recoveries for all the sphingolipids (Figure 1A). Therefore, the single-phase butanol extraction method was used for sample preparation of the WB sphingolipidome.
Figure 1. . Single-phase extraction combined with high-resolution mass spectrometry provides accurate quantification of the whole blood sphingolipidome.
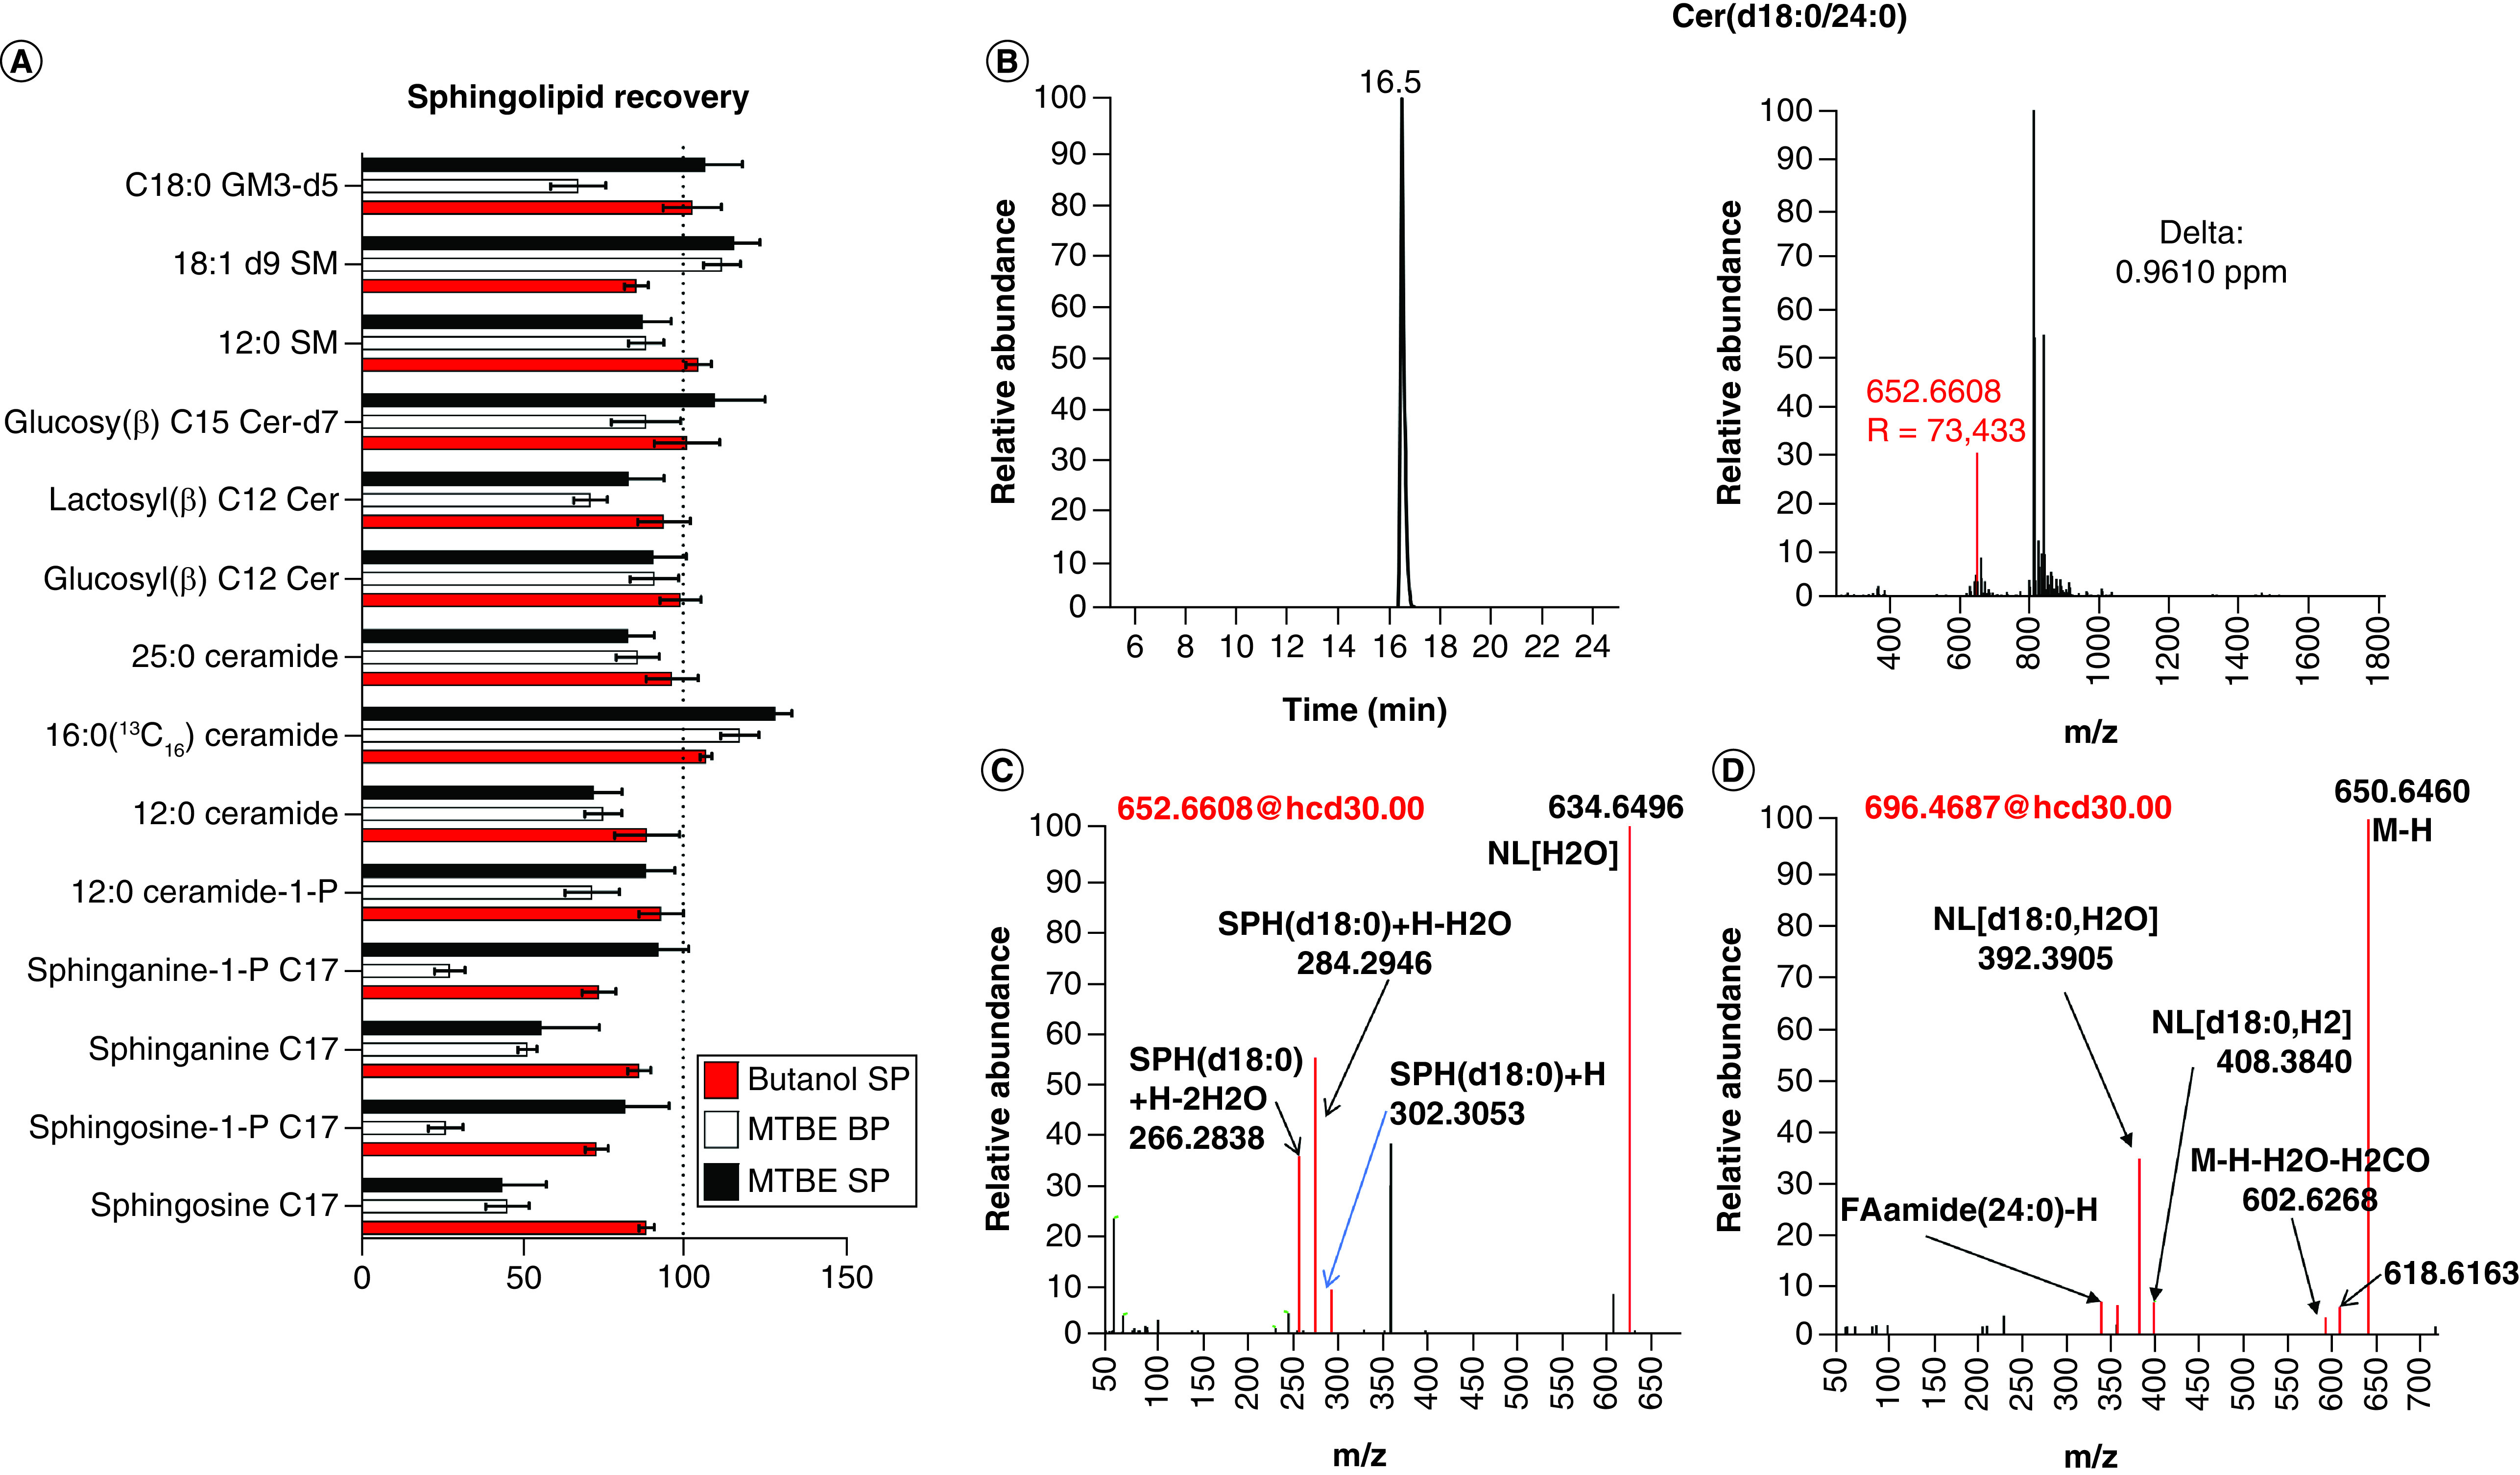
(A) Comparison of fortified recoveries of sphingolipids for three different extraction methods (butanol single phase, MTBE two phases and MTBE single phase). (B) The MS1 high resolution (R = 120,000) used for quantification of sphingolipids showed a high accuracy for Cer(d18:0/24:0). Both positive (C) and negative (D) mode are used for the structure elucidation of sphingolipid Cer(d18:0/24:0).
BP: Biphasic; Cer: Ceramides; M-H: Mass minus proton; NL: Neutral loss; MTBE: Methyl tert-butyl ether; SP: Single phase.
To accurately quantify the sphingolipids, we set the resolution of MS1 as high as 120,000@ m/z 200. This extreme high resolution can achieve a good accuracy with a mass error of less than 1 p.p.m. for most of sphingolipids (Figure 1B). Even for the GM3(d34:1), with m/z higher than 1000, the resolution at m/z 1153.7217 was 53,202 with mass accuracy around 1 p.p.m. (Supplementary Figure 1). We also acquired MS2 fragmentations using data-dependent acquisition (DDA) in both positive and negative mode (separately). The positive mode provided the polar lipid groups, such as SPH(d18:0) (Figure 1C), while the negative mode provided additional information about fatty acid chain length (Figure 1D). Combining the MS1 precursor with the MS2 fragments identification, we were able to positively identify all sphingolipid classes and a typical spectrum for each class is included in the Supporting information Supplementary Figures 2–6.
Alkaline hydrolysis improves the annotation of sphingolipids
Using DDA method, only the top 20 mass were selected for collision induced dissociation to acquire the MS2 fragments. The low abundance metabolites were not picked by the top 20 mass method, as it is very likely that they were masked by the high abundant phospholipids. Alkaline hydrolysis was previously used to eliminate abundant phospholipids and to facilitate the annotation and quantification of sphingolipids [28,29], comprehensive evaluation of the stability of sphingolipids under alkaline condition was rarely performed. We fortified the extraction solvent with different sphingolipid ISs and compared the peak intensity before and after alkaline hydrolysis (0.1 M KOH at 37°C for 45 min). Consistent with previous results, most of sphingolipids including ceramides, ceramide-1-P, hex-ceramides and sphingomyelins remained stable after alkaline hydrolysis (Figure 2A) [30]. Sphinganine and sphingosine levels significantly decreased after alkaline treatment, even if CH2Cl2/methanol was used for hydrolysis (data not shown) and their stability is worth investigating more.
Figure 2. . Alkaline hydrolysis facilitates the annotation of sphingolipids in whole blood.
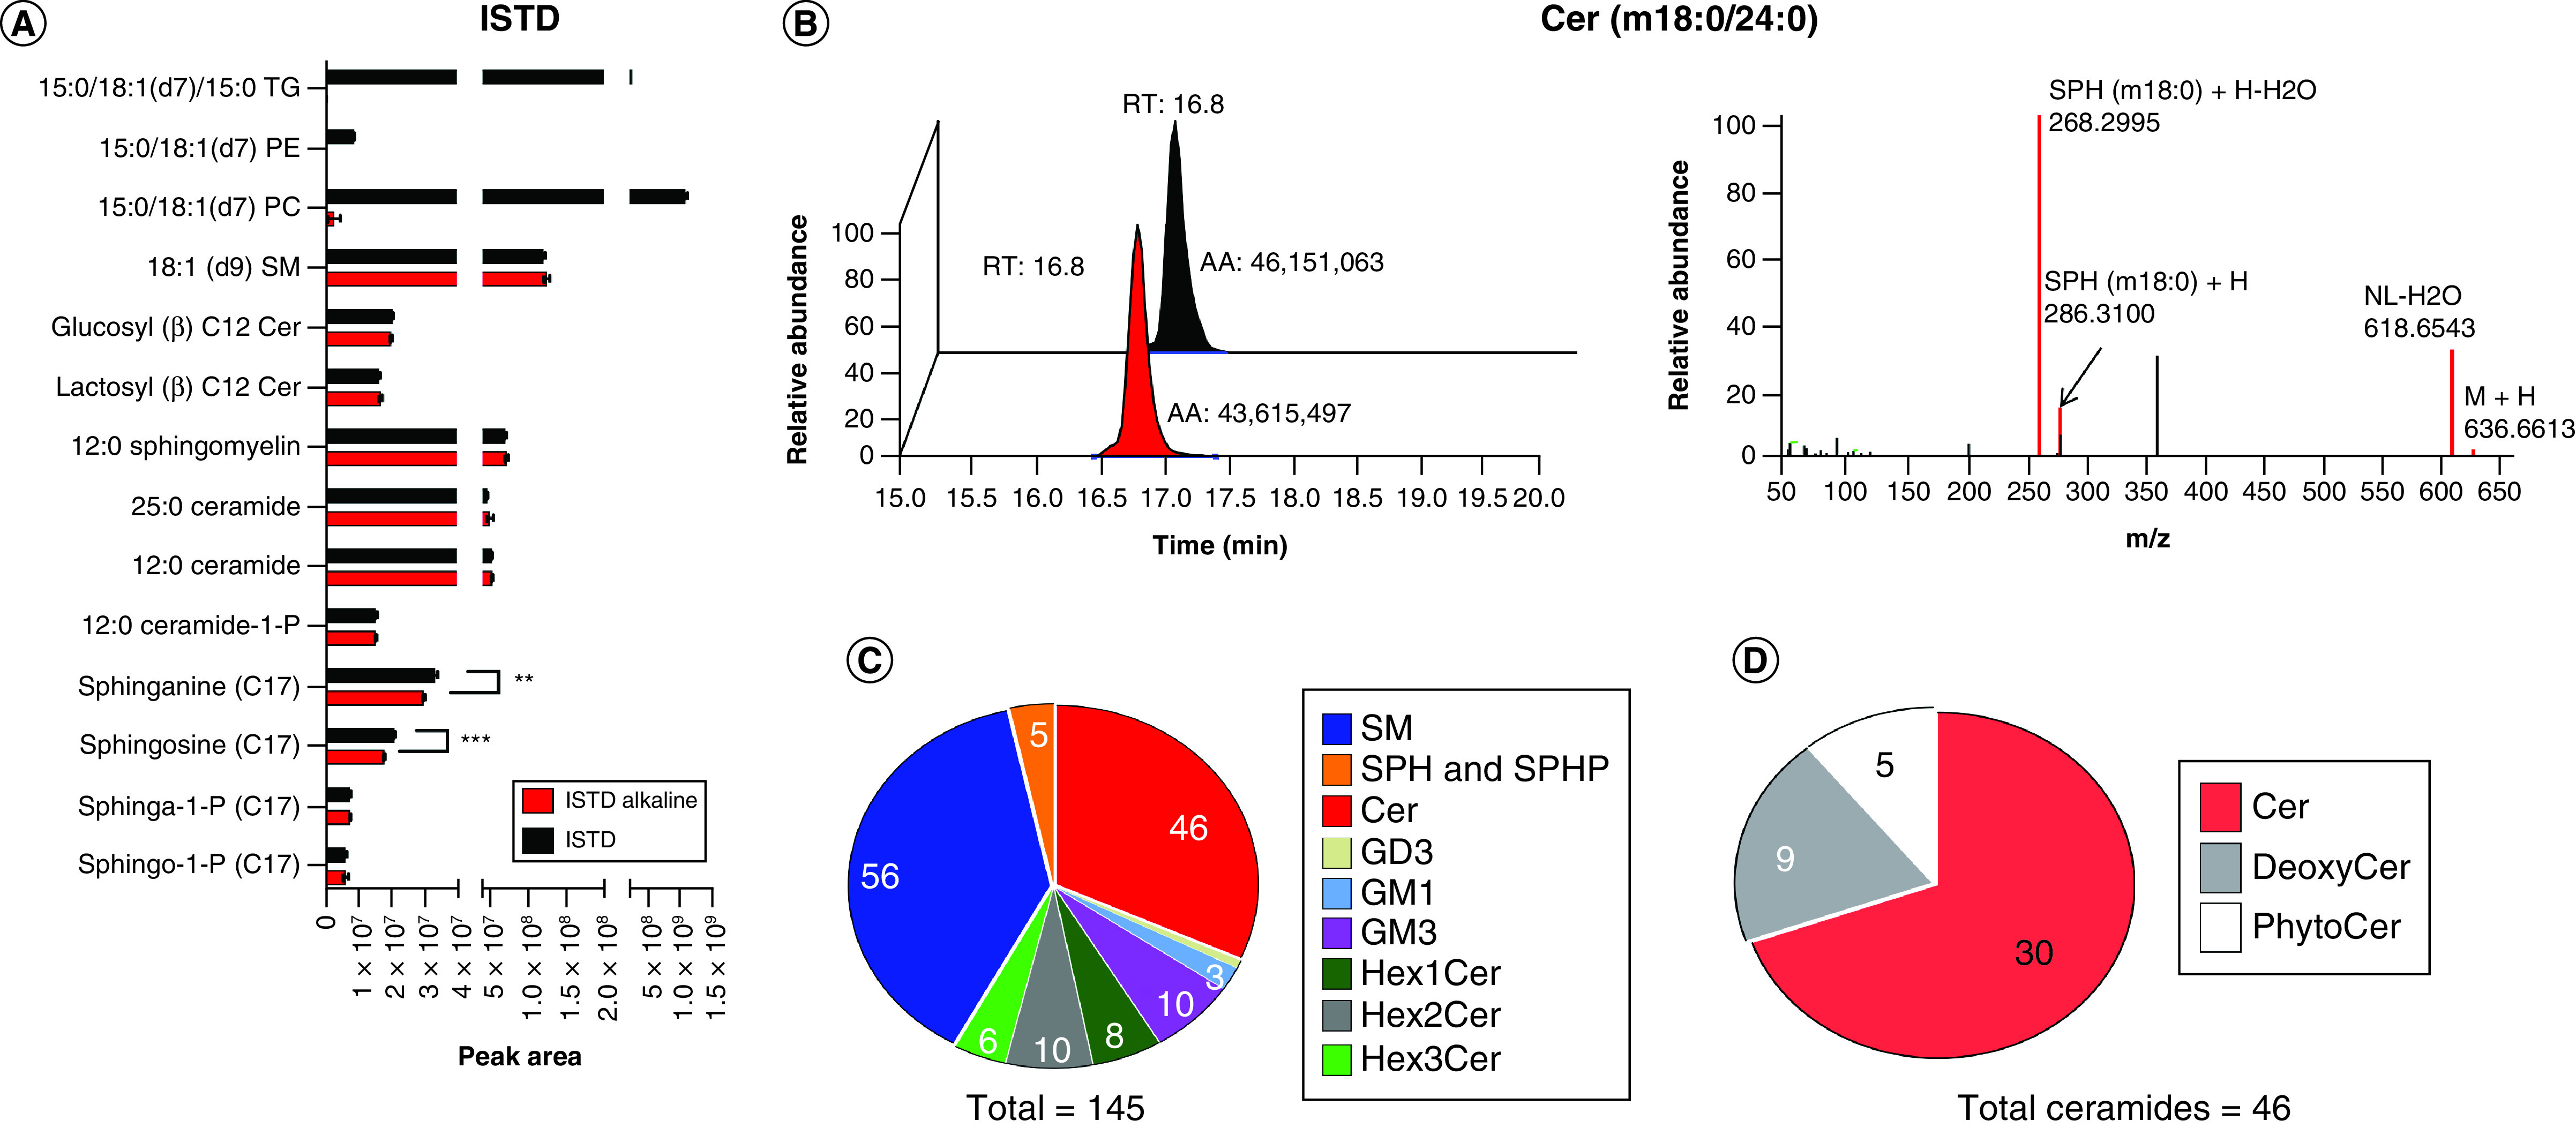
(A) The effects of alkaline hydrolysis (0.1 M KOH for 45 min) on intensities of sphingolipids, phospholipids and triglycerides. (B) The alkaline hydrolysis does improve the annotation but have no enhancement of intensity of Cer(m18:0/24:0) in DDA mode. (C) The annotated sphingolipids including Cer, ganglioside (GD3, GM1 and GM3), HexCer (Hex1Cer, Hex2Cer and Hex3Cer), SM, SPH and SPHP. (D) The annotated ceramides belong to three main subclasses: Cer, deoxyCer and phytoCer.
AA: Absolute area; Cer: Ceramides; DDA: Data-dependent acquisition; Hex: Hexosyl; ISTD: Internal standard; NL: Neutral loss; PC: Phosphatidylcholine; PE: Phosphatidylethanolamine; SM: Sphingomyelin; SPH: Sphingosine; SPHP: Sphingosine phosphate; TG: Triglycerol; RT: Retention time.
Alkaline hydrolysis facilitates the annotation of sphingolipids in WB in two different ways, similar to the case of plasma analysis [30]. First, it improves the annotation of sphingolipids by allowing for acquiring more MS2 fragmentation. For examples, Cer(m18:0/24:0) showed similar intensity before and after alkaline treatment, but only the alkaline treated samples showed the MS2 spectra (Figure 2B), which was annotated by LipidSearch with their product search strategy. Second, the alkaline treatment hydrolyzed most of the phosphorcholines (one of the best ionizing lipids that elute at similar retention times with most sphingolipids), so more sphingomyelins could be annotated based on their specific polar head fragment m/z 184.0732. Even combining this strategy with the HRMS, some of the fatty acid chains could not be completely annotated, and rather targeted strategies could be employed for those.
Combining the very high resolution for MS1 and the better MS2 fragmentation, obtained after alkaline hydrolysis, >140 sphingolipids were identified and annotated, including 46 ceramides (Figure 2C). The 46 ceramides belonged to three major classes: ceramides (30), deoxyceramides (nine) and phytoceramides (five) (Figure 2D).
Inclusion list-based PRM/DIA improves the annotation of isobaric subspecies of ceramides
Single-phase extraction combined with ddMS2 (DDA) annotated >140 sphingolipids, which was used to generate the inclusion list with scheduled scan windows (1 min), and the inclusion list was then used for PRM/DIA to resolve the isobaric subspecies of ceramides (Figure 3A). For examples, Cer(d44:1) was present as different subspecies in WB, and the high abundant form Cer(d18:1/26:0) could be detected and easily annotated in DDA mode, while the small peak from Cer(d19:1/25:0) was not completely elucidated. PRM/DIA with inclusion list could selectively fragment Cer(d19:1/25:0) to acquire its representative fragmentation SPH(d19:1), in either PRM (Figure 3B & C) or DIA mode (Supplementary Figure 7). Moreover, some co-eluting ceramide were partially separated with the aid of DIA or PRM. For examples, Cer(d18:1/24:2) and Cer(d18:2/24:1) eluted at very similar retention time, but based on their representative fragment one could partially distinguish the two subspecies (Figure 3D). Using inclusion list-based PRM and DIA, eight more ceramides and one more Hex1Cer were identified together with four Ceramide-1-P (Supplementary Figure 8). The final method identified 159 sphingolipids (Figure 3E) including 54 ceramides with different long-chain bases (d18:0, d18:1, d18:2, d19:1, d20:1, m18:0, m18:1, m19:0 and t18:0) (Figure 3F). To cross-check the annotated results, authentic standards were used for some sphingolipids to verify retention time and the MS2 spectra. These standards included Cer(d18:1/16:0), Cer(d18:0/16:0), Cer(d18:1/18:0), Cer(d18:0/18:0), Cer(d18:1/24:0), Cer(d18:0/24:0), Cer(d18:1/24:1), Cer(18:0/24:1), Cer(18:2/24:0), sphinganine, sphingosine, sphiganine-1-P, sphingosine-1-P, CerP(d18:1/24:0), SM(d18:1/16:0) and SM(d18:1/24:0).
Figure 3. . Inclusion list-based parallel reaction monitoring/data-independent acquisition improves the annotation of isobaric subspecies of ceramides.
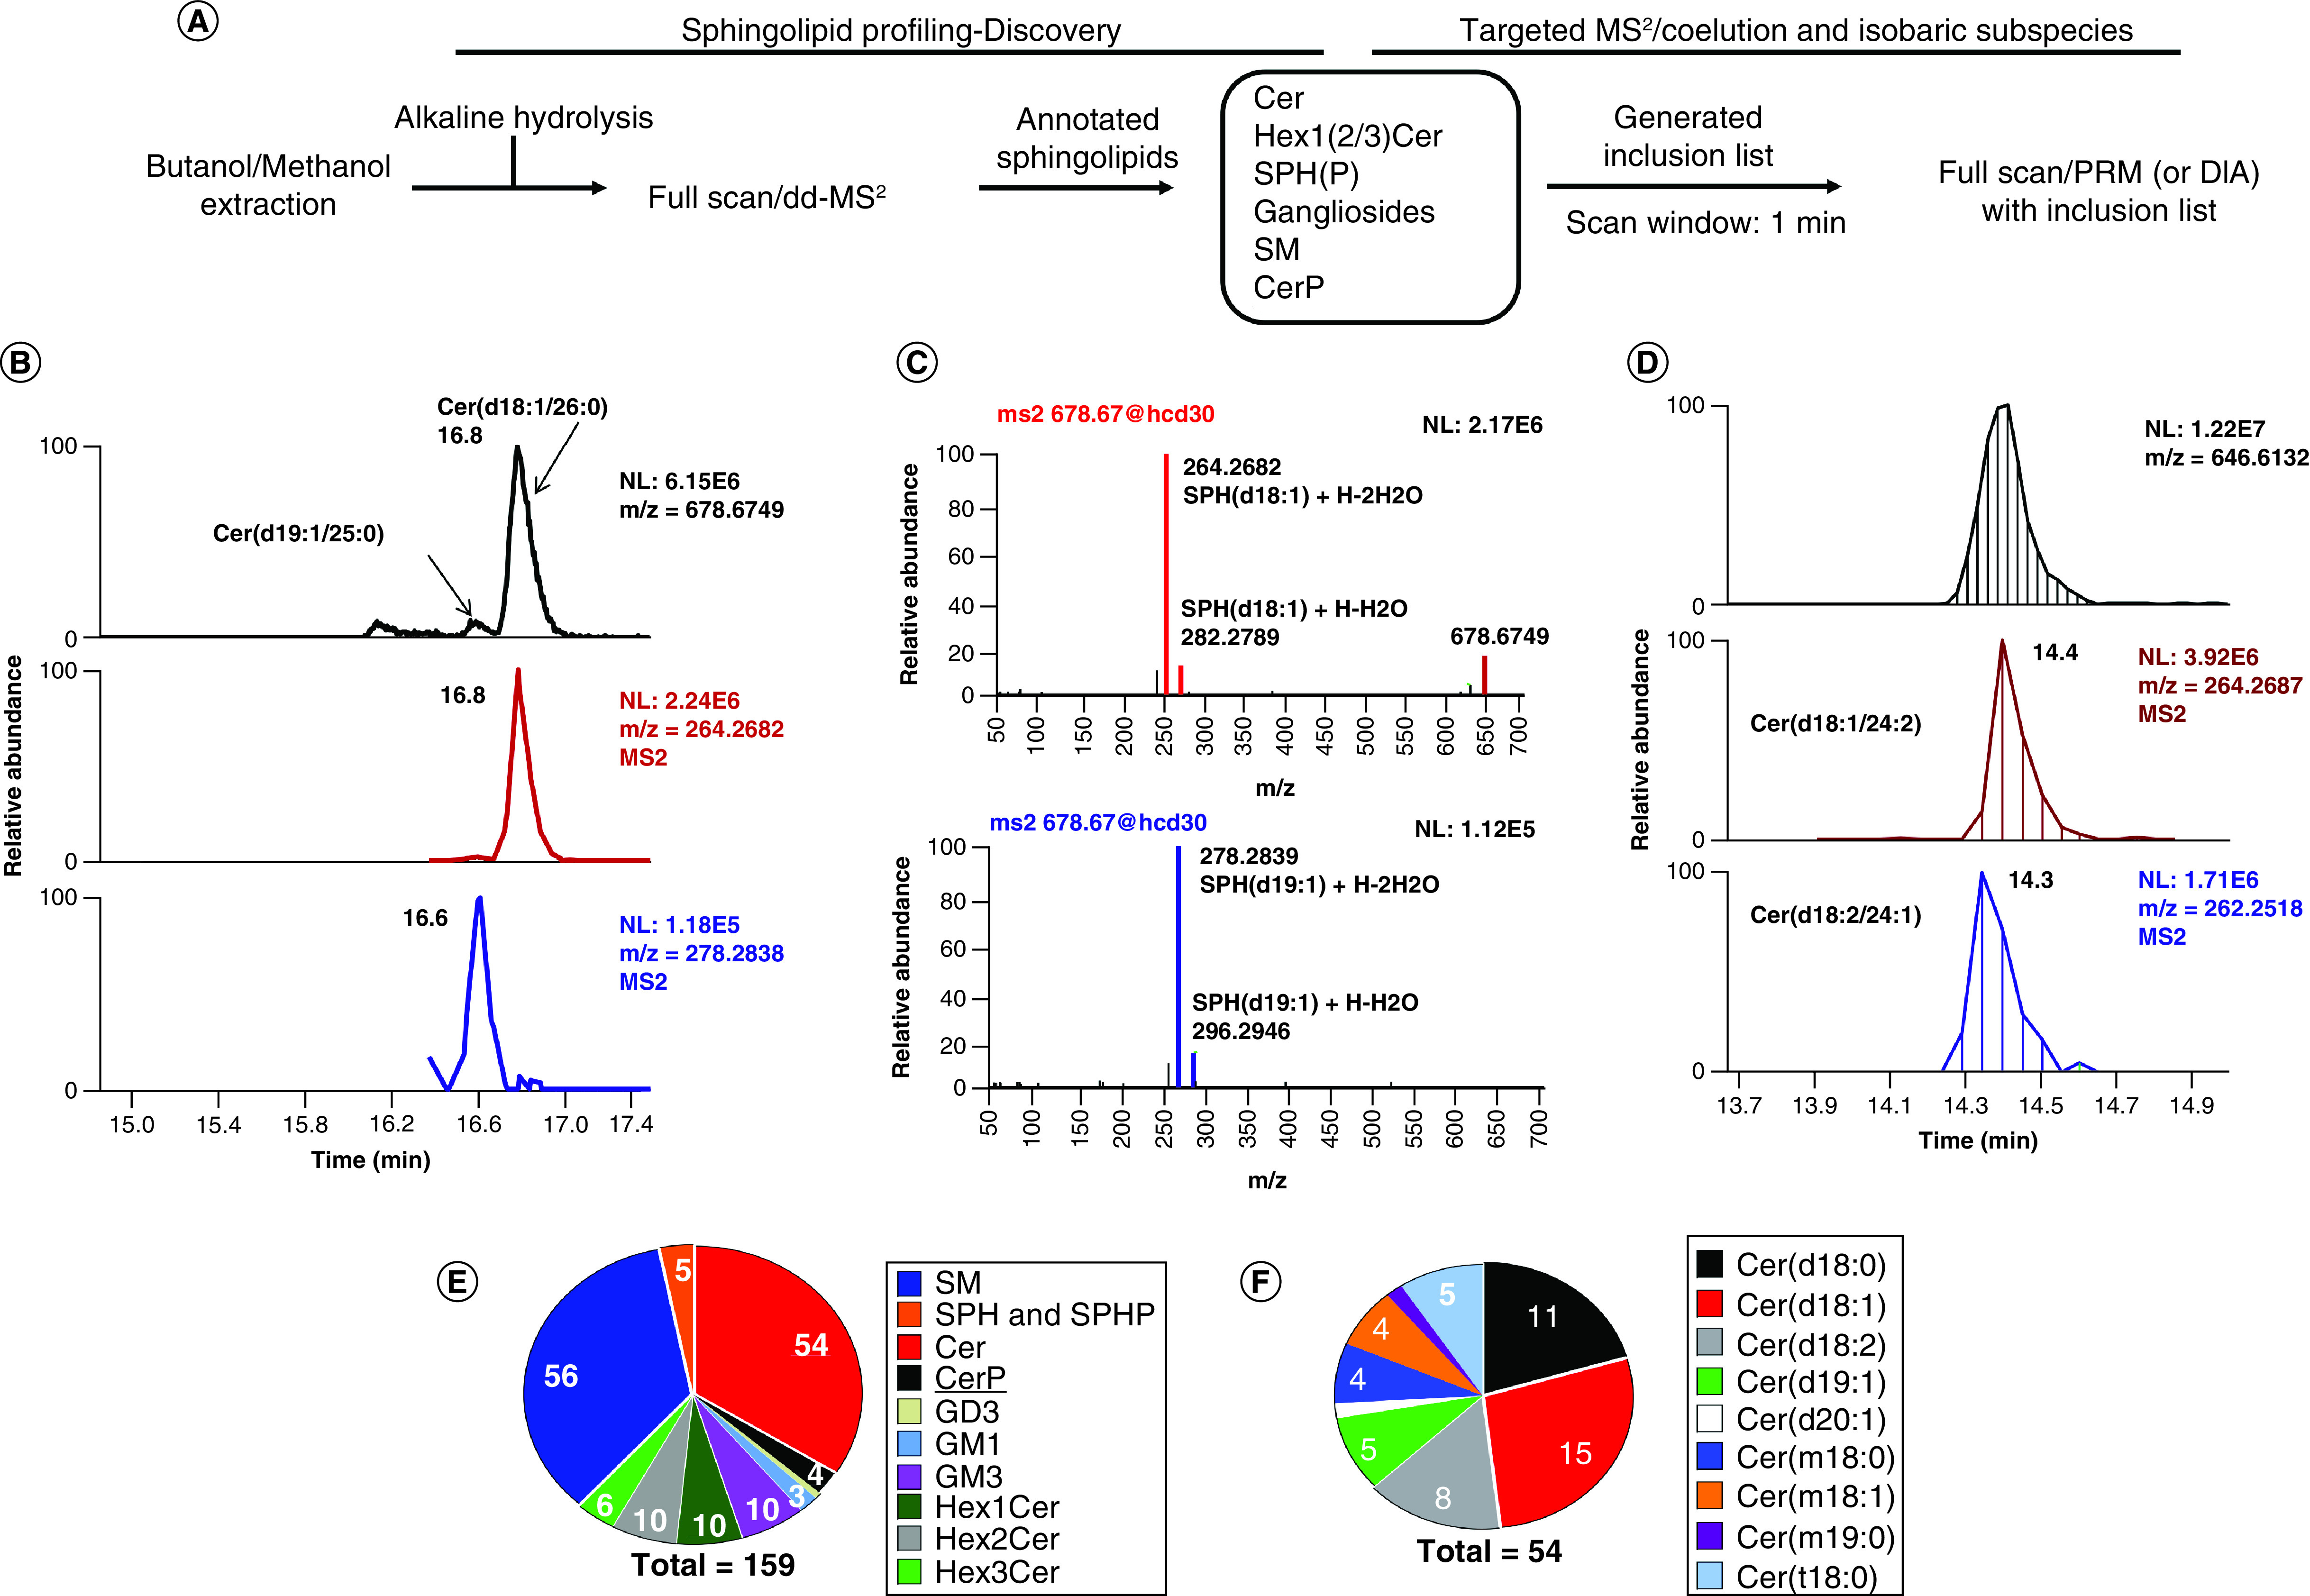
(A) The schematic graph for the strategy used for PRM/DIA analysis. (B) The isomers of Cer(d45:1) were annotated by PRM through acquiring the MS2 spectra of low abundant Cer(d19:1//25:0). (C) The MS2 spectra of Cer(d18:1/26:0) and Cer(d19:1/25:0) showed their representative fragments. (D) The co-eluted isomers Cer(d18:1/24:2) and Cer(d18:2/24:1) were separated by their representative fragments in DIA mode. (E) The final annotated sphingolipids improved by PRM/DIA, with 159 total sphingolipids. (F) The final annotated ceramides, 54.
Cer: Ceramides; DIA: Data-independent acquisition; GD: Ganglioside, disialo trihexosyl ceramide; GM: Ganglioside, monosialo trihexosyl ceramide; PRM: Parallel reaction monitoring; SM: Sphingomyelin; SPH: Sphingosine; SPHP: Sphingosine phosphate.
Compared with previous studies, the current methodology identified and quantified the most of ceramides (54), a number similar or higher when compared with targeted multiple reaction monitoring-based methods [23,31]. More importantly, the high resolution-DDA/DIA/PRM methods have a high accuracy, which will be superior to the targeted lipidomics. Our current LC method did not separate the GlcCer and GalCer as the aim of this study was the reduction of matrix effect. Their separation would involve a simple rerun with a different LC method as reported before.
Appropriate ISs corrections eliminate matrix effects & achieve high dynamic linearities
Matrix effects [32] have been observed in LC–MS methods with a dramatic loss in response (ion suppression) for higher volumes of WB. Figure 4A shows the Cer(d18:1/24:1) peak intensities from different volumes of WB. When the volume of blood is >50 μl, the peak response versus volume is not linear anymore. To eliminate the matrix effects that would interfere with quantification, we tested the ability of the ISs from the Cer/Sph Mix I (commercially available from Avanti), as the normalization factor for each class. For ceramides, both Cer (d18:1/12:0) and Cer (d18:1/25:0) were compared. Cer (d18:1/12:0) normalization corrected the response due to the ion suppression for most of (dihydro)ceramides, while 25:0 ceramide had no significant improvement (Figure 4B) (R2 0.99 vs R2 0.88). This may be due to the fact that Cer (d18:1/25:0) has a relative high abundance in plasma (around 0.2 μM). After normalization with Cer (d18:1/12:0), most of the ceramides achieved good linearities with R2 >0.98 (Supplementary Figures 9 & 10). The 17-base sphingosine phosphate (SPHP) showed a good normalization for SPHP (Supplementary Figure 11). Normalization of the hexosyl-ceramides with Hex1Cer(d18:1/12:0) could not minimize the matrix effect for Hex1Cer (Figure 4C, middle panel). Normalization of the SM (d34:1) peak area with the SM (d18:1/12:0) from the Cer/Sph Mix I (Figure 4D, middle panel) looked even worse compared with the peak area without normalization. To correct for these limitations, we added other stable isotope ISs to correct for some classes: gangliosides (added C18:0 GM3-d5), Hex-Cer (added Hex1Cer(d18:1-d7/15:0)) and SM (added SM(d18:1/18:1-d7)). Hex1Cer(d18:1-d7/15:0) normalization improved the linearity of most of hex-ceramides with R2 >0.98 (Figure 4C & Supplementary Figures 12–14). SM(d18:1/18:1-d7) and C18:0 GM3-d5 were able to minimize the matrix effects for most of SM (Figure 4D & Supplementary Figure 15) and gangliosides (Supplementary Figure 16). In conclusion, by selecting the appropriate ISs for normalization for each class, including added labeled standards like SM(d18:1/18:1-d7), Hex1Cer(d18:1-d7/15) and 18:0 GM3-d5, the matrix effects were minimized, and high dynamic linearity was achieved.
Figure 4. . Appropriate internal standard corrections eliminate matrix effects & achieve high dynamic linearities between peak intensity & whole blood volume.
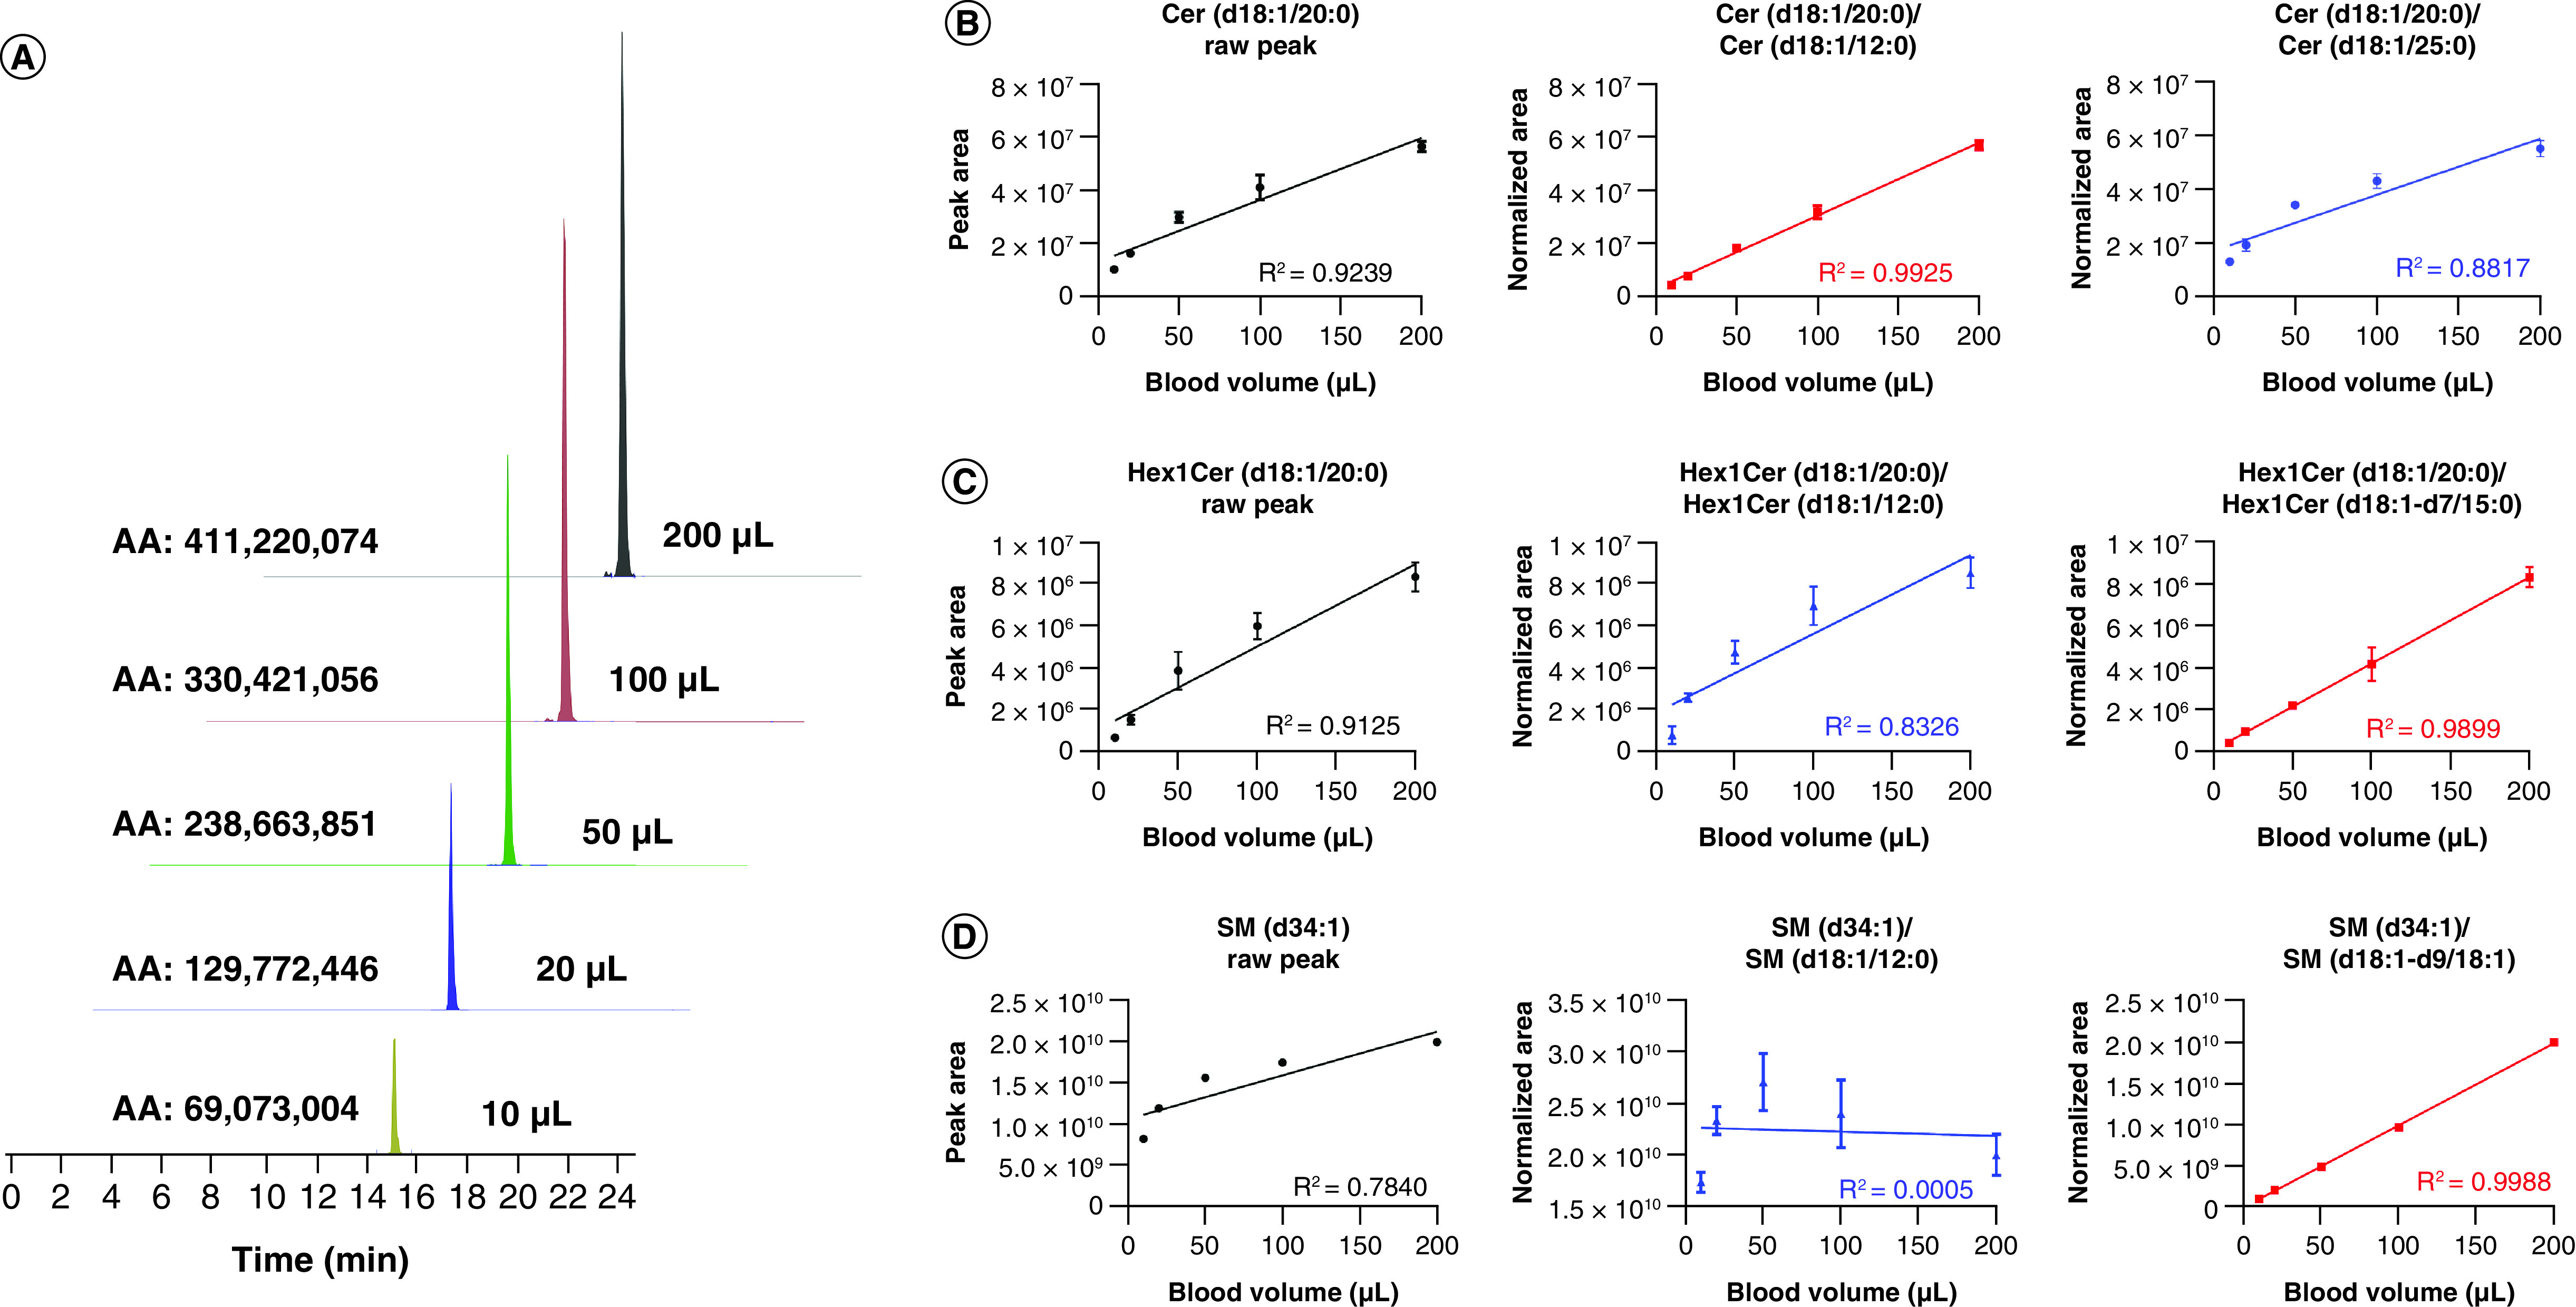
(A) Correlation between peak intensity and blood volume, shows big matrix effects for high volumes of blood. (B) Comparison of the raw peak intensity or normalized intensity (internal standard 12:0 ceramide or 25:0 ceramide) of Cer(d18:1/20:0), and their linearities against blood volume. (C) Comparison of the raw peak intensity or normalized intensity (internal standard 12:0 Hex1Cer or C15 Hex1Cer-D7) of Hex1Cer(d18:1/20:0), and their linearities against blood volume. (D) Comparison of the raw peak intensity or normalized intensity (internal standard 12:0 SM or 18:1 d9 SM) of SM(d34:1), and the linearity against blood volume.
Cer: Ceramide; Hex: Hexosyl; SM: Sphingomyelin.
Freeze–thaw cycle will not influence the stability of sphingolipids
One disadvantage that could restrict the potential widespread application of WB in clinical metabolomics or lipidomics is the stability of metabolites in WB, which may be impacted by the enzymatic activity induced by the cell lysis during the freeze–thaw cycle. Previous studies have reported some metabolites such acetyl-CoA may encounter dramatic loss during the thawing process [6]; however, no data about the stability of sphingolipids in WB have been reported so far. Most of sphingolipids have been reported stable in plasma or serum at low temperatures [33]. One study reported that ceramides could be stable at room temperature for 8h [34]. To test the freeze–thaw stability of sphingolipids in WB samples, sphingolipids extracted from fresh collected WB (within 1 h after blood draw) were compared with the sphingolipid levels after 24h freeze (at -80°C) and freeze–thaw in ice (Figure 5A). Surprisingly, the major sphingolipids including SPHP, ceramides, Hex-ceramides and sphingomyelins showed no significant decrease after freeze or the freeze–thaw cycle (Figure 5B). These results demonstrated that WB could be directly used for the sphingolipidome analysis.
Figure 5. . Freeze–thaw cycle does not influence the intensity of sphingolipids in whole blood.
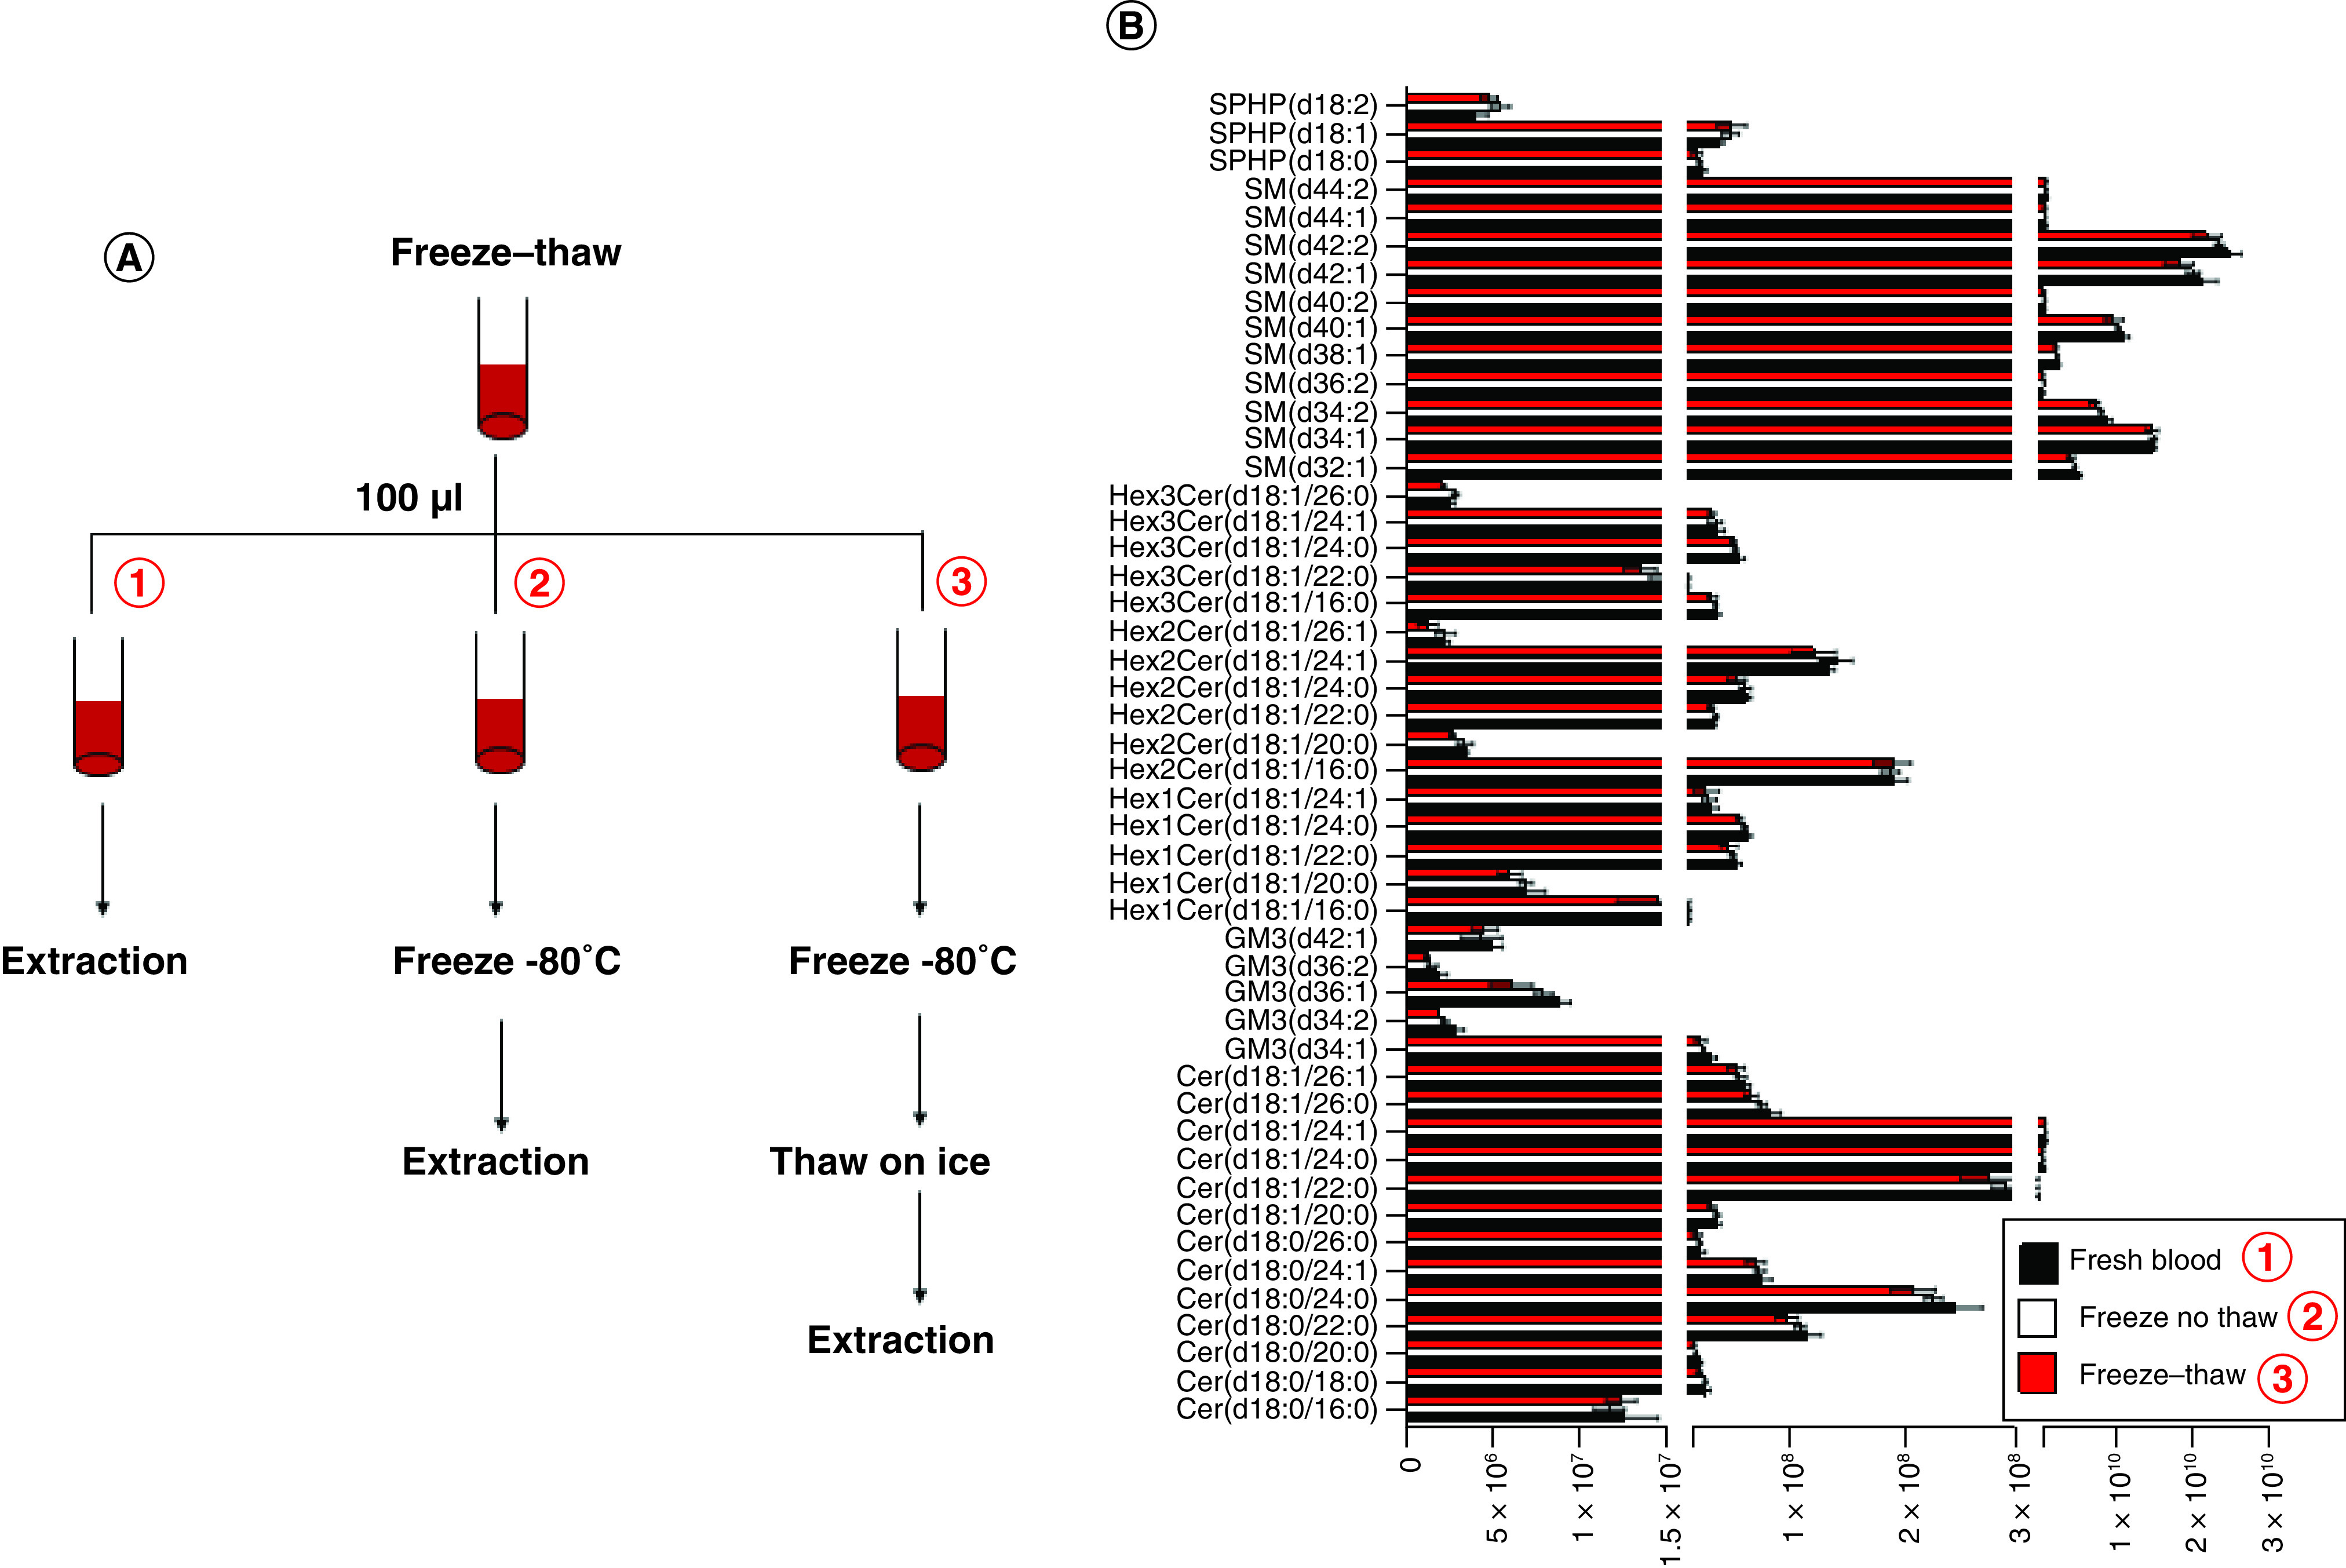
(A) Schematic diagram of freeze–thaw experiment for sphingolipid stability in whole blood. (B) Comparison of the peak intensities of major sphingolipids in fresh blood and freeze–thawed blood.
Cer: Ceramides; SM: Sphingomyelin; SPHP: Sphingosine phosphate.
WB is richer in sphingolipids when compared with paired plasma
The sphingolipidome analysis of ten WB samples and ten paired plasma samples from healthy donors was performed based on the single-phase extraction coupled with the LC–HRMS method developed for the analysis of the WB sphingolipids. Compared with plasma, WB contained higher levels of ceramides (Figure 6A). The total concentration of ceramides in WB is nearly twofold of that in plasma (Figure 6B). The gangliosides GD3 and GM1 were higher in WB, while gangliosides GM3 were higher in plasma (Figure 6A), which led to no significant difference of total gangliosides between WB and paired plasma (Figure 6B). For glycosylceramides, Hex1Cer (glucosylceramide and galactosylceramide) were lower in WB than paired plasma, while Hex2Cer and Hex3Cer were dramatically higher in WB, especially for Hex2(3)Cer(d18:1/26:0) and Hex2(3)Cer(d18:1/26:0) that were barely detected in plasma samples (Figure 6A & B). Sphingomyelins were the most abundant sphingolipids either in WB or plasma, but the WB has a much higher level of sphingomyelins (Figure 6A & B). SPHP especially sphingosine-1-P are important small bioactive molecules, and both SPH an SPHP were two- to three-times higher in WB than paired plasma (Figure 6A & B). Ceramide-1-P, another class of bioactive sphingolipids, also showed higher levels in WB, and not all of the plasma samples had detectable levels of ceramide-1-P.
Figure 6. . Whole blood & paired plasma sphingolipidome comparison showed higher abundance sphingolipids in whole blood.
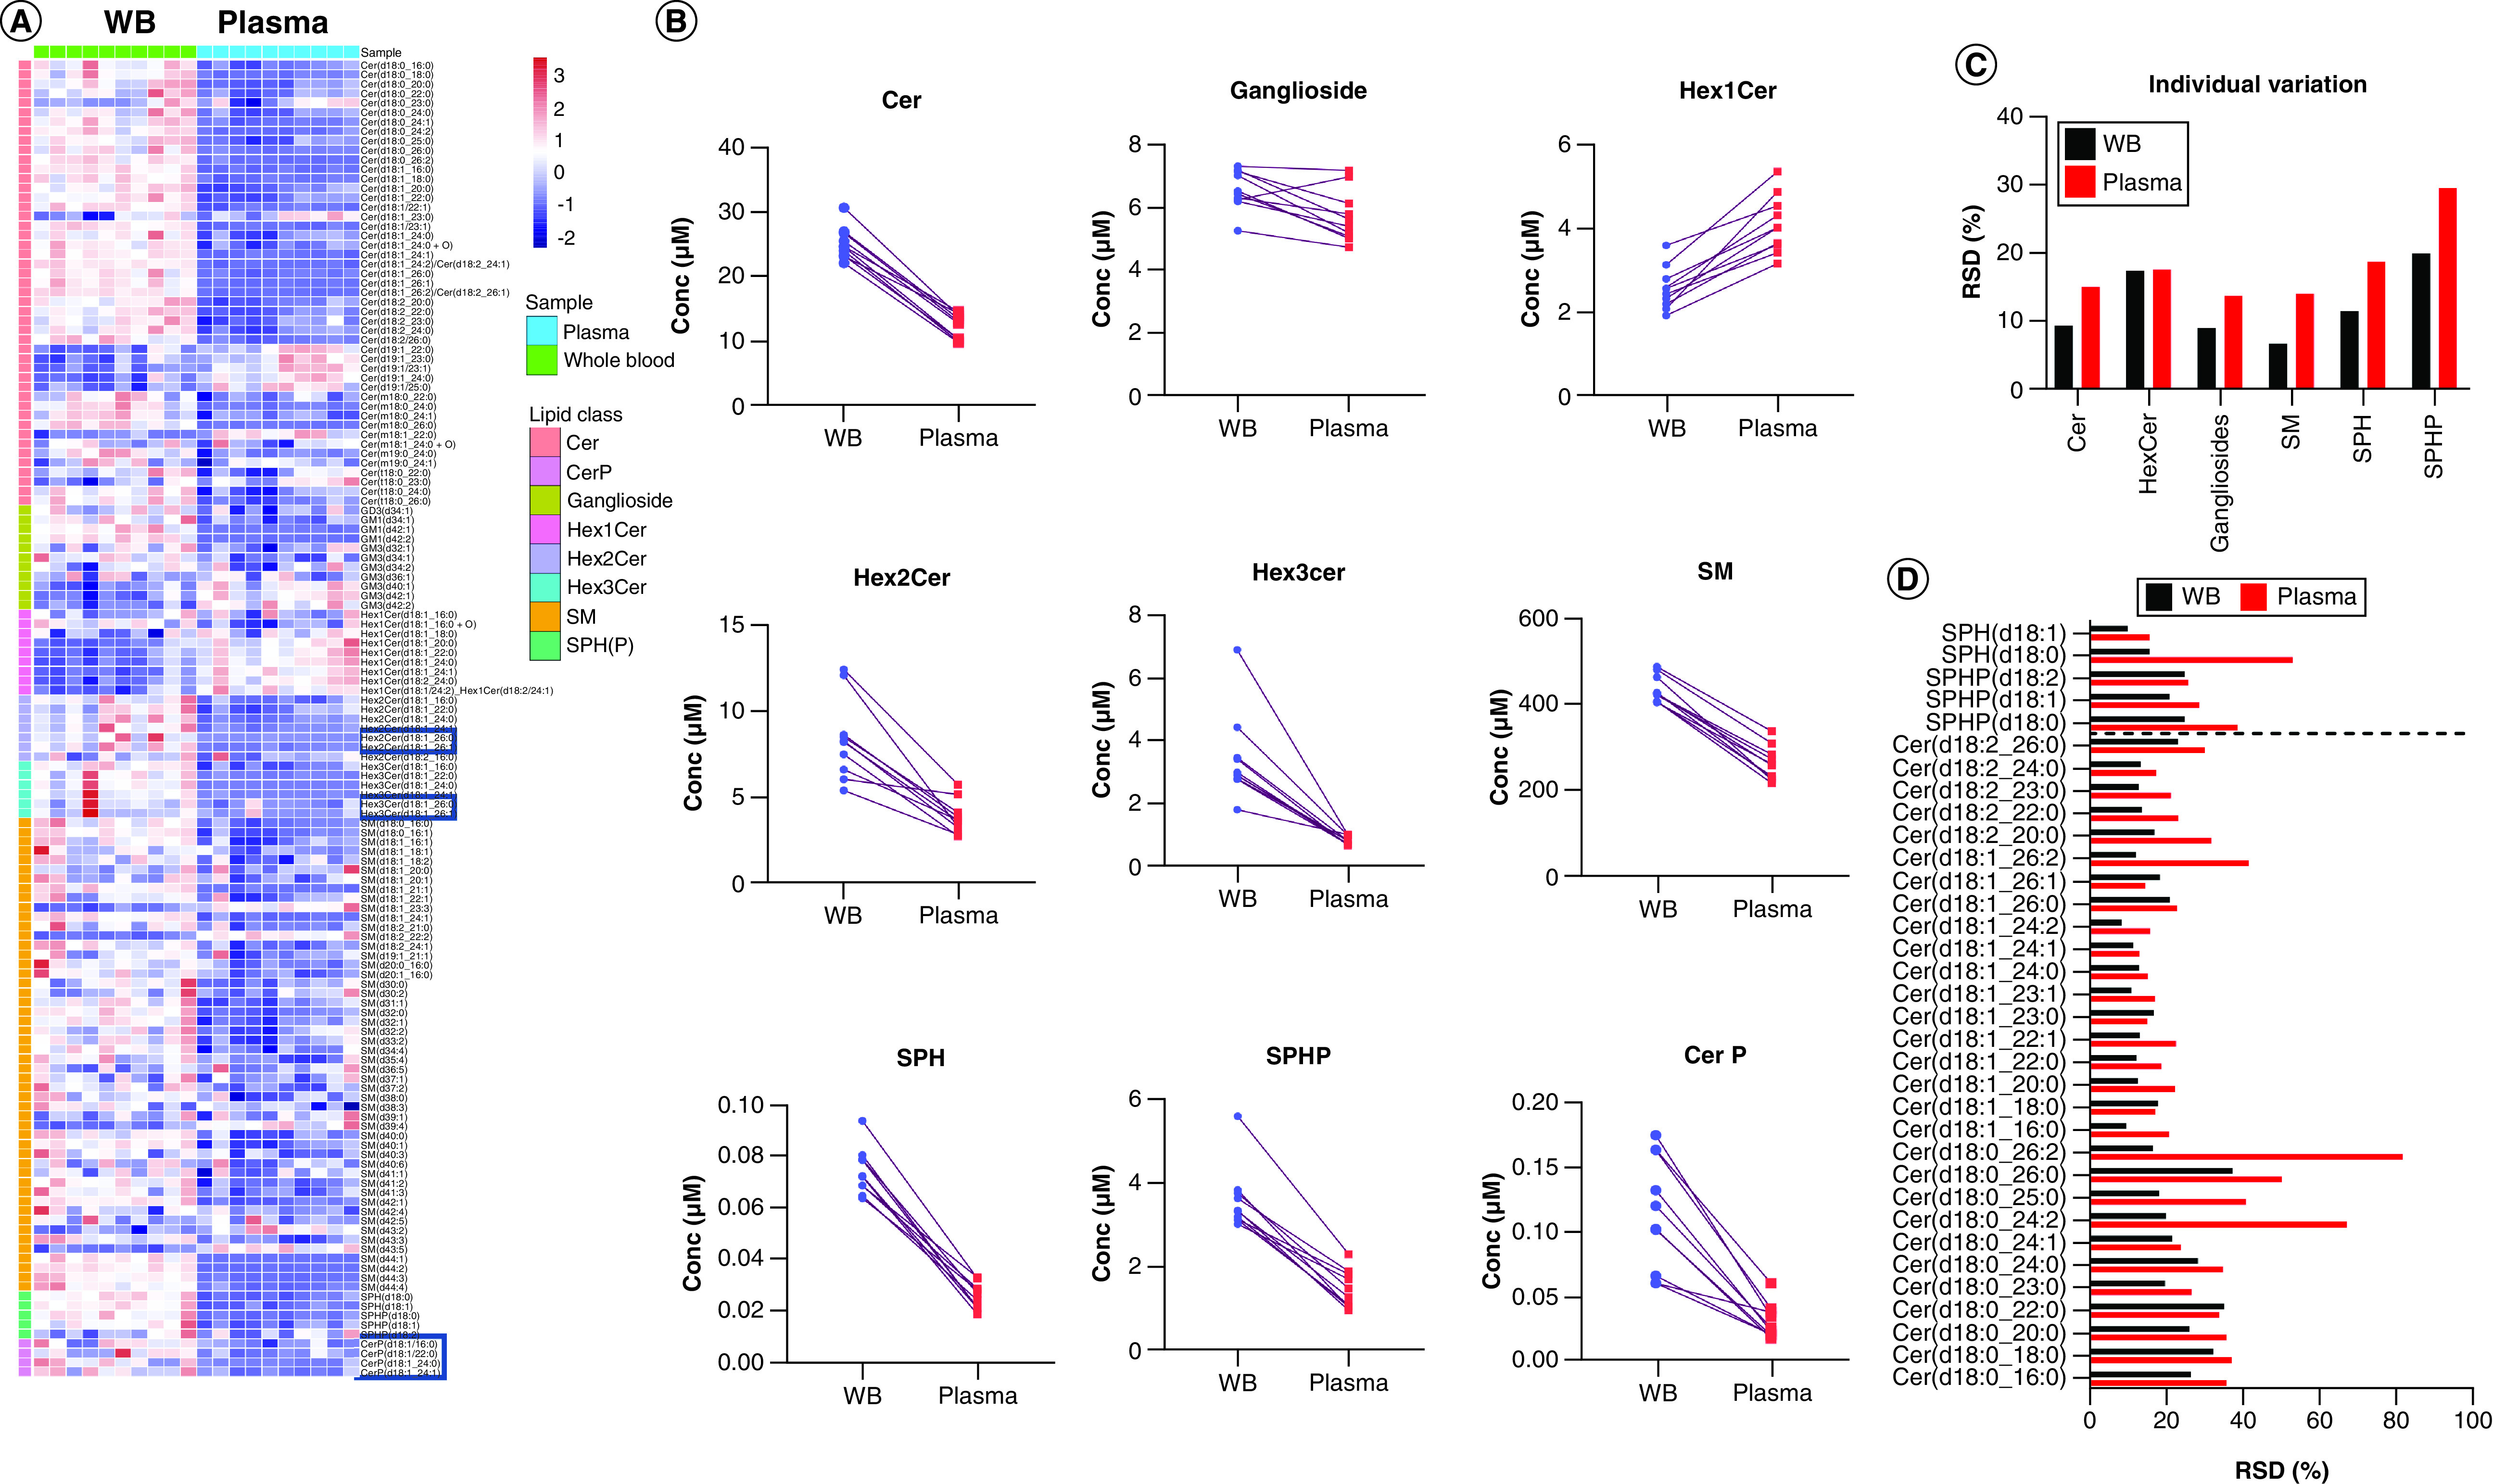
(A) The heatmap showed the comparison of major sphingolipids including Cer, CerP, ganglioside, Hex1Cer, Hex2Cer, Hex3Cer, SM and SPHP between 50 μl WB and paired plasma from healthy donors. Hex2Cer, Hex3Cer and CerP were ND in some plasma samples (labeled in heatmap) and the ND was replaced by half of the values of paired whole blood samples. (B) The total concentration of respective sphingolipid class in WB and paired plasma. (C) The individual variations of sphingolipid levels in ten whole blood and ten plasma samples. (D) The individual variations of levels of ceramides, SPH and SPHP in ten whole blood and ten plasma samples.
Cer: Ceramides; CerP: Ceramide-1-phosphate; Hex: Hexosyl; ND: Not detected; SM: Sphingomyelin; SPH: Sphingosine; SPHP: Sphingosine phosphate; WB: Whole blood.
Discussion
Except for Hex1Cer and gangliosides, WB has a higher concentration of sphingolipids, including the major species ceramide, CerP, Hex2Cer, Hex3Cer, SM, SPH and SPHP.
Apart from containing a higher abundance of sphingolipids, WB also showed advantages in the reducing variance of sphingolipid levels in the ten paired samples. For most of sphingolipids, with only the exception for HexCer, lower values of individual variations (RSD) were observed for WB in comparison with plasma (Figure 6C). Specifically, some lower levels of sphingolipids such as sphinganine, Cer(d18:0/24:2), Cer(d18:0/26:2) and Cer(d18:1/26:2), showed much lower RSDs in WB compared with plasma, which may be due to the increased intensity for each of these species and the reduced variability due to the reduced steps necessary for the processing of WB versus plasma.
One aspect that needs to be considered when using the volume of WB for analysis is the hematocrit – it measures the volume of RBC compared with the total blood volume (RBC, white blood cells, platelets and plasma). The normal hematocrit for men is 40–54% and for women it is 36–48%. The hematocrit is known to vary with the level of hydration, similar with the plasma concentrations. Correction for the hematocrit bias in dried blood spot was detailed before [35] and the hematocrit levels can be easily obtain from the hemoglobin levels using formula hematocrit (HCT)=2.941*hemoglobin concentration g/dl [36]. Hemoglobin is routinely measured using the Darbkin reagent and UV detection, using only 10 μl of frozen WB [37]. Therefore, pairing WB lipidomics with hemoglobin measurements will allow a simple calculation of the sphingolipids levels in erythrocytes, as was shown before for other metabolites from RBC [38].
In conclusion, in this study, we developed a comprehensive and robust method for WB sphingolipidome profiling by combing single-phase extraction, alkaline hydrolysis, appropriate ISs correction and ultrahigh resolution (R=120,000) mass spectrometry with multiple fragmentation strategies (DDA/PRM/DIA). Our results demonstrated that a single freeze–thaw process will not impact the stability of the sphingolipids in WB, implying that WB could be used for sphingolipid research. Comparison between WB and paired plasma from healthy controls indicated that WB had higher sphingolipids abundance than the corresponding plasma, and WB showed much smaller individual variations in sphingolipid levels than plasma. In total, these results indicated that WB is a better alternative of plasma to guide sphingolipid biomarker discovery in clinical research, especially given the low volume of blood that could be used. The LOQ for all the sphingolipids investigated here allows the use of only 10-μl WB. A recent study looking at the basal lipids level in healthy volunteers over a 6 weeks period in plasma and erythrocytes reported that reproducibility in ceramides, diacylglycerols and sphingomyelins was better in erythrocytes [39]. To reduce any artifacts that could results from erythrocytes isolation, our study investigated the best protocol to use WB, by using the minimum volume necessary for accurate quantification and the relevant ISs for normalization. We will move next to a case–control study of a particular disease to show the utility of this new approach.
Future perspective
In order to be able to measure lipid biomarkers with high reproducibility, variability should be reduced as much as possible at every step. The use of the WB will reduce the variability of plasma collection, when there is no precise line between the buffy coat and plasma. This will be particularly useful for studies where a limited volume of blood can be drawn at one time. The use of WB could also speed up the blood collection, as the tubes could be placed in dry ice as soon as couple of minutes after the blood draw. After determining the corresponding ISs, WB volume and freeze–thaw stability, we plan to investigate in further studies the contribution of each component of the WB (RBC, white blood cells and platelets) to the total blood sphingolipidome.
Ceramides have been reported as promising biomarkers of cardiac events [40,41] and other pathologies as well [42], but their plasma concentrations vary depending on diet, time of day and other factors [34]. The RBC have a half-life of approximately 120 days, so RBC sphingolipid measurements could reflect the average levels during the prior 4 months, which could be a better measure of the absolute sphingolipids levels than the fluctuating ones from plasma. Recent results suggested that sphingolipids overload in RBCs could occur during erythropoiesis [43]. As such the use of WB could become the standard for biomarkers identification, especially with the increase availability of LC–MS platforms with higher and higher sensitivity.
Summary points.
Materials & methods
Different extraction methods for sphingolipids analysis from whole blood (WB) were tested.
WB sphingolipidome was compared with plasma from the same individuals.
Results
A single-phase extraction method assisted by alkaline hydrolysis was used for sphingolipids extraction from WB.
Sphingolipids analysis using LC–high-resolution mass spectrometry (R = 120,000), parallel reaction monitoring/data-independent acquisition, allowed quantification of more than 150 sphingolipids.
When no isotopically labeled internal standard (IS) are available for each metabolite, the choice of an IS needs to be tested for each metabolite. Appropriate ISs corrections eliminate matrix effects and achieve high dynamic linearities.
Most of sphingolipids remained stable after a freeze–thaw cycle.
Individual variations in the levels of sphingolipids were lower for WB than plasma.
Acknowledgments
We thank I Blair for providing unlimited access to the use of LC–HRMS. We thank L Hauser for the blood draw from all the heathy controls.
Footnotes
Supplementary data
GM3(d34:1) MS1 spectra; Ceramide MS2 spectra; Hex-ceramide MS2 spectra; Sphingosine-1-P MS2 spectra; SM MS2 spectra; GM3(d34:1) MS2 spectra; Cer(d19:1/25:0)/Cer(d18:1/26:0) in DIA mode; CerP MS2 spectra; linearities of ceramide against blood volume; linearities of dihydroceramides against blood volume; linearities of SPHP against blood volume; linearities of Hex1Cer against blood volume; linearities of Hex2Cer against blood volume; linearities of Hex3Cer against blood volume; linearities of SM against blood volume; linearities of GM3 against blood volume; Cer/Sph mixture I. To view the supplementary data that accompany this paper please visit the journal website at: https://www.future-science.com/doi/suppl/10.4155/bio-2021-0098
Financial & competing interests disclosure
This work was supported by the NIH grants R21NS116315 and P30ES013508. The authors have no other relevant affiliations or financial involvement with any organization or entity with a financial interest in or financial conflict with the subject matter or materials discussed in the manuscript apart from those disclosed.
No writing assistance was utilized in the production of this manuscript.
Ethical conduct of research
The study was conducted according to the guidelines of the Declaration of Helsinki, and approved by the Institutional Review Board of Children’s Hospital of Philadelphia (protocol code IRB 01-002609 and date of approval 12-09-2020). Informed consent was obtained from all subjects involved in the study.
Data availability statement
Data are contained within the article or supplementary material. All the raw datasets are available on request from the corresponding author.
Open access
This work is licensed under the Attribution-NonCommercial-NoDerivatives 4.0 Unported License. To view a copy of this license, visit Attribution-NonCommercial-NoDerivatives 4.0 Unported License
References
Papers of special note have been highlighted as: • of interest; •• of considerable interest
- 1.Nagana Gowda GA, Raftery D. Whole blood metabolomics by (1)H NMR spectroscopy provides a new opportunity to evaluate coenzymes and antioxidants. Anal. Chem. 89(8), 4620–4627 (2017). [DOI] [PMC free article] [PubMed] [Google Scholar]
- 2.Stringer KA, Younger JG, McHugh C et al. Whole blood reveals more metabolic detail of the human metabolome than serum as measured by 1H-NMR spectroscopy: implications for sepsis metabolomics. Shock 44(3), 200 (2015). [DOI] [PMC free article] [PubMed] [Google Scholar]
- 3.Catalán Ú, Rodríguez M-Á, Ras M-R et al. Biomarkers of food intake and metabolite differences between plasma and red blood cell matrices; a human metabolomic profile approach. Mol. Biosyst. 9(6), 1411–1422 (2013). [DOI] [PubMed] [Google Scholar]
- 4.Chaleckis R, Murakami I, Takada J, Kondoh H, Yanagida M. Individual variability in human blood metabolites identifies age-related differences. Proc. Natl Acad. Sci. USA 113(16), 4252–4259 (2016). [DOI] [PMC free article] [PubMed] [Google Scholar]
- 5.Chaleckis R, Ebe M, Pluskal T, Murakami I, Kondoh H, Yanagida M. Unexpected similarities between the Schizosaccharomyces and human blood metabolomes, and novel human metabolites. Mol. Biosyst. 10(10), 2538–2551 (2014). [DOI] [PubMed] [Google Scholar]
- 6.Speziale R, Montesano C, De Leonibus ML et al. Determination of acetyl coenzyme A in human whole blood by ultra-performance liquid chromatography-mass spectrometry. J. Chromatogr. B Analyt. Technol. Biomed. Life Sci. 1083, 57–62 (2018). [DOI] [PubMed] [Google Scholar]
- 7.Song J, Liu X, Wu J et al. A highly efficient, high-throughput lipidomics platform for the quantitative detection of eicosanoids in human whole blood. Anal. Biochem. 433(2), 181–188 (2013). [DOI] [PubMed] [Google Scholar]
- 8.Marasca C, Arana MEB, Protti M, Cavalli A, Mercolini L, Armirotti A. Volumetric absorptive microsampling of blood for untargeted lipidomics. Molecules 26(2), 262 (2021). [DOI] [PMC free article] [PubMed] [Google Scholar]
- 9.Lu WH, Chiu HH, Kuo HC, Chen GY, Chepyala D, Kuo CH. Using matrix-induced ion suppression combined with LC–MS/MS for quantification of trimethylamine-N-oxide, choline, carnitine and acetylcarnitine in dried blood spot samples. Anal. Chim. Acta. 1149, 338214 (2021). [DOI] [PubMed] [Google Scholar]
- 10.Gao F, McDaniel J, Chen EY et al. Dynamic and temporal assessment of human dried blood spot MS/MS(ALL) shotgun lipidomics analysis. Nutr. Metab. (Lond.) 14, 28 (2017). [DOI] [PMC free article] [PubMed] [Google Scholar]
- 11.Aristizabal Henao JJ, Metherel AH, Smith RW, Stark KD. Tailored extraction procedure is required to ensure recovery of the main lipid classes in whole blood when profiling the lipidome of dried blood spots. Anal. Chem. 88(19), 9391–9396 (2016). [DOI] [PubMed] [Google Scholar]
- 12.Kondoh H, Kameda M, Yanagida M. Whole blood metabolomics in aging research. Int. J. Mol. Sci. 22(1), 175 (2020). [DOI] [PMC free article] [PubMed] [Google Scholar]
- 13.Lahiri S, Futerman AH. The metabolism and function of sphingolipids and glycosphingolipids. Cell. Mol. Life Sci. 64(17), 2270–2284 (2007). [DOI] [PMC free article] [PubMed] [Google Scholar]
- 14.Hannun YA, Obeid LM. Sphingolipids and their metabolism in physiology and disease. Nat. Rev. Mol. Cell. Biol. 19(3), 175–191 (2018). [DOI] [PMC free article] [PubMed] [Google Scholar]; •• Comprehensive review of sphingolipids and their metabolism.
- 15.Couttas TA, Kain N, Tran C, Chatterton Z, Kwok JB, Don AS. Age-dependent changes to sphingolipid balance in the human hippocampus are gender-specific and may sensitize to neurodegeneration. J. Alzheimers Dis. 63(2), 503–514 (2018). [DOI] [PubMed] [Google Scholar]
- 16.Ellis B, Hye A, Snowden SG. Metabolic modifications in human biofluids suggest the involvement of sphingolipid, antioxidant, and glutamate metabolism in Alzheimer’s disease pathogenesis. J. Alzheimers Dis. 46(2), 313–327 (2015). [DOI] [PubMed] [Google Scholar]
- 17.Futerman AH, Riezman H. The ins and outs of sphingolipid synthesis. Trends Cell Biol. 15(6), 312–318 (2005). [DOI] [PubMed] [Google Scholar]
- 18.Futerman AH. Intracellular trafficking of sphingolipids: relationship to biosynthesis. Biochim. Biophys. Acta 1758(12), 1885–1892 (2006). [DOI] [PubMed] [Google Scholar]
- 19.Huwilera A. Physiology and pathophysiology of sphingolipid metabolism and signaling. Biochim. Biophys. Acta 1485, 63–99 (2000). [DOI] [PubMed] [Google Scholar]
- 20.Stevens VL, Hoover E, Wang Y, Zanetti KA. Pre-analytical factors that affect metabolite stability in human urine, plasma, and serum: a review. Metabolites 9(8), 156 (2019). [DOI] [PMC free article] [PubMed] [Google Scholar]
- 21.Khadka M, Todor A, Maner-Smith KM et al. The effect of anticoagulants, temperature, and time on the human plasma metabolome and lipidome from healthy donors as determined by liquid chromatography-mass spectrometry. Biomolecules 9(5), 175 (2019). [DOI] [PMC free article] [PubMed] [Google Scholar]; • Anticoagulants effect for metabolomics and lipidomics.
- 22.Alshehry ZH, Barlow CK, Weir JM, Zhou Y, McConville MJ, Meikle PJ. An efficient single phase method for the extraction of plasma lipids. Metabolites 5(2), 389–403 (2015). [DOI] [PMC free article] [PubMed] [Google Scholar]; • Single-phase extraction for lipids.
- 23.Huynh K, Barlow CK, Jayawardana KS et al. High-throughput plasma lipidomics: detailed mapping of the associations with cardiometabolic risk factors. Cell Chem. Biol. 26(1), 71–84; e74 (2019). [DOI] [PubMed] [Google Scholar]
- 24.Ulmer CZ, Jones CM, Yost RA, Garrett TJ, Bowden JA. Optimization of Folch, Bligh-Dyer, and Matyash sample-to-extraction solvent ratios for human plasma-based lipidomics studies. Anal. Chim. Acta, 1037, 351–357 (2018). [DOI] [PMC free article] [PubMed] [Google Scholar]
- 25.Wong M, Braidy N, Pickford R, Sachdev P, Poljak A. Comparison of single phase and biphasic extraction protocols for lipidomic studies using human plasma. Front. Neurol. 10, 879 (2019). [DOI] [PMC free article] [PubMed] [Google Scholar]
- 26.Lydic TA, Busik JV, Reid GE. A monophasic extraction strategy for the simultaneous lipidome analysis of polar and nonpolar retina lipids. J. Lipid Res. 55(8), 1797–1809 (2014). [DOI] [PMC free article] [PubMed] [Google Scholar]
- 27.Kolde R. Pheatmap: pretty heatmaps. R Package Version 1(2) (2012). [Google Scholar]
- 28.Sullards MC, Liu Y, Chen Y, Merrill AH Jr. Analysis of mammalian sphingolipids by liquid chromatography tandem mass spectrometry (LC–MS/MS) and tissue imaging mass spectrometry (TIMS). Biochim. Biophys. Acta 1811(11), 838–853 (2011). [DOI] [PMC free article] [PubMed] [Google Scholar]
- 29.Sullards MC, Allegood JC, Kelly S et al. Structure-specific, quantitative methods for analysis of sphingolipids by liquid chromatography-tandem mass spectrometry: “inside-out” sphingolipidomics. Methods Enzymol. 432, 83–115 (2007). [DOI] [PubMed] [Google Scholar]; •• Detailed methodological consideration for sphingolipids quantification.
- 30.Peng B, Weintraub ST, Coman C et al. A comprehensive high-resolution targeted workflow for the deep profiling of sphingolipids. Anal. Chem. 89(22), 12480–12487 (2017). [DOI] [PubMed] [Google Scholar]
- 31.Quehenberger O, Armando AM, Brown AH et al. Lipidomics reveals a remarkable diversity of lipids in human plasma. J. Lipid Res. 51(11), 3299–3305 (2010). [DOI] [PMC free article] [PubMed] [Google Scholar]
- 32.Zhou W, Yang S, Wang PG. Matrix effects and application of matrix effect factor. Bioanalysis 9(23), 1839–1844 (2017). [DOI] [PubMed] [Google Scholar]
- 33.Hammad SM, Pierce JS, Soodavar F et al. Blood sphingolipidomics in healthy humans: impact of sample collection methodology. J. Lipid Res. 51(10), 3074–3087 (2010). [DOI] [PMC free article] [PubMed] [Google Scholar]
- 34.Brunkhorst R, Pfeilschifter W, Patyna S et al. Preanalytical biases in the measurement of human blood sphingolipids. Int. J. Mol. Sci. 19(5), 200 (2018). [DOI] [PMC free article] [PubMed] [Google Scholar]
- 35.Capiau S, Wilk LS, De Kesel PMM, Aalders MCG, Stove CP. Correction for the hematocrit bias in dried blood spot analysis using a nondestructive, single-wavelength reflectance-based hematocrit prediction method. Anal. Chem. 90(3), 1795–1804 (2018). [DOI] [PubMed] [Google Scholar]
- 36.Lamers Y, Prinz-Langenohl R, Brämswig S, Pietrzik K. Red blood cell folate concentrations increase more after supplementation with [6S]-5-methyltetrahydrofolate than with folic acid in women of childbearing age. Am. J. Clin. Nutr. 84(1), 156–161 (2006). [DOI] [PubMed] [Google Scholar]
- 37.Sato K, Katsumata Y, Aoki M et al. A new reagent for the rapid determination of total hemoglobin as hemiglobincyanide in blood containing carboxyhemoglobin. Biochem. Med. 30(1), 78–88 (1983). [DOI] [PubMed] [Google Scholar]
- 38.Huang Y, Khartulyari S, Morales ME et al. Quantification of key red blood cell folates from subjects with defined MTHFR 677C>T genotypes using stable isotope dilution liquid chromatography/mass spectrometry. Rapid Commun. Mass Spectrom. 22(16), 2403–2412 (2008). [DOI] [PMC free article] [PubMed] [Google Scholar]
- 39.Loef M, von Hegedus JH, Ghorasaini M et al. Reproducibility of targeted lipidome analyses (lipidyzer) in plasma and erythrocytes over a 6-week period. Metabolites 11(1), 200 (2020). [DOI] [PMC free article] [PubMed] [Google Scholar]
- 40.Kurz J, Parnham MJ, Geisslinger G, Schiffmann S. Ceramides as novel disease biomarkers. Trends Mol. Med. 25(1), 20–32 (2019). [DOI] [PubMed] [Google Scholar]
- 41.Tippetts TS, Holland WL, Summers SA. The ceramide ratio: a predictor of cardiometabolic risk. J. Lipid Res. 59(9), 1549–1550 (2018). [DOI] [PMC free article] [PubMed] [Google Scholar]
- 42.McGrath ER, Himali JJ, Xanthakis V et al. Circulating ceramide ratios and risk of vascular brain aging and dementia. Ann. Clin. Transl. Neurol. 7(2), 160–168 (2020). [DOI] [PMC free article] [PubMed] [Google Scholar]
- 43.Dupuis L, Chipeaux C, Bourdelier E et al. Effects of sphingolipids overload on red blood cell properties in Gaucher disease. J. Cell Mol. Med. 24(17), 9726–9736 (2020). [DOI] [PMC free article] [PubMed] [Google Scholar]


