Abstract
Background
Increased insulin production and secretion by pancreatic β-cells are important for ensuring the high insulin demand during gestation. However, the underlying mechanism of β-cell adaptation during gestation or gestational diabetes mellitus (GDM) remains unclear. Oxytocin is an important physiological hormone in gestation and delivery, and it also contributes to the maintenance of β-cell function. The aim of this study was to investigate the role of oxytocin in β-cell adaptation during pregnancy.
Methods
The relationship between the blood oxytocin level and pancreatic β-cell function in patients with GDM and healthy pregnant women was investigated. Gestating and non-gestating mice were used to evaluate the in vivo effect of oxytocin signal on β-cells during pregnancy. In vitro experiments were performed on INS-1 insulinoma cells.
Results
The blood oxytocin levels were lower in patients with GDM than in healthy pregnant women and were associated with impaired pancreatic β-cell function. Acute administration of oxytocin increased insulin secretion in both gestating and non-gestating mice. A 3-week oxytocin treatment promoted the proliferation of pancreatic β-cells and increased the β-cell mass in gestating but not non-gestating mice. Antagonism of oxytocin receptors by atosiban impaired insulin secretion and induced GDM in gestating but not non-gestating mice. Oxytocin enhanced glucose-stimulated insulin secretion, activated the mitogen-activated protein kinase pathway, and promoted cell proliferation in INS-1 cells.
Conclusions
These findings provide strong evidence that oxytocin is needed for β-cell adaptation during pregnancy to maintain β-cell function, and the lack of oxytocin could be associated with the risk of GDM.
Keywords: oxytocin, gestational diabetes mellitus, pancreatic β-cells, insulin secretion, proliferation
Introduction
During pregnancy, the increased energy demand for fetal growth leads to a higher glucose metabolic ratio (1). As a physiological adaptation, insulin secretion by pancreatic β-cells is increased, along with a compensatory expansion of pancreatic β-cell mass (1, 2). However, when this adaptation fails to meet the increased insulin demand, the blood glucose level increases in pregnant women and this can lead to the development of gestational diabetes mellitus (GDM) (3). GDM becomes an issue in as many as 5% of pregnancies worldwide and is one of the most common pregnancy complications (3, 4). Thus, the underlying mechanism that controls the compensatory expansion of pancreatic islets during pregnancy is worth investigating.
Pregnancy is associated with multiple protein factors and hormones, including oxytocin. Oxytocin is a 9-amino acid neuropeptide that is synthesized by hypothalamic oxytocin neurons and has well-known roles in parturition and lactation (5). Recent reports have shown that oxytocin also contributes to maternal and sexual behaviors, bone formation, and metabolism (6). Strong evidence now also supports a relationship between oxytocin and diabetes; for example, Kujath et al. found lower oxytocin levels in patients with type 1 diabetes (7). Patients with obesity and with newly diagnosed type 2 diabetes also show decreased circulating levels of oxytocin (8). This association of oxytocin with both pregnancy and diabetes (6) suggests a potential involvement of oxytocin in GDM, but this possible association has not been extensively studied. Stock et al. reported no alterations in oxytocin levels in women with GDM compared with normal pregnant women (9), but the limitations of the study population (only 12 women with GDM and 12 normal pregnant women in the third trimester) made it necessary to investigate whether the oxytocin level is truly associated with the development of GDM.
By contrast, the role of oxytocin in pancreatic islets is not questioned. Oxytocin modulates insulin and glucagon secretion in rodent islets (10), and it improves β-cell responsivity in healthy men exposed to a glucose challenge (11). Morphological evidence has also verified the expression of islet-derived oxytocin and oxytocin receptors in pancreatic β-cells (12, 13), suggesting that oxytocin signaling pathways may modulate β-cell functions and survival (13, 14). Therefore, elucidation of the oxytocin levels and their possible role in the adaption of β-cell functions during pregnancy is a meaningful and essential research endeavor.
The aim of the present study was to investigate whether oxytocin affects β-cell adaptation during pregnancy. The circulating blood oxytocin levels and the relationship between oxytocin levels and β-cell functions were analyzed in patients with GDM and pregnant non-GDM volunteers. The effects of oxytocin receptor agonism or antagonism were also studied in gestating mice. In vitro experiments were also performed to investigate the possible mechanism of oxytocin regulation of β-cell function and proliferation.
Materials and methods
Clinical characteristics
During 2018–2019, pregnant women aged 18–40 years who were diagnosed with GDM at the Shanghai First Maternity and Infant Health Hospital were enrolled in this study. Based on the guideline from ADA (15), pre-diabetes was diagnosed as a HbA1c of 5.7% to 6.5%, or a fasting plasma glucose (FPG) reading of 5.5 to 7.0 mM; diabetes was diagnosed as a HbA1c > 6.5% or FPG > 7.0 mM. All patients with GDM were newly diagnosed and had not undergone any anti-diabetic treatments. In this study, blood samples were collected during an oral glucose tolerance test (OGTT) at 24 to 28 weeks of gestation. Before OGTT, participants were fasted overnight (8–16 h), then blood samples were collected for the measurement of blood biochemical index. Additional fasting serum samples were collected to investigate the oxytocin, insulin, and c-peptide levels using commercial ELISA kits (Abcam). The results in ELISA assays were measured using a microplate reader (Flexstation 3, Molecular Devices, San Jose, CA, USA). For OGTT in pregnant women, 75 g glucose dissolved in water was orally administrated, and plasma glucose or serum c-peptide levels were measured at 0, 1, or 2 h after glucose loading.
Patients with secondary obesity and other diseases were excluded from this study. Ultimately, 50 patients with GDM and 59 healthy pregnant non-GDM volunteers were included in this study; their clinical characteristics are shown in Table 1. The study was approved by the Ethics Committee of Shanghai First Maternity and Infant Health Hospital. All participants signed informed written consent forms prior to participating in the study.
Table 1.
Clinical characteristics of non-GDM pregnant women and patients with GDM.
| Non-GDM (n = 59) | GDM (n = 50) | |
|---|---|---|
| Age (years) | 31.3 (5.7) | 31.6 (4.9) |
| BMI (kg/m2) | 23.5 (4.1) | 25.1 (6.2)* |
| Body fat ratio (%) | 38.2 (5.8) | 43.3 (7.1) |
| HbA1c (%) | 4.60 (0.42) | 5.73 (0.77)* |
| Fasting plasma glucose (FPG, mmol/L) | 4.73 (0.56) | 6.30 (0.74)* |
| 1 h glucose (mmol/L) during GTT | 7.73 (1.67) | 9.18 (2.39)* |
| 2 h glucose (mmol/L) during GTT | 5.62 (1.54) | 7.32 (1.24)* |
| Fasting serum insulin (FSI, mU/L) | 5.71 (2.33) | 11.86 (3.19)** |
| Fasting c-peptide (ng/mL) | 2.15 (0.83) | 2.79 (1.16) |
| 1 h c-peptide (ng/mL) during GTT | 9.54 (3.82) | 7.23 (2.67)* |
| 2 h c-peptide (ng/mL) during GTT | 4.38 (2.41) | 4.91 (2.37) |
| HOMA-IR | 0.86 (0.25) | 1.94 (0.66)* |
| HOMA-β (%) | 95.25 (13.72) | 43.77 (17.61)** |
| Systolic blood pressure (mmHg) | 123.5 (11.2) | 126.1 (14.5) |
| Diastolic blood pressure (mmHg) | 76.1 (8.7) | 79.3 (6.9) |
| Fasting triglyceride (mmol/L) | 1.96 (0.34) | 1.17 (0.28) |
| Fasting HDL (mmol/L) | 1.87 (0.36) | 1.57 (0.44) |
| Fasting LDL (mmol/L) | 2.79 (0.28) | 2.43 (0.22) |
Data were expressed as mean (s.d.). Mann–Whitney U-tests were performed to compare the difference between patients with gestational diabetes mellitus (GDM) and non-GDM pregnant women.
*P < 0.05, **P < 0.01.
GTT, glucose tolerance test; HDL, high density lipoprotein; HOMA-IR, homeostasis model assessment of insulin resistance; HOMA-β, homeostasis model assessment of pancreatic β-cells; LDL, low density lipoprotein.
Animal studies
All animal experiments were approved by the Animal Care and Ethics Committee of Shanghai First Maternity and Infant Health Hospital. Twelve-week-old male and female C57BL/6 mice were used in this study. The mice were freely supplied with a chow diet and water and were housed in a specific-pathogen-free (SPF) room following the standard operating procedure. After adaption for 7 days, the female mice and male mice were mated overnight and the pessary was examined to confirm pregnancy the next day.
Oxytocin, or atosiban, a synthetic peptide oxytocin antagonist (16), was dissolved in sterilized saline. The acute effects of oxytocin or atosiban on the GTT were tested in untreated gestating mice at 14 days of gestation and in non-gestating mice. After fasting for 12 h overnight, the mice were injected subcutaneously with 1 mg/kg oxytocin (17), or 1 mg/kg atosiban (17), or saline (0.9% NaCl, used as a vehicle) 30 min before glucose loading (Six groups, n = 8). The GTT was then initiated by an intraperitoneal injection of 2 g/kg glucose, as previously described (18). Briefly, the blood samples were collected from the tail vein at 0, 30, 60, 90, 120 min after glucose loading, then the blood glucose level was measured using a glucometer (ACCU-CHECK Active kit, Roche Diagnostics), the area under curve (AUC) of glucose level was drawn in each animal to compare the statistical difference. During GTT, extra blood samples were collected to measure the insulin concentration using a mouse insulin ELISA kit (Mercodia, Inc., Uppsala, Sweden).
For the chronic test, 1 mg/kg oxytocin or atosiban was subcutaneously injected daily (09:00 h) into the gestating mice for 3 weeks, beginning 7 days before mating. Non-gestating female mice of a similar age also received 1 mg/kg oxytocin or atosiban. Control non-gestating or gestating mice received saline vehicle injections (Six groups, n = 8). The body weights and FPG (6 h fasting) were measured weekly. At 14 days after mating (G14), the animals fasted for 6 h, and then 1 U/kg insulin was intraperitoneally injected for the insulin tolerance test (ITT) assay. The blood samples were collected from the tail vein at 0, 30, 60, 90, 120 min after insulin loading, the blood glucose level was measured, the AUC was drawn to compare the difference of insulin sensitivity among each group. For GTT, after receiving the last administration of drugs (G15), the animals were fasted for 12 h overnight and then dosed with 2 g/kg glucose for the GTT assay at G16, insulin secretion during GTT was also measured. The flow chart of the experimental groups and timeline in animal experiments were shown in Supplementary materials (see section on supplementary materials given at the end of this article).
Immunohistochemistry and immunofluorescence
After the GTT assay at G16, the animals in the chronic test were sacrificed and the pancreas was removed and fixed in 4% paraformaldehyde, then embedded in paraffin for making tissue sections. The immunohistochemistry and immunofluorescence evaluations were performed as previously described (19). The expression of oxytocin receptor (OXTR) in the islet endocrine cells was detected in the tissue sections from vehicle-treated gestation (G) and non-gestating (NG) female mice. Immunohistochemical staining using insulin antibody and double-immunofluorescent staining using insulin/Ki67 antibodies were performed in all six groups in the chronic test. The primary antibodies used were goat anti-oxytocin receptor (1:100, Santa Cruz Biotechnology), rabbit anti-insulin (1:1000, Abcam), rabbit anti-glucagon (1:100, Abcam), rat anti-somatostatin (1:100, Abcam), rabbit anti-pancreatic polypeptide (1:100, Abcam), and mouse anti-Ki67 (1:100, Santa Cruz Biotechnology) antibodies. For immunofluorescence, the secondary antibodies were Alexa Fluor 594 conjugated donkey anti-goat/mouse IgG and Alexa Fluor 488 conjugated donkey anti-rabbit/rat IgG (1:400, Invitrogen). The nuclei were stained with 4′,DAPI (Sigma–Aldrich). For immunohistochemical staining, the secondary antibody was HRP-conjugated goat anti-rabbit/mouse IgG followed by DAB staining using a commercial kit (MaxVisionTM HRP-Polymer anti-Rabbit IHC Kit, Maxim Biotechnologies, Fuzhou, China) following the manufacturer’s protocols.
For immunohistochemical and immunofluorescent staining, 1–3 adjacent paraffin sections of pancreas tissues from each animal were used to receive images with consistent quality. Images were taken using a DP70 microscope (Olympus) and analyzed using ImageJ software (NIH, Bethesda, MD, USA). Intra-islet expression of OXTR was calculated as the integral optical density (IOD) of OXTR-immunoreactive region per-islet adjusted by the area of each islet. All visible islets (at least five) on each pancreatic tissue section were analyzed, then the mean IOD value of intra-islet OXTR was calculated in each animal for statistical comparison (n = 8). Pancreatic β-cell mass was calculated as (total insulin-immunoreactive area/pancreas tissue area on paraffin section) × pancreas weight, this value was analyzed on pancreatic tissue sections from each animal in all six groups (n = 8). To evaluate β-cell proliferation, an islet with Ki67+/insulin+ cells was labeled as a Ki67-positive islet. The total Ki67-positive islet number on pancreatic tissue sections from each animal in all six groups was counted for statistical comparison (n = 8).
Islet isolation and qPCR
Two days after GTT (G16), the vehicle-treated NG and G mice in the acute test were used for islet isolation to compare the mRNA expression of Oxtr in the islets (n = 8). Islets were isolated as described previously (20). Briefly, the mice were anesthetized with chloral hydrate, and 1 mg/mL collagenase V (Sigma–Aldrich) was injected via the common bile duct into the mouse pancreas for further digestion. At least 200 islets could be received from each mouse. Total RNA was extracted from 50 islets (isolated from an independent animal) with Trizol (Invitrogen) and the RNA sample was reverse transcribed using a commercial kit (Takara). The qPCR procedure was performed using SYBR Green Kits in an ABI 7300 Sequence Detection System (Applied Biosystems). To calculate the relative expression of Oxtr in the islets from vehicle-treated NG and G mice, a delta CT method was used in this study. Primers for mouse cells were oxytocin receptor (Forward: 5′- GGACGTCAATGCGCCCAAAGAAG -3′; Reverse: 5′- ACTCGAGCTGCAACGACTCA -3′), and the housekeeping gene β-actin (Forward: 5′- GGCTGTATTCCCCTCCATCG -3′; Reverse: 5′- CCAGTTGGTAACAATGCCATGT -3′).
Cell culture, cell viability, EdU assays, and glucose-stimulated insulin secretion (GSIS) in vitro
Rat insulinoma INS1 cells were cultured in RPMI-1640 medium with 10% fetal bovine serum and 50 μM β-mercaptoethanol at 37°C (5% CO2, 95% air). After incubation with different compounds for 24 h, the cell viability was determined with the CCK8 assay (Dojindo Molecular Tech. Tokyo, Japan), following the manufacturer’s protocols. To evaluate cell proliferation, the EdU assay was conducted with a BeyoClickTM EdU-594 kit (Beyotime, Shanghai, China). The nuclei were stained with DAPI. Immunofluorescent photos were taken using a DP70 microscope (Olympus), and the proliferative ratio was calculated as EdU-positive cell number divided by total DAPI-staining cell number.
To investigate the effect of oxytocin signal on insulin secretion in vitro, INS-1 cells were plated into 24-well plates (50,000 cells per well). The culture medium was changed to HBSS without glucose for 1 h and pre-treated with different compounds (HBSS, without glucose) for 15 min. Then the medium was changed to 2.8 mM glucose dissolved in HBSS (with those different compounds) for 1 h, and the supernatant in each well was collected as low glucose-stimulated samples. Subsequently, the medium was changed to HBSS contained 16.8 mM glucose with different compounds, after another 1-h incubation, the supernatant was collected as high glucose-stimulated samples. The insulin concentration in low and high glucose-stimulated samples was measured by ELISA and adjusted by the DNA content of cells in each well. The insulin secretion function was calculated as fold (high glucose/low glucose) of increasing in insulin concentration (n = 5).
Western blot analysis
After the INS-1 cells were treated with different compounds for different time, the cells were lysed in radioimmunoprecipitation assay (RIPA) buffer (Beyotime), and the resulting protein lysates were subjected to Western blot analysis, as previously described (20). The following primary antibodies were obtained from Cell Signaling Technology: rabbit anti-CDK4 (1:1000), rabbit anti-cyclin D1 (1:1000), rabbit anti-tubulin (1:1000), rabbit anti-phosphorylated MEK (1:1000), rabbit anti-total MEK (1:1000), rabbit anti-phosphorylated ERK (1:1000), and rabbit anti-total ERK (1:1000). The secondary antibody was goat anti-rabbit IgG (1:10,000, Sigma–Aldrich). The images of blots were captured and analyzed on ChemiDoc XRS+ system (Bio-Rad). All blots were repeated at least for three times. The optical density (OD) of each band in blot was analyzed by ImageJ software (NIH).
Statistics
All data are expressed as mean ± s.d. Mann–Whitney U-tests were used for the analysis of the clinical data. Student's t-test was used to compare the difference between the two groups. Two-way ANOVA analysis was used in the other experiments to compare the differences among multiple groups. A value of P < 0.05 was considered statistically significant.
Results
Serum oxytocin level is correlated with β-cell function during gestation
We investigated the potential association between serum oxytocin level and β-cell function by comparing patients with GDM and non-GDM pregnant women. Table 1 shows the clinical characteristics of the patients with GDM and the non-GDM volunteers. The patients with GDM had higher fasting blood glucose and HbA1c levels, impaired glucose tolerance and β-cell function, and other multiple diabetic symptoms. Interestingly, at 36 weeks of pregnancy, the serum oxytocin levels were significantly lower in the patients with GDM (118 ± 32 pg/mL) than in the non-GDM pregnant women (137 ± 24 pg/mL) (Fig. 1A). Further correlation analyses confirmed a positive correlation between serum oxytocin levels and the levels of released glucose-stimulated c-peptide (Fig. 1B) and between the serum oxytocin levels and the HOMA-β index (Fig. 1C).
Figure 1.
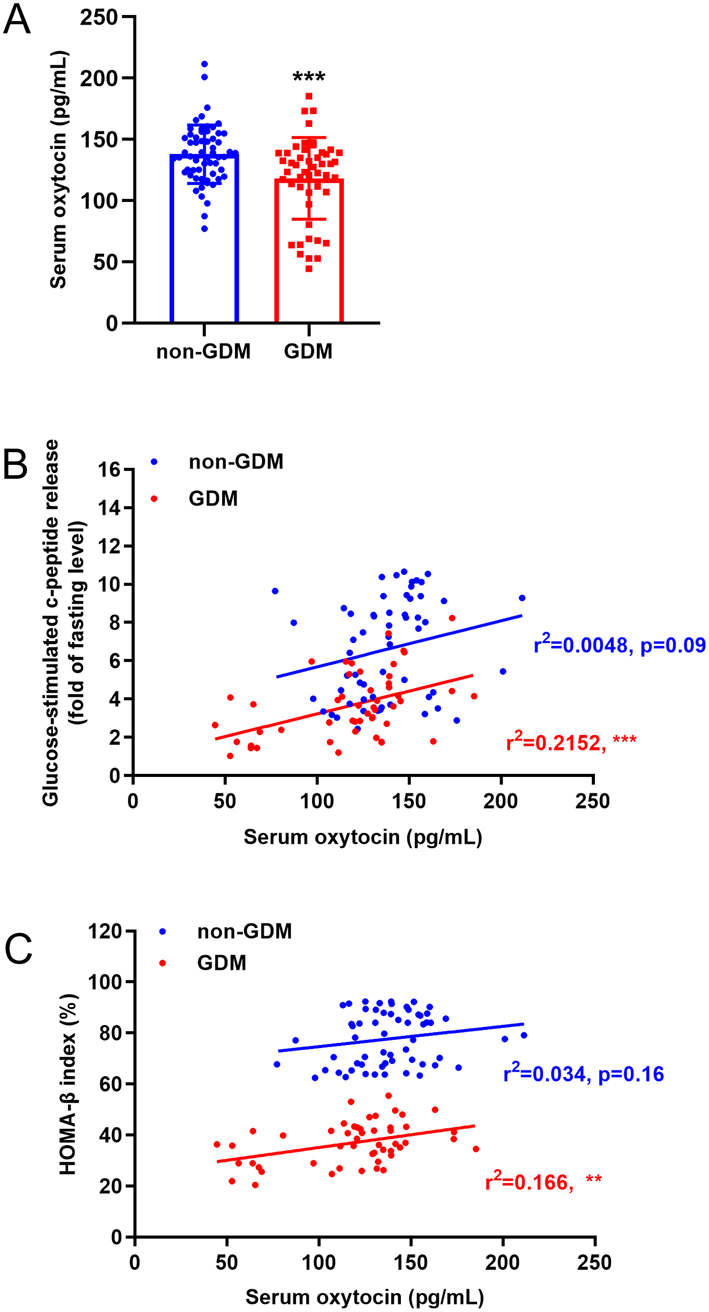
Decreased serum oxytocin levels are associated with β-cell dysfunction in patients with gestational diabetes mellitus (GDM). (A) Serum oxytocin level in patients with gestational diabetes mellitus (GDM, n = 50) and healthy pregnant women (non-GDM, n = 59), ***P < 0.001. (B) Correlation between glucose-stimulated c-peptide release and the serum oxytocin level in non-GDM and GDM women. ns, not significant; ***P < 0.001. (C) Correlation between HOMA-β index and the serum oxytocin level in non-GDM and GDM women. ns, not significant; **P < 0.01.
Expression of the oxytocin receptor is increased in pancreatic β-cells of gestating mice
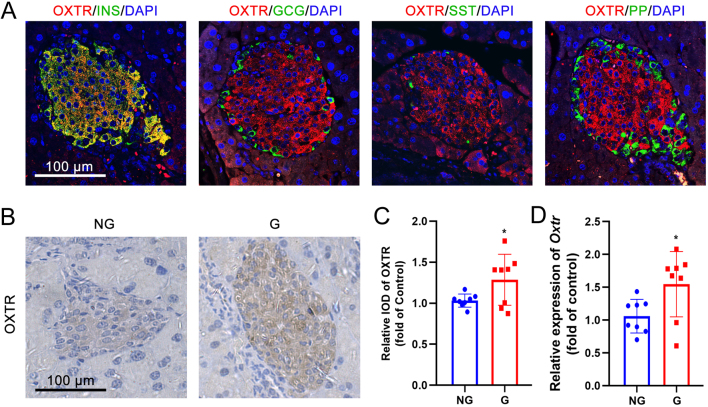
We investigated the expression of the oxytocin receptor in pancreatic islets from non-gestating and gestating mice. Double-immunofluorescence results showed that the oxytocin receptor is highly expressed in murine islets (Fig. 2A and B) and shows an overlap with insulin-positive β-cells, but less of an overlap with glucagon-positive, somatostatin-positive, and pancreatic polypeptide (PP)-positive α-, δ-, and PP-cells (Fig. 2A). Immunohistochemical staining revealed that the expression of the oxytocin receptor was higher in the islets from gestating mice than from non-gestating mice (Fig. 2B and C). In line with this result, the mRNA expression of oxytocin receptor was also higher in isolated islets from gestating mice than in non-gestating mice (Fig. 2D).
Figure 2.
The expression of the oxytocin receptor is increased in the islets of gestating mice. (A) Double-immunofluorescent staining of oxytocin receptor (OXTR) and insulin (INS), glucagon (GCG), somatostatin (SST), and pancreatic polypeptide (PP) in pancreatic islets from non-gestating mice. DAPI was used to stain the nucleus. Scale bar = 100 μm. (B) Immunohistochemical staining of pancreatic islets from non-gestating (NG) mice and gestating (G) mice using OXTR antibody. Scale bar = 100 μm. (C) The relative integral optical density (IOD) of OXTR immunostaining between NG and G mice, *P < 0.05, n = 8. (D) The mRNA expression of Oxtr in isolated islets from NG and G mice, *P < 0.05, n = 8.
Acute and chronic treatment of oxytocin both enhanced insulin secretion in gestating mice
The expression of the oxytocin receptor is increased in the islets during gestation; therefore, we tested the effect of exogenous oxytocin on the function of pancreatic β-cells in gestating mice. Acute administration of oxytocin 30 min before glucose loading reduced glucose tolerance in both non-gestating and gestating mice (Fig. 3A and B). Determination of glucose-stimulated insulin secretion suggested that an acute administration of oxytocin enhanced both the first and second phases of insulin secretion (Fig. 3C, D and E).
Figure 3.
The effect of acute oxytocin treatment on gestating mice. (A) Non-gestating (NG) mice and gestating (G) mice at 2 weeks of gestation received vehicle or oxytocin 30 min before glucose loading for a glucose tolerance test (GTT). Blood glucose levels were recorded. (B) The area under curve (AUC) of THE GTT in (A). *P < 0.05, ***P < 0.001 as indicated, n = 8. (C) Serum insulin concentrations were measured at different times before and after glucose loading during the GTT in (A). (D) The AUC of the first (1st) phase (0 to 10 min) of insulin secretion in (C). *P < 0.05, **P < 0.01 as indicated, n = 8. (E) The AUC of the second (2nd) phase (10 to 120 min) of insulin secretion in (C). *P < 0.05, ***P < 0.001 as indicated, n = 8.
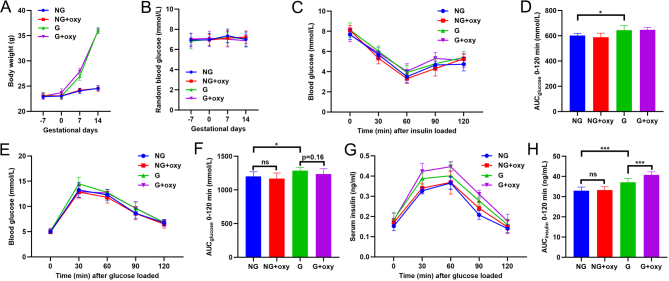
A 3-week chronic administration of oxytocin had minor effects on bodyweight (Fig. 4A) and random blood glucose measurements (Fig. 4B). At 2 weeks of gestation, an insulin tolerance test showed slight insulin resistance in the gestating mice but not in the non-gestating mice, but chronic oxytocin treatment did not alter insulin tolerance (Fig. 4C and D). A similar tendency was found with the glucose tolerance test. However, a 3-week oxytocin treatment slightly improved glucose tolerance although the difference was not statistically significant (Fig. 4E and F). The glucose tolerance test indicated that the 3-week oxytocin treatment caused a significant enhancement of insulin secretion in the gestating mice but not in the non-gestating mice (Fig. 4G and H).
Figure 4.
The effect of chronic oxytocin treatment on gestating mice. (A) Seven days before mating, vehicle and oxytocin were injected daily into NG and G mice for 3 weeks. Bodyweight was measured every week. (B) Seven days before mating, vehicle and oxytocin were injected daily in NG and G mice for 3 weeks. Random blood glucose was measured every week. (C) After a 3-week administration of vehicle or oxytocin, the insulin tolerance test (ITT) was performed in NG and G mice. (D) The AUC of ITT in (C). *P < 0.05 as indicated, n = 8. (E) After a 3-week administration of vehicle or oxytocin, the GTT was performed in NG and G mice. (F) The AUC of THE GTT in (E). ns, not significant; *P < 0.05 as indicated, n = 8. (G) During the GTT in (E), the serum insulin concentration was measured. (H) The AUC of insulin secretion in (G). ***P < 0.001 as indicated, n = 8.
Antagonism of the oxytocin receptor by atosiban impairs glucose tolerance and insulin secretion in gestating mice
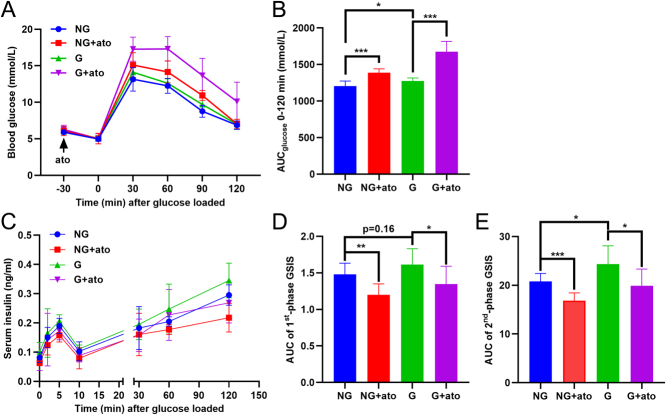
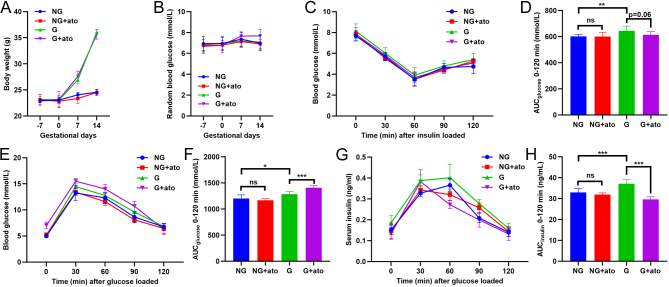
We investigated the effect of antagonism of the oxytocin receptor during gestation with atosiban, a specific inhibitor of the oxytocin receptor. Acute and chronic atosiban experiments revealed, as expected, that pre-treatment with atosiban increased glucose tolerance in both non-gestating mice and gestating mice (Fig. 5A and B). During the GTT, insulin secretion was also inhibited by the acute administration of atosiban (Fig. 5C,D and E). Chronic treatment of atosiban for 3 weeks, starting 7 days before mating, did not alter bodyweight (Fig. 6A) or the random blood glucose level (Fig. 6B) in non-gestating or gestating mice. Atosiban promoted a slight increase in insulin sensitivity in the gestating mice, although the effect was not statistically significant (Fig. 6C and D). Notably, chronic treatment with atosiban triggered glucose intolerance (Fig. 6E and F) and decreased the secretion of insulin during the GTT (Fig. 6G and H).
Figure 5.
The effect of acute atosiban treatment in gestating mice. (A) Non-gestating (NG) mice and gestating (G) mice at 2 weeks of gestation received vehicle or atosiban 30 min before glucose loading for the glucose tolerance test (GTT). Blood glucose levels were recorded. (B) The area under curve (AUC) of THE GTT in (A). *P < 0.05, ***P < 0.001 as indicated, n = 8. (C) Serum insulin concentrations were measured at different times before and after glucose loading during the GTT in (A). (D) The AUC of the first (1st) phase (0 to 10 min) of insulin secretion in (C). *P < 0.05, **P < 0.01 as indicated, n = 8. (E) The AUC of the second (2nd) phase (10 to 120 min) of insulin secretion in (C). *P < 0.05, ***P < 0.001 as indicated, n = 8.
Figure 6.
The effect of chronic atosiban treatment in gestating mice. (A) Vehicle or atosiban was injected daily in NG and G mice for 3 weeks, beginning 7 days before mating. Bodyweight was measured every week. (B) Vehicle and atosiban were injected daily in NG and G mice for 3 weeks, beginning 7 days before mating. Random blood glucose levels were measured every week. (C) After the 3-week administration of vehicle or atosiban, the insulin tolerance test (ITT) was performed in the NG and G mice. (D) The AUC of ITT in (C). ns,not significant; **P < 0.01 as indicated, n = 8. (E) After the 3-week administration of vehicle or atosiban, the GTT was performed in the NG and G mice. (F) The AUC of the GTT in (E). *P < 0.05, ***P < 0.001 as indicated,n = 8. (G) During the GTT in (E), the serum insulin concentration was measured. (H) The AUC of insulin secretion in (G). ***P < 0.001 as indicated, n = 8.
The oxytocin signal is associated with maternal islet expansion and β-cell proliferation
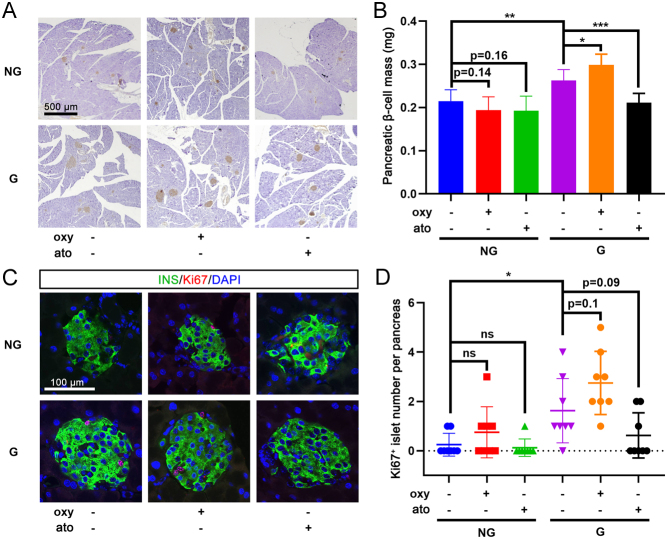
The effect of chronic treatment with oxytocin or atosiban on the morphology of islets was also investigated in gestating mice. Insulin immunostaining showed a greater β-cell mass in gestating mice than in non-gestating mice (Fig. 7A and B). No obvious difference was found in non-gestating mice treated with chronic exposure to oxytocin or atosiban; however, chronic treatment of gestating mice with oxytocin significantly promoted maternal islet expansion, while atosiban reduced this process (Fig. 7A and B). Double-immunofluorescence staining showed a higher Ki67+/insulin+ cell number in the islets of gestating mice than in non-gestating mice (Fig. 7C and D). Oxytocin also showed a tendency to increase the proliferative β-cell ratio in gestating mice, whereas atosiban inhibited β-cell replication in gestating mice; however, the differences did not reach statistical significance (Fig. 7C and D).
Figure 7.
Chronic oxytocin or atosiban treatment affects islet expansion and β-cell proliferation. (A) After a 3-week treatment with vehicle, oxytocin (oxy), or atosiban (ato) in non-gestating (NG) mice and gestating (G) mice, pancreatic tissue sections were immunohistochemically stained for insulin. Representative images are shown, scale bar = 500 μm. (B) The β-cell mass was analyzed in pancreatic tissue sections from each animal. *P < 0.05, **P < 0.01, ***P < 0.001 as indicated, n = 8. (C) Double immunofluorescence staining for insulin (INS) and Ki67 was performed in NG and G mice treated with chronic oxytocin or atosiban levels; DAPI was used to stain the nuclei. Representative images are shown, scale bar = 100 μm. (D) Islet with Ki67+/insulin+ cells was recorded as a Ki67-positive islet; the number of Ki67-positive islets in pancreatic tissue sections from each animal was counted. ns, not significant; *P < 0.05 as indicated, n = 8.
Oxytocin enhances pancreatic β-cell proliferation theactivation of the MAPK pathway
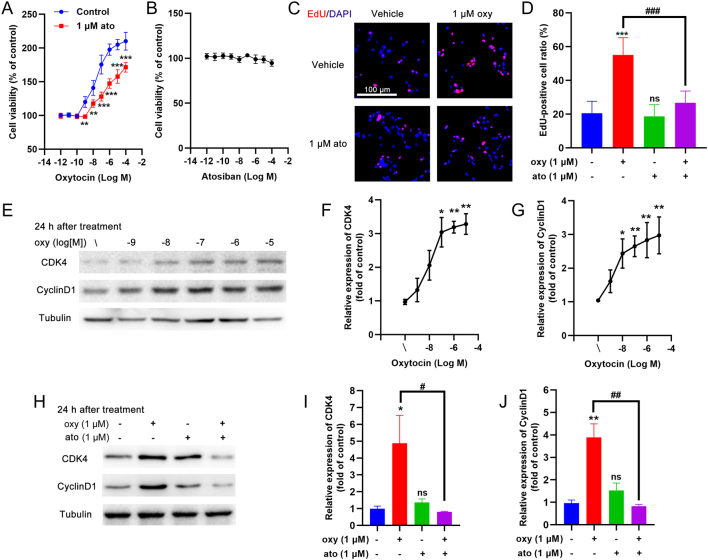
A 24 h treatment of the rat INS-1 insulinoma cell line with oxytocin revealed a dose-dependent increase in cell viability, while co-incubation with 1 μM atosiban inhibited this oxytocin-induced cell growth (Fig. 8A). Treatment with atosiban alone did not alter the cell viability of INS-1 cells (Fig. 8B). EdU staining showed that the oxytocin-induced increase in viability of INS-1 cells could be due to increased cell proliferation (Fig. 8C and D). Atosiban co-incubation abolished this oxytocin-induced cell proliferation (Fig. 8C and D). The expression of two proliferative protein markers, cyclin-dependent kinase 4 (CDK4) and cyclin D1, were both dose-dependently increased after a 24 h treatment with oxytocin (Fig. 8E,F and G). In contrast, co-incubation of the INS-1 cells with atosiban inhibited the increase in CDK4 and cyclin D1 expression (Fig. 8H,I and J).
Figure 8.
The effect of oxytocin on the proliferation of the INS-1 β-cell line. (A) INS-1 cells were treated for 24 h with different concentrations of oxytocin in the presence/absence of 1 μM atosiban and the cell viability was measured with the CCK8 assay. **P < 0.01, ***P < 0.001, n = 6. (B) INS-1 cells were treated for 24 h with different concentrations of atosiban and the cell viability was measured with the CCK8 assay. (C) INS-1 cells were treated for 24 h with 1 μM oxytocin in the presence/absence of 1 μM atosiban, then EdU assays were performed. Red stained nuclei indicate EdU-positive cells, all nuclei were stained with DAPI. Representative images are shown, scale bar = 100 μM. (D) Statistical analysis of (C). ns, not significant; ***P < 0.001 compared with control group; ###P < 0.001 as indicated, n = 10. (E) INS-1 cells were treated for 24 h with different concentrations of oxytocin and then cell lysates were subjected to Western blotting using CDK4 and cyclin D1 antibodies; tubulin was used as an internal reference. (F) The optical density (OD) of each band was measured; the ratio of CDK4/tubulin was calculated as the relative expression of CDK4, *P < 0.05, **P < 0.01 compared to the control group, n = 3. (G) The ratio of cyclin D1/tubulin was calculated as the relative expression of cyclin D1, *P < 0.05, **P < 0.01 compared to the control group, n = 3. (H) INS-1 cells were treated for 24 h with different concentrations of oxytocin in the presence/absence of 1 μM atosiban and then the cell lysates were subjected to Western blotting using CDK4 and cyclin D1 antibodies; tubulin was used as an internal reference. (I) The ratio of CDK4/tubulin was calculated as the relative expression of CDK4, *P < 0.05 compared to the control group, #P < 0.05 as indicated; ns, not significant, n = 3. (J) The ratio of cyclin D1/tubulin was calculated as the relative expression of cyclin D1, **P < 0.01 compared to the control group, ##P < 0.01 as indicated; ns, not significant, n = 3.
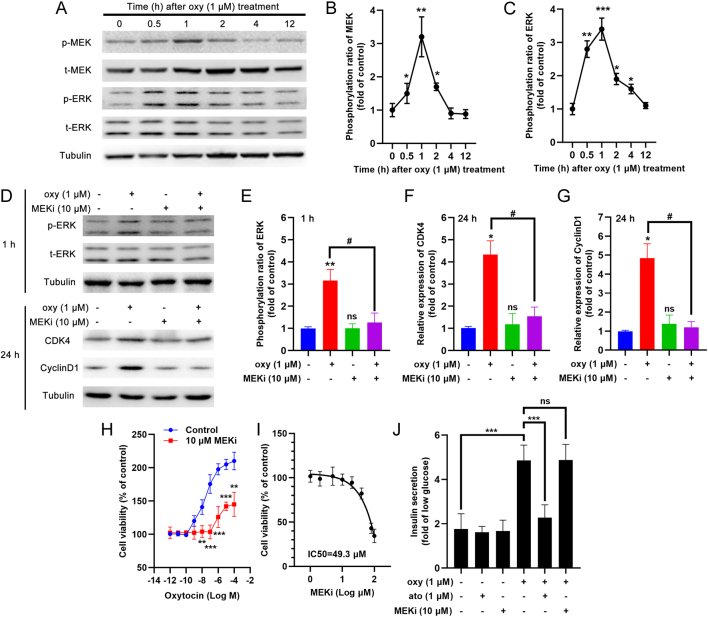
Western blots revealed that oxytocin treatment of INS-1 cells stimulated the phosphorylation of two mitogen-activated protein kinases (MAPKs), MEK and ERK, within 0.5 to 1 h (Fig. 9A,B and C). Co-treatment with a MEK inhibitor, PD98059, reduced ERK phosphorylation at 1 h after oxytocin administration (Fig. 9D and E). Prolongation of the treatment beyond 24 h resulted in a reduction in the expression of CDK4 and cyclin D1 by PD98059, similar to the effect of atosiban (Fig. 9D,F and G). In line with this result, 10 μM PD98059 (with no cell toxicity at this dosage) showed a similar inhibitory effect on the viability of oxytocin-treated INS-1 cells (Fig. 9H and I). We also noticed that co-treatment with atosiban, but not with PD98059, could inhibit oxytocin-stimulated acute insulin secretion by INS-1 cells (Fig. 9J).
Figure 9.
The effect of oxytocin on MAPK signal of the INS-1 β-cell line. (A) INS-1 cells were treated with 1 μM oxytocin for different times and the cell lysates were subjected to Western blotting using phosphorylated MEK (p-MEK), total MEK (t-MEK), phosphorylated ERK (p-ERK), and total ERK (t-ERK) antibodies; tubulin was used as an internal reference. (B) The optical density (OD) of each band was measured; the ratio of p-MEK/t-MEK was calculated and adjusted by the OD of tubulin, *P < 0.05, **P < 0.01 compared to the control group, n = 3. (C) The optical density (OD) of each band was measured; the ratio of p-ERK/t-ERK was calculated and adjusted by the OD of tubulin, *P < 0.05, **P < 0.01, ***P < 0.001 compared to the control group, n = 3. (D) INS-1 cells were treated for 1 h or 24 h with different concentrations of oxytocin in the presence/absence of 10 μM PD98059 (a MEK inhibitor, MEKi) and the cell lysates were subjected to Western blotting using p-ERK, t-ERK, CDK4, and cyclin D1 antibodies; tubulin was used as an internal reference. (E) The ratio of p-ERK/t-ERK was calculated and adjusted by the OD of tubulin; (F) The ratio of CDK4/tubulin was calculated as the relative expression of CDK4; (G) The ratio of cyclin D1/tubulin was calculated as the relative expression of cyclin D1, **P < 0.01, #P < 0.05 as indicated; ns, not significant; n = 3. (H) INS-1 cells were treated for 24 h with different concentrations of oxytocin in the presence/absence of 1 μM PD98059, and then the cell viability was measured with the CCK8 assay. **P < 0.01, ***P < 0.001, n = 6. (I) INS-1 cells were treated for 24 h with different concentrations of PD98059, and then the cell viability was measured with the CCK8 assay. IC50 = 49.3 μM. (J) INS-1 cells were pre-treated with different compounds for 15 min, then treated with low (2.8 mM) glucose (1 h) and high (16.8 mM) glucose (1 h) concentrations to trigger insulin secretion. The fold increase of insulin secretion in response to high glucose vs low glucose was calculated. ***P < 0.001, n = 5.
Discussion
Although the clinical use of oxytocin to improve uterine contractions in patients with GDM has been reported (6), whether the circulation level of oxytocin is associated with the development of GDM remains unclear. In this study, GDM patients with no other chronic disease, and especially metabolic disorders, were enrolled and analyzed. We found that the circulating levels of oxytocin were lower in patients with GDM than in healthy pregnant women, suggesting a relationship between circulating oxytocin levels and the development of GDM. This result differed from the findings of an earlier study by Stock et al (9). However, only 12 women with gestational diabetes and 12 normal pregnant women were enrolled in this earlier study to test the effect of 400 kcal breakfast meal challenge on oxytocin levels. Thus, although a larger study population is still needed, the present work has provided important evidence of a decreased level of oxytocin in patients with GDM. Our further analysis of this relationship revealed a significant positive correlation between oxytocin level and β-cell functions in patients with GDM.
Therefore, oxytocin may play an important role in the β-cell adaption process during pregnancy, and a lack of oxytocin in pregnant women could be one of the risk factors associated with the development of GDM. To confirm this speculation, we tested the effect of exogenous oxytocin and the antagonist of oxytocin receptors, atosiban, on glucose profiles in gestating mice. Several studies have previously reported that acute treatment with oxytocin can reduce plasma glucose levels and stimulate insulin secretion in animals and humans (11, 21, 22). A previous study revealed that the oxytocin receptor is present in islets by immunohistochemical staining (12). However, considering the complicated effect in the islet endocrine signal, the precise localization of oxytocin receptors with different islet endocrine cell types needs further investigation. Double-immunofluorescent staining showed that oxytocin receptor is co-localized with insulin-positive β-cells, but less in other islet endocrine cells, which is in line with a recent report (13). Therefore, acute treatment with oxytocin could certainly activate insulin secretion via oxytocin receptor agonism and the downstream signals in pancreatic β-cells. In line with these results, we found that acute oxytocin administration also improved glucose tolerance and insulin secretion, while atosiban blocked insulin secretion in gestating mice.
Chronic treatment with oxytocin can improve tolerance in animal models of obesity (22, 23, 24). In this study, although random blood glucose levels were not altered, a 3-week administration of oxytocin enhanced insulin secretion in gestating mice. This effect could be attributed to the increased β-cell mass and cell proliferation observed in oxytocin-treated gestating mice. The proliferative activity of oxytocin has been reported in multiple cells, like glial cells (25), corticotrophic adenomas (26), and periodontal stem cells (27). Importantly, Mohan et al. reported that oxytocin has a proliferative effect on pancreatic β-cells and protects against apoptosis in vitro (13). β-cell proliferation is important for islet expansion during pregnancy (28) therefore, oxytocin-induced β-cell proliferation could play a crucial role in this process.
Chronic treatment with atosiban, an oxytocin receptor antagonist (13), reduced the β-cell proliferation ratio, β-cell mass, glucose tolerance, and insulin secretion in gestating mice, but had much less effect in non-gestating mice. These results further suggested the importance of oxytocin signaling in islet expansion during pregnancy. During gestation, adaptive islet expansion relies on multiple proteins and hormones, like hepatic growth factor (HGF) (4), insulin-like growth factor (IGF) (4), platelet-derived growth factor (PDGF) (29), and adiponectin (28). Lack of these bioactive proteins and hormones could cause dysfunction of the adaptation of maternal β-cells during pregnancy and could be an important trigger for GDM (4). Our study has provided novel evidence that oxytocin is also crucial in this important physiological process. It should be noticed that unlike in humans, circulating levels of mouse oxytocin only increase in very late pregnancy (30), further investigation is important to reveal the effect of oxytocin on glucose homeostasis in pregnant mice. However, considered that exogenous oxytocin supplementary improves glucose profiles, inhibiting oxytocin signal by atosiban impairs insulin secretion and glucose tolerance in pregnant mice, oxytocin signal could play an important role in the β-cell adaptation during gestation in rodents.
A possible mechanism of oxytocin signaling related to adaptive islet expansion during pregnancy was also investigated in this study. As a typical G-protein coupled receptor (GPCR), the activated oxytocin receptor could increase intracellular calcium concentrations to enhance insulin secretion in pancreatic β-cells (13). The increased expression of the oxytocin receptor found in gestational islets could serve to enhance insulin secretion to meet the high glucose utilization ratio during pregnancy. In addition, the downstream kinase activated by this GPCR is important. Oxytocin can activate the MAPK pathway in multiple types of cells in a time-dependent and transient manner (31, 32, 33). We confirmed that oxytocin activation induced phosphorylation of the MEK/ERK signal in INS-1 cells peaked at 30–60 min after oxytocin treatment. Although the phosphorylation decreases over time, MAPK activation is believed to contribute to β-cell proliferation in INS-1 cell lines. Recently, Watanabe et al. reported that oxytocin receptor knockout mice have impaired MAPK signals in islets, and this leads to impaired insulin secretion and glucose intolerance (14). In line with this result, chronic antagonism of oxytocin signal by atosiban impaired islet adaptation and glucose tolerance in gestating mice, which could be attributed to the reduced acute oxytocin-enhanced insulin secretion and chronic cell proliferation via MAPK activation.
In summary, this study has provided strong evidence that oxytocin signaling is crucial for the adaptive islet expansion during pregnancy. Lack of oxytocin is associated with an increased risk of GDM, and this finding enhances the understanding of the pathological mechanism of GDM and suggests a possible diagnostic and therapeutic target for GDM.
Supplementary Material
Declaration of interest
The authors declare that there is no conflict of interest that could be perceived as prejudicing the impartiality of the research reported.
Funding
This work is supported by the Natural Science Research Program of Shanghai Municipal Commission of Health (20120154).
Author contribution statement
Conceived study: Q S, D S, Q W. Designed and performed experiments: P G, Y L. Data analysis and manuscript preparation: Q S. Results interpretation, manucript review and approval: All authors.
References
- 1.Lorenzo PI, Martin-Montalvo A, Cobo Vuilleumier N, Gauthier BR. Molecular modelling of islet beta-cell adaptation to inflammation in pregnancy and gestational diabetes mellitus. International Journal of Molecular Sciences 2019. 20 6171. ( 10.3390/ijms20246171) [DOI] [PMC free article] [PubMed] [Google Scholar]
- 2.Moon JH, Kim YG, Kim K, Osonoi S, Wang S, Saunders DC, Wang J, Yang K, Kim H, Lee J, et al. serotonin regulates adult beta-cell mass by stimulating perinatal beta-cell proliferation. Diabetes 2020. 69 205–214. ( 10.2337/db19-0546) [DOI] [PMC free article] [PubMed] [Google Scholar]
- 3.Hunt KJ, Schuller KL. The increasing prevalence of diabetes in pregnancy. Obstetrics and Gynecology Clinics of North America 2007. 34 173–99.( 10.1016/j.ogc.2007.03.002) [DOI] [PMC free article] [PubMed] [Google Scholar]
- 4.Ernst S, Demirci C, Valle S, Velazquez-Garcia S, Garcia-Ocana A. Mechanisms in the adaptation of maternal beta-cells during pregnancy. Diabetes Management 2011. 1 239–248. ( 10.2217/dmt.10.24) [DOI] [PMC free article] [PubMed] [Google Scholar]
- 5.Viero C, Shibuya I, Kitamura N, Verkhratsky A, Fujihara H, Katoh A, Ueta Y, Zingg HH, Chvatal A, Sykova E, et al. Review: Oxytocin: crossing the bridge between basic science and pharmacotherapy. CNS Neuroscience and Therapeutics 2010. 16 e138–e156. ( 10.1111/j.1755-5949.2010.00185.x) [DOI] [PMC free article] [PubMed] [Google Scholar]
- 6.Kontoangelos K, Papageorgiou CC, Raptis AE, Rabavilas AD, Papadimitriou GN. Oxytocin and diabetes mellitus: a strong biochemical relation: Review. Current Diabetes Reviews 2013. 9 450–461. ( 10.2174/15733998113096660079) [DOI] [PubMed] [Google Scholar]
- 7.Kujath AS, Quinn L, Elliott ME, Varady KA, LeCaire TJ, Carter CS, Danielson KK. Oxytocin levels are lower in premenopausal women with type 1 diabetes mellitus compared with matched controls. Diabetes/Metabolism Research and Reviews 2015. 31 102–112. ( 10.1002/dmrr.2577) [DOI] [PMC free article] [PubMed] [Google Scholar]
- 8.Qian W, Zhu T, Tang B, Yu S, Hu H, Sun W, Pan R, Wang J, Wang D, Yang L, et al. Decreased circulating levels of oxytocin in obesity and newly diagnosed type 2 diabetic patients. Journal of Clinical Endocrinology and Metabolism 2014. 99 4683–4689. ( 10.1210/jc.2014-2206) [DOI] [PubMed] [Google Scholar]
- 9.Stock S, Bremme K, Uvnas-Moberg K. Is oxytocin involved in the deterioration of glucose tolerance in gestational diabetes? Gynecologic and Obstetric Investigation 1993. 36 81–86. ( 10.1159/000292601) [DOI] [PubMed] [Google Scholar]
- 10.Gao ZY, Drews G, Henquin JC. Mechanisms of the stimulation of insulin release by oxytocin in normal mouse islets. Biochemical Journal 1991. 276 169–174. ( 10.1042/bj2760169) [DOI] [PMC free article] [PubMed] [Google Scholar]
- 11.Klement J, Ott V, Rapp K, Brede S, Piccinini F, Cobelli C, Lehnert H, Hallschmid M. Oxytocin improves beta-cell responsivity and glucose tolerance in healthy men. Diabetes 2017. 66 264–271. ( 10.2337/db16-0569) [DOI] [PubMed] [Google Scholar]
- 12.Suzuki M, Honda Y, Li MZ, Masuko S, Murata Y. The localization of oxytocin receptors in the islets of Langerhans in the rat pancreas. Regulatory Peptides 2013. 183 42–45. ( 10.1016/j.regpep.2013.03.019) [DOI] [PubMed] [Google Scholar]
- 13.Mohan S, Khan D, Moffett RC, Irwin N, Flatt PR. Oxytocin is present in islets and plays a role in beta-cell function and survival. Peptides 2018. 100 260–268. ( 10.1016/j.peptides.2017.12.019) [DOI] [PubMed] [Google Scholar]
- 14.Watanabe S, Wei FY, Matsunaga T, Matsunaga N, Kaitsuka T, Tomizawa K. Oxytocin protects against stress-induced cell death in murine pancreatic beta-cells. Scientific Reports 2016. 6 25185. ( 10.1038/srep25185) [DOI] [PMC free article] [PubMed] [Google Scholar]
- 15.Ibrahim M, Davies MJ, Ahmad E, Annabi FA, Eckel RH, Ba-Essa EM, El Sayed NA, Hess Fischl A, Houeiss P, Iraqi H, et al. Recommendations for management of diabetes during Ramadan: update 2020 applying the principles of the ADA/EASD consensus. BMJ Open Diabetes Research and Care 2020. 8 e001248. ( 10.1136/bmjdrc-2020-001248) [DOI] [PMC free article] [PubMed] [Google Scholar]
- 16.Wisniewski K.Design of oxytocin analogs. Methods in Molecular Biology 2019. 2001 235–271. ( 10.1007/978-1-4939-9504-2_11) [DOI] [PubMed] [Google Scholar]
- 17.Xu S, Qin B, Shi A, Zhao J, Guo X, Dong L. Oxytocin inhibited stress induced visceral hypersensitivity, enteric glial cells activation, and release of proinflammatory cytokines in maternal separated rats. European Journal of Pharmacology 2018. 818 578–584. ( 10.1016/j.ejphar.2017.11.018) [DOI] [PubMed] [Google Scholar]
- 18.Xiong J, Sun P, Wang Y, Hua X, Song W, Wang Y, Wu J, Yu W, Liu G, Chen L. Heterozygous deletion of seipin in islet beta cells of male mice has an impact on insulin synthesis and secretion through reduced PPARgamma expression. Diabetologia 2020. 63 338–350. ( 10.1007/s00125-019-05038-x) [DOI] [PubMed] [Google Scholar]
- 19.Xue J, Scotti E, Stoffel M. CDK8 regulates insulin secretion and mediates postnatal and stress-induced expression of neuropeptides in pancreatic beta cells. Cell Reports 2019. 28 2892–2904.e7. ( 10.1016/j.celrep.2019.08.025) [DOI] [PubMed] [Google Scholar]
- 20.Wang T, Sun P, Chen L, Huang Q, Chen K, Jia Q, Li Y, Wang H. Cinnamtannin D-1 protects pancreatic beta-cells from palmitic acid-induced apoptosis by attenuating oxidative stress. Journal of Agricultural and Food Chemistry 2014. 62 5038–5045. ( 10.1021/jf500387d) [DOI] [PubMed] [Google Scholar]
- 21.Maejima Y, Iwasaki Y, Yamahara Y, Kodaira M, Sedbazar U, Yada T. Peripheral oxytocin treatment ameliorates obesity by reducing food intake and visceral fat mass. Aging 2011. 3 1169–1177. ( 10.18632/aging.100408) [DOI] [PMC free article] [PubMed] [Google Scholar]
- 22.Plante E, Menaouar A, Danalache BA, Yip D, Broderick TL, Chiasson JL, Jankowski M, Gutkowska J. Oxytocin treatment prevents the cardiomyopathy observed in obese diabetic male db/db mice. Endocrinology 2015. 156 1416–1428. ( 10.1210/en.2014-1718) [DOI] [PubMed] [Google Scholar]
- 23.Deblon N, Veyrat-Durebex C, Bourgoin L, Caillon A, Bussier AL, Petrosino S, Piscitelli F, Legros JJ, Geenen V, Foti M, et al. Mechanisms of the anti-obesity effects of oxytocin in diet-induced obese rats. PLoS ONE 2011. 6 e25565. ( 10.1371/journal.pone.0025565) [DOI] [PMC free article] [PubMed] [Google Scholar]
- 24.Elabd SK, Sabry I, Mohasseb M, Algendy A. Oxytocin as a novel therapeutic option for type I diabetes and diabetic osteopathy. Endocrine Regulations 2014. 48 87–102. ( 10.4149/endo_2014_02_87) [DOI] [PubMed] [Google Scholar]
- 25.Alanazi MM, Havranek T, Bakos J, Cubeddu LX, Castejon AM. Cell proliferation and anti-oxidant effects of oxytocin and oxytocin receptors: role of extracellular signal-regulating kinase in astrocyte-like cells. Endocrine Regulations 2020. 54 172–182. ( 10.2478/enr-2020-0020) [DOI] [PubMed] [Google Scholar]
- 26.Lim JS, Eom YW, Lee ES, Kwon HJ, Kwon JY, Choi J, Chung CH, Jo YS, Lee EJ. Effects of oxytocin on cell proliferation in a corticotroph adenoma cell line. Endocrinology and Metabolism 2019. 34 302–313. ( 10.3803/EnM.2019.34.3.302) [DOI] [PMC free article] [PubMed] [Google Scholar]
- 27.Ge B, Liu H, Liang Q, Shang L, Wang T, Ge S. Oxytocin facilitates the proliferation, migration and osteogenic differentiation of human periodontal stem cells in vitro. Archives of Oral Biology 2019. 99 126–133. ( 10.1016/j.archoralbio.2019.01.007) [DOI] [PubMed] [Google Scholar]
- 28.Qiao L, Saget S, Lu C, Hay WW, Jr, Karsenty G, Shao J. Adiponectin promotes maternal beta-cell expansion through placental lactogen expression. Diabetes 2021. 70 132–142. ( 10.2337/db20-0471) [DOI] [PMC free article] [PubMed] [Google Scholar]
- 29.Shan Z, Xu C, Wang W, Li W. Enhanced PDGF signaling in gestational diabetes mellitus is involved in pancreatic beta-cell dysfunction. Biochemical and Biophysical Research Communications 2019. 516 402–407. ( 10.1016/j.bbrc.2019.06.048) [DOI] [PubMed] [Google Scholar]
- 30.Prevost M, Zelkowitz P, Tulandi T, Hayton B, Feeley N, Carter CS, Joseph L, Pournajafi-Nazarloo H, Yong Ping E, Abenhaim H, et al. Oxytocin in pregnancy and the postpartum: relations to labor and its management. Frontiers in Public Health 2014. 2 1. ( 10.3389/fpubh.2014.00001) [DOI] [PMC free article] [PubMed] [Google Scholar]
- 31.Rimoldi V, Reversi A, Taverna E, Rosa P, Francolini M, Cassoni P, Parenti M, Chini B. Oxytocin receptor elicits different EGFR/MAPK activation patterns depending on its localization in caveolin-1 enriched domains. Oncogene 2003. 22 6054–6060. ( 10.1038/sj.onc.1206612) [DOI] [PubMed] [Google Scholar]
- 32.Devost D, Wrzal P, Zingg HH. Oxytocin receptor signalling. Progress in Brain Research 2008. 170 167–176. ( 10.1016/S0079-6123(0800415-9) [DOI] [PubMed] [Google Scholar]
- 33.Jurek B, Neumann ID. The oxytocin receptor: from intracellular signaling to behavior. Physiological Reviews 2018. 98 1805–1908. ( 10.1152/physrev.00031.2017) [DOI] [PubMed] [Google Scholar]
Associated Data
This section collects any data citations, data availability statements, or supplementary materials included in this article.


 This work is licensed under a