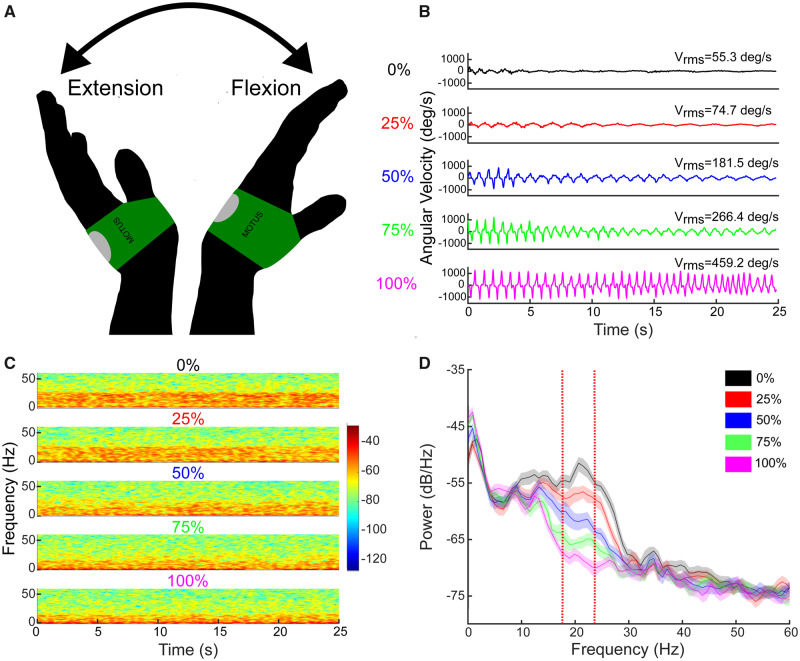
Figure 1.
Example of the effect of stimulation on behaviour and beta power. (A) Illustration of the repetitive wrist flexion-extension (rWFE) task with the Motus gyroscope attached to the dorsum of the hand. (B) Example of angular velocity traces during the rWFE task at each stimulation condition from a representative individual. (C) Spectrogram of STN LFPs during the rWFE task at each stimulation condition. The colour bar represents the power in dB/Hz. (D) PSD diagrams averaged across the rWFE for each stimulation condition. Vertical red lines identify the 6 Hz beta band of interest. Shading represents 95% confidence intervals.

